

Abstract
The developmental trajectory of the primate brain varies substantially with aging across subjects. However, this ubiquitous variability between individuals in brain structure is difficult to quantify and has thus essentially been ignored. Based on a large-scale structural magnetic resonance imaging dataset acquired from 162 cynomolgus macaques, we create a species-specific 3D template atlas of the macaque brain, and deploy normative modeling to characterize individual variations of cortical thickness (CT) and regional gray matter volume (GMV). We observed an overall decrease in total GMV and mean CT, and an increase in white matter volume from juvenile to early adult. Specifically, CT and regional GMV were greater in prefrontal and temporal cortices relative to early unimodal areas. Age-dependent trajectories of thickness and volume for each cortical region revealed an increase in the medial temporal lobe, and decreases in all other regions. A low percentage of highly individualized deviations of CT and GMV were identified (0.0021%, 0.0043%, respectively, P < 0.05, false discovery rate [FDR]-corrected). Our approach provides a natural framework to parse individual neuroanatomical differences for use as a reference standard in macaque brain research, potentially enabling inferences regarding the degree to which behavioral or symptomatic variables map onto brain structure in future disease studies.
Keywords: normative model, individual differences, brain atlas, cortical thickness, cynomolgus macaque
Introduction
Nonhuman primates have been widely employed to model a variety of neurological and psychiatric conditions in humans thanks to their phylogenetic, social behavioral, and central nervous system developmental proximity (Capitanio and Emborg 2008). Recent progress in gene editing methods and stem cell technology, coupled with successes in germline transmission of transgenes and cloning techniques in macaque monkeys (Yang et al. 2008; Sasaki et al. 2009; Liu et al. 2016; Chen et al. 2017; Liu et al. 2019; Qiu et al. 2019), has raised tantalizing hopes and expectations in boosting our understanding of physiological functions that are unique to primates and developing treatments for human diseases (Belmonte Juan Carlos et al. 2015; Jennings et al. 2016; Zhan et al. 2020). Despite these advances and forthcoming potential, however, the massive adoption of primate disease models seems unlikely to be imminent, considering that the first report of transgenic monkeys was nearly 2 decades ago (Chan et al. 2001). In addition to foreseeable challenges, including long generation time of primate species, long-term stable investment, and the paucity of resources for expert and fast knowledge, the experimental creation of transgenic primates usually produces a relatively limited number of subjects, which poses a new challenge for the research paradigm of group comparison. A small sample size accompanied by nontrivial individual variability and poor statistical power severely jeopardizes accurate interpretation of the results obtained from case-control designs that neglect interindividual differences and focus on group differences. This strategy essentially describes a group-averaged patient and hence refrains from mapping the heterogeneous disease phenotype at the level of the individual (Foulkes and Blakemore 2018; Seghier and Price 2018), even though case-control designs have overwhelmingly dominated basic and clinical research settings thus far. Therefore, characterizing individual structural and functional variations in the primate brain becomes an important prerequisite to integrally investigate monkey models of human diseases, which lays the foundation for establishing a new framework toward precision medicine.
The normative model has recently emerged as a promising pathway toward understanding the biological variation of brain disorders in humans (Wolfers et al. 2018; Zabihi et al. 2018; Wolfers et al. 2019), allowing for the detection and mapping of both structural and functional abnormalities individually. Unlike the case-control design which assumes that patient and control groups are distinct entities, the normative model can be understood as a statistical analysis that characterizes demographic or behavioral variables to a quantitative brain readout. Similar to the growth chart used in pediatric medicine, in which a child’s height is compared with the normative distribution for height at a particular age, a normative model of the monkey brain can be utilized to quantify neuroanatomical heterogeneity within the population distribution of macaque monkeys so that deviations can be reliably evaluated. In doing so, a large healthy sample for whom high-quality data are available is required because an alteration in an individual monkey is considered an extreme value within this distribution. To date, there exists a very limited number of studies based on a large number of participants (McLaren et al. 2009; Frey et al. 2011; Rohlfing et al. 2012; Seidlitz et al. 2018) so that no such normative model of macaque monkeys including rhesus and cynomolgus macaques is available.
In this study, we described a high-resolution magnetic resonance imaging (MRI) dataset from a large cohort of cynomolgus macaques and constructed a new population-based in vivo brain template for cynomolgus macaques using a validated template-creation process (Avants et al. 2010; Seidlitz et al. 2018). Meanwhile, we created tissue probability maps and regional label maps based on the D99 parcellation scheme (Reveley et al. 2017). In addition, we provided a 3D printed template as an example application for guiding stereotactic operations. As an independent validation, we compared the anatomical details of selected sections of the MRI atlas with histological maps. With this relatively large healthy population, we applied a normative modeling approach to estimate the age-related trajectory of brain structure and to predict thickness and volume variations for individuals. Thus, we statistically quantify and cross-validate deviations in individual cynomolgus monkeys that parse interindividual heterogeneity within the present population ranging from juveniles to young adults.
Materials and Methods
Animal Preparation
Nonhuman primate data were acquired through separate studies covered by animal research protocols approved by relevant Institutional Animal Care and Use committees. A total of 162 cynomolgus macaques (Macaca fascicularis) underwent MR scanning at the Institute of Neuroscience (n = 29) and Kunming Institute of Zoology (n = 133), Chinese Academy of Sciences. These monkeys were juveniles, adolescents, and young adults with age ranging between 2 and 9 years at the time of data acquisition (3.5 ± 1.8 years, 72 females and 90 males).
A complete description of experimental details can be found in our previous studies (Wang et al. 2013; Lv et al. 2016; Zhang et al. 2019; Cai et al. 2020) and is briefly summarized here. Before each MRI scanning session, anesthesia of the animals was inducted with an intramuscular injection of ketamine (10 mg/kg) and atropine sulfate (0.05 mg/kg) and maintained with the lowest possible concentration of isoflurane (ranged 0.8–1.5%). Local anesthetic (5% lidocaine cream) was applied around the ears to block peripheral nerve stimulation. The anesthetized animals were placed in a custom-built MRI-compatible stereotaxic frame before being inserted into the center of the scanner bore. For monkeys scanned at the Kunming Institute of Zoology, anesthesia was maintained with pentobarbital sodium (10–16 mg/kg).
MRI Acquisition
MRI data from the Institute of Neuroscience were acquired on a Siemens Tim Trio 3T scanner (Erlangen, Germany) running with an enhanced gradient coil insert (AC88; 80 mT/m maximum gradient strength, 800 mT/m/s maximum slew rate). A custom-made 8-channel phased-array transceiver coil was used. High-resolution T1-weighted anatomical images were acquired using an MPRAGE sequence (TR = 2300 ms; TE = 3 ms; inversion time = 1000 ms; flip angle = 9°; acquisition voxel size = 0.5 × 0.5 × 0.5 mm3). Five to 7 whole-brain anatomical volumes were acquired and subsequently averaged for high signal-to-noise ratio. MRI data from the Kunming Institute of Zoology were acquired on a United Imaging UMR 790 3T scanner (Shanghai, China) using a 12-channel knee coil. High-resolution T1-weighted anatomical images were recorded with the same setting as the data acquired at the Institute of Neuroscience. Five to 7 sets of whole-brain images were acquired.
SMI-32 Immunohistofluorescence and Microscopy
To validate anatomical details shown in the present MRI-based brain template, we conducted a histological analysis of 1 adult male monkey brain (7 kg). The animal was deeply anesthetized with an overdose of ketamine (30 mg/kg) and perfused transcardially with cold 0.9% NaCl (pH = 7.4), followed by cold 4% paraformaldehyde in 0.01 M phosphate buffered saline (PBS). The removed brain was postfixed for 3 days in the same fixative solution and dehydrated sequentially in 15% and 30% sucrose for over 1 week. Coronal and tangential brain slices (50 μm) were sectioned with a freezing microtome (Leica CM1950, Germany).
The primary antibody used for immunohistofluorescence was anti-SMI-32 antibody (1:200, cat# 801701, Biolegend), which was used to visualize neuronal cell bodies, dendrites, and thick axons. Slices were incubated in a blocking solution (PBS, 5% BSA, and 0.3% Triton X-100) at room temperature for 2 h and then incubated overnight with primary antibody (PBS, 3% BSA, and 0.3% Triton X-100) at 4°C. After triple washes in PBS, secondary antibodies were applied for 3 h at room temperature (Secondary antibody, Goat anti-Mouse IgG, Alexa Fluor 594 [1: 500], cat# A11032, Thermo Fisher Scientific). Images of slices were acquired on a high throughput microscope (Olympus VS120, Olympus, Japan) with a U Plan Super Apo ×10 objective (N.A. = 0.4) at a resolution of 0.65 μm/pixel.
Template Creation
The main steps for the template creation process including tissue segmentation and surface generation are shown in Figure 1. For each animal, the first acquired T1-weighted image was selected as a reference and the remaining images from that animal were aligned to it and then averaged to obtain the motion-corrected images using FMRIB’s Linear Image Registration Tool in FMRIB Software Library (FSL) (http://www.fmrib.ox.ac.uk/fsl/) (Jenkinson et al. 2002) (Fig. 1A). We applied intensity bias correction for field inhomogeneity to each motion-corrected image using CMTK’s (http://nitrc.org/projects/cmtk/) mrbias tool (Likar et al. 2001) (Fig. 1A). All images were then resampled from 0.5 to 0.25 mm isotropic resolution, aligned to 1 monkey using a rigid-body transformation, and averaged to form the initial target image (Fig. 1B). Whole-head images were used to prevent the introduction of any artificial brain-skull boundaries and ultimately provide a more accurate template. In order to create an optimal population-averaged template that is unbiased toward any specific individual and does not require user input, we used a symmetric group-wise normalization template building algorithm provided by ANTs software (http://stnava.github.io/ANTs/) (Avants et al. 2010; Avants et al. 2011; Love et al. 2016; Seidlitz et al. 2018) (Fig. 1B). The final template was at 0.25 mm isotropic resolution. The whole-head template was skull-stripped combining automated (FSL Brain Extraction Tool [BET]) and manual skull-stripping methods to obtain the brain-only template (Fig. 1B). The origin (x = 0, y = 0, z = 0 mm) of the template was set at the center of the anterior commissure, with the center of the posterior commissure lying on the same axial plane as the anterior commissure (z = 0 plane) (Fig. S1). The longitudinal fissure was aligned in the midsagittal plane (x = 0 plane). Images are stored in “RAS” orientation, where x-coordinates increase from left to right direction, y-coordinates increase from posterior to anterior direction, and z-coordinates from inferior to superior. In order to label this cynomolgus template, we warped the D99 template brain (Saleem and Logothetis 2006; Reveley et al. 2017) to the current template space using a symmetric normalization (SyN) algorithm (Avants et al. 2008) in ANTs, then applied the diffeomorphic transformation to the digital parcellation map (Fig. 1B).
Figure 1.
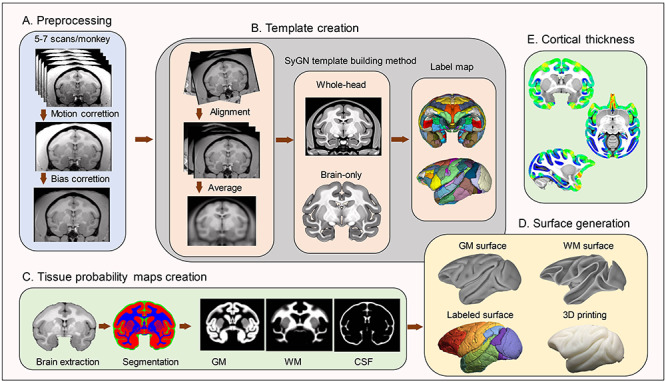
Pipeline of the cynomolgus monkey template creation. (A) Preprocessing. T1-weighted images of the brain were collected from 162 cynomolgus monkeys. A set of 5–7 MRI volumes were obtained from each subject. All images were aligned and subject to motion correction, intensity bias correction before being averaged within 1 subject. (B) Template creation. A symmetric group-wise normalization template building algorithm was applied to the preprocessed images to obtain the whole-head template. The whole-head template was then skull-stripped manually to obtain the brain-only template. The D99 digital parcellation was warped to the current template space for cortical labeling. (C) Generating tissue probability maps. The skull-stripped T1-weighted images were segmented, reformatted, and averaged to obtain tissue probability maps. (D) Surface generation. The segmented GM and WM masks and the reformatted parcellations of the label map were used to create the surface files. 3D-printed GM surface is also presented. (E) Cortical thickness. Cortical thickness of the present template was calculated for next-step analysis.
Tissue probability maps represent the probability that a voxel belongs to a given tissue class, either gray matter (GM), white matter (WM), or cerebrospinal fluid (CSF). Brain masks were created using BET tool in FSL, then manually edited to obtain improved skull-stripped brains. For each animal, its bias-field corrected and manually skull-stripped T1-weighted image was segmented into 3 tissue compartments (CSF; GM; WM) using FMRIB’s Automated Segmentation Tool within FSL (Zhang et al. 2001). The segmentation maps were then projected to the current template space using the SyN algorithm and then averaged to obtain the final maps (Fig. 1C). In addition, the tissue probability map of GM of each animal was used to calculate the regional GM volume (GMV). Each GM map was registered to the current template space and then modulated to preserve the regional volumetric information of GM within a voxel. This was done by multiplying the intensity value of each voxel in the segmented images by the Jacobian determinants (nonlinear components only) that were derived from the spatial registration process. Afterwards, images were smoothed with a 2-mm isotropic Gaussian kernel.
The template GM and WM surfaces were generated from the corresponding GM and WM segmentation maps (thresholded and manually edited) using AFNI’s IsoSurface program (https://afni.nimh.nih.gov/afni/) (Cox 1996) and viewed within SUMA software packages (https://afni.nimh.nih.gov/suma/) (Saad and Reynolds 2012) (Fig. 1D). The GM surface was converted to a Standard Tessellation Language file, which is compatible with many software controllers for 3D printers using 3D slicer (https://www.slicer.org/) (Fedorov et al. 2012). Here we 3D-printed the GM surface of the template using A9 3D printer (JG AURORA; http://www.jgew3d.com/). To assess the morphological variability across all monkeys, we calculate the mean positional difference (MPD) image (Frey et al. 2011; Calabrese et al. 2015; Seidlitz et al. 2018) by averaging the mean diffeomorphic warp vector fields outputted during the template creation process. The MPD represents the average distance that each voxel from each monkey brain had to be warped in order to match corresponding locations in the average brain.
Cortical Thickness Estimation
The CT of each subject was estimated using the diffeomorphic registration-based cortical thickness (DiReCT) method implemented in ANTs (Das et al. 2009), which exploits tissue probabilistic maps to identify a maximum likelihood correspondence between the WM surface and the outer GM surface. DiReCT is a reliable volume-based technique for estimating voxel- and regional-wise thickness information, which yields similar results to using surface-based algorithms (Tustison et al. 2014).
Age Trajectory of Normative Structural Variations
The tissue volumes of GM, WM, and CSF (corrected for individual brain size) were calculated from the corresponding partial volume maps. The total brain volume was calculated by summing up these 3 partial volume maps in the native space. The mean CT of the whole brain was estimated by averaging the voxel-wise CT across the brain. We then developed a normative model by training a Gaussian process regression (GPR) (Rasmussen and Williams 2006) on our cynomolgus macaque cohort aged 2–8 years (one 9-year-old monkey was excluded from this analysis) and used age as a covariate to predict brain measures (Marquand et al. 2016; Wolfers et al. 2018). Briefly, GPR is a Bayesian nonparametric interpolation method that yields coherent measures of predictive confidence in addition to point estimates (Rasmussen and Williams 2006). This normative model can be used to predict CT or volume and associated predictive uncertainty for each subject. The contours of predictive uncertainty can then be used to model centiles of variation within the cohort. The effect of sex on brain structure was regressed out of the input data. Furthermore, we conducted a leave-one-out cross-validation (LOOCV) procedure for the training process to make predictions for that unseen individual. The performance on unseen data samples was assessed using Pearson’s correlation between the measured and predicted values of biological measures (P < 0.05, false discovery rate [FDR]-corrected) and the normalized mean squared error (NMSE). The NMSE was defined as the mean squared error divided by the variance in the response variables (Marquand et al. 2016; Scheinost et al. 2019). The relationships between different structural measures were explored using Pearson’s correlation analysis (P < 0.05, FDR-corrected).
For each subject, the mean CT and GMV of each cortical brain region were extracted from the normalized voxel-based CT map and GMV map and mapped onto the surface. The cortical label was adopted from the D99 parcellation map which defined 146 cortical regions for each hemisphere. We constructed normative models of CT and regional GMV for each brain region using GPR, which was further used to predict the unseen data samples by LOOCV (P < 0.05, FDR-corrected). We then partitioned the cortex into developmental modules consisting of brain regions that showed synchronized maturational change according to the annual rate of thickness or volume change. Six developmental modules were identified: monotonically linear decrease/increase, monotonically nonlinear decrease/increase, and nonmonotonic net decrease/increase.
Estimating Regional Deviations for Each Subject
Using the normative modeling approach, each subject can be placed within the normative range, thus allowing for the characterization of differences between individuals in relation to the healthy range. Individual differences in CT and GMV at each brain region were evaluated by adopting a region-specific Z-score (Marquand et al. 2016; Wolfers et al. 2018), which was defined as the measured structure of each cortical region in each subject minus the prediction divided by the square root of the pooled variance (the predicted variance and the variance estimated from the population distribution). This provides a statistical estimate of how much individuals deviate from the healthy regime at each region. For each subject, a subject-level Z-score map was derived which quantifies the deviations of structure across the whole brain. A statistical threshold for individual deviation maps was determined at |Z| > 3.3 (i.e., P < 0.001), and hence extreme deviations from the normative model were defined correspondingly. At the single subject level, the FDR was applied for correction of multiple comparisons and a corrected threshold P < 0.05 was considered to be statistically significant.
To estimate the regional deviation for each subject, all extreme deviations were combined into a score which represented the percentage of extremely deviated regions for each subject, expressed relative to the total number of regions ([the number of deviating regions/the total number of cortical regions] × 100% for each individual). To measure the extent of deviations spatially, we created individualized maps and calculated the region-wise overlap among subjects. To construct a subject-level atypicality score, we estimated a summary score for each participant capturing the individual’s largest deviation from the typical pattern using extreme value statistics (Marquand et al. 2016; Zabihi et al. 2018). We employed extreme value statistics to summarize the degree of abnormality by estimating a maximum deviation (mean of 1% top Z-scores) for each subject and fitted an extreme value distribution to these deviations to make probabilistic subject-level inferences.
Results
The Cynomolgus Macaque Template
Examples of axial slices from the present cynomolgus macaque template are shown in Figure 2A, together with the tissue probability maps and the tissue segmentation for GM, WM, and CSF (Fig. 2B–E), the parcellation label map (Fig. 2F), the cortical thickness map (Fig. 2G), the MPD map (Fig. 2H). Note that structures located in the center of the brain displayed the least amount of displacement across subjects and structures located in orbital and ventrolateral prefrontal cortex, temporal pole, and portions of occipital cortex had relatively larger displacement (Fig. 2H). As a validation for the MRI-based brain template, Figure 3 shows a cynomolgus macaque brain that underwent histological staining for SMI-32. Both Figure 3A (a coronal slice of MRI template) and Figure 3B (histological image) clearly delineate some thalamic subnulcei (e.g., ventrolateral nucleus and medial dorsal nucleus), subthalamus (e.g., subthalamic nucleus and zona incerta), red nucleus, and components of the basal ganglia (e.g., caudate and putamen, globus pallidus). The GM and WM surface maps of both hemispheres that were reconstructed from the manually edited tissue classification masks are shown in Figure 4A and B. These surface maps were painted with the D99 labels (Fig. 4C) and photographed after 3D printing (Fig. 4D). The present cynomolgus macaque template is available both at a secure server of the Laboratory of Brain Imaging, Institute of Neuroscience and at the PRIMatE Data Exchange (Milham et al. 2018). http://fcon_1000.projects.nitrc.org/indi/indiPRIME.html.
Figure 2.
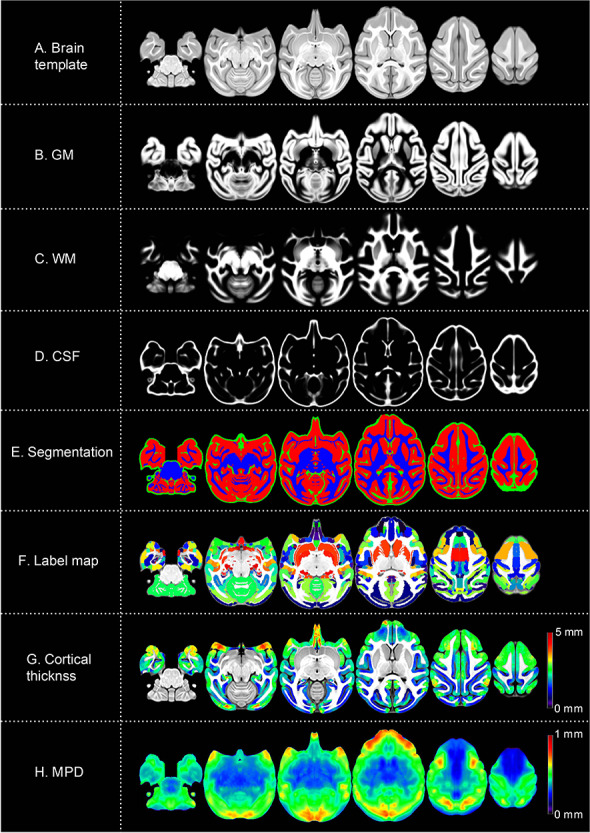
The cynomolgus monkey template. Axial slices showing the brain template (A) and tissue probability maps for GM, WM, and CSF (B–D) and tissue segmentation (GM, red; WM, blue; CSF, green) (E). Nonlinear alignment was applied to the D99 digital anatomical atlas to propagate labels into the present template (F). Cortical thickness map is overlaid on the T1 template (G). Deformation vector fields were calculated for all the monkey brains and averaged to form the MPD image (H). The color scale represents the level of displacement. Warm color indicates larger voxel displacement. Note that structures located in the center of the brain display the least amount of displacement.
Figure 3.
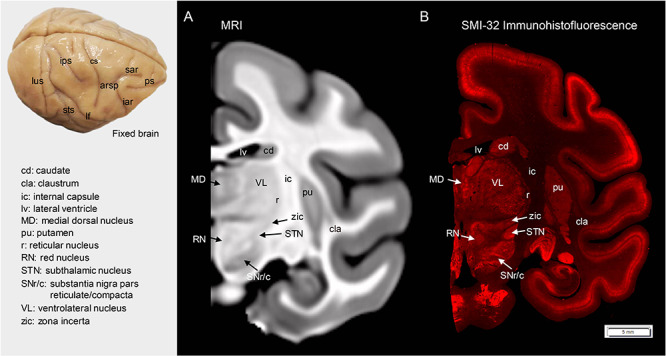
Comparison between the MRI template and the corresponding histological map. A coronal slice with delineated subcortical areas in the MRI volume (A) and corresponding histological section (B). A histological map was generated from the SMI-32 stained section. Note that the labeled subregions, thalamic nuclei, and other subcortical structures, such as subthalamic nucleus, zona incerta, and red nucleus are evident in the current MRI template. The anatomical labeling of sulci is depicted on the brain surface. Arsp, arcuate sulcus spur; cs, central sulcus; iar, inferior arcuate sulcus; lf, lateral fissure; lus, lunate sulcus; ps, principal sulcus; sar, superior arcuate sulcus; sts, superior temporal sulcus.
Figure 4.
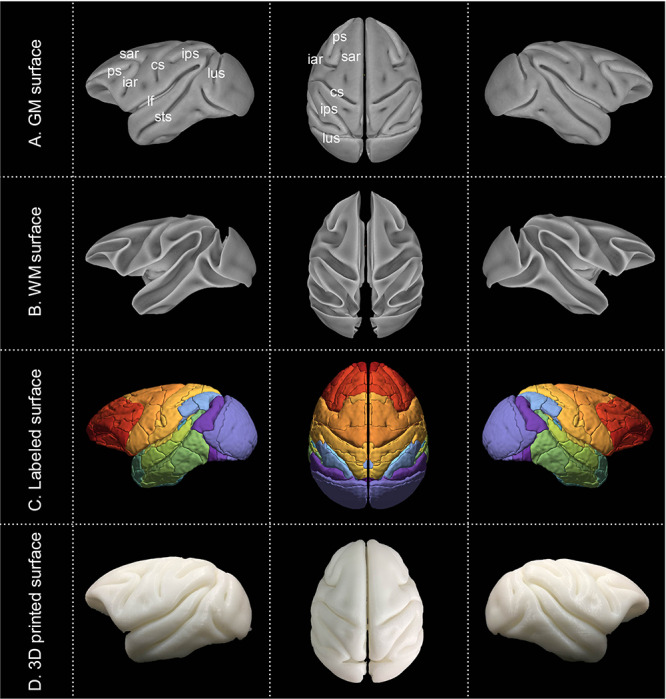
Cortical surfaces and 3D printing. GM and WM surfaces were reconstructed from segmentations of the template (A–B). These surface maps were painted with D99 labels (C) and photographed after 3D printing (D).
Age Trajectory of Normative Structural Variations
We observed that the mean CT of the whole brain and the total GMV decreased nonlinearly and monotonically within the present age range, whereas WM volume (WMV) increased throughout the juvenile and adolescence periods and then declined at early adulthood (Fig. 5A). The total brain volume increased gradually with age. Notable correlations were found between measured and predicted values in CT, GMV and WMV (P < 0.0001, r = 0.83, 0.83, 0.75, NMSE = 0.45, 0.48, 0.63, respectively), but not for total brain volume (P = 0.071, r = 0.23, NMSE = 1.03). CT exhibited a significant positive correlation with total GMV (P < 0.0001, r = 0.87), a significant negative correlation with total WMV (P < 0.0001, r = −0.64), but no apparent association with total brain volume (P = 0.095, r = −0.13, Fig. S2). Additionally, total brain volume showed significant correlations with total WMV (P < 0.0001, r = 0.41) and total GMV (P < 0.0001, r = −0.31). There was a significant negative correlation between total GMV and total WMV (P < 0.0001, r = −0.83).
Figure 5.
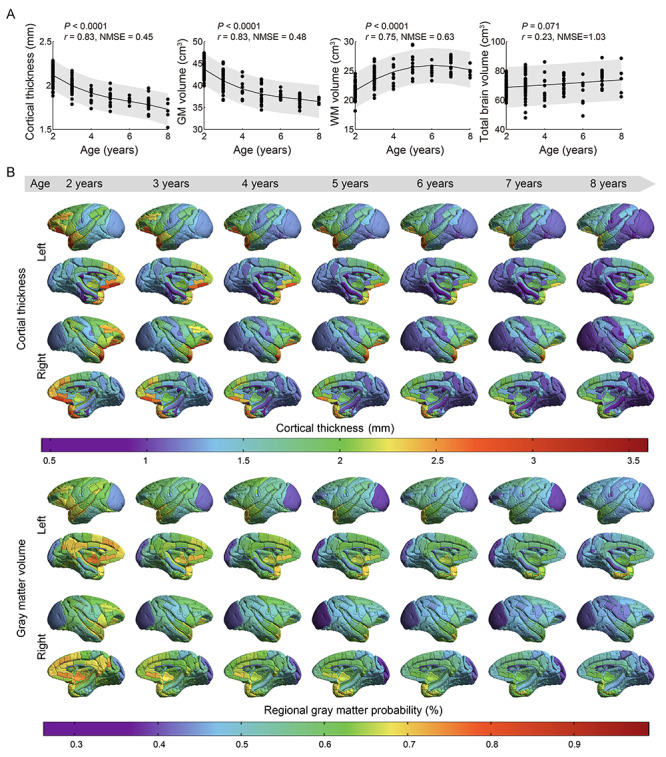
Age trajectories and spatial distribution of cortical volume and thickness. (A) Both the total GMV and mean CT show monotonic decreasing trajectories from age 2 to 8 years, whereas the total WMV presents an inverted U-shape increasing trajectory throughout the juvenile and adolescence periods followed by a decline in early adulthood (NMSE = 0.45, 0.48, 0.63, respectively; Pearson’s correlation, P < 0.0001, r = 0.83, 0.83, 0.75, respectively, P < 0.05, FDR-corrected). The total brain volume exhibits a modest, gradual increase trend (NMSE = 1.03; Pearson’s correlation, P = 0.071, r = 0.23, P < 0.05, FDR-corrected). Shaded bands indicate 95% prediction intervals. (B) Spatial distribution of CT and regional GMV across the whole brain at different ages. CT and regional GMV show overall decreases within this age range. The temporal pole, medial frontal and other prefrontal cortices have greater thickness and regional GMV than the sensory, visual, and limbic cortices at all developmental stages.
The mean CT and regional GMV of each brain region are shown on the brain template (Fig. 5B). Both exhibited a remarkably heterogeneous pattern. For instance, the somatosensory, occipital, and cingulate cortices had smaller thickness relative to other regions throughout the developmental stage, whereas the medial frontal, and other prefrontal cortices, and temporal pole had larger thickness (Fig. 5B). Similarly, greater regional GMV was found in the prefrontal and temporal cortices relative to the somatosensory, occipital, and cingulate cortices (Fig. 5B). In typical development, communities of cortical areas with similar growth trajectories of CT and regional GMV are discernible across the brain (Figs. 6A and S3–S6). As for CT, 6 developmental modules were derived, including modules of monotonically linear decrease/increase (cyan/orange color), monotonically nonlinear decrease/increase (blue/red color), and nonmonotonic net decrease/increase (green/pink color); but as for regional GMV, 5 modules were derived, with no module of monotonically linear increase was found (orange color). Growth trajectories of CT and regional GMV in brain regions located in the medial temporal cortex (including parahippocampal, entorhinal, and perirhinal cortices) increased with advancing age (modules with warm color). For most cortical regions, the growth trajectories of CT and regional GMV decreased over the observed age range (Figs. 6A and S3–S6). Figure 6B shows the region-wise normative models of CT and regional GMV change for each module, including 14c (area 14c), entorhinal cortex, caudal limiting division, entorhinal cortex, olfactory division, agranular frontal area F3, supplementary motor area, rostral superior temporal gyrus, area TF of the parahippocampal cortex. Normative models of CT and regional GMV changes of all cortical regions are shown (Figs. S3–S6). Accuracy of the normative model for predicting thickness and volume was mapped on the cortical surface both in terms of correlation and NMSE (Fig. S7). Brain regions with no significant correlation between measured and predicted values and high NMSE (>1) are shown in Tables S1–S2.
Figure 6.
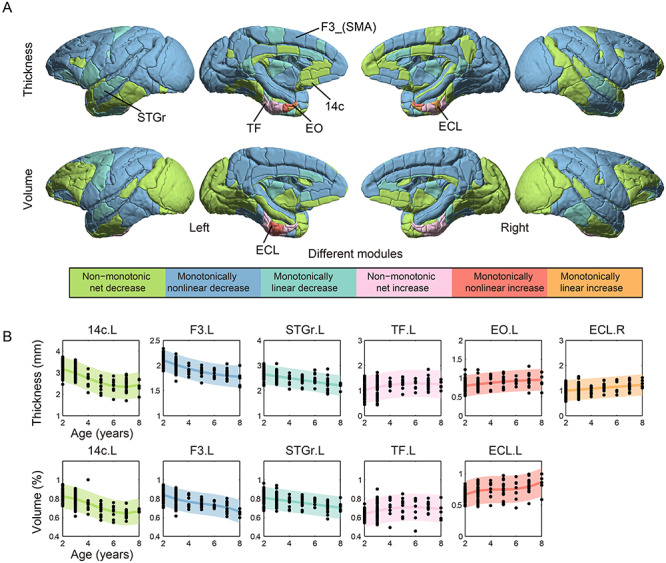
Developmental modules of synchronized thickness and volume change. (A) Modules composed of regions with similar maturational trajectories for CT and regional GMV during the juvenile period, adolescence, and early adulthood. Six normative developmental modules are identified by the annual rate of thickness or volume change: monotonically linear decrease/increase (cyan/orange), monotonically nonlinear decrease/increase (blue/red), and nonmonotonic net decrease/increase (green/pink). Growth trajectories of CT and regional GMV decrease linearly and nonlinearly with advancing age in most cortical regions, except that the medial temporal cortex (including parahippocampal, entorhinal, and perirhinal cortices), increase over time. (B) Typical regional-wise normative models of CT and regional GMV changes are shown for each module, including 14c (area 14c), ECL (entorhinal cortex, caudal limiting division), EO (entorhinal cortex, olfactory division), F3_SMA (agranular frontal area F3, supplementary motor area), STGr (rostral superior temporal gyrus), TF (area TF of the parahippocampal cortex). The module of monotonically linear increase (orange color) was not found in the developmental trajectory of GMV (Fig. S6). Brain regions with no significant correlation between measured and predicted values and high NMSE are shown in Figure S7 and Tables S1, S2. Color-coded shaded areas indicate 95% prediction intervals. L, left; R, right.
Individual Deviations Estimated from the Normative Model
We estimated regional deviations from the normative models of CT and regional GMV for each subject, respectively. The overall percentage of deviating regions was extremely low in this healthy cohort (For CT, uncorrected mean score, 0.011%, |Z| > 3.3, P < 0.001; FDR-corrected mean score, 0.0021%, |Z| > 4, P < 0.05; For GM, uncorrected mean score, 0.013%, |Z| > 3.3, P < 0.001; FDR-corrected mean score, 0.0043%, |Z| > 4, P < 0.05, Fig. 7A). Six individuals had a total of 5 deviations in CT (cold color), including 8 Bd (area 8B, dorsal subdivision), 8Bm (area 8B, medial subdivision), 24b (area 24b in the anterior cingulate cortex), 31 (area 31 in the posterior cingulate cortex), TGvg (ventral granular part of the temporal pole), and 6 deviations in GMV (warm color), including 8 Bd, 8Bm, 9d (area 9, dorsal subdivision), 10mr (area 10 m), 10mc (area 10c), CM (caudomedial, belt region of the auditory cortex), 3 of which survived FDR correction (area 31, 8 Bd, 8Bm, marked with asterisk in Fig. 7A). Virtually all deviations of CT or GMV were unique and highly individualized for different subjects, with no overlap (Figs. 7B). Figure 7C shows the distribution of the most extreme deviations in CT and GMV (mean of 1% of the top absolute deviations for each subject) from their normative models for individual monkeys, respectively.
Figure 7.
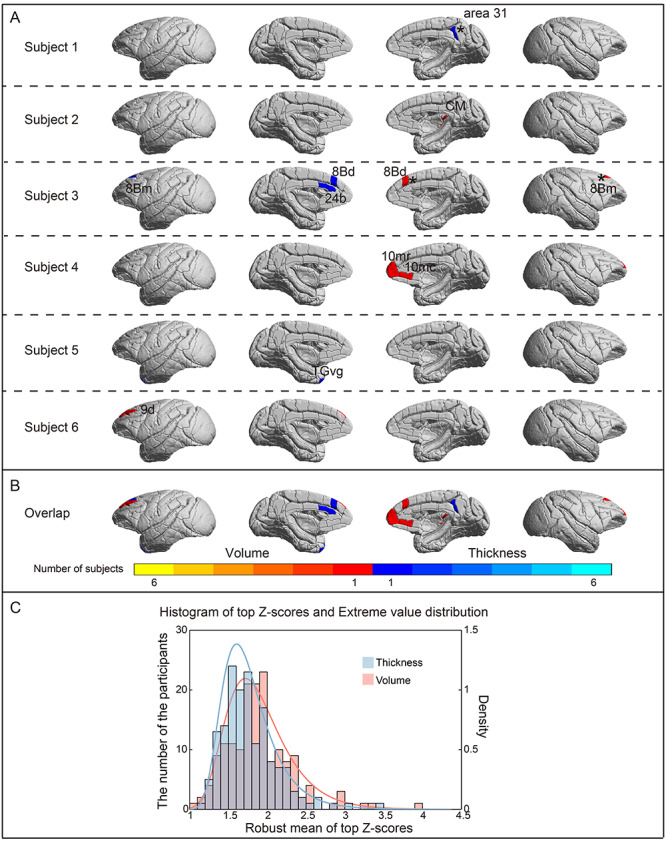
Individual deviations from the normative model. (A) Subject-level Z-score maps showing brain regions that deviate from the normative model in CT (blue color) and regional GMV (red color) (color: |Z| > 3.3, P < 0.001, uncorrected; black star: |Z| > 4, P < 0.05, FDR-corrected). The deviating regions in these subjects were different and widespread in prefrontal, temporal, and cingulate cortices, including 8 Bd (area 8B, dorsal subdivision), 8Bm (area 8B, medial subdivision), 9d (area 9, dorsal subdivision), 10mr (area 10 m), 10mc (area 10c), 24b (area 24b in the anterior cingulate cortex), 31 (area 31 in the posterior cingulate cortex), CM, TGvg. The CT of right area 31, and left TGvg and the GMV of right CM have greater values than would be predicted by the normative model and the CT of left 8Bm, 8 Bd, 24b and the GMV of right 8 Bd, 8Bm, 10mr, 10mc, and left 9d have reduced values relative to ones predicted by the normative model. (B) Region overlap of individual deviations in the monkey cohort. There was no overlap of deviating brain regions between any 2 subjects. The color bar represents the number of deviating subjects. (C) Extreme value histogram and extreme value distribution of CT and volume.
Discussion
A population-Based Brain Atlas for Cynomolgus Macaque
We present a large-population MRI atlas of the cynomolgus macaque brain, derived from 162 high-resolution, T1-weighted structural scans of cynomolgus monkeys ranging from 2 to 9 years old. The template comprises both whole-head and brain-only unbiased template images, tissue probability maps, a deformation map, as well as cortical surfaces with 3D printed examples, and brain parcellation (label) maps (Figs. 2–4). As compared with the histological maps revealed by SMI-32 immunohistofluorescence (Fig. 3), fine neuroanatomical details are well demonstrated in the present MRI template. This atlas provides a common anatomical space and coordinate system for the cynomolgus monkey for conducting voxel-based analyses, segmenting brain tissues, delineating specific brain locations, and visualizing data collected across days, animals, and laboratories, which can be used with existing packages such as Statistical Parametric Mapping (SPM; https://www.fil.ion.ucl.ac.uk/spm/) and FSL. Moreover, it can help to improve the registration accuracy of individual subjects to the present template and to accurately locate brain areas when making an experimental plan for electrophysiological penetration, anatomical tracer injection or surgical lesions.
There are currently a number of rhesus macaque atlases available, either based on a single animal, e.g., the 3D digital D99 template (Reveley et al. 2017) and the F99 atlas (Van Essen 2004), or multiple subjects, e.g., the 112RM-SL (McLaren et al. 2009), the INIA19 (Rohlfing et al. 2012), the MNI institute (Frey et al. 2011) and the NMT template (Seidlitz et al. 2018). Differences, although subtle, in the brain structures of different macaque species have been reported (Van Der Gucht et al. 2006; McLaren et al. 2009); for instance, cynomolgus and rhesus macaques exhibit differences in skull shape (Frey et al. 2011), global brain volume (McLaren et al. 2009), and sulcal patterns (Van Der Gucht et al. 2006). Evidence from human imaging studies suggests that the accuracy of volumetric image registration benefits significantly from using spatial normalization to templates that closely match the average of the population under study (Shen et al. 2007). Thus, it is expected that future nonhuman primate studies would benefit from species-specific brain atlases given non-negligible interspecies variability. Meanwhile, single-subject templates reflect the idiosyncratic anatomy of an individual, rather than the species as a whole (Reveley et al. 2017; Seidlitz et al. 2018), whereas the population-averaged atlas preserves features that are typical of the population’s brain anatomy to accommodate cross-subject variability, substantially minimize artifacts, and improve signal-to-noise. Hence the creation of a population-averaged atlas does not bias the registration procedure toward the shape of any 1 subject, instead resulting in better alignment across many individuals (Woods 1996) and facilitating further quantitative analysis.
Age-Related Effects on Brain Structure in Cynomolgus Macaque
Different structural components of the brain (GM, WM volume, and CT) have markedly distinct developmental trajectories during the early years of life in primate species, which is critically important for understanding their mechanistic roles in both normal and diseased conditions. Both longitudinal and cross-sectional structural MRI studies in humans have shown that the total GMV (Lebel and Beaulieu 2011; Mills et al. 2016) and mean CT (Tamnes et al. 2017; Walhovd et al. 2017) appear to decline throughout adolescence and young adulthood, even though the ages of peak global GMV and mean CT are different. The total WMV, on the other hand, followed a more stable growth with increasing age, as is compatible with previous findings in human studies (Giedd et al. 1999; Lebel and Beaulieu 2011; Mills et al. 2016). In rhesus macaques, prior longitudinal MRI studies have found that the GMV decreased on average (Liu et al. 2015; Ball and Seal 2019) and WMV increased (Malkova et al. 2006; Liu et al. 2015; Ball and Seal 2019) during late infancy and the juvenile period. Longitudinal studies in the marmoset found that GMV increased before puberty and declined into adulthood (Sawiak et al. 2018). With the present normative analysis, we observed that the brain development of the cynomolgus macaque parallels that of humans and rhesus macaques by exhibiting a decrease in total GMV and mean CT, and an increase in total WMV throughout the juvenile period and adolescence (Fig. 5A).
Moreover, the developmental trajectories of CT and regional GMV changes in this cohort showed region-specific variations over the entire cortex (Figs. 5 and 6 and S3–S6), consistent with previous reports in both rhesus macaque and humans studies (Mueller et al. 2013; Xu et al. 2019). Because the structural data before the juvenile period were not included here, the current analysis did not examine the onset of declines (peak volume or thickness). In addition, CT and GMV of the cynomolgus monkeys exhibited region-specific variations, whereby high-order multimodal association areas (prefrontal and temporal cortices) had greater CT and regional GMV than the unimodal sensory, visual, and limbic areas (Fig. 5B). These patterns closely followed the patterns in myelin maps (T1/T2 maps) (Glasser and Van Essen 2011) and surface area expansion in human postnatal development and primate evolution (Hill et al. 2010). This supports the prior hypothesis that the primary and early unimodal areas are more heavily myelinated and less expanded than multimodal association areas (Hill et al. 2010; Glasser and Van Essen 2011). The developmental patterns of CT and GMV observed here may reflect neuronal regressive events, such as pruning and the elimination of connections, whereas a gradual increase in WMV until approximately young adulthood has been suggested as an indication of ongoing myelination of axons by oligodendrocytes which facilitate neuronal conduction and communication.
Nevertheless, the developmental patterns of the total WMV, GMV, and mean CT changes were found to be highly correlated (Fig. S2). The strong negative correlation between WM and GM changes could result from different physiological processes such as axonal wiring in WM and pruning in GM (Stepanyants et al. 2002), similarly reported in a cross-sectional rhesus macaque study (Shi et al. 2013). Meantime, WM myelination and expansion is likely to cause a physical outward shift of the GM–WM boundary, thereby leading to decreases in both GMV and CT (Raznahan et al. 2011; Gennatas et al. 2017). We found that CT was significantly negatively correlated with WMV in the present cynomolgus population, which is in line with the observation in chimpanzees who had greater WMV but thinner CT (Hopkins and Avants 2013).
It is worth mentioning that increases in CT and GMV in subregions located in the medial temporal lobe system (shown by the inverted U-shaped or monotonic increasing age trajectories) are exhibited throughout adolescence and into early adulthood (Fig. 6, S4 and S6), which is potentially related to memory consolidation processes. The medial temporal lobe including the hippocampus and adjacent entorhinal, perirhinal, and parahippocampal cortices, is essential for establishing and maintain long-term memory for facts and events (declarative memory), and ultimately, through a process of consolidation, becomes independent of long-term memory (Squire and Zola-Morgan 1991; Squire et al. 2004; Eichenbaum et al. 2007; van Strien et al. 2009; Ranganath and Ritchey 2012). Adolescence is a crucial phase in biological and psychosocial maturation and involves large-scale reconfigurations of brain anatomy (Paus et al. 2008). Because memory function improves rapidly from childhood through adolescence into early adulthood (Ofen and Shing 2013), we speculate that structural changes of the medial temporal lobe might occur during this period. For example, the functionally defined scene-selective posterior parahippocampal gyrus (Epstein and Kanwisher 1998) was found to grow in size from childhood through adulthood, which was correlated with improved recognition memory for scenes (Golarai et al. 2007). Gogtay et al. 2004 showed that human GM development appeared to follow a functional maturation sequence from childhood into young adulthood, which started with the primary sensorimotor cortices along with frontal and occipital poles, and ended at the temporal cortex (including the medial part of the inferior temporal lobe). The CT development we found in the monkey cohort is also consistent with the study of Raznahan et al. 2011, in which CT of medial temporal cortices continues to increase with age.
Individual Deviations Estimated from the Normative Model
We found that individuals in the present healthy population, on average, did not deviate substantially from the normative model, in which we were able to identify an extremely low percentage of deviating regions in individuals, whereas there was no overlap between these deviating regions or subjects (Fig. 7). This uniformity (most subjects were within the normative model) and heterogeneity (deviations were unique and highly individualized for different subjects) is characteristic of both human and nonhuman primates, which is increasingly important for understanding the heterogeneity of brain structure within typical populations (Feczko et al. 2019). An attractive feature of such population-based normative models is their potential use in evaluating individuals under diseased conditions, which is complementary to the conventional case-control analysis (Wolfers et al. 2018; Zabihi et al. 2018; Wolfers et al. 2019). For example, to study a disease monkey model with a limited number of subjects, the “null” hypothesis could be that the diseased ones would follow a similar age-related trajectory of brain structure to the typically-developing subjects, which allows a statistical evaluation of brain structural abnormality for each individual monkey. The current results can be used as a gold standard similar to child growth charts, which may aid in relaxing the restrictions of sample size in nonhuman primate research.
There are several practical limitations to this study that should be taken into account when interpreting the present findings. Although the sample size (n = 162) was sufficiently large relative to most prior nonhuman primate studies, the developmental trajectories reported here (ranging from 2 to 8 years old) may be susceptible to biases due to cross-sectional design and nonuniform sample distribution. Nevertheless, we built our normative model based on Bayesian statistics, which is a principled method for handling uncertainty and hence automatically makes more conservative inferences when the sample size is limited. Future investigation with larger sample size and multicenter data sharing/validation would increase statistical power and robustness. Another limit is that the present normative model was formulated on basis of the cross-sectional data. Previous longitudinal studies of brain development in macaques provide invaluable translational insights into the pathological changes during human brain development (Malkova et al. 2006; Shi et al. 2016; Young et al. 2017; Kim et al. 2020). Moreover, the early developmental period of macaque monkeys from birth to late infancy was not included in the current study, which is critical for understanding the complete developmental curve (Malkova et al. 2006; Knickmeyer et al. 2010; Liu et al. 2015; Scott et al. 2016; Kim et al. 2020). These issues certainly warrant future investigation. The last limit is the use of the D99 parcellation scheme (a template of rhesus macaques), despite the lack of alternatives. Subtle differences in the brain structures of different macaque species have been reported, such as slight differences exhibited in skull shape (Frey et al. 2011) and sulcal patterns (Van Der Gucht et al. 2006) between cynomolgus and rhesus macaques. Future experiments using vortex-based neuroanatomical analysis would be an option to minimize the effect of using different parcellation templates.
In conclusion, we constructed a new, population-based MRI atlas of the cynomolgus macaque and then established a normative modeling approach to characterize age-dependent individual variations in cortical thickness and volume. This method allows us to showcase the typical age-related trajectories of the cynomolgus monkeys and advance current understanding of inherent heterogeneity in the macaque monkey population, which may further aid in quantitatively describing extreme variations under disease conditions.
Supplementary Material
Contributor Information
Qiming Lv, National Resource Center for Non-human Primates, Kunming Primate Research Center, and National Research Facility for Phenotypic & Genetic Analysis of Model Animals (Primate Facility), Kunming Institute of Zoology, Chinese Academy of Sciences, Kunming, Yunnan, China; University of Chinese Academy of Sciences, Beijing, China; Institute of Neuroscience, CAS Center for Excellence in Brain Science and Intelligence Technology, State Key Laboratory of Neuroscience, CAS Key Laboratory of Primate Neurobiology, Chinese Academy of Sciences, Shanghai, China.
Mingchao Yan, University of Chinese Academy of Sciences, Beijing, China; Institute of Neuroscience, CAS Center for Excellence in Brain Science and Intelligence Technology, State Key Laboratory of Neuroscience, CAS Key Laboratory of Primate Neurobiology, Chinese Academy of Sciences, Shanghai, China.
Xiangyu Shen, Institute of Neuroscience, CAS Center for Excellence in Brain Science and Intelligence Technology, State Key Laboratory of Neuroscience, CAS Key Laboratory of Primate Neurobiology, Chinese Academy of Sciences, Shanghai, China.
Jing Wu, National Resource Center for Non-human Primates, Kunming Primate Research Center, and National Research Facility for Phenotypic & Genetic Analysis of Model Animals (Primate Facility), Kunming Institute of Zoology, Chinese Academy of Sciences, Kunming, Yunnan, China.
Wenwen Yu, Institute of Neuroscience, CAS Center for Excellence in Brain Science and Intelligence Technology, State Key Laboratory of Neuroscience, CAS Key Laboratory of Primate Neurobiology, Chinese Academy of Sciences, Shanghai, China.
Shengyao Yan, University of Chinese Academy of Sciences, Beijing, China; Institute of Neuroscience, CAS Center for Excellence in Brain Science and Intelligence Technology, State Key Laboratory of Neuroscience, CAS Key Laboratory of Primate Neurobiology, Chinese Academy of Sciences, Shanghai, China.
Feng Yang, University of Chinese Academy of Sciences, Beijing, China; Institute of Neuroscience, CAS Center for Excellence in Brain Science and Intelligence Technology, State Key Laboratory of Neuroscience, CAS Key Laboratory of Primate Neurobiology, Chinese Academy of Sciences, Shanghai, China.
Kristina Zeljic, University of Chinese Academy of Sciences, Beijing, China; Institute of Neuroscience, CAS Center for Excellence in Brain Science and Intelligence Technology, State Key Laboratory of Neuroscience, CAS Key Laboratory of Primate Neurobiology, Chinese Academy of Sciences, Shanghai, China.
Yuequan Shi, Department of Radiology, Fujian Provincial Maternity and Children’s Hospital of Fujian Medical University, Fuzhou, Fujian, China.
Zuofu Zhou, Department of Radiology, Fujian Provincial Maternity and Children’s Hospital of Fujian Medical University, Fuzhou, Fujian, China.
Longbao Lv, National Resource Center for Non-human Primates, Kunming Primate Research Center, and National Research Facility for Phenotypic & Genetic Analysis of Model Animals (Primate Facility), Kunming Institute of Zoology, Chinese Academy of Sciences, Kunming, Yunnan, China.
Xintian Hu, National Resource Center for Non-human Primates, Kunming Primate Research Center, and National Research Facility for Phenotypic & Genetic Analysis of Model Animals (Primate Facility), Kunming Institute of Zoology, Chinese Academy of Sciences, Kunming, Yunnan, China.
Ravi Menon, Centre for Functional and Metabolic Mapping, Robarts Research Institute, Western University, London, Ontario, Canada; Department of Medical Biophysics, Western University, London, Ontario, Canada.
Zheng Wang, National Resource Center for Non-human Primates, Kunming Primate Research Center, and National Research Facility for Phenotypic & Genetic Analysis of Model Animals (Primate Facility), Kunming Institute of Zoology, Chinese Academy of Sciences, Kunming, Yunnan, China; University of Chinese Academy of Sciences, Beijing, China; Institute of Neuroscience, CAS Center for Excellence in Brain Science and Intelligence Technology, State Key Laboratory of Neuroscience, CAS Key Laboratory of Primate Neurobiology, Chinese Academy of Sciences, Shanghai, China; Shanghai Center for Brain Science and Brain-inspired Intelligence Technology, Shanghai, China.
Note
Conflict of Interest: None declared.
Funding
National Key R&D Program of China (No. 2017YFC1310400; No. 2018YFC1313803), the Strategic Priority Research Program of Chinese Academy of Science (No. XDB32030000), National Natural Science Foundation (81571300, 81527901, 31771174), Natural Science Foundation and Major Basic Research Program of Shanghai (No. 16JC1420100), Shanghai Municipal Science and Technology Major Project (No. 2018SHZDZX05), and Key Realm R&D Program of Guangdong Province (2019B030335001).
References
- Avants BB, Epstein CL, Grossman M, Gee JC. 2008. Symmetric diffeomorphic image registration with cross-correlation: evaluating automated labeling of elderly and neurodegenerative brain. Med Image Anal. 12:26–41. [DOI] [PMC free article] [PubMed] [Google Scholar]
- Avants BB, Tustison NJ, Song G, Cook PA, Klein A, Gee JC. 2011. A reproducible evaluation of ANTs similarity metric performance in brain image registration. NeuroImage. 54:2033–2044. [DOI] [PMC free article] [PubMed] [Google Scholar]
- Avants BB, Yushkevich P, Pluta J, Minkoff D, Korczykowski M, Detre J, Gee JC. 2010. The optimal template effect in hippocampus studies of diseased populations. NeuroImage. 49:2457–2466. [DOI] [PMC free article] [PubMed] [Google Scholar]
- Ball G, Seal ML. 2019. Individual variation in longitudinal postnatal development of the primate brain. Brain Struct Funct. 224:1185–1201. [DOI] [PubMed] [Google Scholar]
- Belmonte Juan Carlos I, Callaway Edward M, Caddick SJ, Churchland P, Feng G, Homanics Gregg E, Lee K-F, Leopold David A, Miller Cory T, Mitchell Jude F et al. 2015. Brains, genes, and primates. Neuron. 86:617–631. [DOI] [PMC free article] [PubMed] [Google Scholar]
- Cai DC, Wang Z, Bo T, Yan S, Liu Y, Liu Z, Zeljic K, Chen X, Zhan Y, Xu X et al. 2020. MECP2 duplication causes aberrant GABA pathways, circuits and Behaviors in transgenic monkeys: neural mappings to patients with autism. J Neurosci. 40:3799–3814. [DOI] [PMC free article] [PubMed] [Google Scholar]
- Calabrese E, Badea A, Coe CL, Lubach GR, Shi Y, Styner MA, Johnson GA. 2015. A diffusion tensor MRI atlas of the postmortem rhesus macaque brain. NeuroImage. 117:408–416. [DOI] [PMC free article] [PubMed] [Google Scholar]
- Capitanio JP, Emborg ME. 2008. Contributions of non-human primates to neuroscience research. Lancet. 371:1126–1135. [DOI] [PubMed] [Google Scholar]
- Chan AW, Chong KY, Martinovich C, Simerly C, Schatten G. 2001. Transgenic monkeys produced by retroviral gene transfer into mature oocytes. Science. 291:309–312. [DOI] [PubMed] [Google Scholar]
- Chen Y, Yu J, Niu Y, Qin D, Liu H, Li G, Hu Y, Wang J, Lu Y, Kang Y et al. 2017. Modeling Rett syndrome using TALEN-edited MECP2 mutant Cynomolgus monkeys. Cell. 169:945–955 e910. [DOI] [PMC free article] [PubMed] [Google Scholar]
- Cox RW. 1996. AFNI: software for analysis and visualization of functional magnetic resonance neuroimages. Comput Biomed Res. 29:162–173. [DOI] [PubMed] [Google Scholar]
- Das SR, Avants BB, Grossman M, Gee JC. 2009. Registration based cortical thickness measurement. NeuroImage. 45:867–879. [DOI] [PMC free article] [PubMed] [Google Scholar]
- Eichenbaum H, Yonelinas AP, Ranganath C. 2007. The medial temporal lobe and recognition memory. Annu Rev Neurosci. 30:123–152. [DOI] [PMC free article] [PubMed] [Google Scholar]
- Epstein R, Kanwisher N. 1998. A cortical representation of the local visual environment. Nature. 392:598–601. [DOI] [PubMed] [Google Scholar]
- Feczko E, Miranda-Dominguez O, Marr M, Graham AM, Nigg JT, Fair DA. 2019. The heterogeneity problem: approaches to identify psychiatric subtypes. Trends Cogn Sci. 23:584–601. [DOI] [PMC free article] [PubMed] [Google Scholar]
- Fedorov A, Beichel R, Kalpathy-Cramer J, Finet J, Fillion-Robin JC, Pujol S, Bauer C, Jennings D, Fennessy F, Sonka M et al. 2012. 3D slicer as an image computing platform for the quantitative imaging network. Magn Reson Imaging. 30:1323–1341. [DOI] [PMC free article] [PubMed] [Google Scholar]
- Foulkes L, Blakemore SJ. 2018. Studying individual differences in human adolescent brain development. Nat Neurosci. 21:315–323. [DOI] [PubMed] [Google Scholar]
- Frey S, Pandya DN, Chakravarty MM, Bailey L, Petrides M, Collins DL. 2011. An MRI based average macaque monkey stereotaxic atlas and space (MNI monkey space). NeuroImage. 55:1435–1442. [DOI] [PubMed] [Google Scholar]
- Gennatas ED, Avants BB, Wolf DH, Satterthwaite TD, Ruparel K, Ciric R, Hakonarson H, Gur RE, Gur RC. 2017. Age-related effects and sex differences in Gray matter density, volume, mass, and cortical thickness from childhood to Young adulthood. J Neurosci. 37:5065–5073. [DOI] [PMC free article] [PubMed] [Google Scholar]
- Giedd JN, Blumenthal J, Jeffries NO, Castellanos FX, Liu H, Zijdenbos A, Paus T, Evans AC, Rapoport JL. 1999. Brain development during childhood and adolescence: a longitudinal MRI study. Nat Neurosci. 2:861–863. [DOI] [PubMed] [Google Scholar]
- Glasser MF, Van Essen DC. 2011. Mapping human cortical areas in vivo based on myelin content as revealed by T1- and T2-weighted MRI. J Neurosci. 31:11597–11616. [DOI] [PMC free article] [PubMed] [Google Scholar]
- Gogtay N, Giedd JN, Lusk L, Hayashi KM, Greenstein D, Vaituzis AC, Nugent TF 3rd, Herman DH, Clasen LS, Toga AW et al. 2004. Dynamic mapping of human cortical development during childhood through early adulthood. Proc Natl Acad Sci USA. 101:8174–8179. [DOI] [PMC free article] [PubMed] [Google Scholar]
- Golarai G, Ghahremani DG, Whitfield-Gabrieli S, Reiss A, Eberhardt JL, Gabrieli JD, Grill-Spector K. 2007. Differential development of high-level visual cortex correlates with category-specific recognition memory. Nat Neurosci. 10:512–522. [DOI] [PMC free article] [PubMed] [Google Scholar]
- Hill J, Inder T, Neil J, Dierker D, Harwell J, Van Essen D. 2010. Similar patterns of cortical expansion during human development and evolution. Proc Natl Acad Sci USA. 107:13135–13140. [DOI] [PMC free article] [PubMed] [Google Scholar]
- Hopkins WD, Avants BB. 2013. Regional and hemispheric variation in cortical thickness in chimpanzees (pan troglodytes). J Neurosci. 33:5241–5248. [DOI] [PMC free article] [PubMed] [Google Scholar]
- Jenkinson M, Bannister P, Brady M, Smith S. 2002. Improved optimization for the robust and accurate linear registration and motion correction of brain images. NeuroImage. 17:825–841. [DOI] [PubMed] [Google Scholar]
- Jennings CG, Landman R, Zhou Y, Sharma J, Hyman J, Movshon JA, Qiu Z, Roberts AC, Roe AW, Wang X et al. 2016. Opportunities and challenges in modeling human brain disorders in transgenic primates. Nat Neurosci. 19:1123–1130. [DOI] [PubMed] [Google Scholar]
- Kim J, Jung Y, Barcus R, Bachevalier JH, Sanchez MM, Nader MA, Whitlow CT. 2020. Rhesus macaque brain developmental trajectory: A longitudinal analysis using tensor-based structural Morphometry and diffusion tensor imaging. Cereb Cortex. 30:4325–4435. [DOI] [PMC free article] [PubMed] [Google Scholar]
- Knickmeyer RC, Styner M, Short SJ, Lubach GR, Kang C, Hamer R, Coe CL, Gilmore JH. 2010. Maturational trajectories of cortical brain development through the pubertal transition: unique species and sex differences in the monkey revealed through structural magnetic resonance imaging. Cereb Cortex. 20:1053–1063. [DOI] [PMC free article] [PubMed] [Google Scholar]
- Lebel C, Beaulieu C. 2011. Longitudinal development of human brain wiring continues from childhood into adulthood. J Neurosci. 31:10937–10947. [DOI] [PMC free article] [PubMed] [Google Scholar]
- Likar B, Viergever MA, Pernus F. 2001. Retrospective correction of MR intensity inhomogeneity by information minimization. IEEE Trans Med Imaging. 20:1398–1410. [DOI] [PubMed] [Google Scholar]
- Liu C, Tian X, Liu H, Mo Y, Bai F, Zhao X, Ma Y, Wang J. 2015. Rhesus monkey brain development during late infancy and the effect of phencyclidine: a longitudinal MRI and DTI study. NeuroImage. 107:65–75. [DOI] [PubMed] [Google Scholar]
- Liu Z, Cai Y, Liao Z, Xu Y, Wang Y, Wang Z, Jiang X, Li Y, Lu Y, Nie Y et al. 2019. Cloning of a gene-edited macaque monkey by somatic cell nuclear transfer. Natl Sci Rev. 6:101–108. [DOI] [PMC free article] [PubMed] [Google Scholar]
- Liu Z, Li X, Zhang JT, Cai YJ, Cheng TL, Cheng C, Wang Y, Zhang CC, Nie YH, Chen ZF et al. 2016. Autism-like behaviours and germline transmission in transgenic monkeys overexpressing MeCP2. Nature. 530:98–102. [DOI] [PubMed] [Google Scholar]
- Love SA, Marie D, Roth M, Lacoste R, Nazarian B, Bertello A, Coulon O, Anton JL, Meguerditchian A. 2016. The average baboon brain: MRI templates and tissue probability maps from 89 individuals. NeuroImage. 132:526–533. [DOI] [PubMed] [Google Scholar]
- Lv Q, Yang L, Li G, Wang Z, Shen Z, Yu W, Jiang Q, Hou B, Pu J, Hu H et al. 2016. Large-scale persistent network reconfiguration induced by ketamine in anesthetized monkeys: relevance to mood disorders. Biol Psychiatry. 79:765–775. [DOI] [PubMed] [Google Scholar]
- Malkova L, Heuer E, Saunders RC. 2006. Longitudinal magnetic resonance imaging study of rhesus monkey brain development. Eur J Neurosci. 24:3204–3212. [DOI] [PubMed] [Google Scholar]
- Marquand AF, Rezek I, Buitelaar J, Beckmann CF. 2016. Understanding heterogeneity in clinical cohorts using normative models: beyond case-control studies. Biol Psychiatry. 80:552–561. [DOI] [PMC free article] [PubMed] [Google Scholar]
- McLaren DG, Kosmatka KJ, Oakes TR, Kroenke CD, Kohama SG, Matochik JA, Ingram DK, Johnson SC. 2009. A population-average MRI-based atlas collection of the rhesus macaque. NeuroImage. 45:52–59. [DOI] [PMC free article] [PubMed] [Google Scholar]
- Milham MP, Ai L, Koo B, Xu T, Amiez C, Balezeau F, Baxter MG, Blezer ELA, Brochier T, Chen A et al. 2018. An open resource for non-human primate imaging. Neuron. 100:61–74.e2. [DOI] [PMC free article] [PubMed] [Google Scholar]
- Mills KL, Goddings AL, Herting MM, Meuwese R, Blakemore SJ, Crone EA, Dahl RE, Guroglu B, Raznahan A, Sowell ER et al. 2016. Structural brain development between childhood and adulthood: convergence across four longitudinal samples. NeuroImage. 141:273–281. [DOI] [PMC free article] [PubMed] [Google Scholar]
- Mueller S, Wang D, Fox MD, Yeo BT, Sepulcre J, Sabuncu MR, Shafee R, Lu J, Liu H. 2013. Individual variability in functional connectivity architecture of the human brain. Neuron. 77:586–595. [DOI] [PMC free article] [PubMed] [Google Scholar]
- Ofen N, Shing YL. 2013. From perception to memory: changes in memory systems across the lifespan. Neurosci Biobehav Rev. 37:2258–2267. [DOI] [PubMed] [Google Scholar]
- Paus T, Keshavan M, Giedd JN. 2008. Why do many psychiatric disorders emerge during adolescence? Nat Rev Neurosci. 9:947–957. [DOI] [PMC free article] [PubMed] [Google Scholar]
- Qiu P, Jiang J, Liu Z, Cai Y, Huang T, Wang Y, Liu Q, Nie Y, Liu F, Cheng J et al. 2019. BMAL1 knockout macaque monkeys display reduced sleep and psychiatric disorders. Natl Sci Rev. 6:87–100. [DOI] [PMC free article] [PubMed] [Google Scholar]
- Ranganath C, Ritchey M. 2012. Two cortical systems for memory-guided behaviour. Nat Rev Neurosci. 13:713–726. [DOI] [PubMed] [Google Scholar]
- Rasmussen C, Williams C. 2006. Model selection and adaptation of hyperparameters In: Gaussian processes for machine learning (adaptive computation and machine learning series). Vol 4, pp. 105–128. [Google Scholar]
- Raznahan A, Lerch JP, Lee N, Greenstein D, Wallace GL, Stockman M, Clasen L, Shaw PW, Giedd JN. 2011. Patterns of coordinated anatomical change in human cortical development: a longitudinal neuroimaging study of maturational coupling. Neuron. 72:873–884. [DOI] [PMC free article] [PubMed] [Google Scholar]
- Reveley C, Gruslys A, Ye FQ, Glen D, Samaha J, B ER, Saad Z, A KS, Leopold DA, Saleem KS. 2017. Three-dimensional digital template atlas of the macaque brain. Cereb Cortex. 27:4463–4477. [DOI] [PMC free article] [PubMed] [Google Scholar]
- Rohlfing T, Kroenke CD, Sullivan EV, Dubach MF, Bowden DM, Grant KA, Pfefferbaum A. 2012. The INIA19 template and NeuroMaps atlas for primate brain image Parcellation and spatial normalization. Front Neuroinform. 6:27. [DOI] [PMC free article] [PubMed] [Google Scholar]
- Saad ZS, Reynolds RC. 2012. Suma. NeuroImage. 62:768–773. [DOI] [PMC free article] [PubMed] [Google Scholar]
- Saleem KS, Logothetis NK. 2006. A combined MRI and histology atlas of the Rhesus monkey brain. Amsterdam: Academic Press. [Google Scholar]
- Sasaki E, Suemizu H, Shimada A, Hanazawa K, Oiwa R, Kamioka M, Tomioka I, Sotomaru Y, Hirakawa R, Eto T et al. 2009. Generation of transgenic non-human primates with germline transmission. Nature. 459:523–527. [DOI] [PubMed] [Google Scholar]
- Sawiak SJ, Shiba Y, Oikonomidis L, Windle CP, Santangelo AM, Grydeland H, Cockcroft G, Bullmore ET, Roberts AC. 2018. Trajectories and milestones of cortical and subcortical development of the marmoset brain from infancy to adulthood. Cereb Cortex. 28:4440–4453. [DOI] [PMC free article] [PubMed] [Google Scholar]
- Scheinost D, Noble S, Horien C, Greene AS, Lake EM, Salehi M, Gao S, Shen X, O'Connor D, Barron DS et al. 2019. Ten simple rules for predictive modeling of individual differences in neuroimaging. NeuroImage. 193:35–45. [DOI] [PMC free article] [PubMed] [Google Scholar]
- Scott JA, Grayson D, Fletcher E, Lee A, Bauman MD, Schumann CM, Buonocore MH, Amaral DG. 2016. Longitudinal analysis of the developing rhesus monkey brain using magnetic resonance imaging: birth to adulthood. Brain Struct Funct. 221:2847–2871. [DOI] [PMC free article] [PubMed] [Google Scholar]
- Seghier ML, Price CJ. 2018. Interpreting and utilising Intersubject variability in brain function. Trends Cogn Sci. 22:517–530. [DOI] [PMC free article] [PubMed] [Google Scholar]
- Seidlitz J, Sponheim C, Glen D, Ye FQ, Saleem KS, Leopold DA, Ungerleider L, Messinger A. 2018. A population MRI brain template and analysis tools for the macaque. NeuroImage. 170:121–131. [DOI] [PMC free article] [PubMed] [Google Scholar]
- Shen S, Szameitat AJ, Sterr A. 2007. VBM lesion detection depends on the normalization template: a study using simulated atrophy. Magn Reson Imaging. 25:1385–1396. [DOI] [PubMed] [Google Scholar]
- Shi Y, Budin F, Yapuncich E, Rumple A, Young JT, Payne C, Zhang X, Hu X, Godfrey J, Howell B et al. 2016. UNC-Emory infant atlases for macaque brain image analysis: postnatal brain development through 12 months. Front Neurosci. 10:617. [DOI] [PMC free article] [PubMed] [Google Scholar]
- Shi Y, Short SJ, Knickmeyer RC, Wang J, Coe CL, Niethammer M, Gilmore JH, Zhu H, Styner MA. 2013. Diffusion tensor imaging-based characterization of brain neurodevelopment in primates. Cereb Cortex. 23:36–48. [DOI] [PMC free article] [PubMed] [Google Scholar]
- Squire LR, Stark CE, Clark RE. 2004. The medial temporal lobe. Annu Rev Neurosci. 27:279–306. [DOI] [PubMed] [Google Scholar]
- Squire LR, Zola-Morgan S. 1991. The medial temporal lobe memory system. Science. 253:1380–1386. [DOI] [PubMed] [Google Scholar]
- Stepanyants A, Hof PR, Chklovskii DB. 2002. Geometry and structural plasticity of synaptic connectivity. Neuron. 34:275–288. [DOI] [PubMed] [Google Scholar]
- Tamnes CK, Herting MM, Goddings AL, Meuwese R, Blakemore SJ, Dahl RE, Guroglu B, Raznahan A, Sowell ER, Crone EA et al. 2017. Development of the cerebral cortex across adolescence: A multisample study of inter-related longitudinal changes in cortical volume, surface area, and thickness. J Neurosci. 37:3402–3412. [DOI] [PMC free article] [PubMed] [Google Scholar]
- Tustison NJ, Cook PA, Klein A, Song G, Das SR, Duda JT, Kandel BM, Strien N, Stone JR, Gee JC et al. 2014. Large-scale evaluation of ANTs and FreeSurfer cortical thickness measurements. NeuroImage. 99:166–179. [DOI] [PubMed] [Google Scholar]
- Van Der Gucht E, Youakim M, Arckens L, Hof PR, Baizer JS. 2006. Variations in the structure of the prelunate gyrus in old world monkeys. Anat Rec A Disc Mol Cell Evol Biol. 288:753–775. [DOI] [PMC free article] [PubMed] [Google Scholar]
- Van Essen DC. 2004. Surface-based approaches to spatial localization and registration in primate cerebral cortex. NeuroImage. 23(Suppl 1):S97–S107. [DOI] [PubMed] [Google Scholar]
- Strien NM, Cappaert NL, Witter MP. 2009. The anatomy of memory: an interactive overview of the parahippocampal-hippocampal network. Nat Rev Neurosci. 10:272–282. [DOI] [PubMed] [Google Scholar]
- Walhovd KB, Fjell AM, Giedd J, Dale AM, Brown TT. 2017. Through thick and thin: a need to reconcile contradictory results on trajectories in human cortical development. Cereb Cortex. 27:1472–1481. [DOI] [PMC free article] [PubMed] [Google Scholar]
- Wang Z, Chen LM, Negyessy L, Friedman RM, Mishra A, Gore JC, Roe AW. 2013. The relationship of anatomical and functional connectivity to resting-state connectivity in primate somatosensory cortex. Neuron. 78:1116–1126. [DOI] [PMC free article] [PubMed] [Google Scholar]
- Wolfers T, Beckmann CF, Hoogman M, Buitelaar JK, Franke B, Marquand AF. 2019. Individual differences v. the average patient: mapping the heterogeneity in ADHD using normative models. Psychol Med. 50:1–10. [DOI] [PMC free article] [PubMed] [Google Scholar]
- Wolfers T, Doan NT, Kaufmann T, Alnaes D, Moberget T, Agartz I, Buitelaar JK, Ueland T, Melle I, Franke B et al. 2018. Mapping the heterogeneous phenotype of schizophrenia and bipolar disorder using normative models. JAMA Psychiatry. 75:1146–1155. [DOI] [PMC free article] [PubMed] [Google Scholar]
- Woods RP. 1996. Modeling for intergroup comparisons of imaging data. NeuroImage. 4:S84–S94. [DOI] [PubMed] [Google Scholar]
- Xu T, Sturgeon D, Ramirez JSB, Froudist-Walsh S, Margulies DS, Schroeder CE, Fair DA, Milham MP. 2019. Interindividual variability of functional connectivity in awake and anesthetized rhesus macaque monkeys. Biol Psychiatry Cogn Neurosci Neuroimaging. 4:543–553. [DOI] [PMC free article] [PubMed] [Google Scholar]
- Yang SH, Cheng PH, Banta H, Piotrowska-Nitsche K, Yang JJ, Cheng EC, Snyder B, Larkin K, Liu J, Orkin J et al. 2008. Towards a transgenic model of Huntington's disease in a non-human primate. Nature. 453:921–924. [DOI] [PMC free article] [PubMed] [Google Scholar]
- Young JT, Shi Y, Niethammer M, Grauer M, Coe CL, Lubach GR, Davis B, Budin F, Knickmeyer RC, Alexander AL et al. 2017. The UNC-Wisconsin rhesus macaque neurodevelopment database: a structural MRI and DTI database of early postnatal development. Front Neurosci. 11:29. [DOI] [PMC free article] [PubMed] [Google Scholar]
- Zabihi M, Oldehinkel M, Wolfers T, Frouin V, Goyard D, Loth E, Charman T, Tillmann J, Banaschewski T, Dumas G et al. 2018. Dissecting the heterogeneous cortical anatomy of autism Spectrum disorder using normative models. Biol Psychiatry Cogn Neurosci Neuroimaging. 4:567–578. [DOI] [PMC free article] [PubMed] [Google Scholar]
- Zhan Y, Wei J, Liang J, Xu X, He R, Robbins TW, Wang Z. 2020. Diagnostic classification for human autism and obsessive-compulsive disorder based on machine learning from a primate genetic model. Am J Psychiatry. https://doi.org/10.1176/appi.ajp.2020.19101091. [DOI] [PubMed] [Google Scholar]
- Zhang Y, Brady M, Smith S. 2001. Segmentation of brain MR images through a hidden Markov random field model and the expectation-maximization algorithm. IEEE Trans Med Imaging. 20:45–57. [DOI] [PubMed] [Google Scholar]
- Zhang Z, Cai DC, Wang Z, Zeljic K, Wang Z, Wang Y. 2019. Isoflurane-induced burst suppression increases intrinsic functional connectivity of the monkey brain. Front Neurosci. 13:296. [DOI] [PMC free article] [PubMed] [Google Scholar]
Associated Data
This section collects any data citations, data availability statements, or supplementary materials included in this article.