

Abstract
Metabolites in human biofluids document the physiological status of individuals. We conducted comprehensive, non‐targeted, non‐invasive metabolomic analysis of urine from 27 healthy human subjects, comprising 13 young adults (30 ± 3 years) and 14 seniors (76 ± 4 years). Quantitative analysis of 99 metabolites revealed 55 that displayed significant differences in abundance between the two groups. Forty‐four did not show a statistically significant relationship with age. These include 13 standard amino acids, 5 methylated, 4 acetylated, and 9 other amino acids, 6 nucleosides, nucleobases, and derivatives, 4 sugar derivatives, 5 sugar phosphates, 4 carnitines, 2 hydroxybutyrates, 1 choline, and 1 ethanolamine derivative, and glutathione disulfide. Abundances of 53 compounds decreased, while 2 (glutathione disulfide, myo‐inositol) increased in elderly people. The great majority of age‐linked markers were highly correlated with creatinine. In contrast, 44 other urinary metabolites, including urate, carnitine, hippurate, and betaine, were not age‐linked, neither declining nor increasing in elderly subjects. As metabolite profiles of urine and blood are quite different, age‐related information in urine offers additional valuable insights into aging mechanisms of endocrine system. Correlation analysis of urinary metabolites revealed distinctly inter‐related groups of compounds.
Keywords: creatinine, glutathione, human endocrine aging, LC‐MS, non‐targeted metabolomics, pseudouridine, urinary age markers
Abbreviations
- AU
arbitrary unit
- GSH
reduced glutathione
- GSSG
oxidized glutathione
- HEPES
4‐(2‐hydroxyethyl)‐1‐piperazineethanesulfonic acid
- LC‐MS
liquid chromatography‐mass spectrometry
- PCA
principal component analysis
- PIPES
piperazine‐N,N’‐bis(2‐ethanesulfonic acid
1. INTRODUCTION
Elderly people are acutely aware of the progressive aging, but quantifying and characterizing physiological aging is less intuitive. Nonetheless, assessment of aging and determination of aging type by analyzing metabolites in biofluids, such as blood and urine, may help us to understand multifaceted aging of the human body. 1 , 2 , 3 , 4 , 5 , 6 , 7 , 8 , 9 , 10 , 11 , 12 , 13 , 14 , 15 , 16 Age‐dependent changes of metabolite abundances may be valuable in identifying molecular causes of impaired organ functions. 12 Technology that enables simple and rapid measurement of urinary metabolites, which can be collected non‐invasively, has certain advantages over methods using blood. Urinary metabolites are promising biological samples for monitoring health parameters if the metabolic processes resulting in production of those metabolites can be fully understood. To date, few comprehensive approaches to investigate human urinary metabolites in aging have been reported. 13 , 15 , 17 Urination is a primary route by which the body eliminates water‐soluble waste products. Accordingly, urine has been broadly utilized for diagnosis of renal dysfunction in diverse kidney diseases. 18 , 19 , 20 , 21 , 22 , 23 Nonetheless, because urinary metabolites originate in all organ systems, urinary metabolites may be useful to examine human aging in a synthetic way. In this study, we analyzed urinary metabolites in young and elderly subjects, using comprehensive metabolomics to identify metabolites linked to aging. Striking correlations of many urine metabolites with age were found. Previously creatinine, the waste product from muscle and other organs, was identified as an age‐related factor. 1 , 2 , 20 Subsequently, dimethyl‐guanosine, decanoyl‐carnitine, N‐acetyl‐aspartate, and tryptophan were reported to decline in urine of elderly subjects. 15 , 17 In this study, we identified many more age‐dependent and age‐independent metabolites using comprehensive, non‐targeted analysis of urine compounds. Fifty‐three compounds were found to decline, while two compounds increase in urine of elderly subjects.
2. MATERIAL AND METHODS
2.1. Participants and sample collection
Fourteen elderly (69–81 years) and 13 young (25–38 years) healthy people participated as subjects in this study (Table S1). Serum clinical renal markers were measured at Falco Biosystems Ltd. (Kyoto, Japan). Values of all participants were within normal ranges (urea nitrogen, 8–20 mg/dL; creatinine, female 0.47–0.79 and male 0.61–1.04 mg/dL). Measurements of metabolites in first morning urine are more consistent than random daytime sampling to monitor metabolites. Intra‐individual coefficients of variation in first morning urine and 24‐h collected urine are similar to those previously reported. 24 Midstream urine samples for metabolomic analysis were taken in the morning at home, immediately after awakening. Subjects were asked to ensure at least 8 h of fasting prior to sampling. During fasting, they took water freely. After collection, urine samples were brought to the laboratory within 3 h. 0.2 mL urine were immediately quenched in 1.8 mL of 55% methanol at −40°C. This rapid quenching step stabilizes metabolites and maximizes reproducibility of metabolomic data. Two internal standards (10 nmol of HEPES and PIPES) were added to each sample. After brief vortexing, samples were transferred to Amicon Ultra 10‐kDa cut‐off filters (Millipore) to remove proteins and cellular debris. After sample concentration by vacuum evaporation, each sample was re‐suspended in 40 µL of 50% acetonitrile, and 1 µL was used for each injection into the LC‐MS system, as described. 12 , 25
2.2. Ethics statement
Written, informed consent was obtained from all donors, in accordance with the Declaration of Helsinki. All experiments were performed in compliance with relevant Japanese laws and institutional guidelines. All protocols were approved by the Human Subjects Research Review Committee of the Okinawa Institute of Science and Technology Graduate University.
2.3. Chemicals and reagents
Standards for metabolite identification were purchased from commercial sources as described previously. 12 , 26 , 27 , 28
2.4. LC‐MS analysis and data processing
Urinary metabolites were analyzed using an Ultimate 3000 DGP‐3600RS HPLC system (Thermo Fisher Scientific) coupled to an LTQ Orbitrap mass spectrometer (Thermo Fisher Scientific), as described. 12 , 25 Briefly, LC separation was performed on a ZIC‐pHILIC column (Merck SeQuant, Umea, Sweden; 150 mm × 2.1 mm, 5 µm particle size). Acetonitrile (A) and 10 mM ammonium carbonate buffer, pH 9.3 (B) were used as the mobile phase, with a linear gradient elution from 80% to 20% A over 30 min, at a flow rate of 100 µL/mL. The mass spectrometer was operated in full‐scan mode with a 100‐1000 m/z scan rate and automatic data‐dependent MS/MS fragmentation scans. For each metabolite, we chose a singly charged, [M + H]+ or [M‐H]−, peak (Table S2). Peak detection and identification of metabolites were performed using MZmine 2 software. 29 Detailed data analytical procedures and parameters have been described previously. 26 Normalized peak area was calculated from the following formula: Normalized peak area = (Raw peak area of each metabolite/Raw peak area of creatinine) × 1000.
2.5. Peak identification and characteristics
We analyzed 99 urine metabolites that were confirmed using standards or MS/MS analysis. 12 , 26 , 27 , 28 Metabolite abundances were classified into 3 groups (H, M, and L), according to their peak areas. H denotes compounds with high peak areas (>108 AU), M with medium peak areas (107 ~ 108 AU) and L with low peak areas (<107 AU) (Table S3).
2.6. Statistical analysis
Peak data processed by MZmine 2 were exported into spreadsheet format and analyzed with R statistical software (http://www.r‐project.org). Statistical analysis was performed using the Mann Whitney U‐test. Statistical significance was established at p < 0.05. Q‐values were calculated from p‐values using the Benjamini‐Hochberg method.
2.7. Data and materials availability
Raw LC‐MS data in mzML format are accessible via the MetaboLights repository (URL: http://www.ebi.ac.uk/metabolights). Data for the 27 volunteers are available under accession number MTBLS1407.
3. RESULTS
3.1. Collection of urine samples
Samples of morning urine, immediately after awaking, were collected from healthy volunteer subjects (elderly, 75.8 ± 3.9 years, and young, 30.6 ± 3.2 years; Table S1 shows gender, BMI, urea nitrogen, and creatinine) in Onna Village, Okinawa, Japan. Precautions taken for sample collection are described in the Material and Methods. Basic data analytical procedures were similar to those previously described. 12 , 25 , 26
3.2. 99 urine metabolites identified
Ninety‐nine urinary metabolites were identified and quantified using liquid chromatography‐mass spectrometry (LC‐MS) and the peak identification software MZmine 2 26 , 29 (chromatogram and mass spectrum data in Table S2, and p‐values, q‐values, and age markers in Table S3). These compounds were subdivided into 12 groups, containing standard amino acids, methylated amino acids, acetylated and other amino acids, nucleosides, nucleobases, and their derivatives, sugar derivatives, sugar phosphates, vitamins and coenzymes, choline and ethanolamine derivatives, carnitines, organic acids, and an antioxidant. Small amino acids, such as glycine and alanine, were not detected in our analysis due to the mass cutoff (100 m/z) used. Levels of individual compounds, categorized by abundance as H (high, >108), M (medium, 107–108) or L (low, <107), were estimated based upon mass spectroscopic peak area. 12 , 27 Raw abundance data are shown in the database.
Some compounds varied widely among individuals and are denoted as H‐L, H‐M or M‐L. According to abundance, there were 7 H, 19 H‐M, 7 H‐L, 5 M, 45 M‐L and 16 L compounds. Twenty‐six urinary metabolites belonged to the abundant class (H or H‐M), the great majority of which were amino acids and their derivatives, such as the methylated amino acids, betaine and dimethyl‐arginine, but they also included nucleosides, such as pseudouridine and N‐methyl‐guanosine. In blood, sugar phosphates and methylated amino acids were enriched in red blood cells. 12 , 27 Below, we show that about half of all urinary metabolites are age‐related.
3.3. 55 urinary compounds are less abundant in elderly samples
Of 99 urinary metabolites assayed in 27 subjects, 55 showed statistically significant differences between young and elderly subjects (p‐values, 0.00003 < p < 0.05) (Figure 1; Table 1A). Thus, about half (55/99) of the urinary metabolites are age‐linked to aging, with all but glutathione disulfide (GSSG) and myo‐inositol becoming less abundant in elderly subjects. To verify statistical significance of metabolite abundances, we also calculated q‐values, as an estimate of false discovery rates. Q‐values shown in Table S3 are consistent with p‐values of 50 age‐related compounds. Five compounds (hypoxanthine, myo‐inositol, lysine, butyro‐betaine, keto(iso)leucine) had q‐values of ~0.08. In contrast, the remaining 44 compounds (Tables 1B and S3), did not differ significantly between young and elderly (Figure S1).
FIGURE 1.
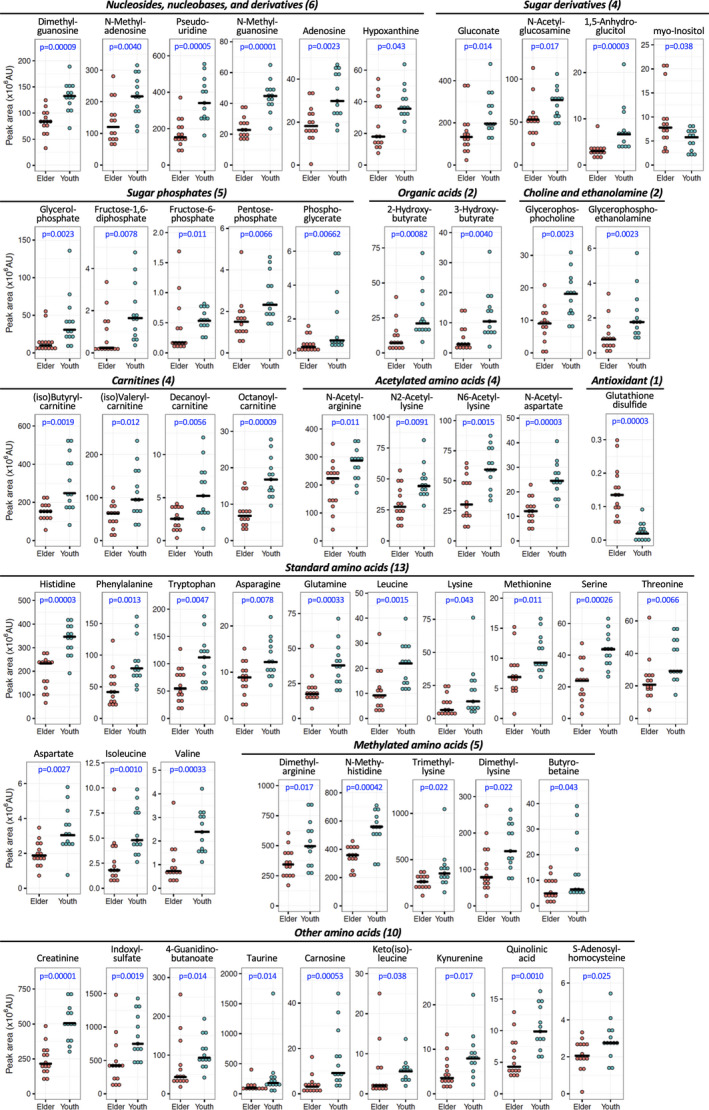
Dot plot profiles of 55 age‐linked urine compounds, which comprise 11 groups, in samples from 27 individuals are shown. Pale red and azure dots represent elderly and young subjects, respectively. Bars represent medians in each group. The peak abundance of compounds and the ratio of median value between elderly and young are shown in Table 1A and 1B. P‐values were obtained using the non‐parametric Mann Whitney U‐test. Fifty‐three of 55 compounds were more abundant in urine of young subjects, while two (myo‐inositol and GSSG) were more abundant among the elderly
Table 1A.
List of 55 aging‐linked compounds that showed a significant difference in abundance between young and elderly people. The abundance of compounds (peak area) displayed: H, high peak areas [>108 AU (arbitrary unit)]; M, medium peak areas (107 ~ 108 AU); L, low peak areas (<107 AU). The peak ratio was calculated using the median of peak abundance in elderly and young people, respectively
| Category | Compound | Peak abundance | Ratio (elderly/young) |
|---|---|---|---|
| Nucleosides, nucleobases, and derivatives (6) | Dimethyl‐guanosine | H‐M | 0.63 |
| N‐Methyl‐adenosine | H‐M | 0.56 | |
| Pseudouridine | H‐M | 0.45 | |
| N‐Methyl‐guanosine | M | 0.51 | |
| Adenosine | M‐L | 0.61 | |
| Hypoxanthine | M‐L | 0.50 | |
| Sugar derivatives (4) | Gluconate | H‐M | 0.67 |
| N‐Acetyl‐glucosamine | H‐M | 0.70 | |
| 1,5‐Anhydroglucitol | M‐L | 0.45 | |
| myo‐Inositol | M‐L | 1.34 | |
| Sugar phosphates (5) | Glycerol‐phosphate | H‐L | 0.32 |
| Fructose−1,6‐diphosphate | L | 0.14 | |
| Fructose−6‐phosphate | L | 0.33 | |
| Pentose‐phosphate | L | 0.65 | |
| Phosphoglycerate | L | 0.46 | |
| Choline and ethanolamine derivatives (2) | Glycerophosphocholine | M‐L | 0.50 |
| Glycerophosphoethanolamine | L | 0.44 | |
| Carnitines (4) | (iso)Butyryl‐carnitine | H‐M | 0.61 |
| (iso)Valeryl‐carnitine | H‐L | 0.66 | |
| Decanoyl‐carnitine | M‐L | 0.49 | |
| Octanoyl‐carnitine | M‐L | 0.40 | |
| Organic acids (2) | 2‐Hydroxybutyrate | M‐L | 0.33 |
| 3‐Hydroxybutyrate | M‐L | 0.27 | |
| Antioxidant (1) | Glutathione disulfide | L | 6.96 |
| Standard amino acids (13) | Histidine | H‐M | 0.68 |
| Phenylalanine | H‐M | 0.53 | |
| Tryptophan | H‐M | 0.49 | |
| Asparagine | M‐L | 0.73 | |
| Glutamine | M‐L | 0.46 | |
| Leucine | M‐L | 0.42 | |
| Lysine | M‐L | 0.50 | |
| Methionine | M‐L | 0.74 | |
| Serine | M‐L | 0.54 | |
| Threonine | M‐L | 0.71 | |
| Aspartate | L | 0.62 | |
| Isoleucine | L | 0.38 | |
| Valine | L | 0.30 | |
| Methylated amino acids (5) | Dimethyl‐arginine | H | 0.69 |
| N‐Methyl‐histidine | H | 0.64 | |
| Trimethyl‐lysine | H | 0.74 | |
| Dimethyl‐lysine | H‐M | 0.52 | |
| Butyro‐betaine | M‐L | 0.76 | |
| Acetylated amino acids (4) | N‐Acetyl‐arginine | H‐M | 0.78 |
| N2‐Acetyl‐lysine | M | 0.62 | |
| N6‐Acetyl‐lysine | M | 0.51 | |
| N‐Acetyl‐aspartate | M‐L | 0.50 | |
| Other amino acids (9) | Creatinine | H | 0.43 |
| Indoxyl‐sulfate | H | 0.56 | |
| 4‐Guanidinobutanoate | H‐M | 0.46 | |
| Taurine | H‐M | 0.52 | |
| Carnosine | M‐L | 0.34 | |
| Keto(iso)leucine | M‐L | 0.36 | |
| Kynurenine | M‐L | 0.45 | |
| Quinolinic acid | M‐L | 0.44 | |
| S‐Adenosyl‐homocysteine | L | 0.75 |
Table 1B.
List of 44 metabolites that did not show a significant difference in abundance between young and elderly people
| Category | Compound | Peak abundance | Ratio (elderly/young) |
|---|---|---|---|
| Nucleosides, nucleobases, and derivatives (6) | Urate | H‐M | 0.79 |
| Dimethyl‐xanthine | H‐L | 1.35 | |
| Xanthine | H‐L | 0.93 | |
| Caffeine | M‐L | 1.05 | |
| Cytidine | M‐L | 0.98 | |
| Uridine | L | 0.64 | |
| Sugar phosphate (1) | Glucose−6‐phosphate | L | 0.78 |
| Vitamins and coenzymes (3) | Pantothenate | H‐M | 0.79 |
| 4‐Aminobenzoate | H‐L | 3.04 | |
| Nicotinamide | M‐L | 0.85 | |
| Choline and ethanolamine derivatives (2) | Phosphocholine | M | 0.66 |
| Phosphoethanolamine | L | 0.69 | |
| Carnitines (4) | Carnitine | H‐M | 0.82 |
| Acetyl‐carnitine | H‐L | 1.05 | |
| Hexanoyl‐carnitine | M‐L | 0.65 | |
| Propionyl‐carnitine | M‐L | 0.99 | |
| Organic acids (9) | Citrate | H‐M | 0.73 |
| 2‐Oxoglutarate | M‐L | 0.83 | |
| Arginino‐succinate | M‐L | 1.05 | |
| cis‐Aconitate | M‐L | 0.67 | |
| Citramalate | M‐L | 0.56 | |
| Glycochenodeoxycholate | M‐L | 0.69 | |
| Malate | M‐L | 0.89 | |
| Succinate | M‐L | 0.52 | |
| Glycerate | L | 0.54 | |
| Standard amino acids (4) | Arginine | H‐M | 0.89 |
| Tyrosine | M | 0.84 | |
| Glutamate | M‐L | 0.63 | |
| Proline | M‐L | 0.79 | |
| Methylated amino acids (7) | Betaine | H | 0.74 |
| Dimethyl‐proline | H‐M | 0.56 | |
| Trimethyl‐tryptophan | H‐L | 1.57 | |
| N6‐Methyl‐lysine | M‐L | 0.63 | |
| Trimethyl‐histidine | M‐L | 0.75 | |
| Trimethyl‐tyrosine | M‐L | 2.66 | |
| S‐Methyl‐ergothioneine | L | 0.83 | |
| Acetylated amino acids (2) | N‐Acetyl‐glutamate | M‐L | 0.71 |
| N‐Acetyl‐(iso)leucine | M‐L | 0.68 | |
| Other amino acids (6) | Hippurate | H | 0.65 |
| Acetyl‐carnosine | M‐L | 1.42 | |
| Citrulline | M‐L | 0.78 | |
| Creatine | M‐L | 0.79 | |
| S‐Adenosyl‐methionine | M‐L | 1.21 | |
| Ornithine | L | 0.79 |
3.4. Creatinine is an age marker
In clinical settings, creatinine is often used for normalization, as it is abundant and stable. Creatinine is also known as a urinary age marker. 1 We found that creatinine and many other age markers decline in elderly subjects, possibly due to similar causes. If creatinine is used for normalization of 3 age‐linked metabolites (dimethyl‐guanosine, tryptophan, N‐acetyl‐aspartate), such age‐linked differences vanish for tryptophan and N‐acetyl‐aspartate (Figure S1A), while dimethyl‐guanosine abundance in elderly urine diminished to a little more than half that of young adult samples. If age‐independent metabolites such as urate, citrate, caffeine, betaine are normalized against creatinine, their abundances in elderly urine exceeded those in young adult samples, causing false assignments (Figure S1B). Thus, for 44 urine age‐independent compounds, creatinine cannot be used for normalization.
Since urine concentration fluctuates daily due to factors such as water intake, it is common to use creatinine concentration for correcting the measured values. If metabolites of interest are age‐linked, normalization against creatinine might be appropriate. If not, correction of quantitative data with creatinine levels might miss certain compounds with interesting features. To check the consistency of urinary metabolite concentrations in first morning urine, we examined the diurnal variation of 8 representative metabolites that were less abundant in urine of elderly people. Three young subjects were asked to collect urine every morning for 5 days. Our data indicated that the diurnal variation of these metabolites was negligible in the same person (Figure S2).
3.5. Glutathione increased in elderly urine while other compounds declined sharply
Two compounds, myo‐Inositol and GSSG, were 1.34‐ and 6.96‐fold, more abundant, respectively, in elderly samples (Table 1A). The increase of GSSG was striking, though its abundance in urine was rather low (Figure S3A). GSSG (and glutathione, GSH) was virtually absent in urine of young adults, while it was abundant in elderly samples. myo‐Inositol, like GSSG increased in elderly urine (Figure S3H), a phenomenon which cannot be explained at present.
Creatinine was abundant in urine of young subjects (Figure S3B), but together with pseudouridine, isoleucine, leucine, dimethyl‐guanosine and N‐methyl‐guanosine, it declined sharply in urine of elderly subjects (Figure S3C–G). In fact, many metabolites diminished to less than half in urine of elderly subjects [fructose‐1,6‐diphosphate (0.14), carnosine (0.34), glycerophosphate (0.32), 2‐ and 3‐hydroxybutyrate (0.33, 0.27, respectively), and octanoyl‐carnitine (0.40)].
3.6. Highly correlated age‐linked urinary metabolites
To understand relationships among urine metabolites, Pearson's correlation coefficients were calculated from abundance data for all 55 age‐linked urinary metabolites of all 27 subjects. The highest correlation, 0.92, was obtained for isoleucine – leucine and N‐methyl guanosine – dimethyl guanosine (Figure 2A). This is probably due to their similar chemical structures and proximity in biochemical pathways (see below and KEGG, https://www.genome.jp/kegg/). However, correlation values (0.91) obtained for glycerol‐phosphate – 3‐hydroxybutyrate, pseudouridine – 2‐hydroxybutyrate, and pseudouridine – isoleucine clearly have a different explanation.
FIGURE 2.
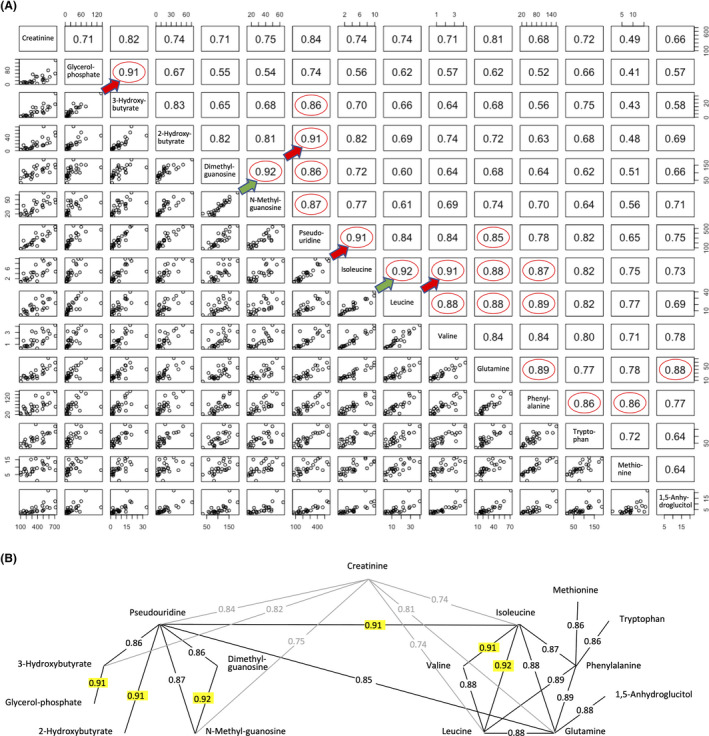
Correlation network among age‐linked compounds. (A) Values indicate correlation coefficients between paired compounds. Highly correlated pairs of aging markers (r > 0.85) are indicated with red circles. The most highly correlated pairs are indicated by green (0.92) and red arrows (0.91). (B) Interrelated compounds form a network. Correlations (r > 0.90) are highlighted in yellow. Creatinine was correlated with both groups (r = 0.74–0.84, shown in gray)
Pairwise correlation analyses revealed 19 pairs of compounds with correlation coefficients >0.85 (Figure 2). These show a network consisting of two groups, one centered around pseudouridine and the other around isoleucine (Figure 2). Creatinine is linked to both. This suggests that compounds within each of these groups may be metabolically linked.
The high correlation between pseudouridine and isoleucine seems to be a key connection between two groups of metabolites. Additionally, the connections of creatinine to pseudouridine and 3‐hydroxybutyrate, and of isoleucine to glutamine required further explanation. In the case of a creatinine‐related network, 11 metabolites have correlation coefficients from 0.71–0.84 (Figure 2A). Creatinine, a known waste product from muscle, 30 , 31 is thus correlated with a broad array of urinary metabolites.
When urinary compounds with correlation coefficients larger than 0.7 were selected, the majority of age‐linked metabolites formed a large network consisting of 42 metabolites from 55 age‐linked compounds (Figure S4). Since all age‐linked metabolites displayed p‐values <0.05 in dot plot profiling, the fact that the great majority (42/55 = 76%) form such a large age‐linked correlation network is quite impressive.
3.7. Some age‐linked metabolites were not highly correlated
Thirteen age‐marker compounds showed only weak correlations (<0.7) with the other 42 age‐linked urinary metabolites (Figure S5). Aspartate, a standard amino acid having an acidic side chain, showed maximal, but inverse correlation with GSSG (−0.67). Aspartate has a correlation coefficient of 0.65 with N‐acetyl‐aspartate, indicating that structural similarity might partly explain the weak correlation. S‐adenosyl‐homocysteine did not show correlation values higher than 0.48 (octanoyl‐carnitine). Lysine, dimethyl‐lysine, trimethyl‐lysine, and N6‐acetyl‐lysine did not show high correlation coefficients. Fructose‐1,6‐diphosphate showed a maximal correlation value (0.58) with pentose‐phosphate and gluconate. Whether these metabolites decline in elderly subjects as a consequence of aging or as a cause of it, remains to be investigated.
3.8. Heatmap analysis of urinary metabolites linked to aging
We then employed a heatmap to visualize the quantitative profile of age‐linked urinary metabolites in individual subjects (Figure 3). Since most of these metabolites declined in the elderly, matrix color represents metabolite abundance for individual subjects. Explanation of heatmap patterns is given in the legend of Figure 3. Thus, a heatmap of urinary metabolites graphically illustrates the degree of urinary metabolite aging for individual subjects, so that subjects may be compared one with another. Two subjects (elderly 11, 81F and young 15, 33 M) showed patterns remarkably like those of the opposite age group.
FIGURE 3.
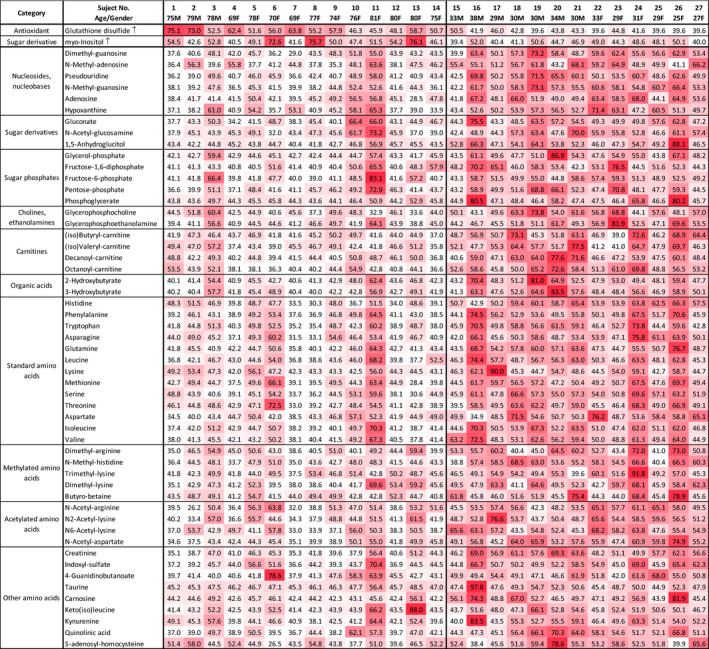
Heatmap representing urinary metabolic profiles of elderly and young subjects. Standardized data for each metabolite are shown for 27 subjects using a color matrix representing relative abundance data of 55 urinary aging markers. Numerical values indicate the t‐score, a kind of standardized score. The mean and standard deviation are 50 and 10, respectively. Color intensity of the cells reflects the t‐score. The mean and standard deviation are 50 and 10, respectively. Color intensity of the cells reflects the t‐score, indicating levels higher than average. T‐score <40 is white, low; 40 ~ 50 is thin red, slight low; 50–60 is moderate red, slight high; >60 is deep red, high. Elderly samples to the left were mostly white or pale red (lower level), except for myo‐inositol and GSSG, which were moderate or deep red (higher level)
3.9. Principal component analysis of age‐linked metabolites
Implications of urinary compounds in aging should also be cross‐examined using results of blood compound analyses. However, as these compounds decrease in urine of elderly people, the results are consistent with actual aging. Some urinary metabolites may be implicated in sustaining health and slowing aging. To integrate quantitative metabolite abundance data from individual subjects, abundances of these 55 age‐related metabolites were subjected to principal component analysis (PCA). 25 , 32 Subjects were separated into 2 groups representing negative and positive values of principal component (PC) 1, respectively (Figure 4A). One elderly subject 11 (81F) was in the middle of the young group and one young subject 15 (33 M) was in the group of elderly subjects in the PCA plot (Figure 4A). These are consistent with results plotted in the heatmap (Figure 3). The PC1 score and chronological age of the subject were highly correlated (r = 0.80) (Figure 4B).
FIGURE 4.
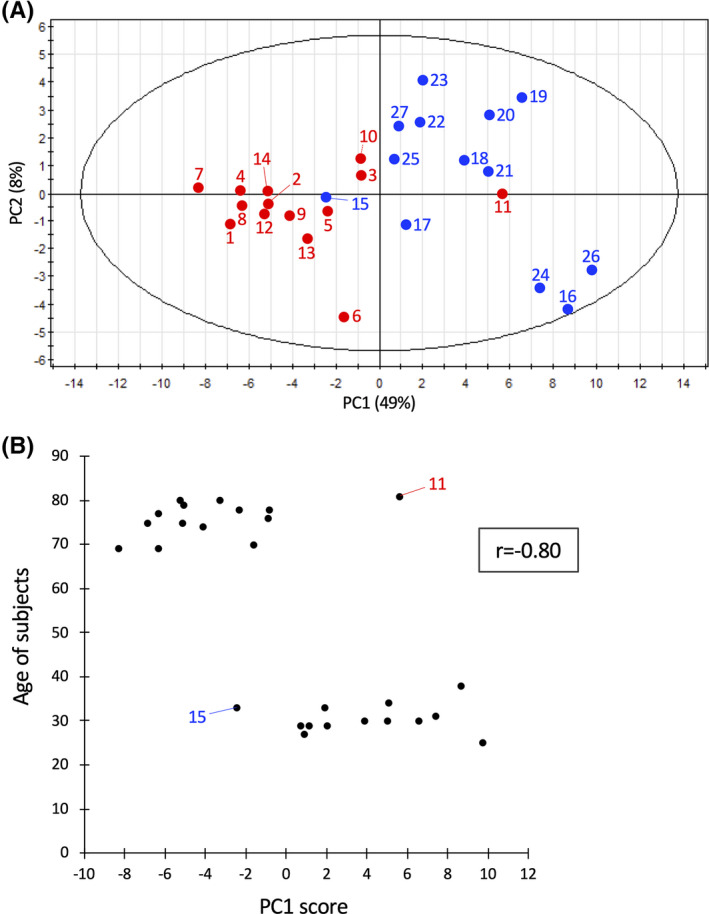
PCA of 55 aging markers. (A) Thirteen young and 14 elderly subjects are shown in blue and red, respectively, with their subject numbers (indicated in the heatmap Figure 3). PC1 reflected the abundance of the compounds with strong correlation networks, such as pseudouridine and isoleucine (see Figure 2B and Figure S4). PC2 comprised metabolites that were not strongly correlated (glycerophosphocholine, S‐adenosyl‐homocysteine, etc.), but that were isolated from a strong correlation network. (B) PC1 score of each subject (X‐axis) is plotted versus subject age (Y‐axis). Subject 11 (F, age 81) is has a heatmap profile of a young person (Figure 3), while subject 15 (M, age 33) has an exceptionally elderly heatmap profile. The correlation coefficient is shown in the box
3.10. Negative correlation between GSSG and age‐linked metabolites
GSSG showed significant negative correlations with some age‐linked metabolites (N‐acetyl‐aspartate, N‐methyl‐guanosine, dimethyl‐guanosine, pseudouridine, quinolinic acid, creatinine, N‐methyl‐histidine, etc.) (Figure 5A). While the oxidized disulfide form was detected in elderly samples, but the reduced form was not detected in young or elderly samples. Thus only the inactive form of glutathione was detected in elderly samples. A possible interpretation is that the active reduced form glutathione (GSH) may be very reactive and short‐lived as a metabolite (see Discussion). The abundance of GSSG in 27 subjects is shown together with N‐acetyl‐aspartate, N‐methyl‐guanosine, dimethyl‐guanosine, pseudouridine, and chronological age of subject (Figure 5B‐F). GSSG was low to undetectable in 5 young subjects, but accumulated in elderly samples (Figure 5F).
FIGURE 5.
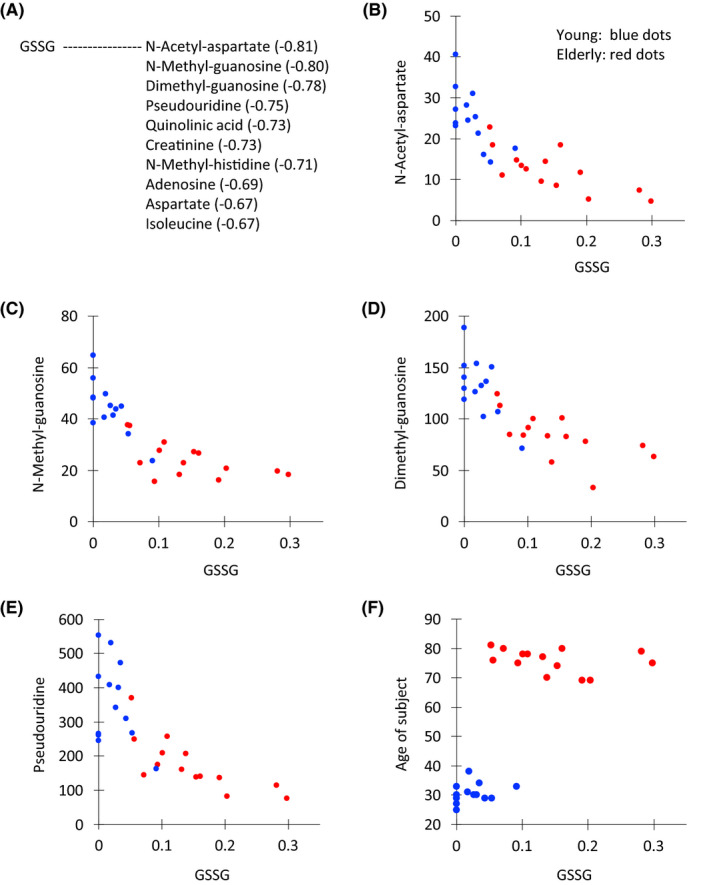
Scatter plots between GSSG and correlated compounds or age. (A) Ten metabolites with the relatively high correlations with GSSG are listed. Scatter plot of the peak abundance (×106 AU) between GSSG and N‐acetyl aspartate (B), N‐methyl guanosine (C), dimethyl guanosine (D), pseudouridine (E), and the age of the subject (F). Dots for young and elderly subjects are blue and red, respectively
GSSG showed different degrees of abundance in different subjects, and was virtually absent in young subjects, but in elderly subjects, its abundance increased and paralleled the abundance of creatinine in young subjects (Figure S3A,B). Thus GSSG abundance was inversely related to aging. The reason for this increase of GSSG in elderly urine is probably due to the absence or declining effectiveness of a mechanism to metabolize and reprocess GSSG by the elderly. Such a reductive mechanism does exist in young subjects; however, the redox environment regarding glutathione appears to be altered during aging. Inability or declined efficiency to reduce oxidized GSSG at any recycling step may accelerate aging.
4. DISCUSSION
We initially investigated metabolomics of a simple model eukaryote, fission yeast (Schizosaccharomyces pombe) using yeast genetic technology to identify and determine metabolite profiles in wild type and mutant cell extracts, 28 , 33 , 34 , 35 , 36 , 37 later embarking on human blood metabolomics. 12 , 25 , 26 , 27 By adapting the software MZmine 2 for metabolite identification, 29 , 38 we found that metabolomics of fission yeast and humans are surprisingly similar in regard to metabolite composition. 27 Metabolites detected in fission yeast and human whole blood were 75% identical. Given this unexpected similarity, we adapted our techniques to human blood metabolites to better understand health, disease, and longevity. 12 , 25 , 26 , 27 We then undertook human fluids collected non‐invasively, such as urine and saliva.
4.1. Distinction of aging information between blood and urine
Urinary metabolites offer a valuable, non‐invasive means of obtaining age‐related information. The present results suggest that urinary age information may be distinct from that obtainable from blood. Blood metabolites derived from plasma and red blood cells of elderly subjects reflect a decrease in antioxidant production and muscle activity, or increasing inefficiency of nitrogen metabolism. 12 Blood of frail elderly provided aging information on decline of locomotive, cognitive and oxido‐reductive ability. 25
In this study, we identified 55 age‐related metabolites. Many of them are highly correlated. In urine, creatinine has been well established as an age marker. 1 , 2 Roughly a half of urine metabolites including creatinine are highly correlated, forming a large network. These 55 urine metabolites include anti‐oxidants, amino acids and modified sugars, and metabolites of nucleosides, organic acids, and carnitines (Figure S4). Their abundances were reduced, except for the increase of GSSG and myo‐inositol. Aging information obtained from urine metabolites may be useful in different ways from blood metabolites. Aging due to declining kidney function, for example, should be a primary research target. Since urine contains 99 compounds, many urinary metabolites such as vitamins (pantothenate and nicotinamide) and organic acids (citrate, malate) neither significantly decreased nor increased so that about a half of urinary metabolites are age‐independent (listed in Table 1B). In aged subjects, levels of protein, nucleic acid and lipid may decrease due to reduced physical activity, 39 , 40 , 41 resulting in declining metabolite abundances in urine. Metabolite data may be considered as an overview of the physiological state of all tissues and organs. Hence these 55 metabolites constitute a panorama of human aging as seen through urine composition. However, the role of age‐independent metabolites is much less understood. Their correlations are also lower than those of age‐linked metabolites. Further study is required.
4.2. Glutathione disulfide, myo‐inositiol, and pseudouridine
Two exceptional urinary age metabolites, myo‐inositol and GSSG, increased in elderly samples (1.34‐ and 6.96‐fold, respectively). myo‐Inositol may be an important second messenger when phosphorylated, causing changes in [Ca2+]. 42 , 43 In the correlation analysis, myo‐inositol was not highly correlated with any other metabolite (Figure S5). Glycerophosphocholine and N‐methyl‐adenosine showed weak, negative correlations with myo‐inositol (−0.47and −0.43, respectively, Figure S5). Implications of the myo‐inositol increase in urine of elderly people remain unclear.
GSSG that we detected was the inactive, oxidized form of GSH. It sharply increased in elderly urine (Figures 1 and S3A). The active SH form of GSH seems to be very unstable and it is difficult to prevent its degradation during preparation of urine (the present study) and blood samples. 12 The active SH form was rapidly oxidized to an inactive disulfide form, which accumulated in elderly subjects, whereas in young subjects the disulfide form GSSG was hardly formed or undetected possibly due to rapid decay in the young body or sample. Consistently, GSSG was undetectable in urine of the five young subjects (Figure S3A). The abundance of GSSG was inversely related to concentrations of pseudouridine, creatinine, and dimethyl‐guanosine, which were most abundant in young subjects (Figures 5 and S3). Thus the redox compound GSSG in urine appears to be appropriate as an age marker in urine of elderly subjects. In contrast, the high abundance of the nucleoside, pseudouridine, seems to be emblematic of youth.
4.3. Highly correlated urine metabolites
Fifteen metabolites, comprising two groups, are highly correlated (correlation coefficients >0.85, Figure 2A,B). One includes nucleosides pseudouridine, dimethyl‐guanosine, N‐methyl‐guanosine and 2‐ or 3‐hydroxybutyrate and the other group contains branched‐chain and aromatic amino acids. Correlation within each group was high, but was not always high between the two subgroups (0.65 for pseudouridine and methionine, and 0.56 for glycerol‐phosphate and isoleucine; Figure 2). It remains to be determined what kind of functional connections exist between these two groups of metabolites in health and disease. In addition, a number of compounds showing correlation coefficients >0.70 are only remotely related structurally. Therefore, the high correlations of urinary compounds cannot all be easily explained. While isoleucine, leucine, and valine contain hydrophobic side chains, glutamine, having a hydrophilic sidechain, showed correlation coefficients of 0.88‐0.89 with isoleucine. Pseudouridine was highly correlated with 10 other compounds (>0.82), although we are unable to offer an explanation for this at present. The high correlation (0.83) between 2‐hydroxybutyrate and 3‐hydroxybutyrate may be explained by their structural relatedness, but their correlations in the range of 0.6‐0.82 with 10 other compounds are difficult to explain.
4.4. Thirteen metabolites linked by low correlation
Thirteen age‐related metabolites that showed only low correlation coefficients include myo‐inositol, two regular amino acids (aspartate and lysine), methylated or acetylated amino acids, keto(iso)leucine, etc (Figure S5). Creatinine, an abundant aging marker 1 and an amino acid waste product in muscle and other tissues showed higher correlations (0.71–0.84, Figure 2A,B). Its urinary content decreased to 43% in elderly samples (Tables 1A and 1B). More than half (31) of the declining age markers in urine were amino acids (standard, methylated, acetylated, and other), and 6 more are nucleosides, nucleobases, and their derivatives. Protein degradation and nucleic acid turnover seem to cause the change in urine of elderly persons. Pseudouridine is an oxidized tRNA component, 44 perhaps important in catabolism of nucleosides and other compounds, as it is highly correlated with purine nucleosides (adenosine, guanosine, and inosine), muscle amino acids (isoleucine, creatinine), and organic acids (hydroxybutyrates, glycerol‐phosphate). Pseudouridine is also abundant in blood, but the amount in urine is 15‐fold higher. Pseudouridine showed high correlation coefficients with 10 compounds (Figure 2) and its high abundance in urine may provide a convenient youth marker.
4.5. An effective overview on aging by heatmap
Heatmap analysis of age‐linked metabolites provides an effective overview of aging patterns using urinary metabolite profiles of individual subjects. Heatmap patterns are convenient for visualizing differences between young and aged subjects and also individual variations within and between groups (Figure 3). PCA was useful to categorize a group of subjects because of its capacity to integrate a large collection of data about various metabolites. Elderly and young subjects were clearly separated into two populations, with two exceptions (subjects 11 and 15) in the present study (Figure 4). Exceptional individuals are of considerable interest, by virtue of their persistent youth or premature aging, if these truly represent metabolic features in endocrine system. Their unusual profiles may be worthy of further investigation. Among 55 age‐related urinary markers, 13 compounds did not show correlations >0.7 (Figure S5). We determined the correlations of these 13 compounds with all metabolites. Age‐related metabolites such as myo‐inositol, S‐adenosyl‐homocysteine, N‐methyl‐adenosine, lysine, trimethyl‐lysine, fructose‐1,6‐diphosphate, and glycerophosphocholine are only weakly correlated (~0.6) (Figure S5). Thus, high correlation is not necessarily required of age‐related compounds. These metabolites that are only remotely correlated are of interest to better understand the metabolic breadth of human aging.
CONFLICT OF INTEREST
The authors declare that they have no competing interests.
AUTHOR CONTRIBUTIONS
M. Yanagida and T. Teruya conceived the research plan and wrote the paper. T. Teruya and H. Goga performed the experiments.
Supporting information
Supplementary Material
ACKNOWLEDGMENTS
The authors thank Ms. Junko Takada for providing excellent technical assistance. The authors also thank the editorial help of Dr. Steven D. Aird. Additionally, the authors also thank the generous support of Okinawa Institute of Science and Technology Graduate University and its Innovative Technology Research (ITR) fund.
Teruya T, Goga H, Yanagida M. Aging markers in human urine: A comprehensive, non‐targeted LC‐MS study.. FASEB BioAdvances. 2020;2:720–733. 10.1096/fba.2020-00047
[Correction added on November 19, 2020, after first online publication: affiliation 2 has been updated correctly.]
REFERENCES
- 1. Siersbaek‐Nielsen K, Mølholm Hansen J, Kampmann J, Kristensen M. Rapid evaluation of creatinine clearance. Lancet. 1971;297:1133‐1134. [DOI] [PubMed] [Google Scholar]
- 2. Rowe JW, Andres R, Tobin JD, Norris AH, Shock NW. The effect of age on creatinine clearance in men: a cross‐sectional and longitudinal study. J Gerontol. 1976;31:155‐163. [DOI] [PubMed] [Google Scholar]
- 3. Ames BN. Endogenous DNA damage as related to cancer and aging. Mutat Res. 1989;214:41‐46. [DOI] [PubMed] [Google Scholar]
- 4. Short KR, Bigelow ML, Kahl J, et al. Decline in skeletal muscle mitochondrial function with aging in humans. Proc Natl Acad Sci U S A. 2005;102:5618‐5623. [DOI] [PMC free article] [PubMed] [Google Scholar]
- 5. Slupsky CM, Rankin KN, Wagner J, et al. Investigations of the effects of gender, diurnal variation, and age in human urinary metabolomic profiles. Anal Chem. 2007;79:6995‐7004. [DOI] [PubMed] [Google Scholar]
- 6. Lawton KA, Berger A, Mitchell M, et al. Analysis of the adult human plasma metabolome. Pharmacogenomics. 2008;9:383‐397. [DOI] [PubMed] [Google Scholar]
- 7. Mishur RJ, Rea SL. Applications of mass spectrometry to metabolomics and metabonomics: detection of biomarkers of aging and of age‐related diseases. Mass Spectrom Rev. 2012;31:70‐95. [DOI] [PubMed] [Google Scholar]
- 8. Yu Z, Zhai G, Singmann P, et al. Human serum metabolic profiles are age dependent. Aging Cell. 2012;11:960‐967. [DOI] [PMC free article] [PubMed] [Google Scholar]
- 9. Menni C, Kastenmuller G, Petersen AK, et al. Metabolomic markers reveal novel pathways of ageing and early development in human populations. Int J Epidemiol. 2013;42:1111‐1119. [DOI] [PMC free article] [PubMed] [Google Scholar]
- 10. Gonzalez‐Covarrubias V, Beekman M, Uh HW, et al. Lipidomics of familial longevity. Aging Cell. 2013;12:426‐434. [DOI] [PMC free article] [PubMed] [Google Scholar]
- 11. Auro K, Joensuu A, Fischer K, et al. A metabolic view on menopause and ageing. Nat Commun. 2014;5:4708. [DOI] [PubMed] [Google Scholar]
- 12. Chaleckis R, Murakami I, Takada J, Kondoh H, Yanagida M. Individual variability in human blood metabolites identifies age‐related differences. Proc Natl Acad Sci U S A. 2016;113:4252‐4259. [DOI] [PMC free article] [PubMed] [Google Scholar]
- 13. Hertel J, Friedrich N, Wittfeld K, et al. Measuring biological age via metabonomics: the metabolic age score. J Proteome Res. 2016;15:400‐410. [DOI] [PubMed] [Google Scholar]
- 14. Jove M, Mate I, Naudi A, et al. Human aging is a metabolome‐related matter of gender. J Gerontol A Biol Sci Med Sci. 2016;71:578‐585. [DOI] [PubMed] [Google Scholar]
- 15. Rist MJ, Roth A, Frommherz L, et al. Metabolite patterns predicting sex and age in participants of the Karlsruhe Metabolomics and Nutrition (KarMeN) study. PLoS One. 2017;12:e0183228. [DOI] [PMC free article] [PubMed] [Google Scholar]
- 16. Chak CM, Lacruz ME, Adam J, et al. Ageing investigation using two‐time‐point metabolomics data from KORA and CARLA studies. Metabolites. 2019;9:44. [DOI] [PMC free article] [PubMed] [Google Scholar]
- 17. Thevenot EA, Roux A, Xu Y, Ezan E, Junot C. Analysis of the human adult urinary metabolome variations with age, body mass index, and gender by implementing a comprehensive workflow for univariate and OPLS statistical analyses. J Proteome Res. 2015;14:3322‐3335. [DOI] [PubMed] [Google Scholar]
- 18. Han WK, Bailly V, Abichandani R, Thadhani R, Bonventre JV. Kidney Injury Molecule‐1 (KIM‐1): a novel biomarker for human renal proximal tubule injury. Kidney Int. 2002;62:237‐244. [DOI] [PubMed] [Google Scholar]
- 19. Eknoyan G, Hostetter T, Bakris GL, et al. Proteinuria and other markers of chronic kidney disease: a position statement of the national kidney foundation (NKF) and the national institute of diabetes and digestive and kidney diseases (NIDDK). Am J Kidney Dis. 2003;42:617‐622. [DOI] [PubMed] [Google Scholar]
- 20. Mishra J, Dent C, Tarabishi R, et al. Neutrophil gelatinase‐associated lipocalin (NGAL) as a biomarker for acute renal injury after cardiac surgery. Lancet. 2005;365:1231‐1238. [DOI] [PubMed] [Google Scholar]
- 21. Parikh CR, Mishra J, Thiessen‐Philbrook H, et al. Urinary IL‐18 is an early predictive biomarker of acute kidney injury after cardiac surgery. Kidney Int. 2006;70:199‐203. [DOI] [PubMed] [Google Scholar]
- 22. Pisitkun T, Johnstone R, Knepper MA. Discovery of urinary biomarkers. Mol Cell Proteomics. 2006;5:1760‐1771. [DOI] [PubMed] [Google Scholar]
- 23. Vaidya VS, Waikar SS, Ferguson MA, et al. Urinary biomarkers for sensitive and specific detection of acute kidney injury in humans. Clin Transl Sci. 2008;1:200‐208. [DOI] [PMC free article] [PubMed] [Google Scholar]
- 24. Witte EC, Lambers Heerspink HJ, de Zeeuw D, Bakker SJ, de Jong PE, Gansevoort R. First morning voids are more reliable than spot urine samples to assess microalbuminuria. J Am Soc Nephrol. 2009;20:436‐443. [DOI] [PMC free article] [PubMed] [Google Scholar]
- 25. Kameda M, Teruya T, Yanagida M, Kondoh H. Frailty markers comprise blood metabolites involved in antioxidation, cognition, and mobility. Proc Natl Acad Sci USA. 2020;117:9483‐9489. [DOI] [PMC free article] [PubMed] [Google Scholar]
- 26. Teruya T, Chaleckis R, Takada J, Yanagida M, Kondoh H. Diverse metabolic reactions activated during 58‐hr fasting are revealed by non‐targeted metabolomic analysis of human blood. Sci Rep. 2019;9:854. [DOI] [PMC free article] [PubMed] [Google Scholar]
- 27. Chaleckis R, Ebe M, Pluskal T, Murakami I, Kondoh H, Yanagida M. Unexpected similarities between the Schizosaccharomyces and human blood metabolomes, and novel human metabolites. Mol Biosyst. 2014;10:2538‐2551. [DOI] [PubMed] [Google Scholar]
- 28. Pluskal T, Nakamura T, Villar‐Briones A, Yanagida M. Metabolic profiling of the fission yeast S. pombe: quantification of compounds under different temperatures and genetic perturbation. Mol Biosyst. 2010;6:182‐198. [DOI] [PubMed] [Google Scholar]
- 29. Pluskal T, Castillo S, Villar‐Briones A, Oresic M. MZmine 2: modular framework for processing, visualizing, and analyzing mass spectrometry‐based molecular profile data. BMC Bioinformatics. 2010;11:395. [DOI] [PMC free article] [PubMed] [Google Scholar]
- 30. Heymsfield SB, Arteaga C, McManus C, Smith J, Moffitt S. Measurement of muscle mass in humans: validity of the 24‐hour urinary creatinine method. Am J Clin Nutr. 1983;37:478‐494. [DOI] [PubMed] [Google Scholar]
- 31. Baxmann AC, Ahmed MS, Marques NC, et al. Influence of muscle mass and physical activity on serum and urinary creatinine and serum cystatin C. Clin J Am Soc Nephrol. 2008;3:348‐354. [DOI] [PMC free article] [PubMed] [Google Scholar]
- 32. Nakamura E, Miyao K, Ozeki T. Assessment of biological age by principal component analysis. Mech Ageing Dev. 1988;46:1‐18. [DOI] [PubMed] [Google Scholar]
- 33. Pluskal T, Nakamura T, Yanagida M. Preparation of intracellular metabolite extracts from liquid Schizosaccharomyces pombe cultures. Cold Spring Harb Protoc 2016, pdb.prot091553. [DOI] [PubMed] [Google Scholar]
- 34. Pluskal T, Yanagida M. Measurement of metabolome samples using liquid chromatography–mass spectrometry, data acquisition, and processing. Cold Spring Harb Protoc. 2016;2016(12), pdb.prot091561. [DOI] [PubMed] [Google Scholar]
- 35. Pluskal T, Yanagida M. Metabolomic analysis of Schizosaccharomyces pombe: sample preparation, detection, and data interpretation. Cold Spring Harb Protoc. 2016: pdb.top079921. [DOI] [PubMed] [Google Scholar]
- 36. Nakazawa N, Teruya T, Sajiki K, et al. The putative ceramide‐conjugation protein Cwh43 regulates G0 quiescence, nutrient metabolism and lipid homeostasis in fission yeast. J Cell Sci. 2018;131:jcs217331. [DOI] [PubMed] [Google Scholar]
- 37. Sajiki K, Tahara Y, Uehara L, Sasaki T, Pluskal T, Yanagida M. Genetic regulation of mitotic competence in G0 quiescent cells. Sci Adv. 2018;4:eaat5685. [DOI] [PMC free article] [PubMed] [Google Scholar]
- 38. Pluskal T, Uehara T, Yanagida M. Highly accurate chemical formula prediction tool utilizing high‐resolution mass spectra, MS/MS fragmentation, heuristic rules, and isotope pattern matching. Anal Chem. 2012;84:4396‐4403. [DOI] [PubMed] [Google Scholar]
- 39. Hughes VA, Frontera WR, Roubenoff R, Evans WJ, Singh MA. Longitudinal changes in body composition in older men and women: role of body weight change and physical activity. Am J Clin Nutr. 2002;76:473‐481. [DOI] [PubMed] [Google Scholar]
- 40. Pollack M, Phaneuf S, Dirks A, Leeuwenburgh C. The role of apoptosis in the normal aging brain, skeletal muscle, and heart. Ann N Y Acad Sci. 2002;959:93‐107. [DOI] [PubMed] [Google Scholar]
- 41. Maynard S, Fang EF, Scheibye‐Knudsen M, Croteau DL, Bohr VA. DNA Damage, DNA Repair, Aging, and Neurodegeneration. Cold Spring Harb Perspect Med. 2015;5:a025130. [DOI] [PMC free article] [PubMed] [Google Scholar]
- 42. Berridge MJ. Inositol trisphosphate and calcium signalling. Nature. 1993;361:315‐325. [DOI] [PubMed] [Google Scholar]
- 43. Berridge MJ. The inositol trisphosphate/calcium signaling pathway in health and disease. Physiol Rev. 2016;96:1261‐1296. [DOI] [PubMed] [Google Scholar]
- 44. Charette M, Gray MW. Pseudouridine in RNA: what, where, how, and why. IUBMB Life. 2000;49:341‐351. [DOI] [PubMed] [Google Scholar]
Associated Data
This section collects any data citations, data availability statements, or supplementary materials included in this article.
Supplementary Materials
Supplementary Material