


Abstract
In vertebrates, DNA methylation predominantly occurs at CG dinucleotides however, widespread non-CG methylation (mCH) has been reported in mammalian embryonic stem cells and in the brain. In mammals, mCH is found at CAC trinucleotides in the nervous system, where it is associated with transcriptional repression, and at CAG trinucleotides in embryonic stem cells, where it positively correlates with transcription. Moreover, CAC methylation appears to be a conserved feature of adult vertebrate brains. Unlike any of those methylation signatures, here we describe a novel form of mCH that occurs in the TGCT context within zebrafish mosaic satellite repeats. TGCT methylation is inherited from both male and female gametes, remodelled during mid-blastula transition, and re-established during gastrulation in all embryonic layers. Moreover, we identify DNA methyltransferase 3ba (Dnmt3ba) as the primary enzyme responsible for the deposition of this mCH mark. Finally, we observe that TGCT-methylated repeats are specifically associated with H3K9me3-marked heterochromatin suggestive of a functional interplay between these two gene-regulatory marks. Altogether, this work provides insight into a novel form of vertebrate mCH and highlights the substrate diversity of vertebrate DNA methyltransferases.
INTRODUCTION
Methylation of cytosines within the CG dinucleotide context is the most abundant DNA modification in vertebrate genomes (1). CG methylation (mCG) is found in all vertebrate cell types and is known to participate in long-term gene silencing processes (2). In vertebrates, ∼80% of all genomic CG dinucleotides are methylated (3). Nevertheless, methylation of other cytosine dinucleotides (mCH, H = T, G, A), albeit at much lower levels (1–3%), has also been described (4). mCH is most commonly found in mammalian embryonic stem cells (ESCs) and in the brain, however, mCH has been identified at residual levels in many other human tissues (5–7). Unlike mCG, mCH methylation is not maintained after cell division by DNA methyltransferase 1 (DNMT1), and therefore requires constant activity of de novo DNMT3 enzymes. mCH deposition is carried out by both DNMT3A and DNMT3B, mostly at CAC or CAG trinucleotides respectively, suggestive of significant sequence specificity during DNMT3 recruitment (4,8). Low levels of mCT within the CTG motif have also been previously detected in mammalian tissues (6,9–10), in line with the enzymatic properties of mammalian de novo DNMTs (11,12).
In mammalian brains, mCH levels are inversely correlated with transcription of the associated gene, whereas this pattern appears to be the opposite in embryonic stem cells (5,6). In mammals, mCH at very low levels (∼1%) is inherited from oocytes but is rapidly diluted during cleavage stages (13,14). mCH re-emerges during nervous system development, specifically in neurons, to become the dominant form of DNA methylation in the mammalian neuronal genome (5). In agreement with these findings, mCH displays considerable remodelling during iPSC reprogramming and direct conversion of fibroblasts to neurons (15–17). Despite the unresolved roles of mCH in gene regulation, a clearer picture of mCH readout is starting to emerge. A number of recent studies have demonstrated that mCH can be bound by canonical methylation readers, such as MeCP2, which is mutated in Rett Syndrome (18,19). MeCP2 can repress transcription by binding to mCH, specifically within long genes (20–22). Interestingly, the altered readout of mCH but not mCG deposited by DNMT3A appears to play a central role in Rett Syndrome pathogenesis (23). Preferential methylation at CAC trinucleotides has also been recently reported as a conserved feature of adult vertebrate brains (24). The same work revealed that the mCH reading (MeCP2) and writing (DNMT3A) system can be traced back to the root of vertebrates and that it could have participated in the evolution of vertebrate brain complexity. Given that DNMT3A and DNMT3B are vertebrate-specific paralogues that are well conserved throughout the lineage, the expectation would be that mCH in vertebrate genomes follows either CAC or CAG contexts. However, currently very little is known about the developmental dynamics, function, and sequence specificity of mCH in non-mammalian vertebrates.
Using whole genome bisulphite sequencing (WGBS) and enzymatic methylation sequencing (EM-seq) here we uncover a novel form of mCH, which occurs within the TGCT tetranucleotide at zebrafish satellite repeats and which is present at significantly higher levels than any other mCH type described to date. TGCT methylation is inherited from maternal and paternal gametes, gradually diluted to reach its lowest point at zygotic genome activation (ZGA), and re-established coinciding with gastrulation in all embryonic layers. Moreover, we uncover that this form of mCH is deposited by an actinopterygian-specific DNMT enzyme - Dnmt3ba and is specifically associated with the repressive histone mark H3K9me3, suggestive of a link between mCH and heterochromatin. On the whole, this work describes a novel substrate of vertebrate DNMTs and demonstrates for the first time how mCH is remodelled during the anamniote life cycle.
MATERIALS AND METHODS
Zebrafish usage and ethics
Zebrafish work was approved by the Garvan Institute of Medical Research Animal Ethics Committee under AEC approval 17/22. All procedures performed complied with the Australian code of practice for care and use of animals for scientific purposes. Adult wild type (AB/Tübingen) Danio rerio (zebrafish) were bred in a 1:1 male/female ratio. Embryos were collected 0 hours post-fertilisation (hpf) and incubated in 1× E3 medium (0.03% NaCl, 0.005% CaCl2, 0.0013% KCl, 99.9557% H2O, 0.008% H14MgO11S) for 24–72 h at 28.5°C.
CRISPR/Cas9 zebrafish knockouts
Guide RNAs (gRNA) were designed with CRISPRscan (25). DNA templates for gRNA synthesis were prepared by annealing a universal oligo with a target specific oligo (Supplementary Table S1), followed by 20 cycles of PCR amplification. gRNA was produced by in vitro transcription with the AMPLISCRIBE™ T7-FLASH™ TRANSCRIPTION KIT (Lucigen, WIS, USA). CRISPR/Cas9 microinjection mixtures were prepared by combining a total of 1000 ng gRNA with 1 μl EnGene CAS9 NLS, S. pyogenes (New England BioLabs, Ipswich, MA, USA) and 1.5 μl KCl (1M). 500 pl of microinjection mixture was injected into one-cell stage embryos. To calculate knockout efficiencies, targeted genomic loci were amplified by PCR followed by ligation to NEXTFLEX Bisulfite-Seq barcodes (PerkinElmer, Waltham, MA, USA). The products were spiked into RRBS libraries, sequenced on the Illumina HiSeqX platform, and analysed using CRISPResso (26). RNA for qPCR analysis was extracted using TRIsure (Bioline) and cDNA was produced using SensiFAST™ cDNA Synthesis Kit (Bioline), following the manufacturer's protocol. Relative expression levels were calculated using the 2−ΔΔCT method with bactin serving as the control transcript. Two sample t-tests were performed using CT values by combining the biological and technical replicates into WT and cKO groups. qPCR primer sequences are provided in Supplementary Table S1.
Genomic DNA extraction
Genomic DNA (gDNA) was extracted from 24hpf embryos, 48hpf embryos and 72hpf larvae in pools (n = 10) using the QIAGEN DNeasy Blood & Tissue Kit (QIAGEN, Chadstone, VIC, Australia) according to manufacturer's instructions. All experiments were performed in two biological replicates. 24hpf embryos were dechorionated using 1 mg/ml Pronase (Sigma-Aldrich, St. Louis, MO, USA) diluted in 1× E3 medium, snap-frozen in liquid nitrogen, and stored at –80°C prior to DNA extraction.
Enzymatic methylation sequencing (EM-seq)
EM-seq library construction was performed using the NEBNext Enzymatic Methyl-seq Kit (New England BioLabs, Ipswich, MA, USA) according to manufacturer's instructions with minor modifications. 0.02 ng of unmethylated lambda phage DNA (Promega, Madison, WI, USA) and 0.0001 ng of pUC19 plasmid methylated at 100% of CpG sites (New England BioLabs, Ipswich, MA, USA) were used as spike-in controls to determine the efficiency of APOBEC deamination and TET2 oxidation, respectively. Briefly, 200 ng of zebrafish gDNA was sonicated to an average insert size of 300 bp. Input DNA concentration was selected according to the optimal input amount as recommended by the manufacturer. Sonicated DNA was end-repaired followed by ligation of adapters to DNA overnight using NEXTFLEX Bisulfite-Seq barcodes (PerkinElmer, Waltham, MA, USA). DNA was treated with TET2 for 1 h. Following TET2 oxidation, DNA was denatured with 0.1 M NaOH then treated with APOBEC for three hours. DNA was then PCR-amplified (8 cycles). Library concentration was quantified by qPCR using KAPA Library Quantification Kit (Sigma-Aldrich, St. Louis, MO, USA). 150pmol of the combined libraries with 15% PhiX spike-in was sequenced on the Illumina HiSeqX platform (150 bp paired-end sequencing, high output mode).
Whole genome bisulphite sequencing (WGBS)
WGBS libraries were prepared from 500 ng of zebrafish gDNA spiked with 0.025ng of unmethylated lambda phage DNA (Promega, Madison, WI, USA). The DNA was sonicated to an average insert size of 300 bp followed by end repair and overnight ligation of adapters using NEXTFLEX Bisulfite-Seq barcodes (PerkinElmer, Waltham, MA, USA). DNA was bisulphite-converted using EZ DNA Methylation Gold Kit (Zymo Research, Irvine, CA, USA) according to manufacturer's instructions. Library amplification was performed with KAPA HiFi HotStart Uracil+ DNA polymerase (Kapa Biosystems, Woburn, MA), using 8 cycles of amplification. Library concentration was quantified through qPCR using KAPA Library Quantification Kit (Sigma-Aldrich, St. Louis, MO, USA) according to manufacturer's instructions. The combined libraries with 15% PhiX spike-in were sequenced on the Illumina HiSeqX platform (150 bp paired-end sequencing, high output mode).
Reduced representation bisulphite sequencing (RRBS)
RRBS libraries were prepared from 500 ng of zebrafish gDNA spiked with 0.025 ng of unmethylated lambda phage DNA (Promega, Madison, WI, USA). The DNA was digested for 2 h with 10 U BccI and 10U SspI (New England BioLabs, Ipswich, MA, USA), with the exception of uhrf1 cKO libraries which were digested with 20 U MspI. 5′ overhangs of the digested DNA were filled-in and A-tailed using Klenow fragment exo- (New England BioLabs, Ipswich, MA, USA), followed by an overnight ligation of NEXTFLEX Bisulfite-Seq barcodes (PerkinElmer, Waltham, MA, USA). DNA was bisulphite-converted using EZ DNA Methylation Gold Kit (Zymo Research,Irvine,CA,USA), according to manufacturer's instructions. Library amplification was performed with KAPA HiFi HotStart Uracil+ DNA polymerase (Kapa Biosystems, Woburn, MA, USA), using 13 cycles of amplification. Library concentration was quantified by qPCR using KAPA Library Quantification Kit (Sigma-Aldrich, St. Louis, MO, USA) according to manufacturer's instructions. The combined libraries with 15% PhiX spike-in were sequenced on the Illumina HiSeqX platform (150 bp paired-end sequencing, high output mode).
WGBS, EM-seq, and RRBS data analyses
Bisulphite-converted (WGBS) and APOBEC-converted (EM-seq) (27) sequence reads were trimmed with Trimmomatic (ILLUMINACLIP:TruSeq3-SE.fa:2:30:10 SLIDINGWINDOW:5:20 LEADING:3 TRAILING:3 MINLEN:20 (28), and mapped using WALT (-m 5 -t 20 -N 10000000) (29) onto the bisulphite-converted GRCz11 reference (UCSC) containing λ (WGBS and EM-seq) and pUC19 sequences (EM-seq) added as separate chromosomes. The resulting alignments in BAM format were deduplicated (30) and processed with CGmapTools (31) (convert bam2cgmap) to obtain methylation calls. ATCGmap files were parsed to discard CH positions that showed evidence of a CG position in the reads discordant with the reference genome CH annotation (24). RRBS data were analysed in the same way as WGBS, however, the additional options of: HEADCROP:5 CROP:140 at the trimming step were added and no deduplication was performed. Genomic data were visualized in UCSC (32) and IGV (33) browsers.
DNA sequence motif analyses
Genotype-corrected CGmap files were filtered for CH positions covered by at least 10 reads and sorted by methylation level (mC/C). Top positions (n = 10 000) were then extracted from the reference genome using BEDTools (34) taking the flanking upstream and downstream base pairs (n = 5) and preserving the strand information. The resulting FASTA file was used as input for HOMER ‘findMotifs.pl’ function (35) to search for de novo (-S 5) motifs of length 8 (-len 8) with the default scrambled background option. Motifs were visualised using the ‘ggseqlogo’ package in R (36). The motif matrix (CATGCTAA) was constructed using the seq2profile.pl HOMER function (seq2profile.pl CATGCTAA 0 ets) and the genome-wide motif search was conducted using the scanMotifGenomeWide.pl function (with and without -mask option checked) to uncover CATGCTAA motifs in both repetitive- and non-repetitive DNA.
mCH level calculation and plotting
DNA methylation (mCH) levels at CATGCTAA motifs were calculated using BEDtools (map function, -o sum) by dividing the sum of reads supporting a methylated CH cytosine with the sum of all reads mapping to that position. mCH levels were plotted using the boxplot function in R (outline = FALSE, notch = TRUE), for positions that had an mCH value > 0. Bedgraphs were generated from the corrected CGmap tools output and converted to bigWig using bedGraphToBigwig script from Kent utils. Heatmaps were generated using deepTools (37) computeMatrix and plotHeatmap functions. For WGBS and EM-seq data comparisons the heatmaps were generated with the following parameters: ‘computeMatrix reference-point -b 1500 -a 1500 -p 4 -bs 25, –missingDataAsZero’ whereas for plotting of mCH levels over MOSAT_DR repeats, we used: ‘computeMatrix scale-regions -m 650 -b 500 -a 500 -p 4 -bs 25’ with replacement of NAN values with 0 after the matrix file was generated. For profiles (represented as centred heatmaps) the matrices were generated with ‘computeMatrix reference-point –referencePoint center -b 1500 -a 1500 -p 4 -bs 50’ and ‘plotProfile –plotType heatmap –yMin 0 –yMax 0.15 –perGroup’.
Assessment of mCH in gene bodies
Zebrafish gene models (ENSEMBL Genes 99, GRCz11) were obtained from www.ensembl.org using the BioMart tool. DNA methylation (mCH) levels in gene bodies were calculated using BEDtools (map function, -o sum) and the number of CATGCTAA motifs in genes was obtained with coverageBed function. Scatterplots of mCH levels and CATGCTAA motif numbers were generated using the geom_bin2d function in ggplot2 ((bins = 50) + geom_smooth(method = lm)).
Repeatmasker track analyses
Repeatmasker track file corresponding to GRCz11 genome reference was downloaded from UCSC. The percentage of repeat subfamilies overlapping CATGCTAA motifs was determined with BEDtools (intersectBed). The genomic annotation of MOSAT_DR motifs was carried out with HOMER (annotatePeaks.pl).
ChIP-seq analyses
ChIP-seq data sequence reads were trimmed with Trimmomatic (ILLUMINACLIP:TruSeq3-SE.fa:2:30:10 SLIDINGWINDOW:5:20 LEADING:3 TRAILING:3 MINLEN:20) and mapped to the GRCz11 genome using bowtie2 with default settings (38), allowing multi-mapping reads to align to a single (best) genomic location. The resulting alignments in BAM format were deduplicated using sambamba markdup with default settings (30). RPKM bigWigs were generated using deepTools bamCoverage and reads were centred and extended by 300 base pairs (-e 300 -p 20 –normalizeUsing RPKM –centerReads). For H3K9me3 datasets, where input data was available, subtraction of input signal was performed using deepTools bigWigCompare (–operation subtract) before heatmaps were plotted. H3K9me3 peaks were called using MACS2 (39). Peaks common to both replicates were selected for further analyses. H3K9me3 peaks were then filtered based on coverage in WGBS data. Heatmaps of histone RPKM levels over MOSAT_DR elements were generated using deepTools ‘computeMatrix scale-regions -m 650 -b 500 -a 500 -p 4 -bs 25’ or ‘computeMatrix reference-point -b 2500 -a 2500 -p 4 -bs 25’ with NAN values replaced with 0 after completion. Heatmaps of scaled regions (computeMatrix scale-regions) were sorted (highest to lowest) based on mCH datasets (plotHeatmap –sortUsingSamples) while all other heatmaps (computeMatrix reference-point) were sorted based on all samples. Data for scatterplots were generated using bedtools map, to determine average mCH levels, and bedtools intersect (-abam), bedtools intersect (-c) and samtools flagstat, to calculate H3K9me3 RPKM (40). Scatterplots were generated by the geom_bin2d function in ggplot2 (bins = 75) + geom_smooth(method = lm) and Pearson's correlations were determined by the rcorr function in R.
Phylogenetic analyses
DNMT3A and DNMT3B human sequences were used as query in BLASTP searches against the proteomes of various actinopterygian species. The top hits were extracted and inspected for protein domain configuration using Pfam. These sequences were then added to a core set of vertebrate DNMT3 representatives (24), aligned using MAFFT (e-ins-i mode) (41), trimmed using TrimAL (-gappyout mode) (42), and fed into IQTREE for maximum likelihood phylogenetic reconstruction (43). ENSEMBL genome browser was used to inspect the syntenic regions surrounding dnmt3ba regions in different species. The CH domain from Dnmt3ba was extracted and searched against the actinopterygian proteomes, finding MAPRE-1 as the closest hit.
RESULTS
To evaluate the presence of non-CG methylation during zebrafish development we analysed whole genome bisulphite sequencing (WGBS) data to obtain genotype-corrected mCH profiles of 80% epiboly (gastrula), 24 hours post fertilization (hpf, pharyngula), 48hpf (hatching) embryos and adult brain tissue (bisulphite conversion >99.5%) (44). All samples showed only a minor elevation of methylation at CA dinucleotides compared to the unmethylated lambda genome spike-in control, except for the brain sample which had a moderate 2-fold increase at CA dinucleotides (Figure 1A), in line with the reported mCA enrichments in the zebrafish forebrain (24).
Figure 1.

MOSAT motifs are enriched for mCH. (A) Genomic and lambda control dinucleotide mCH percentage in zebrafish embryos and adult brain. (B) Motif analyses of the top 10 000 most methylated CH sites in zebrafish embryos and adult brain. (C) Strand preference of MOSAT mCH. (D) Boxplots showing average mCH/CH levels of the CATGCTAA motif in repeat-masked and repetitive portions of the genome. (E) Repetitive element annotation of CATGCTAA motif-containing regions. (F) Per read analysis of MOSAT motif mCH in MOSAT_DR elements.
mCH at mosaic satellite repeats
Next, we performed motif calling on the most highly methylated sites in the CH context and found that the top enriched sequence was consistently CATGCTAA, with methylation occurring at the TGmCT tetranucleotide (Figure 1B). No other developmental stage- or tissue-specific motifs, except for the previously described brain-specific CAC trinucleotide enrichment, were uncovered in this analysis (Supplementary Figure S1). Methylation was almost exclusively detected on the strand displaying the 5′-TGCT-’3′ motif (>75%) rather than on its reverse complement (5′-AGCA-3′), suggestive of considerable strand specificity during DNMT targeting as well as lack of symmetry typical of CG methylation (Figure 1C). Many of these nucleotides displayed substantial mCH above 10%, particularly at repetitive elements where this motif was found to contain the highest levels of mCH and where a notable increase in methylation at later stages of development and in the brain could be observed (Figure 1D). When the repetitive sites of the genome bearing the CATGCTAA motif were annotated, we found that more than 65% of these sites are located in MOSAT_DR mosaic satellite repeats (GenBank ID: DP000237.1, Figure 1E, F). Hereafter we refer to the CATGCTAA motif as the MOSAT motif.
EM-seq validation of MOSAT mCH
Since mappability issues caused by repetitive DNA elements can potentially result in biased mCH patterns, we re-mapped uniquely mapping reads covering MOSAT_DR repeats, tolerating 0 mismatches across the entire read (Supplementary Figure S2). Even under such stringent mapping conditions we observe substantial coverage of MOSAT_DR repeats and confirm the strand bias associated with TGCT methylation (Supplementary Figure S2). Additionally, to confirm that this form of methylation is not the result of a sequence-specific bias of bisulphite conversion (45), we generated enzymatic methylation sequencing (EM-seq) libraries of two biological replicates of 24hpf embryos (27) (TET2 oxidation efficiency: 94.20%; APOBEC conversion efficiency: 99.08%, Supplementary Table S2). EM-seq is a base-resolution DNA methylation sequencing method that depends on TET-mediated oxidation of methylated cytosines followed by APOBEC-based deamination. Importantly, in terms of sensitivity and detection accuracy EM-seq performs similarly to WGBS (46). We first estimated global mCH levels of MOSAT_DR repeats using both WGBS and EM-seq and found that MOSAT_DR motifs are characterized by an average of 5% mCH, a value consistent across both methods (Figure 2A). Both methods show that within MOSAT_DR repeats CG- and CH-methylated nucleotides (mCH > 10%) are found in similar proportions (Figure 2B). Next, we plotted average mCH levels over methylated MOSAT motifs found in repeats (weighted mCH > 10%) and an equivalent number of regions with the same motif randomly selected from the non-repetitive fraction of the zebrafish genome. WGBS and EM-seq signal are highly correlated and demonstrate strong mCH enrichment specifically over MOSAT motifs found in repetitive DNA (Figure 2C). To demonstrate that MOSAT motifs identified as methylated by WGBS are also identified as methylated when analysed by EM-seq, we generated heatmaps of methylated MOSAT sites (mCH > 10%) and compared them to the orthogonal approach. Notably, the top methylated MOSAT motifs identified in either EM-seq or WGBS showed proportionate methylation levels when compared to the other technique (Figure 2D, E). Finally, locus-level mCH patterns generated by both techniques resulted in highly similar profiles, including the TGCT methylation strand bias (Figure 2F and Supplementary Figure S3). We therefore conclude that mCH associated with MOSAT motifs is not due to low bisulphite conversion efficiencies or mappability issues associated with these repetitive regions; MOSAT_DR is an actively CH-methylated satellite repeat in zebrafish.
Figure 2.

EM-seq validation of MOSAT mCH. (A) Average mCH levels of MOSAT_DR repeats as determined by WGBS and EM-seq. (B) Percentage of methylated (> 10%) mCH and mCG sites in MOSAT_DR repeats as measured by WGBS and EM-seq. (C) mCH levels centered at methylated (>10% mCH) MOSAT (CATGCTAA) sequence motifs and compared to the same number of randomly chosen CATGCTAA motifs from the non-repetitive portion of the zebrafish genome. (D) Heatmap of methylated (>10% mCH) MOSAT motifs in 24hpf embryos identified by WGBS and compared to EM-seq signal and (E) identified by EM-seq and compared to WGBS signal. (F) WGBS and EM-seq visualization of MOSAT mCH in the fancl locus.
Genomic distribution of MOSAT mCH
Next we sought to analyse the genomic context, distribution, and dynamics of MOSAT mCH. It has previously been postulated that mCH enrichment observed in ESC gene bodies could merely be a by-product of DNMT activity targeting CG sites (15). To address whether this is the case with MOSAT_DR mCH, we first plotted CG dinucleotide density over MOSAT_DR repeats. Interestingly, MOSAT_DR repeats exhibit a strong depletion in CG density (Figure 3A). Moreover, while mCG was stable through development in the MOSAT_DR repeat regions, mCH displayed a gradual increase from gastrulation onwards in both intra- and intergenic regions (Figure 3B). Thus, the relative scarcity of CG dinucleotides in these elements as well as the uncoupled developmental methylation dynamics suggest that MOSAT mCH is unlikely just a by-product of DNMT activity targeting nearby CG sites.
Figure 3.

MOSAT mCH in genic and intergenic regions. (A) CG density (CG/100 bp) of MOSAT_DR repeats. (B) Genomic distribution of MOSAT_DR repeats (left panel). UCSC browser snapshot of mCH and mCG levels in both intronic and intergenic MOSAT_DR elements in developing zebrafish embryos and adult brain (right panel). (C) Scatterplot of average gene methylation (mCH/CH) plotted against the number of MOSAT motifs in gene bodies of 80% epiboly zebrafish embryos. (D) Distribution of gene length of all genes, neural genes, and MOSAT_DR repeat containing genes. (E) GO analysis of genes containing MOSAT_DR repeats.
In vertebrate brains, a conserved group of genes preferentially accumulate mCH within their gene bodies (24), which is believed to be the responsible for their silencing by MECP2 (21,22). To estimate the relative contribution of MOSAT motifs to overall mCH levels in gene bodies, we plotted the number of MOSAT motifs against gene body mCH levels. In both embryonic and brain tissue there is an overall positive correlation (R = 0.31–0.42) between the number of MOSAT motifs and mean mCH levels of the gene observed at all stages, suggestive of a major contribution of TGCT methylation to mCH gene body patterning (Figure 3C, Supplementary Figure S4A). Given the observation that long genes can be enriched and sensitive to mCH levels in mice and human brains (20,21), we investigated the length of MOSAT motif-containing genes and found them to be, on average, considerably longer than all genes as well as neural genes (Figure 3D). Moreover, MOSAT motif-containing genes do not appear to be constitutively expressed. They exhibit expression (47) in a diverse range of tissues many of which are neural by origin, however, their expression is not exclusively limited to the nervous system (Supplementary Figure S4B). Gene ontology (GO) analysis (48) of MOSAT motif-containing genes demonstrated a significant enrichment for terms associated with neuronal function and in particular synaptic function, in agreement with previous reports on neural mCH enrichment in mammals (5) (Figure 3E, Supplementary Figure S4C). Unlike the tissue-specific brain mCH that plays a role in gene-silencing in mammals, the link between MOSAT mCH and transcription is less obvious due to the presence of MOSAT mCH in diverse tissues. Despite these differences, the genes that accumulate methylated MOSAT motifs harbor neural functions, reminiscent of the neural mCH program.
Developmental remodelling of MOSAT mCH
Numerous reports have described the developmental dynamics of zebrafish mCG in somatic and germline tissues (44,49–58). Given that most notable mCG remodelling in zebrafish occurs during early development (52,57), we wanted to further investigate the developmental patterns of mCH. To that end, we analysed additional base-resolution profiles of adult liver, sperm, egg, 32-cell, 64-cell, sphere, germring and shield embryos, to obtain a comprehensive view of developmental mCH remodelling (52,58) (Supplementary Table S3). mCH levels of MOSAT motifs in commonly covered MOSAT_DR elements (n = 8064 sites from n = 3091 elements) are high in adult germ cells, cleavage stage embryos, late stage embryos, and adult brain and liver but low at ∼2–4 hpf, which corresponds to the major wave of zygotic genome activation (ZGA) (59) (Figure 4A, Supplementary Figure S5A). The observed temporal mCH dynamics are independent of mCG changes at these regions (Supplementary Figure S5B) and are uncoupled from global developmental mCG changes in zebrafish (44,52,57). Additionally, we generated WGBS libraries for a range of adult organs (skin, intestine, heart, and liver), which derive from all embryonic germ layers, and demonstrated that MOSAT mCH is re-established across all examined tissues (Supplementary Figure S5C).
Figure 4.

mCH at MOSAT_DR elements is developmentally reprogrammed and associated with constitutive H3K9me3. (A) mCH profiles of MOSAT motifs (n = 8064) in commonly covered MOSAT_DR elements during zebrafish development. (B) CH methylation (mCH/CH) and H3K9me3 (RPKM) levels in commonly covered MOSAT_DR elements (n = 3091) during zebrafish development. (C) Browser snapshot of mCG and mCH in 80% epiboly and 24hpf embryos compared to H3K9me3 (log2 ChIP/input) in shield stage and dome embryos. (D) Correlation between mCH levels at three developmental time points and shield stage H3K9me3 (log2RPKM). Left to right: 32-cell, sphere, 80% epiboly. (E) Bar graphs showing methylation levels (mC/C) at: MOSAT motifs, CH dinucleotides, and CT dinucleotides in the genome, MOSAT elements, H3K9me3 peaks that overlap MOSAT elements (H3K9me3 + MOSAT) and H3K9me3 peaks that do not overlap MOSAT elements (H3K9me3 - MOSAT). mCH and mCT levels are calculated with MOSAT motifs excluded (excl). Data correspond to 80% epiboly embryos. (F) H3K9me3 levels (RPKM), CH methylation levels (mCH/CH), MOSAT motif density (motif/100 bp) and CG density (CG/100bp) in MOSAT elements not marked by H3K9me3 (–H3K9me3 +MOSAT), H3K9me3 peaks that overlap with MOSAT elements (H3K9me3 + MOSAT) and H3K9me3 peaks that do not overlap with MOSAT elements (H3K9me3 – MOSAT). (G) H3K9me3 peak sizes of H3K9me3 peaks that overlap MOSAT elements (+ MOSAT) and H3K9me3 peaks that do not overlap MOSAT elements (–MOSAT).
Next we wanted to assess the chromatin environment of mCH-methylated MOSAT motifs. To that end, we generated ChIP-seq profiles of H3K9me3, H3K27me3, H3K36me3, H3K27ac, H3K4me1, and H3K4me3 histone modifications (60–62). We found a notable enrichment of H3K9me3 at methylated MOSAT_DR elements, whereas no other histone modification displayed any signal at these sites (Figure 4B, C and Supplementary Figure S5C). H3K9me3 has been shown to mark the zebrafish genome pre-ZGA and to progressively increase from ZGA onwards (61,63), however, we find that at MOSAT_DR sites, H3K9me3 is largely stable during development (256-cell to shield) (Figure 4B). To interrogate if H3K9me3 could play a role in recruiting or maintaining mCH at MOSAT repeats, we investigated the correlation between mCH and H3K9me3 through development. We observe a strong positive correlation at the 32-cell stage, 80% epiboly and in adult brain samples (r >0.6) where mCH is enriched, and a lower correlation at stages surrounding ZGA (r >0.35), where mCH levels are low (Figure 4D, Supplementary Figure S5D, E). Given that H3K9me3 is present at ZGA when mCH is being remodelled, it is possible that H3K9me3 plays a role in recruitment or maintenance of MOSAT mCH.
To interrogate whether mCH and H3K9me3 are associated more broadly throughout the genome, we re-analysed H3K9me3 data (61) to obtain a set of H3K9me3-enriched regions (n = 31,648) and assessed their mCH and in particular mCT status (Figure 4E). Nevertheless, we could not detect any mCH enrichment outside of the context of MOSAT motifs. To provide more insight into potential sequence determinants behind the genomic association of mCH and H3K9me3, we next investigated whether the density of MOSAT motifs within MOSAT_DR repeats might play a role in mCH recruitment. To that end, we generated heatmaps of H3K9me3 peaks with (+) and without (–) MOSAT_DR repeats, as well as of MOSAT_DR repeats without H3K9me3 (Figure 4F), and plotted MOSAT motif density over these regions. These analyses revealed a strong dependence of mCH on MOSAT motif density. MOSAT_DR repeats with low motif density were not enriched in either mCH or H3K9me3 (cluster 1), whereas MOSAT motif-dense repeats displayed notable enrichment for both mCH and H3K9me3 (cluster 2). We could not observe any other subset of H3K9me3 peaks that displayed mCH enrichment (cluster 3). Notably, MOSAT (+) H3K9me3 peaks were on average significantly longer than MOSAT (–) peaks (Figure 4G). Overall, these data demonstrate that MOSAT mCH is a heterochromatin component inherited from parental gametes, erased at ZGA and re-established during gastrulation. Moreover, we show that H3K9me3 marks a subset of high-density MOSAT_DR repeats even in the absence of mCH, suggestive of its possible role in post-ZGA mCH recruitment.
De novo MOSAT mCH targeting by Dnmt3ba
To investigate the molecular mechanism behind MOSAT mCH deposition, we first studied steady state abundance (64) of zebrafish de novo (dnmt3), maintenance (dnmt1), and tRNA (dnmt2/trdmt1) methyltransferase enzyme transcripts (Supplementary Figure S6A). We noticed that two dnmt transcripts in particular (dnmt3ba, dnmt3bb1) display expression dynamics that would correspond to de novo MOSAT mCH targeting following ZGA. Both dnmt3ba and dnmt3bb1 are lowly expressed in post-fertilisation embryos but increase during later developmental stages, indicating their possible roles in the maintenance of this unique form of methylation. To functionally address which DNMT is responsible for MOSAT mCH deposition, we employed CRISPR/Cas9 technology to generate F0 knockouts (cKO) of zebrafish larvae (Figure 5A) (65). We generated cKOs for the following de novo dnmt loci: dnmt3aa, dnmt3ab, dnmt3ba, dnmt3bb1, dnmt3bb2, dnmt3bb3 as well as for the combinations of: dnmt3aa/ab and dnmt3ba/bb1/2/3. We also assessed dnmt1 and its co-factor uhrf1 as well as dnmt2. The editing efficiency ranged from 60% to 100% for any non-homologous repair event and 40–80% for frameshift mutations (Supplementary Figure S6B). Genomic DNA extracted from cKOs was subjected to RRBS to assess mCH and mCG levels genome-wide and at MOSAT_DR loci (Figure 5B, C). To exclude the possibility of the maintenance methyltransferase system participating in MOSAT mCH deposition, we first examined mCH levels in dnmt1 and uhrf1 cKOs. Dnmt1 transcripts are deposited maternally (Supplementary Figure S6A) therefore masking the cKO effect, as evident from the modest reduction in genomic mCG. Nevertheless, uhrf1 cKO displayed a robust decrease (35%) in mCG, however without affecting MOSAT mCH (Figure 5B, C). We could also not detect any reduction of mCH in the dnmt2 cKO. We therefore focused our attention on the remaining dnmt3 targets. Out of all dnmt3 cKOs we observed the strongest reduction in MOSAT mCH in the dnmt3ba cKO (65%) as well as in the dnmt3ba/bb1/2/3 combination (51%), suggestive of Dnmt3ba being the major MOSAT mCH methyltransferase (Figure 5B). Given that the RRBS can only detect a fraction of MOSAT sites (∼250 sites at 3.3× mean coverage), we repeated the dnmt3ba cKO experiment and generated WGBS libraries from 72hpf genomic DNA (Figure 5D, E). These data demonstrate a strong reduction in MOSAT mCH in both biological replicates of dnmt3ba cKO at the majority of mCH-methylated MOSAT motifs. To explore whether there is a tendency of other Dnmts to compensate for the loss of Dnmt3ba, we examined dnmt3 expression in dnmt3ba cKOs and observed a significant increase in dnmt3bb2 and dnmt3bb3 transcripts (two sample t-test: P < 0.05, Figure 5F). Interestingly, these two cKOs also displayed a modest reduction in MOSAT mCH (Figure 5B).
Figure 5.

Dnmt3ba is the primary enzyme responsible for deposition of MOSAT mCH. (A) Schematic illustration of the transient CRISPR/Cas9 knockout (cKO) experiment approach. (B) Bar graphs showing methylation levels (mC/C) at MOSAT motifs (left) and genome wide (right) as assessed by RBBS in 48hpf cKO embryos. Data is presented as the mean of two biological replicates with error bars showing the standard error. (C) Heatmap showing methylation levels (mCH/CH) at MOSAT motifs from WGBS libraries of wild type (WT) and dnmt3ba 72hpf cKO larvae. (D) Genome browser snapshot of mCG and mCH levels in WT and dnmt3ba 72hpf cKO larvae. (E) Bar graphs showing transcript levels of dnmt genes in dnmt3ba 72hpf cKO larvae relative to WT. The data is represented as the mean of technical replicates with error bars showing the standard error (two sample t-test, * P < 0.05, ** P < 0.01). (F) Phylogenetic relationships among actinopterygian lineages (adapted from (66)), with a schematic display of Dnmt3b enzyme evolution.
To fully understand the evolutionary origin and relatedness of Dnmt3ba to other zebrafish Dnmt3 enzymes, we undertook a phylogenetic and comparative genomic analysis (66). Dnmt3ba belongs to the vertebrate DNMT3B lineage (67) and has a unique protein domain configuration, harbouring a Calponin Homology (CH) domain in the N-terminal region (68). Specifically, dnmt3ba was proposed to be a tandem duplication of the ancestral DNMT3B gene in fishes, annotated as dnmt3bb1 in zebrafish (69), since both genes are found in tandem in the spotted gar genome. To fully resolve the evolution of Dnmt3ba enzymes, we performed phylogenetic analyses including the genomes of reedfish and sturgeon, the earliest branching actinopterygian lineages (Figure 5F, Supplementary Figure S7). We confirm that dnmt3ba originated from the last common ancestor of actinopterygians as a result of a tandem duplication of the dnmt3bb1 locus. This tandem duplication explains the acquisition of the Dnmt3ba CH domain as this domain is closely related to the CH domain of the neighbouring MAPRE1 gene, found downstream of dnmt3bb1 and dnmt3ba. In the teleost lineage, a new copy of dnmt3ba, named dnmt3bb2 in zebrafish, was the result of the third round of whole genome duplication in teleosts (70). Finally, in zebrafish, dnmt3bb2 duplicated in tandem to give rise to dnmt3bb3. As noted previously (69), many of the secondary duplications of dnmt3ba have lost either the CH or the PWWP domain, suggesting that the new copies resulting from the teleost whole genome duplication tend to lose protein domains. In summary, we found that dntm3ba is a gene that originated >400 million years ago in the actinopterygian ancestor, yet it has given rise to evolutionary retained duplicates first in teleosts and later in the zebrafish lineage. These results provide a potential explanation on why dnmt3bb2 and dnmt3bb3 are upregulated upon dnmt3ba depletion (Figure 5F). It was recently suggested that CRISPR/Cas9 KO induces genetic compensation caused by mutant mRNA degradation and upregulation of genes with sequence similarity to the mutated target (71). Overall, our cKO experiments and phylogenetic analysis reveal the actinopterygian-specific Dnmt3ba as the principal MOSAT mCH methyltransferase.
DISCUSSION
How CG methylation (mCG) contributes to gene regulation has been studied for decades in diverse organisms spanning plant, fungi, and animal kingdoms (2). mCG is predominantly associated with long term silencing processes even though its developmental dynamics, genomic content and function vary greatly between organisms (1). The roles of mCH on the other hand, are just beginning to be understood (4). Previous work has demonstrated the importance of mCH for mammalian brain development (5) and recent studies suggest that altered mCH readout might underlie neurodevelopmental disorders such as Rett Syndrome (23). Notably, all mCH signal detected so far in vertebrates is predominantly found in CA dinucleotides (5–6,15), with CAC methylation in the nervous system being a conserved feature of the vertebrate lineage (24).
Here we describe a novel form of mCH that is found exclusively in the TGCT tetranucleotide context. Firstly, unlike CAC/CAG methylation that is enriched in mammalian gene bodies (5–6,15), TGCT methylation is exclusive to zebrafish mosaic satellite repeats (MOSAT_DR). Despite the symmetrical nature of the GC dinucleotide, methylation occurs almost exclusively on the TGmCT strand even though up to 25% of methylation was observed on the AGmCA strand during gastrulation (Figure 1). mCH was previously detected at major satellite repeats in mouse ESCs (72), however, this methylation type was CA context-specific and was only detected in ESCs and not in other differentiated cells.
In the current manuscript, we demonstrate that the genomic location and developmental dynamics of MOSAT mCH are unique and in contrast to what has previously been observed in regard to mammalian CAC/CAG methylation. Nevertheless, one interesting parallel can still be drawn. Both zebrafish MOSAT mCH and mammalian mCH are high in oocytes and are diluted after fertilisation. In mouse and human zygotes mCH is inherited from oocytes and lost during cell division of early cleavage stages (13,14). mCH is then re-established later in development, specifically in the nervous system after birth (5). As in mammals, MOSAT mCH is inherited from parental gametes with a notable difference; both egg and sperm contribute MOSAT mCH to the zygote (Figure 6). mCH is then diluted during cleavage stages to reach the lowest point during ZGA and is gradually re-established following gastrulation in tissues originating from all embryonic layers. Importantly, the dynamics of mCG and MOSAT mCH in zebrafish are entirely uncoupled. Zebrafish is characterized by generally stable mCG levels throughout development even though a gradual decrease in mCG can be observed. This decrease is most prominent during the phylotypic period when thousands of enhancers become actively demethylated (44). Notably, the post-ZGA increase in MOSAT mCH is the highest during those stages (Figure 6).
Figure 6.
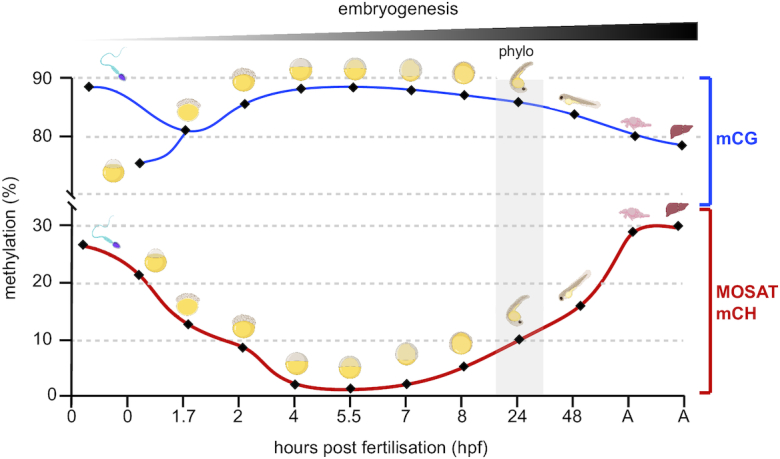
Developmental dynamics of MOSAT mCH and global mCG during zebrafish development. The drawings correspond to gametes – left; 8 developmental stages – middle; and adult brain and liver – right. Area shaded in grey represents the zebrafish phylotypic period, which coincides with active mCG removal from thousands of enhancers and establishment of the zebrafish body plan. (A = adult). The data points correspond to averages of mCH and mCG values (44,52,57–58).
Our CRISPR/Cas9 functional analyses have unravelled Dnmt3ba as the primary MOSAT mCH methyltransferase. This is significant for multiple reasons. Firstly, the molecular functions of zebrafish DNMTs remain largely underexplored. Dnmt3ba is special in that regard that it has a Calponin Homology Domain (CH) of yet unresolved function. CH domains are usually associated with actin and tubulin binding and are not commonly found in DNMTs (73). Whether the CH domain plays a role in the establishment of MOSAT mCH patterns will be a focus of future investigations. It is also worth noting that in mammals the functions of mCG and mCH are difficult to disentangle. This is due to developmental requirements for DNMT3A/B mCG and mCH function (4). Our zebrafish cKO analyses suggest that zebrafish might serve as a useful model organism for the studies of mCH function, as it appears that Dnmt3ba depletion does not cause major developmental abnormalities (data not shown). MOSAT mCH deposition is unlikely the primary ancestral role of Dnmt3ba within the fish lineage, since Dnmt3ba originated in the last common actinopterygian ancestor and MOSAT sequences are rare outside zebrafish genomes. Further work on other fish species will clarify the various functions that these DNMT3 duplicates might have evolved. Additionally, finding that Dnmt3ba is a tandem repeat of the original DNMT3B that gained roles in repetitive element targeting is reminiscent of Dnmt3c in rodents (74). Dnmt3c is a rodent specific DNMT3B copy with a specialised role in transposable element silencing, suggesting that genetic conflict with repetitive elements might foster recurrent fixation of DNMT3 duplicates in vertebrates.
Finally, here we demonstrate that MOSAT mCH and the heterochromatin mark H3K9me3 are highly correlated in the early embryo. This is in contrast to what has been observed in mammals where H3K9me3 and mCH are inversely correlated in large genomic domains that fail to revert to the embryonic state upon reprogramming (16). Our data, however, are in line with previous notions of H3K9me3 enrichment in CpG poor regions (75). A possible explanation for this correlation could be that following its depletion, mCH is re-established by means of H3K9me3 driven recruitment at MOSAT repeats. This could be facilitated by DNMT3 enzymes as H3K9me3 can recruit DNMT3 to satellite repeat regions in ESCs (76). Moreover, the cooperation between H3K9me3 and Dnmt3 during zebrafish embryogenesis was previously described, thus further supporting this scenario (77). It is also worth noting that satellite repeats were recently proposed to serve as ‘reservoirs’ for the cohesin component Rad21 before its redistribution to nearby loci upon ZGA (78). Whether MOSAT mCH and its peculiar developmental dynamics play a role in ZGA or genome 3D organization remains to be determined. In conclusion, we have described a novel type of vertebrate mCH, one with a unique sequence specificity, which undergoes developmental loss and re-establishment at H3K9me3-marked heterochromatin. This work thus lays the foundation for future studies that will explore how this novel and dynamic gene-regulatory component participates in diverse embryonic processes.
DATA AVAILABILITY
Data generated for this submission have been uploaded to the Gene Expression Omnibus (GEO) (https://www.ncbi.nlm.nih.gov/geo) under the record: GSE149416.
Supplementary Material
ACKNOWLEDGEMENTS
We thank Ksenia Skvortsova for help with EM-seq experiments and Ryan Lister for advice on mCH data analysis. We thank Sriharsa Pradhan and New England Biolabs for assistance with the EM-seq kit. Schematic representations of zebrafish embryos and cell types were created with Biorender. We dedicate this work to the memory of our recently deceased colleague, mentor and friend, Jose Luis Gomez-Skarmeta.
Contributor Information
Samuel E Ross, Genomics and Epigenetics Division, Garvan Institute of Medical Research, Sydney, New South Wales 2010, Australia; St Vincent's Clinical School, Faculty of Medicine, University of New South Wales, Sydney, New South Wales 2010, Australia.
Allegra Angeloni, Genomics and Epigenetics Division, Garvan Institute of Medical Research, Sydney, New South Wales 2010, Australia; St Vincent's Clinical School, Faculty of Medicine, University of New South Wales, Sydney, New South Wales 2010, Australia.
Fan-Suo Geng, Genomics and Epigenetics Division, Garvan Institute of Medical Research, Sydney, New South Wales 2010, Australia; St Vincent's Clinical School, Faculty of Medicine, University of New South Wales, Sydney, New South Wales 2010, Australia.
Alex de Mendoza, School of Biological and Chemical Sciences, Queen Mary University of London, London, E1 4NS, UK.
Ozren Bogdanovic, Genomics and Epigenetics Division, Garvan Institute of Medical Research, Sydney, New South Wales 2010, Australia; School of Biotechnology and Biomolecular Sciences, University of New South Wales, Sydney, New South Wales 2052, Australia.
SUPPLEMENTARY DATA
Supplementary Data are available at NAR Online.
FUNDING
Australian Research Council (ARC) Discovery Project [DP190103852 to O.B.]; O.B. is supported by NHMRC [R.D. Wright Biomedical CDF APP1162993]; CINSW [Career Development Fellowship CDF181229].
Conflict of interest statement. None declared.
REFERENCES
- 1. de Mendoza A., Lister R., Bogdanovic O.. Evolution of DNA methylome diversity in eukaryotes. J. Mol. Biol. 2019; doi:10.1016/j.jmb.2019.11.003. [DOI] [PubMed] [Google Scholar]
- 2. Schubeler D. Function and information content of DNA methylation. Nature. 2015; 517:321–326. [DOI] [PubMed] [Google Scholar]
- 3. Bird A. DNA methylation patterns and epigenetic memory. Genes Dev. 2002; 16:6–21. [DOI] [PubMed] [Google Scholar]
- 4. He Y., Ecker J.R.. Non-CG methylation in the Human Genome. Annu. Rev. Genomics Hum. Genet. 2015; 16:55–77. [DOI] [PMC free article] [PubMed] [Google Scholar]
- 5. Lister R., Mukamel E.A., Nery J.R., Urich M., Puddifoot C.A., Johnson N.D., Lucero J., Huang Y., Dwork A.J., Schultz M.D. et al.. Global epigenomic reconfiguration during mammalian brain development. Science. 2013; 341:1237905. [DOI] [PMC free article] [PubMed] [Google Scholar]
- 6. Lister R., Pelizzola M., Dowen R.H., Hawkins R.D., Hon G., Tonti-Filippini J., Nery J.R., Lee L., Ye Z., Ngo Q.M. et al.. Human DNA methylomes at base resolution show widespread epigenomic differences. Nature. 2009; 462:315–322. [DOI] [PMC free article] [PubMed] [Google Scholar]
- 7. Schultz M.D., He Y., Whitaker J.W., Hariharan M., Mukamel E.A., Leung D., Rajagopal N., Nery J.R., Urich M.A., Chen H. et al.. Human body epigenome maps reveal noncanonical DNA methylation variation. Nature. 2015; 523:212–216. [DOI] [PMC free article] [PubMed] [Google Scholar]
- 8. Mao S.Q., Cuesta S.M., Tannahill D., Balasubramanian S.. Genome-wide DNA methylation signatures are determined by DNMT3A/B sequence preferences. Biochemistry. 2020; 59:2541–2550. [DOI] [PMC free article] [PubMed] [Google Scholar]
- 9. Xie W., Barr C.L., Kim A., Yue F., Lee A.Y., Eubanks J., Dempster E.L., Ren B.. Base-resolution analyses of sequence and parent-of-origin dependent DNA methylation in the mouse genome. Cell. 2012; 148:816–831. [DOI] [PMC free article] [PubMed] [Google Scholar]
- 10. Patil V., Ward R.L., Hesson L.B.. The evidence for functional non-CpG methylation in mammalian cells. Epigenetics. 2014; 9:823–828. [DOI] [PMC free article] [PubMed] [Google Scholar]
- 11. Aoki A., Suetake I., Miyagawa J., Fujio T., Chijiwa T., Sasaki H., Tajima S.. Enzymatic properties of de novo-type mouse DNA (cytosine-5) methyltransferases. Nucleic. Acids. Res. 2001; 29:3506–3512. [DOI] [PMC free article] [PubMed] [Google Scholar]
- 12. Gowher H., Jeltsch A.. Enzymatic properties of recombinant Dnmt3a DNA methyltransferase from mouse: the enzyme modifies DNA in a non-processive manner and also methylates non-CpG [correction of non-CpA] sites. J. Mol. Biol. 2001; 309:1201–1208. [DOI] [PubMed] [Google Scholar]
- 13. Wang L., Zhang J., Duan J., Gao X., Zhu W., Lu X., Yang L., Zhang J., Li G., Ci W. et al.. Programming and inheritance of parental DNA methylomes in mammals. Cell. 2014; 157:979–991. [DOI] [PMC free article] [PubMed] [Google Scholar]
- 14. Guo H., Zhu P., Yan L., Li R., Hu B., Lian Y., Yan J., Ren X., Lin S., Li J. et al.. The DNA methylation landscape of human early embryos. Nature. 2014; 511:606–610. [DOI] [PubMed] [Google Scholar]
- 15. Ziller M.J., Muller F., Liao J., Zhang Y., Gu H., Bock C., Boyle P., Epstein C.B., Bernstein B.E., Lengauer T. et al.. Genomic distribution and inter-sample variation of non-CpG methylation across human cell types. PLoS Genet. 2011; 7:e1002389. [DOI] [PMC free article] [PubMed] [Google Scholar]
- 16. Lister R., Pelizzola M., Kida Y.S., Hawkins R.D., Nery J.R., Hon G., Antosiewicz-Bourget J., O’Malley R., Castanon R., Klugman S. et al.. Hotspots of aberrant epigenomic reprogramming in human induced pluripotent stem cells. Nature. 2011; 471:68–73. [DOI] [PMC free article] [PubMed] [Google Scholar]
- 17. Luo C., Lee Q.Y., Wapinski O., Castanon R., Nery J.R., Mall M., Kareta M.S., Cullen S.M., Goodell M.A., Chang H.Y. et al.. Global DNA methylation remodeling during direct reprogramming of fibroblasts to neurons. Elife. 2019; 8:e40197. [DOI] [PMC free article] [PubMed] [Google Scholar]
- 18. Chen L., Chen K., Lavery L.A., Baker S.A., Shaw C.A., Li W., Zoghbi H.Y.. MeCP2 binds to non-CG methylated DNA as neurons mature, influencing transcription and the timing of onset for Rett syndrome. Proc. Natl. Acad. Sci. U.S.A. 2015; 112:5509–5514. [DOI] [PMC free article] [PubMed] [Google Scholar]
- 19. Lagger S., Connelly J.C., Schweikert G., Webb S., Selfridge J., Ramsahoye B.H., Yu M., He C., Sanguinetti G., Sowers L.C. et al.. MeCP2 recognizes cytosine methylated tri-nucleotide and di-nucleotide sequences to tune transcription in the mammalian brain. PLos Genet. 2017; 13:e1006793. [DOI] [PMC free article] [PubMed] [Google Scholar]
- 20. Gabel H.W., Kinde B., Stroud H., Gilbert C.S., Harmin D.A., Kastan N.R., Hemberg M., Ebert D.H., Greenberg M.E.. Disruption of DNA-methylation-dependent long gene repression in Rett syndrome. Nature. 2015; 522:89–93. [DOI] [PMC free article] [PubMed] [Google Scholar]
- 21. Boxer L.D., Renthal W., Greben A.W., Whitwam T., Silberfeld A., Stroud H., Li E., Yang M.G., Kinde B., Griffith E.C. et al.. MeCP2 Represses the Rate of Transcriptional Initiation of Highly Methylated Long Genes. Mol. Cell. 2020; 77:294–309. [DOI] [PMC free article] [PubMed] [Google Scholar]
- 22. Clemens A.W., Wu D.Y., Moore J.R., Christian D.L., Zhao G., Gabel H.W.. MeCP2 represses enhancers through chromosome topology-associated DNA methylation. Mol. Cell. 2020; 77:279–293. [DOI] [PMC free article] [PubMed] [Google Scholar]
- 23. Lavery L.A., Ure K., Wan Y.W., Luo C., Trostle A.J., Wang W., Jin H., Lopez J., Lucero J., Durham M.A. et al.. Losing Dnmt3a dependent methylation in inhibitory neurons impairs neural function by a mechanism impacting Rett syndrome. Elife. 2020; 9:e52981. [DOI] [PMC free article] [PubMed] [Google Scholar]
- 24. de Mendoza A., Buckberry S., Pflueger J., Albertin C.B., Daish T., Bertrand S., de la Calle Mustienes E., Gomez-Skarmeta J.L., Nery J.R., Ecker J.R. et al.. The emergence of neural non-CpG methylation system in vertebrates. Nat. Ecol. Evol. 2020; [DOI] [PMC free article] [PubMed] [Google Scholar]
- 25. Moreno-Mateos M.A., Vejnar C.E., Beaudoin J.D., Fernandez J.P., Mis E.K., Khokha M.K., Giraldez A.J.. CRISPRscan: designing highly efficient sgRNAs for CRISPR-Cas9 targeting in vivo. Nat. Methods. 2015; 12:982–988. [DOI] [PMC free article] [PubMed] [Google Scholar]
- 26. Pinello L., Canver M.C., Hoban M.D., Orkin S.H., Kohn D.B., Bauer D.E., Yuan G.C.. Analyzing CRISPR genome-editing experiments with CRISPResso. Nat. Biotechnol. 2016; 34:695–697. [DOI] [PMC free article] [PubMed] [Google Scholar]
- 27. Vaisvila R., Sun Z., Langhorst B.W., Saleh L., Guan S., Dai N., Campbell M.A., Sexton B., Marks K., Samaranayake M. et al.. EM-seq: detection of DNA methylation at single base resolution from picograms of DNA. 2019; bioRxiv doi:23 December 2019, preprint: not peer reviewed 10.1101/2019.12.20.884692. [DOI] [PMC free article] [PubMed]
- 28. Bolger A.M., Lohse M., Usadel B.. Trimmomatic: a flexible trimmer for Illumina sequence data. Bioinformatics. 2014; 30:2114–2120. [DOI] [PMC free article] [PubMed] [Google Scholar]
- 29. Chen H., Smith A.D., Chen T.. WALT: fast and accurate read mapping for bisulfite sequencing. Bioinformatics. 2016; 32:3507–3509. [DOI] [PMC free article] [PubMed] [Google Scholar]
- 30. Tarasov A., Vilella A.J., Cuppen E., Nijman I.J., Prins P.. Sambamba: fast processing of NGS alignment formats. Bioinformatics. 2015; 31:2032–2034. [DOI] [PMC free article] [PubMed] [Google Scholar]
- 31. Guo W., Zhu P., Pellegrini M., Zhang M.Q., Wang X., Ni Z.. CGmapTools improves the precision of heterozygous SNV calls and supports allele-specific methylation detection and visualization in bisulfite-sequencing data. Bioinformatics. 2018; 34:381–387. [DOI] [PMC free article] [PubMed] [Google Scholar]
- 32. Kent W.J., Sugnet C.W., Furey T.S., Roskin K.M., Pringle T.H., Zahler A.M., Haussler D.. The human genome browser at UCSC. Genome Res. 2002; 12:996–1006. [DOI] [PMC free article] [PubMed] [Google Scholar]
- 33. Robinson J.T., Thorvaldsdottir H., Winckler W., Guttman M., Lander E.S., Getz G., Mesirov J.P.. Integrative genomics viewer. Nat. Biotechnol. 2011; 29:24–26. [DOI] [PMC free article] [PubMed] [Google Scholar]
- 34. Quinlan A.R., Hall I.M.. BEDTools: a flexible suite of utilities for comparing genomic features. Bioinformatics. 2010; 26:841–842. [DOI] [PMC free article] [PubMed] [Google Scholar]
- 35. Heinz S., Benner C., Spann N., Bertolino E., Lin Y.C., Laslo P., Cheng J.X., Murre C., Singh H., Glass C.K.. Simple combinations of lineage-determining transcription factors prime cis-regulatory elements required for macrophage and B cell identities. Mol. Cell. 2010; 38:576–589. [DOI] [PMC free article] [PubMed] [Google Scholar]
- 36. Wagih O. ggseqlogo: a versatile R package for drawing sequence logos. Bioinformatics. 2017; 33:3645–3647. [DOI] [PubMed] [Google Scholar]
- 37. Ramirez F., Dundar F., Diehl S., Gruning B.A., Manke T.. deepTools: a flexible platform for exploring deep-sequencing data. Nucleic Acids Res. 2014; 42:W187–W191. [DOI] [PMC free article] [PubMed] [Google Scholar]
- 38. Langmead B., Salzberg S.L.. Fast gapped-read alignment with Bowtie 2. Nat. Methods. 2012; 9:357–359. [DOI] [PMC free article] [PubMed] [Google Scholar]
- 39. Zhang Y., Liu T., Meyer C.A., Eeckhoute J., Johnson D.S., Bernstein B.E., Nusbaum C., Myers R.M., Brown M., Li W. et al.. Model-based analysis of ChIP-Seq (MACS). Genome Biol. 2008; 9:R137. [DOI] [PMC free article] [PubMed] [Google Scholar]
- 40. Li H., Handsaker B., Wysoker A., Fennell T., Ruan J., Homer N., Marth G., Abecasis G., Durbin R. Genome Project Data Processing, S . The Sequence Alignment/Map format and SAMtools. Bioinformatics. 2009; 25:2078–2079. [DOI] [PMC free article] [PubMed] [Google Scholar]
- 41. Katoh K., Standley D.M.. MAFFT multiple sequence alignment software version 7: improvements in performance and usability. Mol. Biol. Evol. 2013; 30:772–780. [DOI] [PMC free article] [PubMed] [Google Scholar]
- 42. Capella-Gutierrez S., Silla-Martinez J.M., Gabaldon T.. trimAl: a tool for automated alignment trimming in large-scale phylogenetic analyses. Bioinformatics. 2009; 25:1972–1973. [DOI] [PMC free article] [PubMed] [Google Scholar]
- 43. Nguyen L.T., Schmidt H.A., von Haeseler A., Minh B.Q.. IQ-TREE: a fast and effective stochastic algorithm for estimating maximum-likelihood phylogenies. Mol. Biol. Evol. 2015; 32:268–274. [DOI] [PMC free article] [PubMed] [Google Scholar]
- 44. Bogdanovic O., Smits A.H., de la Calle Mustienes E., Tena J.J., Ford E., Williams R., Senanayake U., Schultz M.D., Hontelez S., van Kruijsbergen I. et al.. Active DNA demethylation at enhancers during the vertebrate phylotypic period. Nat. Genet. 2016; 48:417–426. [DOI] [PMC free article] [PubMed] [Google Scholar]
- 45. Olova N., Krueger F., Andrews S., Oxley D., Berrens R.V., Branco M.R., Reik W.. Comparison of whole-genome bisulfite sequencing library preparation strategies identifies sources of biases affecting DNA methylation data. Genome Biol. 2018; 19:33. [DOI] [PMC free article] [PubMed] [Google Scholar]
- 46. Feng S., Zhong Z., Wang M., Jacobsen S.E.. Efficient and accurate determination of genome-wide DNA methylation patterns in Arabidopsis with enzymatic methyl sequencing. Epigenet. Chromatin. 2020; 13:42. [DOI] [PMC free article] [PubMed] [Google Scholar]
- 47. Thisse B., Thisse C.. Fast release clones: a high throughput expression analysis. ZFIN Direct Data Submission. 2004; https://zfin.org/ZDB-PUB-040907-1. [Google Scholar]
- 48. Raudvere U., Kolberg L., Kuzmin I., Arak T., Adler P., Peterson H., Vilo J.. g:Profiler: a web server for functional enrichment analysis and conversions of gene lists (2019 update). Nucleic Acids Res. 2019; 47:W191–W198. [DOI] [PMC free article] [PubMed] [Google Scholar]
- 49. Andersen I.S., Reiner A.H., Aanes H., Alestrom P., Collas P.. Developmental features of DNA methylation during activation of the embryonic zebrafish genome. Genome Biol. 2012; 13:R65. [DOI] [PMC free article] [PubMed] [Google Scholar]
- 50. Buono L., Naranjo S., Moreno-Marmol T., de la Cerda B., Polvillo R., Díaz-Corrales F.-J., Bogdanovic O., Bovolenta P., Martínez-Morales J.-R.. Analysis of gene network bifurcation during optic cup morphogenesis in zebrafish. 2020; bioRxiv doi:02 July 2020, preprint: not peer reviewed 10.1101/2020.05.28.121038. [DOI]
- 51. de la Calle Mustienes E., Gomez-Skarmeta J.L., Bogdanovic O.. Genome-wide epigenetic cross-talk between DNA methylation and H3K27me3 in zebrafish embryos. Genom Data. 2015; 6:7–9. [DOI] [PMC free article] [PubMed] [Google Scholar]
- 52. Jiang L., Zhang J., Wang J.J., Wang L., Zhang L., Li G., Yang X., Ma X., Sun X., Cai J. et al.. Sperm, but not oocyte, DNA methylome is inherited by zebrafish early embryos. Cell. 2013; 153:773–784. [DOI] [PMC free article] [PubMed] [Google Scholar]
- 53. Lee H.J., Lowdon R.F., Maricque B., Zhang B., Stevens M., Li D., Johnson S.L., Wang T.. Developmental enhancers revealed by extensive DNA methylome maps of zebrafish early embryos. Nat. Commun. 2015; 6:6315. [DOI] [PMC free article] [PubMed] [Google Scholar]
- 54. McGaughey D.M., Abaan H.O., Miller R.M., Kropp P.A., Brody L.C.. Genomics of CpG methylation in developing and developed zebrafish. G3 (Bethesda). 2014; 4:861–869. [DOI] [PMC free article] [PubMed] [Google Scholar]
- 55. Murphy P.J., Wu S., James C.R., Wike C.L., Cairns B.R.. Placeholder nucleosomes underlie germline-to-embryo DNA methylation reprogramming. Cell. 2018; 172:993–1006. [DOI] [PubMed] [Google Scholar]
- 56. Ortega-Recalde O., Day R.C., Gemmell N.J., Hore T.A.. Zebrafish preserve global germline DNA methylation while sex-linked rDNA is amplified and demethylated during feminisation. Nat. Commun. 2019; 10:3053. [DOI] [PMC free article] [PubMed] [Google Scholar]
- 57. Potok M.E., Nix D.A., Parnell T.J., Cairns B.R.. Reprogramming the maternal zebrafish genome after fertilization to match the paternal methylation pattern. Cell. 2013; 153:759–772. [DOI] [PMC free article] [PubMed] [Google Scholar]
- 58. Skvortsova K., Tarbashevich K., Stehling M., Lister R., Irimia M., Raz E., Bogdanovic O.. Retention of paternal DNA methylome in the developing zebrafish germline. Nat. Commun. 2019; 10:3054. [DOI] [PMC free article] [PubMed] [Google Scholar]
- 59. Akdogan-Ozdilek B., Duval K.L., Goll M.G.. Chromatin dynamics at the maternal to zygotic transition: recent advances from the zebrafish model. F1000Res. 2020; 9:doi:10.12688/f1000research.21809.1. [DOI] [PMC free article] [PubMed] [Google Scholar]
- 60. Bogdanovic O., Fernandez-Minan A., Tena J.J., de la Calle-Mustienes E., Hidalgo C., van Kruysbergen I., van Heeringen S.J., Veenstra G.J., Gomez-Skarmeta J.L.. Dynamics of enhancer chromatin signatures mark the transition from pluripotency to cell specification during embryogenesis. Genome Res. 2012; 22:2043–2053. [DOI] [PMC free article] [PubMed] [Google Scholar]
- 61. Laue K., Rajshekar S., Courtney A.J., Lewis Z.A., Goll M.G.. The maternal to zygotic transition regulates genome-wide heterochromatin establishment in the zebrafish embryo. Nat. Commun. 2019; 10:1551. [DOI] [PMC free article] [PubMed] [Google Scholar]
- 62. Ulitsky I., Shkumatava A., Jan C.H., Sive H., Bartel D.P.. Conserved function of lincRNAs in vertebrate embryonic development despite rapid sequence evolution. Cell. 2011; 147:1537–1550. [DOI] [PMC free article] [PubMed] [Google Scholar]
- 63. Lindeman L.C., Andersen I.S., Reiner A.H., Li N., Aanes H., Ostrup O., Winata C., Mathavan S., Muller F., Alestrom P. et al.. Prepatterning of developmental gene expression by modified histones before zygotic genome activation. Dev. Cell. 2011; 21:993–1004. [DOI] [PubMed] [Google Scholar]
- 64. White R.J., Collins J.E., Sealy I.M., Wali N., Dooley C.M., Digby Z., Stemple D.L., Murphy D.N., Billis K., Hourlier T. et al.. A high-resolution mRNA expression time course of embryonic development in zebrafish. Elife. 2017; 6:e30860. [DOI] [PMC free article] [PubMed] [Google Scholar]
- 65. Hwang W.Y., Fu Y., Reyon D., Maeder M.L., Kaini P., Sander J.D., Joung J.K., Peterson R.T., Yeh J.R.. Heritable and precise zebrafish genome editing using a CRISPR-Cas system. PLoS One. 2013; 8:e68708. [DOI] [PMC free article] [PubMed] [Google Scholar]
- 66. Du K., Stock M., Kneitz S., Klopp C., Woltering J.M., Adolfi M.C., Feron R., Prokopov D., Makunin A., Kichigin I. et al.. The sterlet sturgeon genome sequence and the mechanisms of segmental rediploidization. Nat. Ecol. Evol. 2020; 4:841–852. [DOI] [PMC free article] [PubMed] [Google Scholar]
- 67. Campos C., Valente L.M., Fernandes J.M.. Molecular evolution of zebrafish dnmt3 genes and thermal plasticity of their expression during embryonic development. Gene. 2012; 500:93–100. [DOI] [PubMed] [Google Scholar]
- 68. Goll M.G., Halpern M.E.. DNA methylation in zebrafish. Prog. Mol. Biol. Transl. Sci. 2011; 101:193–218. [DOI] [PMC free article] [PubMed] [Google Scholar]
- 69. Liu J., Hu H., Panserat S., Marandel L.. Evolutionary history of DNA methylation related genes in chordates: new insights from multiple whole genome duplications. Sci. Rep. 2020; 10:970. [DOI] [PMC free article] [PubMed] [Google Scholar]
- 70. Jaillon O., Aury J.M., Brunet F., Petit J.L., Stange-Thomann N., Mauceli E., Bouneau L., Fischer C., Ozouf-Costaz C., Bernot A. et al.. Genome duplication in the teleost fish Tetraodon nigroviridis reveals the early vertebrate proto-karyotype. Nature. 2004; 431:946–957. [DOI] [PubMed] [Google Scholar]
- 71. El-Brolosy M.A., Kontarakis Z., Rossi A., Kuenne C., Gunther S., Fukuda N., Kikhi K., Boezio G.L.M., Takacs C.M., Lai S.L. et al.. Genetic compensation triggered by mutant mRNA degradation. Nature. 2019; 568:193–197. [DOI] [PMC free article] [PubMed] [Google Scholar]
- 72. Arand J., Spieler D., Karius T., Branco M.R., Meilinger D., Meissner A., Jenuwein T., Xu G., Leonhardt H., Wolf V. et al.. In vivo control of CpG and non-CpG DNA methylation by DNA methyltransferases. PLoS Genet. 2012; 8:e1002750. [DOI] [PMC free article] [PubMed] [Google Scholar]
- 73. Korenbaum E., Rivero F.. Calponin homology domains at a glance. J. Cell Sci. 2002; 115:3543–3545. [DOI] [PubMed] [Google Scholar]
- 74. Barau J., Teissandier A., Zamudio N., Roy S., Nalesso V., Herault Y., Guillou F., Bourc’his D.. The DNA methyltransferase DNMT3C protects male germ cells from transposon activity. Science. 2016; 354:909–912. [DOI] [PubMed] [Google Scholar]
- 75. Collings C.K., Anderson J.N.. Links between DNA methylation and nucleosome occupancy in the human genome. Epigenet. Chromatin. 2017; 10:18. [DOI] [PMC free article] [PubMed] [Google Scholar]
- 76. Lehnertz B., Ueda Y., Derijck A.A., Braunschweig U., Perez-Burgos L., Kubicek S., Chen T., Li E., Jenuwein T., Peters A.H.. Suv39h-mediated histone H3 lysine 9 methylation directs DNA methylation to major satellite repeats at pericentric heterochromatin. Curr. Biol. 2003; 13:1192–1200. [DOI] [PubMed] [Google Scholar]
- 77. Rai K., Jafri I.F., Chidester S., James S.R., Karpf A.R., Cairns B.R., Jones D.A.. Dnmt3 and G9a cooperate for tissue-specific development in zebrafish. J. Biol. Chem. 2010; 285:4110–4121. [DOI] [PMC free article] [PubMed] [Google Scholar]
- 78. Meier M., Grant J., Dowdle A., Thomas A., Gerton J., Collas P., O'Sullivan J.M., Horsfield J.A.. Cohesin facilitates zygotic genome activation in zebrafish. Development. 2018; 145:dev156521. [DOI] [PubMed] [Google Scholar]
Associated Data
This section collects any data citations, data availability statements, or supplementary materials included in this article.
Supplementary Materials
Data Availability Statement
Data generated for this submission have been uploaded to the Gene Expression Omnibus (GEO) (https://www.ncbi.nlm.nih.gov/geo) under the record: GSE149416.