

Abstract
Peritoneal spread is the primary mechanism of metastasis of ovarian cancer, and survival of ovarian cancer cells in the peritoneal cavity as non-adherent spheroids and their adherence to the mesothelium of distant organs lead to cancer progression, metastasis and mortality. However, the mechanisms that govern this metastatic process in ovarian cancer cells remain poorly understood. In this study, we cultured ovarian cancer cell lines in adherent (AD) and in non-adherent (NAD) conditions in vitro and analyzed changes in mRNA and protein levels to identify mechanisms of tumor cell survival and proliferation in AD and NAD cells. EGFR or ERBB2 upregulated ZEB1 in NAD cells, which caused resistance to cell death and increased tumor-initiating capacity. Conversely, Forkhead box M1 (FOXM1) was required for the induction of Integrin Beta 1 (ITGB1), Integrin-α V (ITGAV), and Integrin-α 5 (ITGA5) for adhesion of cancer cells. FOXM1 also upregulated ZEB1, which could act as a feedback inhibitor of FOXM1 and caused the transition of AD cells to NAD cells. Strikingly, the combinatorial treatment with Lapatinib (dual kinase inhibitor of EGFR (ERBB1) and ERBB2) and Thiostrepton (FOXM1 inhibitor) reduced growth and peritoneal spread of ovarian cancer cells more effectively than either single agent treatment in vivo. In conclusion, these results demonstrate that FOXM1 and EGFR/ERBB2 pathways are key points of vulnerability for therapy to disrupt peritoneal spread and adhesion of ovarian cancer cells.
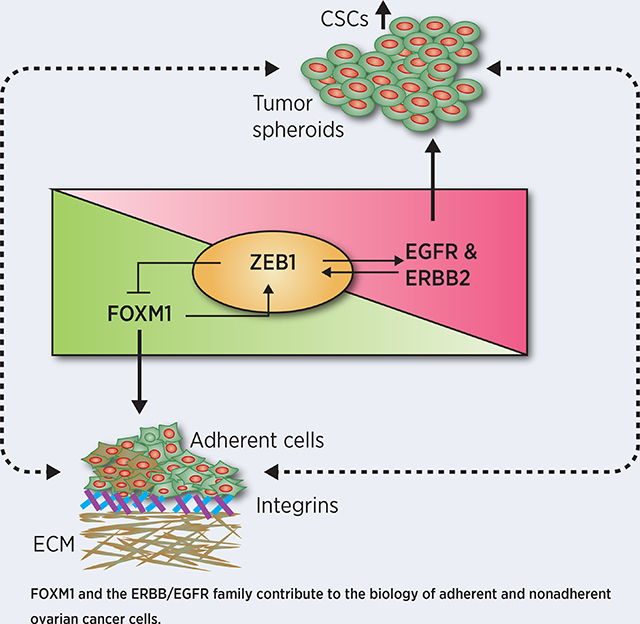
Graphical Abstract
Introduction
Peritoneal seeding of cancer cells is the major mechanism of ovarian cancer metastasis, which ultimately leads to the death of ovarian cancer patients. Patients with advanced ovarian cancer have a poor prognosis with an overall 5-year survival rate of less than 40% due to recurrence of peritoneal tumor after first-line therapy (1). During the process of peritoneal spread, malignant cells are often shed into the peritoneal fluid as non-adherent (NAD) form where they survive as spheroid-like aggregates, which later spread through the peritoneal fluid to abdominal organs, then attach and grow as adherent (AD) colonies.
The survival of ovarian cancer cells as tumor spheroids in the peritoneal fluid is regulated by growth factors in the peritoneal microenvironment and respective receptors on the tumor cells (2–4). These multi-cellular ovarian cancer spheroids exhibit tumor-initiating capacity, which is also known as cancer stemness and exhibit features of resistance to standard chemotherapeutics and anoikis (5). To determine the underlying mechanisms, which are critical for the survival and colonization of ovarian cancer cells, we employed qPCR array and Reverse-Phase Protein Array (RPPA) analysis using the mRNA and protein preparations collected from the AD as well as NAD ovarian cancer cells. Based on this analysis, we demonstrated that Epidermal Growth Factor Receptor (EGFR; also known as ERBB) pathway is critical for survival of NAD cells while Forkhead box M1 (FOXM1) is important for the adhesion of cancer cells and their colonization.
The Epidermal Growth Factor Receptor (EGFR; a.k.a. ERBB) family proteins includes four ERBB proteins; ERBB1 (EGFR), ERBB2, ERBB3 and ERBB4. ERBB family receptors are well studied for their role in normal development of ovarian follicles and in the regulation of growth of the ovarian surface epithelium (6). FOXM1 is a member of Forkhead family of transcription factors (a.k.a. HFH-11, MPP-2, WIN or TRIDENT), that contributes to mitosis and cell cycle progression by regulating the transition from G1 to S phase and G2 to M phase (7). The Cancer Genome Atlas (TCGA) ovarian cancer study employing the probabilistic graphical model (PARADIGM) to search for altered pathways in the US National Cancer Institute Pathway Interaction Database (8,9) identified that the FOXM1-mediated transcription network is altered in 87% of ovarian cancer patients (10). Several studies have established the role of FOXM1 on tumor cell growth and metastasis (11,12). However, the mechanisms underlying, how FOXM1 helps the adhesion of ovarian cancer spheroids is not well understood. In this study, we demonstrated the mechanism in ovarian cancer cells tailored for AD and NAD phenotypes and their transition between one form to another.
Materials and Methods
Cell culture
Immortalized ovarian cancer cell line IOSE80, fallopian tube epithelial cells FTE187, and FTE188 were received from Jinsong Liu at MD Anderson Cancer Center, Houston, TX, USA. OVCAR4, and OVCAR-5 cell lines were purchased from NCI-DCTD Repository. HEYA8, and IGROV1 cells were received from the Characterized Cell Line core at MD Anderson Cancer Center. Mouse ovarian cancer cell lines C11, C11-FOXC2 and BR-Luc murine cell lines were kind gift from Sandra Orsulic, at University of California, Los Angeles, CA, USA. IOSE80, FTE 187 and FTE188 was maintained in cell culture medium consisting of 1:1 Medium 199 and MCDB105 medium (Sigma-Aldrich) with 10% fetal bovine serum (FBS). All other cells were cultured in Dulbecco’s Modified Eagle’s Medium (DMEM) supplemented with 10% fetal bovine serum (FBS), 50 units/ml penicillin, and 100 μg/ml streptomycin (Life Technologies, Carlsbad, CA, USA) in a 5% CO2 environment at 37°C following standard methods as described previously (13,14). All cell lines were used between passages 3 and 25. Cell line authentication was performed by short tandem repeat (STR) profiling at the IDEXX Bioanalytic Laboratories Inc (Westbrook, Maine, USA), and tested as mycoplasma negative by PCR (Agilent Mycosenser Mycoplasma assay kit) as recent as two months prior to last experiments.
Patients and tissue samples
Ovarian cancer samples were obtained from Cancer Center and Obstetrics & Gynecology, Froedtert Hospital, Medical College of Wisconsin after approval by the Institutional Review Board (IRB) of Medical College of Wisconsin. All the human samples were collected with written informed consents from patients in accordance with recognized ethical guidelines of Belmont Report.
Preparation of non-adherent (NAD) and adherent (AD) cells of ovarian cancer
OVCAR4 and OVCAR5 cell lines stably expressing GFP were grown in 10% FBS containing medium on the non-adherent culture plate for 24h to prepare NAD ovarian cancer spheroids. Similarly, the above cells were grown on ~ 90% confluent RFP-labelled mesothelial cell lines in 10% serum containing medium for 24h. We have used MeT-5A mesothelial cells (ATCC, Manassas, VA), which were derived from the pleural fluid of a male and then immortalized using SV40-T antigen for our co-culture experiment. In brief, Adherent cells stably expressing GFP were selected by fluorescence activated cell sorting (FACS) of GFP labeled OVCAR cells that were adherent on MeT-5A cells. In a second approach, we also cultured ovarian cancer cells on regular culture plate for 24h to isolate mRNA and total protein.
Flow cytometry analysis
Apoptosis was detected using a FITC Annexin V/Dead Cell Apoptosis Kit (BD Pharmingen, San Diego, CA, USA). Trypsinized cells were washed with PBS, pelleted, re-suspended in serum free PBS, and incubated with 5 μL of FITC annexin V and 1 μL of the 100 μg/mL propidium iodide (PI) for 15 min. Labelled cells were then processed and sorted using BD LSR II Flow Cytometer (BD Biosciences, San Jose, CA). The data was analyzed using FlowJo software (FlowJo LLC, Ashland, Oregon). EpCAM-positive and CD45-negative cells were collected from the single cell preparations isolated from omentum (AD cells) or from ascites fluid (NAD cells) by FACS for tumor cell isolation from clinical samples.
Reverse-phase protein arrays (RPPA)
RPPA analysis was performed as described previously (15,16) and detailed at the MD Anderson Cancer Center RPPA core facility as below: https://www.mdanderson.org/research/research-resources/core-facilities/functional-proteomics-rppa-core.html
Gene silencing and overexpression
Silencing or overexpression of genes were performed as described previously (17). siRNAs were transfected at a concentration of 5nM to 20 nM using RNAi max (Invitrogen) (Supplementary Table-1). For ectopic expression, 500 ng of plasmid pCellFree_G03 empty vector or pCellFree_G03-FOXM1 were transfected in cancer cells or in normal epithelial cells. Stable knockdown of genes was performed using small hairpin (sh) RNA as described previously (14). Control and target specific shRNAs were purchased from Sigma to prepare lentiviral preparations (Supplementary Table-2). Viral particles were created by transfecting packaging vectors pLP1, pLP2 and VSVG plasmids including control empty vector pLKO.1 (Cat#SHC001V) or shRNA targets EGFR or ERBB2 purchased from Sigma-Aldrich (Saint Louis, MO) in HEK293T cells. Competent lentiviral particles were collected 48 h after transfection and used to infect target cells. To create a tetracycline inducible ZEB1 expressing cells, we cloned ZEB1 in pTRE-Tight GFP tetracycline inducible plasmid. GFP positive cells were selected after tetracycline (Takara Bio Inc., San Francisco, CA, USA) treatment.
RNA isolation, cDNA synthesis and Real-time PCR analysis
mRNA levels of various genes were determined in a BioRad CFX Connect using SYBR Green Supermix. Primers for real-time were designed using DNA-star Lasergene 15.2 core suite (DNAstar, Madison, WI) and listed (Supplementary Table-3). PCR were performed as: hot start 2 min at 95˚C, denaturation 10 s at 95˚C, annealing 15 s according to the Tm of each primer, and extension 10 s at 72˚C for 15–30 cycles. Relative mRNA levels were quantitated using β-Actin as the endogenous control and ΔΔCT algorithm (18). RT2 profiler PCR array for genes associated with tumor cell proliferation, cell death and cell adhesion (Cat#CAPA9696–12:CLAH36595) was purchased from Qiagen (Valencia, CA, USA). Clustergram representing Fold Change of genes in NAD vs AD cells was prepared by the Qiagen RT-PCR profiler software (https://dataanalysis2.qiagen.com/pcr) by converting the individual normalized ΔΔCT values of “NAD” and “AD” population to log2 performed in technical triplicates as recommended by the Qiagen RT-PCR profiler analysis program. Genes with > 1.4-fold change in expression with a pValue<0.05 were selected. Five housekeeping genes, B2M, HPRT1, RPLP0, GAPDH, and ACTB, were used for normalizing data. Volcano plot was prepared from Log2 fold change plotted against -Log10 p-value of differentially expressed genes in NAD and AD cells. mRNA or protein network of differentially expressed candidate genes were performed using NetWalker pathway analysis suite as published previously (19).
Western blot analysis
Western blot analysis was performed with precast gradient gels (Bio-Rad, Hercules, CA) using standard methods as published before (20) using the primary antibodies against FOXM1 (SCBT, USA), EGFR (CST, USA), pEGFR Y1068 (CST, USA), HER2 (CST, USA), pHER2 (CST, USA), CD44 (Abcam), CD24 (Abcam), c-Kit (Abcam), ITGAB1 (CST, USA), ITGA-V (CST, USA), ITGA-5 (CST, USA), and ZEB1 (CST, USA). The loading control was β-actin (SCBT, USA) followed by an incubation with horseradish peroxidase-conjugated secondary antibodies (BioRad, USA).
ELISA
ELISA was performed using the kit (R&D systems, MN, USA) as described previously (17,21). Briefly, culture supernatants were harvested, and centrifuged for estimating the levels of EGF, amphiregulin and TGFα using the ELISA kits according to the manufacturer’s instructions. Recombinant protein of EGF, amphiregulin and TGFα (R & D Systems, MN, USA) were used as the standard for quantification.
In silico analysis of gene promoters and chromatin immunoprecipitation assays
DNAStar Lasergene 8 Suite Sequence Builder and Genequest software was used to determine the transcription factor binding sites surrounding 1 kb upstream and 1 kb downstream of the transcription start points (TSPs) in the human genome database in GenBank. Computer-assisted search for the typical FOXM1 binding motif which is tandem repeats of ‘TAACA’, the atypical binding motifs such as ‘AACA’ and ‘TAAC, or their complements, was conducted to uncover the putative FOXM1 binding sites. Chromatin immunoprecipitation (ChIP) was done using ChIP kit procured from Sigma-Millipore, USA and modified as described previously (22). Immunoprecipitation was performed using anti-FOXM1 monoclonal antibodies (SCBT)and anti-IgG (SCBT) or ‘no antibody’ blanks were used as negative controls. Based on our in-silico analysis, the putative FOXM1 binding sites were identified and qPCR was performed as described above by using primers listed (Supplementary Table-4) surrounding the FoxM1 binding sites. AURKB promoter was selected as a positive control for FOXM1 as it was identified as direct target of FOXM1 for transcription (23). β-actin (ACTB) promoter sequence which do not have FOXM1 binding sequences was used as the negative control.
In vivo study
All the animal experiments were performed using ~4 to 6 weeks old female FVB/NJ -Homozygous mice from Jackson Laboratories were maintained under specific pathogen-free conditions in accordance with guidelines and therapeutic interventions approved by the Medical College of Wisconsin Institutional Animal Care and Use Committee (IACUC). Murine ovarian cancer cell line Br-Luc (1 × 10⁶ cells/mouse) were trypsinized, washed, and resuspended in Hanks’ balanced salt solution (GIBCO, Carlsbad, CA) and 50μl was injected into each mice orthotopically or intraperitoneally. Tumor bearing mice were randomly divided in two groups (n = 7/group) after ten days of tumor cell injection and treated with Thiostrepton (20 mg/kg body weight) in 100μl PBS intraperitoneally and Lapatinib (i.e. GW2974–30 mg/kg body weight) in 100μl PBS orally once in a week as indicated. 7 mice per group provides 80% power to detect a minimal effect size of 0.68 using one-way ANOVA.Treatment was continued for 7 weeks, at which point, all mice were sacrificed, necropsied, and tumors harvested. The bioluminescence imaging of animals was performed weekly by injecting luciferin and imaging after 10 minutes using an IVIS Lumina III (Perkin Elmer, Waltham, MA, USA).
Key Resource Table
List of all reagents and software used along with their source information and research resource identifier (RRID) numbers are included in the supplementary files (Supplementary Table-5).
Statistical Analysis
All assays were performed in at least triplicate or more as indicated in the figure legends. Data are presented as means ± Standard Error (SE) or means ± Standard Deviation (SD). Statistical comparisons were performed using unpaired two-tailed Student’s t-tests or by ANOVA, where appropriate with a probability value of 0.05 considered significant.
Results
Adherent (AD) and non-adherent (NAD) cells of ovarian cancer exhibits distinct gene signature for cancer cell adhesion and spheroid formation
To model NAD forms during peritoneal spreading of ovarian cancer cells (Fig-1A), we cultured ovarian cancer cells OVCAR4 and OVCAR5 and immortalized ovarian surface epithelial cell line IOSE80 on non-adherent (low attachment) culture plates for 24h (Fig-1B). To model the adhesion of ovarian cancer cells on a physiologically closer substratum in ovarian cancer, we grew the GFP-labelled ovarian cancer cells on RFP-labelled mesothelial cells MeT-5A for 24 h (Fig-1B) and then collected the GFP-positive tumor cells by FACS for gene expression profiling. We also determined the viability of tumor spheroids were grown on non-adherent conditions and ensured that the retrieval of ovarian cancer cells from adherent state did not affect the viability of ovarian cancer cells largely and we found that both OVCAR5 and IOSE-80 cells exhibited more than 85% viability and OVCAR4 cells exhibited 72% viability (Q4 in Fig-1C).
Figure-1: Modeling of peritoneal dissemination and seeding of ovarian cancer.

A, Schema shows how ovarian cancer cells exfoliate and attach on distant organ sites through peritoneal trafficking. Numbers 1, 2, 3 and 4 indicate primary tumor, single cells disseminated, floating spheroids or adherent tumor cells on metastatic sites respectively. B, Schema shows how ovarian cancer cells were grown to model non-adherent (NAD) or adherent (AD) cells to determine gene signatures in NAD and AD form of cells. GFP-labelled ovarian cancer cells were cultured on non-adherent culture plate to prepare NAD cells; whereas GFP-labelled ovarian cancer cells were grown on ~90% confluent RFP-labelled MeT-5A mesothelial cell lines for 24h. Total RNA or protein lysates were prepared from both NAD and AD form of tumor cells to perform qPCR array and reverse phase protein array (RPPA). C, Cell viability of non-adherent (NAD) ovarian cancer cells were determined 24h after growing on NAD condition. Cells were fixed and stained using propidium iodide (PI) and Annexin V and the number of viable cells were quantitated using flow cytometry. Q4, Q3 and Q2 represent viable, early apoptotic and late apoptotic cells.
To identify the gene sets, which are critical for the adhesion and the growth of ovarian cancer spheroid, we performed a qPCR array which comprises of genes which are for cell survival, proliferation, adhesion and metastasis. In this assay, we found that adherent form of ovarian cancer cells expresses high levels of FOXM1, ITGAV, ITGA5, and ITGB1 as well as the markers of active cell proliferation such as Cyclin D1, Cyclin D3, Cyclin Dependent Kinase-2 (CDK2). We also found that fibronectin (FN1), which is the ligand of ITGA5 and ITGB1 is also upregulated in the adherent ovarian cancer cells. We observed that non-adherent (NAD) spheroids express high levels of ERBB2, EGFR, and their ligands such as TGF-α and EGF as well as the markers of cancer stemness such as Prominin, c-KIT, STAT3 and MUC1 (Fig-2A and Fig-2B). Compatible with published results (24), we also found an inverse association between E-Cadherin and ZEB1 in Adherent populations of ovarian cancer cells.
Figure-2: AD and NAD culture of ovarian cancer expresses distinct set of genes critical for AD and NAD phenotype.

A, Total RNA was prepared from NAD and AD cells of OVCAR4 cells (n=3) and performed qPCR array and clustergram of genes > 1.4-fold change with a pValue<0.05 was prepared using Qiagen RT-PCR profiler software (https://dataanalysis2.qiagen.com/pcr). B2M, HPRT1, RPLP0, GAPDH, and ACTB genes were used for normalizing data. Genes that were more than 1.4-fold difference as downregulated (green color) or upregulated (red color) were selected to plot the heat map. B, Volcano plot represents Log2 fold change in gene expression in both NAD and AD cells from (A). Red and green dots represent genes which are significantly up or down regulated respectively with a pValue < 0.05 whereas black dot represents non-significant (NS) changes. C-D, Gene network map shows the interaction between genes which are altered more than 1.5-fold change difference in qPCR array of NAD versus AD cells of ovarian cancer plotted using Netwalker software.
To determine the central genes, which are critical for both cell adhesion and spheroid formation, we performed the pathway and network analysis using the genes which were upregulated in adherent (AD) and non-adherent (NAD) population in our qPCR array using Netwalker pathway analysis suite (19) and found that EGFR/ERBB2 signaling and their ligands are the central node for signaling in NAD spheroids (Fig-2C). Our analysis further identified that FOXM1, ITGAV, ITGA5, ITGB1 and FN1 are part of the gene network expressed in AD cells (Fig-2D). Next, we knocked down all the genes in the NAD and AD gene network and determined their effect on 3D spheroid formation and cell adhesion ability. We found that NAD genes such as EGFR or ERBB2 reduced the spheroid formation more than 70%, whereas the knocked down of EGF, which is the ligand of EGFR and an inducer of EGFR/ERBB2 dimer as well as ZEB1 knockdown inhibited the spheroid formation ~40% (Supplementary Fig-1A–1B). We also noticed that the knockdown of genes including ABL1, GAB2, LCK, GRB7 and RPS6 in the NAD gene network (Fig-2C) reduced spheroid formation only about 30% compared to control siRNA treated spheroids (Supplementary Fig-1A and 1B). In our adhesion assay, we found that FOXM1 knockdown inhibited the adhesion ability of OVCAR4 and OVCAR5 cells ~80% as compared to the control and the knocked down of ITGAV, ITGA5 and ITGB1 individually reduced the adhesion ~40% and the knocked down of CCND1 and CDH1 reduced the cell adhesion ~15-~20 % compared to the control (Supplementary Fig-1C and 1D). Notably, we did not find that the knockdown of FOXM1 or EGFR/ERBB2 genes altered spheroid forming ability or the adhesion of ovarian cancer cells respectively (Supplementary Fig-1E and 1F).
To further validate the gene network are important for AD or NAD forms of cells, we performed another independent approach called functional proteomic Reverse Phase Protein Array (RPPA) platform (15), using the cell lysates prepared from AD and NAD cells of both OVCAR4 and OVCAR5 cells. Changes in total and phospho-proteins identified two distinct set of proteins that were altered in AD and NAD of OVCAR4 and OVCAR5 cells (Supplementary Fig-2A to 2D and Supplementary Spread Sheet 1 and 2). We further employed Netwalker for enriched pathways (19), which identified a network comprising of FOXM1, CASP8, CASP7, ERCC5, CDK1, YWHAE, RPA2, PARP1, H2AFX, ATR, RHEB, CAV1, ABL1, COL6A1, and MUC1 as highly enriched in adherent cells, whereas FOXM1, CDK1, ERCC5 and CASP8 are enriched in AD cells (Supplementary Fig-2E). ERBB2, ERBB1 (EGFR), IGF1R, HSPB1, AKT1, AKT2, AKT3, MDM2, CDKN1B, RAD50, JUN, PTEN, PTGS2, CDC25C, CDK1, MAPK14, TP53, TP53BP1, MYC, SYK, GAB2, ANXA1, PRKCA, PAX8 and JAK2 formed the primary gene-network in the non-adherent OVCAR4 cells (Supplementary Fig-2F). Importantly, we found that the FOXM1 and CASP8 are the genes which are upregulated in the AD network, whereas EGFR, ERBB2, GAB2 and PTEN are upregulated in the NAD gene network in both qPCR array and RPPA. Taken together, our RPPA results together supports the contention that FOXM1 is important for ovarian cancer cell adhesion, and EGFR and/or ERBB2 is required for NAD spheroid formation.
ERBB2 and ERBB1 (EGFR) mediated signaling is important for survival and growth of NAD spheroids and cancer stemness
To further confirm the effects EGFR and ERBB2 on the growth of NAD cells compare to AD cells, we collected lysates from AD cells were grown on mesothelial cells as monolayer and NAD cells were grown on low attachment plate and found that both native and phosphorylated forms of EGFR and ERBB2 are upregulated in the NAD cells compared to AD cells of ovarian cancer (Fig-3A and 3B). It is well known that binding of the ligands to EGFR leads to the phosphorylation of ERBB1 and ERBB2 (13,25,26). Therefore, we measured the levels of EGFR-ligands in the culture-media of AD and NAD cells. Our results demonstrated that Epidermal Growth Factor (EGF), Amphiregulin (AREG) and TGF-alpha (TGF-α) are markedly elevated in culture media of NAD cells compared to AD cells (Fig-3C to 3E). EGFR family ligands EGF, AREG, or TGF-α also improved the spheroid forming ability of OVCAR4 and OVCAR5 cells (Fig-3F). We had shown previously that breast cancer spheroids have characteristics of cancer stem cells (CSC) (27). Here we also found that ovarian cancer spheroids express high levels of CD44, and CD117 (c-KIT) proteins that are found on CSC (Supplementary Fig-3A). In conjunction, NAD cells expressed high levels of CD133 and Endoglin and low levels of CD24, which are bona fide markers of ovarian cancer stem cells (Supplementary Fig-3B and Supplementary Fig 3C). Next, we determined the effect of EGF and TGF-α on the expression of CSC markers in NAD cells and found that both EGF and TGF-α increased expression of CD44, CD117 (c-KIT) and Prominin (CD133) and reduced expression of CD24 in favor to support the contention that EGFR ligands promote cancer stemness (Fig-3G).
Figure-3: NAD population of ovarian cancer cells express high levels of ERBB receptors and exhibits cancer stem cell properties.

A, GFP-positive OVCAR4 and OVCAR5 cells were grown on ~90% confluent RFP-labelled MeT-5A mesothelial cells on regular culture plates as adherent (AD) populations for 24h and photographed. B, Total cell lysates prepared from NAD and AD cells as in Fig-1B were FACS sorted for tumor cells and immunoblotted. C-E, Culture supernatant from AD and NAD conditions were collected from (A) and ELISA was performed. F, Ovarian cancer cells (1X10³ cells/well) were grown on non-adherent conditions for 5 days in the presence of EGF, Amphiregulin or TGF-α at a concentration of 20 ng/ml and number of spheroids formed were quantitated. *pValue <0.01 compared to the respective control. G, mRNA collected from the spheroids were treated with EGF, Amphiregulin, and TGF-α or from the control group as in (F) and qPCR was performed. H, Schema shows how EpCAM +ve, and CD-45 -ve ovarian cancer cells were isolated from ascites fluid and metastatic sites of ovarian cancer patients by FACS. AD cells from omentum and NAD cells from ascites were lysed and immunoblotted. I, Schema shows the receptors and their ligands, which are critical for the survival and growth of ovarian cancer spheroids.
To further validate our results in patient’s samples, we isolated EpCAM+ and CD45- cancer cells from tumor omentum for AD cells and from ascites fluid for NAD cells from high-grade serous patients who are in advanced stage of ovarian cancer cells by performing FACS and performed immunoblot. Here we showed that NAD cells in both patients expressed high levels of EGFR, and ERBB2 as well as phosphorylated forms of EGFR (Y1068) and ERBB2 (Y1248) compared to the AD population (Fig-3H). In a complementary approach, we knocked down EGFR, ERBB2 or both using small hairpin RNA (shRNAs) in OVCAR5 cells and found that the loss of expression of either EGFR or ERBB2 reduced the number of ovarian cancer spheroids, where the stable knocked down of both EGFR and ERBB2 significantly inhibited the number of spheroids as well as cancer stemness markers as compared to the knockdown of EGFR or ERBB2 individually (Supplementary Fig-3D and Supplementary 3E). In conjunction, silencing of EGFR or ERBB2 inhibited the levels of CD44 and cKIT while silencing of both EGFR and ERBB2 inhibited the levels of CD44 and cKIT and upregulated the levels of CD24 more effectively than the knockdown of either EGFR or ERBB2 alone (Supplementary Fig-3F).
We also found that the use of Trastuzumab a monoclonal antibody that target ERBB2, or the EGFR inhibitor Erlotinib inhibited the tumor spheroid formation and the expression of cancer stemness markers (Supplementary Fig-3G and Supplementary Fig-3H). Importantly the treatment of GW2974 (lapatinib), which is a dual kinase inhibitor of both EGFR and ERBB2 inhibited the spheroid formation and the expression of cancer stem cell markers more effectively than inhibiting EGFR or ERBB2 alone (Supplementary Fig-3G and Supplementary Fig-3H). Altogether our results demonstrate that EGFR signaling is important for spheroid formation and cancer stemness of ovarian cancer cells (Fig-3I).
FOXM1-mediated regulation of integrins and matrix proteins is required for AD phenotype of ovarian cancer cells
We also observed that FOXM1 and integrins such as integrin Beta 1 (ITGB1), integrin-α V (ITGAV), and integrin-α 5 (ITGA5) upregulated in the AD cells were grown on MeT-5A cells compared to the NAD cells of OVCAR4 and OVCAR5 cells (Fig-4A). To confirm the role of FOXM1 on adhesion of ovarian cancer spheroids, we knocked down FOXM1 in OVCAR4 and OVCAR5 cells in ovarian cancer spheroids (Fig-4B and 4C) and determined their adhesion capacity and found that knockdown of FOXM1 siRNA reduced the number of adherent colonies but increased the number of NAD spheroids compared to control (Fig-4D). To determine if FOXM1 regulate integrin expression, we silenced FOXM1 using target specific siRNAs, which again showed that the loss of FOXM1 reduced expression of ITGB1, ITGAV, ITGA5, LMNB1 and FN1 mRNA in both OVCAR4 and OVCAR5 cells (Fig-4E). Further, our immunoblot analysis also confirmed that the loss of FOXM1 decreased levels of ITGB1, ITGAV, and ITGA5 proteins (Fig-4F). We also confirmed that AD cells of ovarian cancer cells from tumor omentum in ovarian cancer patients (see Figure-3H) expressed high levels of FOXM1, ITGB1, ITGAV, and ITGA5 compared to the NAD cells from the ascites fluid from ovarian cancer patients (Fig-4G). Subsequently, we measured expression of FOXM1, ITGB1, ITGA5, ITGAV, EGFR, and ERBB2 in AD tumor cells isolated from the omentum and NAD tumor cells isolated from ascites fluid of mice bearing OVCAR4 and OVCAR5 ovarian cancer cells (Supplementary Fig-4). In sum, our data demonstrate that FOXM1 is associated with expression of integrins and extracellular matrix proteins which are critical for cell adhesion to promote the adhesion of ovarian cancer cells (Fig-4H).
Figure-4: AD population of ovarian cancer cells express high levels of FOXM1 and loss of FOXM1 disrupts the attachment of ovarian cancer cells.

A, Ovarian cancer cell lines OVCAR4 and OVCAR5 were cultured on adherent or non-adherent culture plate for 24h as described in Fig-1B; then cell lysates were prepared and immunoblotted. B-C, Ovarian cancer cells were transfected with two different siRNAs specific to FOXM1 gene or with a control scrambled sequence, then mRNA expression was quantitated by qPCR 36 h after transfection. D, OVCAR4 and OVCAR5 spheroids were transfected with either control siRNAs or two different siRNAs of FOXM1, then seeded on collagen IV coated plate for 4 hours. Non adherent spheroids were then transferred to a different plate after 4h of incubation and the number of AD and NAD colonies were quantitated. E, Total RNA was isolated from the ovarian cancer cells were transfected as in B and C and qPCR was performed. β-actin was used as an internal control and the values are presented as mean ± SE of triplicates. pValues were determined by Student’s t test. F, Lysates were prepared from the ovarian cancer cells were transfected as in B and C and immunoblotted G. AD cells from tumor omentum and NAD cells from ascites of ovarian cancer patients were isolated as described in Fig-3H, then lysed and immunoblotted using the antibodies indicated. H, Schema shows how FOXM1 transcription factor and its target genes regulate the adhesion of ovarian cancer cells.
FOXM1 regulates integrin expression transcriptionally for cancer cell adhesion
To determine the effect of FOXM1 on cell adhesion, we overexpressed FOXM1 in immortalized ovarian surface epithelial cells (IOSE-80) and fallopian tube epithelial cells (FTE-187), which express low levels of FOXM1 (Supplementary Fig-5A) and plated on the culture dishes coated with different extracellular matrix (ECM) such as collagen-IV, fibronectin, vitronectin, and laminin and Poly D Lysine and found that the cells expressing high levels of FOXM1 adhered rapidly to the ECM components compared to control cells (Fig-5A and 5B). We also found that FOXM1 upregulated expression of ITGB1, ITGAV, ITGA5, LMNB1 and FN1 (Fig-5C to Fig-5E) in both IOSE-80 and FTE-187 cells.
Figure-5: FOXM1upregulates the expression of integrins for the adhesion of ovarian cancer cells.

A-B, Schema shows Fallopian tube epithelial cells (FTE-187) or immortalized ovarian surface epithelial cells (IOSE80) cells were transfected with the vector control pCF-G03 or pCF-FOXM1plasmid, then seeded on indicated component of extracellular matrix for 4 hours for cell adhesion. Non-adherent cells were removed after washing and stained using crystal violet (A), eluted crystal violet was quantified at OD 560nm (right). C, Lysates were prepared from FTE-187 and IOSE80 cells were transfected with control plasmid or pCF-FOXM1 plasmid 24h after transfection and immunoblot was performed using indicated antibodies. D-E, Total RNA was collected from C and qPCR was performed to determine the expression of the genes indicated. β-actin was used as an internal control and the values are presented as mean ± SE of triplicates and pValues were determined by the Student’s t-test. F-G, Enrichment of FOXM1 binding on the promoters of indicated genes was determined by qPCR followed by chromatin immunoprecipitation (ChIP) of FOXM1. Immunoprecipitation was performed using anti-FOXM1 antibody, anti-IgG control antibody, or no antibody (negative control). 0.5% of input chromatin (Input DNA lane) served as the control for PCR reaction. AURKB and ACTB were used as either positive or negative control respectively. Bars indicate the average of percentages of input precipitated with the FOXM1 antibody or nonspecific IgG in triplicates with SE. Statistical analysis was done by Student’s t test. *** p<0.001 and ****p<0.0001 H, PCR amplified products from F and G were resolved on 2% agarose gel and photographed after ethidium bromide staining. Error bar indicated mean± SE of triplicates and pValues were determined by Student’s t-test in A to G. I, OVCAR5 cells were seeded on non-adherent culture plate (100,000 cells/well) for 24h to form non-adherent spheroids. Non-adherent spheroids were plated on culture plates coated with laminin, fibronectin, or col-IV and then harvested after 4 hours of incubation and lysates were prepared immunoblotted.
To determine if FOXM1 directly regulates transcription of ITGB1, ITGAV, ITGA5, LMNB1 and FN1, we performed chromatin immunoprecipitation (ChIP) by targeting FOXM1 transcription factor using monoclonal antibodies specific to FOXM1. Our ChIP demonstrated that FOXM1 directly binds promoters of ITGB1, ITGAV, ITGA5, LMNB1 and FN1 in both OVCAR4 and OVCAR5 cells (Fig-5F to Fig-5H). To prove that FOXM1-mediated upregulation of integrins and matrix proteins are necessary for ovarian cancer cell adhesion, we overexpressed FOXM1 expression in the OVCAR4 and OVCAR5 cells which were pre-transfected with either control siRNA or FOXM1 siRNA and determined cell adhesion. Here we found that FOXM1 overexpression rescued the cell adhesion ability of both OVCAR4 and OVCAR5 cells, which were pre-transfected with FOXM1 siRNA (Supplementary Fig 5B and Supplementary Fig 5C). In conjunction with our adhesion results, our immunoblot also showed that the overexpression of FOXM1 rescued the levels of integrins ITGAV, ITGA5, and ITGB1, which were reduced by the siRNAs of FOXM1 (Supplementary Fig-5D).
Studies have demonstrated that the arginine-glycine-aspartic acid (RGD) sequence in fibronectin, collagens and laminin is the binding domain of integrin pairs such as αvβ3 and α5β1 during cellular adhesion (28). However, the role of integrin signaling on FOXM1 has not been established. We found that activation of integrin β1 signaling by matrigel, laminin and fibronectin promoted expression of FOXM1 (Supplementary Fig-6) and that an integrin β1 blocking antibody reduced FOXM1 expression induced by matrigel, laminin and fibronectin (Supplementary Fig-6). We also found that the components of extracellular matrix such as laminin, fibronectin and collagen-IV upregulated FOXM1, ITGAV, ITGA5, and ITGB1 in OVCAR5 ovarian cancer cells (Fig-5I). Taken together, our results demonstrate that FOXM1 directly regulates transcription of ITGAV, ITGA5, ITGB1, LMNB1, and FN1 which are key factors for the adhesion of ovarian cancer cells and that integrin signaling can induce FOXM1 expression supporting a feed forward signaling loop.
ZEB1 acts as an intermediary regulator of EGFR/ERBB2 or FOXM1 mediated effects for the transition between AD and NAD states
EGF-like growth factors upregulate EMT-inducing transcription factors in cancer cells (24,29). To identify the key transcription factors regulated by ERBB signaling, we determined the effect of EGF family ligands on expression of transcription factors that can induce EMT. Our results show that EGF upregulated ZEB1 more than 8-fold compared to an ~2-fold increase in ZEB2, SNAI1, and TWIST1 in both OVCAR4 and OVCAR5 cells (Supplementary Fig-7A). Importantly, anti-ERBB2 antibody Trastuzumab, EGFR inhibitor Erlotinib and the dual kinase inhibitor of EGFR and ERBB2 Lapatinib were able to reduce the levels of ZEB1 (Supplementary Fig-3H). While we identified that ZEB1 is a key downstream effector of EGFR and ERBB2 proteins, we also found that the loss of ZEB1 expression using siRNAs, downregulated the expression of EGFR, ERBB2, and secreted levels of EGF but upregulated the expression of FOXM1 in both OVCAR4 and OVCAR5 cells (Supplementary Fig-7B to Supplementary Fig-7C).
We also noticed that both laminin and fibronectin improved the binding of FOXM1 to ZEB1 promoter in ChIP assays (Fig-6A to Fig-6D). Further both LMNB1 and FN1 upregulated the expression of both FOXM1 and ZEB1 mRNA, where we noticed that FOXM1 which was markedly higher than ZEB1 at early time points then ZEB1 remained in higher level with a decrease in FOXM1 expression at later time points (Fig-6E and Fig-6F). We also observed that ectopic expression of FOXM1 upregulated ZEB1 levels in ovarian cancer cells (Fig-6G). To determine if ZEB1 act as a negative feedback regulator of FOXM1, we inhibited ZEB1 expression using siRNAs and found that FOXM1 expression is sustained in cells where ZEB1 is knocked down (Fig-6H).
Figure-6: FOXM1 regulate the transcription of ZEB1, which act as a feedback inhibitor of FOXM1 for phenotypic plasticity.

A-B, Enrichment of FOXM1 binding on the promoters of ZEB1 was determined by qPCR followed by ChIP of FOXM1 in ovarian cancer cells that were stimulated with Laminin (20 ng/ml) or Fibronectin (20 ng/ml) for 6h. Immunoprecipitation was performed using anti-FOXM1 antibody, anti-IgG control antibody, or no antibody (negative control). 0.5% of input chromatin (Input DNA lane) served as the control for PCR reaction. Bars indicate the average of percentages of input precipitated with the FOXM1 antibody or nonspecific IgG in triplicates with SE. pValues were determined by Student’s t-test. ****p<0.001 C-D, PCR amplified products from A and B were resolved on 2% agarose gel and photographed after ethidium bromide staining. E-F, OVCAR4 cells were stimulated with Laminin or Fibronectin (FN, 20 ng/ml) for 6 hours as indicated. Total RNA was isolated at the indicated time points and qPCR was performed to quantitate the expression of FOXM1 and ZEB1. Error bars indicate SE of triplicate points of determinations. 0 indicates the time point before the cells were adhered on either Laminin or Fibronectin. G, OVCAR4 cells were transfected with pCF-G03 vector control or pCF-FOXM1 plasmid and total RNA was isolated at the indicated time points after transfection. H, pCF-G03 vector control or pCF-FOXM1 plasmid were transfected in OVCAR4 cells were pre-transfected with target-specific ZEB1 siRNA. Total RNA was isolated at the indicated time points after pCF-G03 vector control or pCF-FOXM1 plasmid. qPCR was performed to determine FOXM1 mRNA expression. I, Map of tetracycline (tet) inducible pFLCt vector express GFP, where we cloned ZEB1 for stable gene expression. Cells stably express inducible ZEB1-GFP were selected by FACS after tetracycline (1μg/ml) treatment. J, Cell lysates were prepared from OVCAR5 cells stably express inducible control GFP or ZEB1-GFP after tetracycline (1μg/ml) stimulation and immunoblot was performed after 24h of stimulation. β-actin was used as a loading control. K, OVCAR5 cell spheroids stably express inducible ZEB1-GFP were grown on ECM coated plate for 4 h and then stimulated with tetracycline (1μg/ml) for 48h for ZEB1 induction and the spheroids were photographed, and number of adherent and non-adherent spheroids were quantitated. L, OVCAR5 cell spheroids stably express inducible ZEB1-GFP were grown on ECM coated plate for 4 h and then stimulated with tetracycline (1μg/ml) for ZEB1 induction for indicated time points and immunoblotted. M, OVCAR5 cells were seeded on non-adherent culture plate (100,000 cells/well) for 24h to form non-adherent spheroids, then plated on culture plates coated with laminin, fibronectin, or col-IV and then harvested after 4 hours of incubation and lysates were immunoblotted. N, Model proposes how ZEB1 act as an intermediary regulator of FOXM1 and ERBB family receptors in ovarian cancer cells.
Next, we used an efficient and controlled model for ZEB1 induction using tetracycline (tet) inducible vector to validate how ZEB1 induction dysregulate EGFR/ERBB signaling and FOXM1 target genes. Here, we found that ZEB1 induction decreased adhesion of ovarian cancer cells as compared to their control groups (Figure 6I to 6K) along with a decrease in the levels of FOXM1, and integrins such as ITGAV, ITGA5, and ITGB1 (Figure 6L). In contrast, we found that ZEB1 induction upregulated the levels of EGFR and ERBB2 modestly compared to the 0-time point (Figure 6L). We also observed that ZEB1 induction resulted in an increase in the phosphorylation of EGFR and ERBB2 suggesting that the autocrine signaling activated by ZEB1 induction causes the phosphorylation potentially due to the upregulation of growth factors like EGF (Figure 6L and Supplementary Fig. 7D–7E). In contrast the stimulation of tumor cells with laminin, fibronectin and collagen-IV resulted a decrease in the basal level of the phosphorylation of EGFR and ERBB2 with a slight decrease in ZEB1 level (Fig-6M). Taken together, our data demonstrate that ZEB1 act as a regulator of EGFR/ERBB2, which also act as a negative feedback regulator of FOXM1. We also found that the activation of integrins by the components of extracellular matrix can also upregulate FOXM1 and ZEB1 acts as an intermediary regulator required for the transition between AD and NAD form of cancer cells (Fig-6N).
Combinatorial inhibition of FOXM1 and EGFR/ERBB2 Receptors Block Ovarian Cancer Progression More Effectively than Single Treatment
In this experiment, we determined if combining FOXM1 or ERBB2 inhibitors together could control ovarian cancer growth in vivo by combining the FOXM1 inhibitor Thiostrepton and ERBB family inhibitor Lapatinib to treat immune competent FVB mice bearing BR-Luc murine ovarian cancer cells, which express comparable levels of ERBB2, EGFR and FOXM1 as in human ovarian cancer cell lines OVCAR4 and OVCAR5 (Supplementary Fig-8A). Here, we found that monotherapy with Thiostrepton or Lapatinib treatment reduced tumor nodules, peritoneal seeding to distant organ sites, ascites volume and total tumor weight compared to controls, while the combination of both Thiostrepton and Lapatinib was more effective than the single treatment (Fig-7A to 7F). We noticed that the monotherapy decreased tumor weight by about 50%, whereas the combination therapy decreased tumor weight by 75%. We also noticed that one mouse in the Thiostrepton or Lapatinib groups did not have detectable tumor at the primary site, while two mice with the combination of both Thiostrepton and Lapatinib did not have detectable tumors at the end of experiment (Fig-7D). In conjunction, the combination of Thiostrepton and Lapatinib reduced tumor weight in distant sites more effectively than the single agent treatment. Of note, two mice did not have detectable tumor growth in distant sites and in two mice inhibited tumor growth ~90% upon combination therapy (Fig-7E).
Figure-7: Combinatorial effect of targeting of EGFR/ERBB1 receptors and FOXM1 on overall tumor burden and peritoneal seeding of ovarian cancer.

A, BR-Luc ovarian cancer cells stably express luciferase reporter (1X10⁵ cells) were injected orthotopically into the left ovary of female FVB mice (n=7). Tumor growth was monitored every week for 8 weeks using IVIS imaging system and representative images captured on indicated days were presented (A). B, Luminescence intensity quantitated from each group in (A) were plotted. Tumor growth presented as average of total flux/sec of luminescence at the indicated time points. Error bars indicates average ± SE of luminescence intensity quantitated in 7 mice. pValues were determined by ANOVA. **p<0.001, and *p<0.01 compared to the control. C, Mortality of mice in each group as in (A) was monitored, and survival rates were quantified by Kaplan-Meier analyses and pValues were determined using the log-rank test (n = 10 mice per group). *pValue < 0.001 and #pValue < 0.002, when the indicated groups compared with the control, $pValue < 0.05, when the combination group compared with single treatment group. D-G, Mice from (A) were sacrificed on 56th day after tumor inoculation. Tumors from primary and distant organ sites and ascites fluid from peritoneal fluid were collected. Tumor weight, number of spheroids, and ascites volume were quantitated. Error bars indicates average ± SE. pValues were determined by Anova. G-H, Tumor spheroids from the ascites fluid filtered using 50 μM filter, then the spheroids were plated in 6 well culture plate and the number of spheroids were quantitated and imaged after crystal violet staining. I, Tumor tissues were lysed in quadruplicates and immunoblotted.
The combination treatment also reduced the ascites volume and the number of tumor spheroids in ascites fluid more than monotherapy, where we noticed that five mice did not develop ascites in the combination group (Fig-7F to 7H). Next, we determined the effect of Lapatinib and Thiostrepton on ERBB and FOXM1 protein levels and found that Lapatinib treatment reduced total and phosphorylated forms of EGFR and ERBB2 but upregulated FOXM1 levels in ovarian cancer spheroids (Fig-7I). In contrast, Thiostrepton reduced FOXM1 but induced phosphorylated EGFR and ERBB2 (Fig-7I). Monotherapy with FOXM1 or ERBB2 inhibitors only slightly increased levels of cleaved caspase-3 but combination of both FOXM1 and ERBB2 inhibitors clearly induced cleaved caspase-3 (Fig-7I and Supplementary Fig-8B). As expected, monotherapy with Lapatinib or Thiostrepton reduced ZEB1 and PCNA modestly, while the combination reduced ZEB1 and PCNA levels strongly (Fig-7I and Supplementary Fig-8B).
We found that knockdown of FOXM1 reduced the overall tumor growth in peritoneal cavity modestly, whereas the dual knockdown of EGFR and ERBB2 reduced total tumor weight and the number of tumor spheroids in the peritoneal fluid more effectively than compared to loss of FOXM1 expression in the early time points. These data suggest that EGFR/ERBB2-signaling is important for the peritoneal dissemination relatively in the early period of tumor spread (Supplementary Fig-9A to Supplementary Fig-9C). We found that Thiostrepton and Lapatinib reduced the tumor growth and the number of spheroids in the peritoneal fluid compared to the control BR-Luc cells, when we terminated the experiment at a later time point. Lapatinib treatment was more effective in reducing the overall tumor growth and the number of tumor spheroids of BR-Luc cells express control sh-RNA in the ascites fluid at the later time point. We noticed that stable knockdown of FOXM1 or stable knockdown of EGFR and ERBB2 reduced the overall tumor growth modestly at the later time point. Notably, the treatment of GW2974 (lapatinib) in FOXM1 knockdown group reduced tumor growth ~80% compare to the control group. Furthermore, the treatment of Thiostrepton in EGFR/ERBB2 knockdown group inhibited overall tumor growth ~70% compared to the control (Supplementary Fig-9D). While the knockdown of FOXM1 reduced the number of spheroids in the ascites fluid partially; we observed that the knockdown of EGFR and ERBB2 reduced number of tumor spheroids ~90% in the ascites fluid. Strikingly, the treatment of GW2974 (lapatinib) abrogated tumor spheroid formation ~75% in the control group, whereas GW2974 treatment markedly reduced the number of spheroids in the ascites (Supplementary Fig-9D and Supplementary Fig-9F).
Discussion
The spreading of tumor cells begins with extensive shedding of ovarian cancer cells from the ovary and fallopian tube and their growth as spheroids in the abdomen. The subsequent attachment and infiltrative pattern of ovarian cancer cells to the peritoneum and abdominal organs makes the complete surgical resection and removal of ovarian cancer cells from abdomen infeasible. Our model of peritoneal spread showed that ERBB2/EGFR and FOXM1 signaling contribute to growth of cells as spheroids as well as attachment and infiltration, and thus, represent the potential targets to prevent peritoneal spreading that we confirmed by combination therapy in animal models of ovarian cancer.
We demonstrated that FOXM1 is required for the expression of ITGB1, ITGA5 and ITGAV that are critical for adhesion of ovarian cancer cells. It has been reported that ITGB1 regulates the formation and adhesion of ovarian carcinoma multicellular spheroids (30). We identified that FOXM1 upregulates ZEB1, which in turn inhibits FOXM1 expression through a negative feedback mechanism. Given that ZEB1 can control the plasticity between FOXM1 or ERBB signaling in ovarian cancer cells, our data shows that ZEB1 acts as a molecular switch which determines the characteristics of ovarian cancer to become AD or NAD form. It is known that TP53 mutations of both truncated and missense mutations are common genetic aberrations in ovarian cancer (31). In contrast, we identified the presence of p53 gene network and its connectivity with PAX-8, and ITGA5 in the adherent cells indicate that mutated p53 can regulate the expression of genes required for cell adhesion and tumor cell motility likely through its gain of function effects. Studies have shown that epithelial to mesenchymal transition (EMT) regulating transcription factors including ZEB, SNAIL and TWIST are critical factors for cellular transformation as well as stemness in breast, ovary and lung cancer (24,32). Furthermore, activation of integrin signaling upregulates FOXM1 in AD ovarian cancer cells potentially representing a feed forward loop to accentuate cell adhesion. Integrins are the major mediators of adhesion between tumor cells and extracellular matrix (ECM) proteins and they transduce signals required for cell survival. Integrin signaling is impaired while tumor cells detached from the primary tumor during peritoneal spreading, when the cells adopt a different mechanism to compensate the survival signaling.
We demonstrated that ERBB signaling is an important survival mechanisms of ovarian cancer cells in NAD form. In conjunction, others have also showed that ERBB signaling promoted the survival of tumor cells by activating ERK signaling and inhibiting the levels of apoptotic mediator BIM (33). Amplification or overexpression of various EGFR family members and their ligands have been reported in epithelial ovarian cancer (34–36). However, anti-EGFR-targeted therapy has shown limited clinical results in ovarian cancer to date and the reason behind the mechanism that causes limited efficacy is not well understood.
Earlier studies had shown that ERBB2 overexpression in ovarian cancer is a frequent event but studies using datasets consists of large number of clinical samples have shown that ERBB2 overexpression and amplification appears to be a relatively rare event in ovarian cancer (37). Importantly, overexpression of ERBB2 associates with a poor outcome in ovarian cancer patients (38). Expression of the EGFR varies from 9–62% in ovarian cancer patients with its increased expression also correlating with poorer patient outcomes (34). We found that knocking down of either EGFR or ERBB2 have similar effect on reducing the number of non-adherent spheroids and inhibiting the levels of proteins required for cancer stemness likely due to that EGFR and ERBB2 activate similar downstream effectors and transcriptional program than distinct or independent signaling pathways (39,40). Several small molecule inhibitors that block EGFR kinase activity such as Gefitinib and Erlotinib have with only limited significant responses observed. ~37% of the Gifitinib treated patients had stable disease for over two-months with no partial or complete responses (41). With Erlotinib, 4 out of 27 patients had progression-free disease for more than 6 months and 1 of these 4 patients had an objective response (34,42,43). Similarly, anti-ERBB2 therapies have not demonstrated significant effects as therapeutic agents in ovarian cancer. A phase II trial with trastuzumab (Herceptin, Genentech, Inc.), a humanized anti-ERBB2 monoclonal antibody that is effective in ERBB2-overexpressing breast cancer, reported a 7% partial responses with only a two-month progression-free interval in recurrent ERBB2 expressing ovarian cancers (44). This ineffectiveness of anti-ERBB therapy may be explained partly by our model, which shows that alternate signaling mechanisms due to signaling plasticity regulated by transcription factors ZEB1 and FOXM1 may contribute to tumor cell survival and peritoneal spread. Therefore, targeting of FOXM1 using Thiostrepton and concurrently inhibiting both ERBB2 and EGFR using Lapatinib or other irreversible inhibitors such as Neratinib or Afatinib could be a promising strategy to eliminate peritoneal spreading and metastasis of ovarian cancer and improve the quality of life of ovarian cancer patients.
Supplementary Material
Significance:
This study describes the mechanism exhibited by ovarian cancer cells required for adherent cell transition to non-adherent form during peritoneal spread and metastasis.
Acknowledgement
P.C.R. is supported by the NCI (1R01CA229907), the Ovarian Cancer Research Fund Alliance (OCRFA), DoD Breast Cancer Research Program (W81XWH-18-1-0024), the Women’s Health Research Program (WHRP) at MCW, American Cancer Society’s Institutional Research Grant (ACS-16-183-31), and research funds from MCW’s Cancer Center. S.P. is supported by the Ovarian Cancer Research Fund Alliance (OCRFA) and research funds from WHRP at MCW. Y.L. is supported by NIH R50CA221675. G.B.M. is supported by the NCI (CA217685, CA217842, and R01CA123219-01) and OCRFA.
Competing Interests
G.B.M. has received sponsored research support from Abbvie, AstraZeneca, Critical Outcomes Technology, Horizon Diagnostics, Illumina, Immunomet, Ionis, Karus Therapeutics, Nanostring, Pfizer, Takeda/Millennium Pharmaceuticals, and Tesaro; has ownership interest in Catena Pharmaceuticals, PTV Ventures, and Spindle Top Ventures; and is a consultant/advisory board member of AstraZeneca, Catena Pharmaceuticals, Critical Outcome Technologies, ImmunoMET, Ionis, Medimmune, Nuevolution, Pfizer, Precision Medicine, Signalchem Lifesciences, Symphogen, Takeda/Millennium Pharmaceuticals, and Tarveda. All other authors except G.B.M. declare no competing interests.
Reference:
- 1.Vaughan S, Coward JI, Bast RC Jr., Berchuck A, Berek JS, Brenton JD, et al. Rethinking ovarian cancer: recommendations for improving outcomes. Nat Rev Cancer 2011;11:719–25 [DOI] [PMC free article] [PubMed] [Google Scholar]
- 2.Mills GB, May C, McGill M, Roifman CM, Mellors A. A putative new growth factor in ascitic fluid from ovarian cancer patients: identification, characterization, and mechanism of action. Cancer Res 1988;48:1066–71 [PubMed] [Google Scholar]
- 3.Xu Y, Gaudette DC, Boynton JD, Frankel A, Fang XJ, Sharma A, et al. Characterization of an ovarian cancer activating factor in ascites from ovarian cancer patients. Clin Cancer Res 1995;1:1223–32 [PubMed] [Google Scholar]
- 4.Mills GB, May C, Hill M, Campbell S, Shaw P, Marks A. Ascitic fluid from human ovarian cancer patients contains growth factors necessary for intraperitoneal growth of human ovarian adenocarcinoma cells. J Clin Invest 1990;86:851–5 [DOI] [PMC free article] [PubMed] [Google Scholar]
- 5.Wintzell M, Hjerpe E, Avall Lundqvist E, Shoshan M. Protein markers of cancer-associated fibroblasts and tumor-initiating cells reveal subpopulations in freshly isolated ovarian cancer ascites. BMC Cancer 2012;12:359. [DOI] [PMC free article] [PubMed] [Google Scholar]
- 6.Maihle NJ, Baron AT, Barrette BA, Boardman CH, Christensen TA, Cora EM, et al. EGF/ErbB receptor family in ovarian cancer. Cancer Treat Res 2002;107:247–58 [DOI] [PubMed] [Google Scholar]
- 7.Laoukili J, Kooistra MR, Bras A, Kauw J, Kerkhoven RM, Morrison A, et al. FoxM1 is required for execution of the mitotic programme and chromosome stability. Nat Cell Biol 2005;7:126–36 [DOI] [PubMed] [Google Scholar]
- 8.Vaske CJ, Benz SC, Sanborn JZ, Earl D, Szeto C, Zhu J, et al. Inference of patient-specific pathway activities from multi-dimensional cancer genomics data using PARADIGM. Bioinformatics 2010;26:i237–45 [DOI] [PMC free article] [PubMed] [Google Scholar]
- 9.Schaefer CF, Anthony K, Krupa S, Buchoff J, Day M, Hannay T, et al. PID: the Pathway Interaction Database. Nucleic Acids Res 2009;37:D674–9 [DOI] [PMC free article] [PubMed] [Google Scholar]
- 10.Cancer Genome Atlas Research N. Integrated genomic analyses of ovarian carcinoma. Nature 2011;474:609–15 [DOI] [PMC free article] [PubMed] [Google Scholar]
- 11.Park HJ, Gusarova G, Wang Z, Carr JR, Li J, Kim KH, et al. Deregulation of FoxM1b leads to tumour metastasis. EMBO Mol Med 2011;3:21–34 [DOI] [PMC free article] [PubMed] [Google Scholar]
- 12.Raychaudhuri P, Park HJ. FoxM1: a master regulator of tumor metastasis. Cancer Res 2011;71:4329–33 [DOI] [PMC free article] [PubMed] [Google Scholar]
- 13.Pradeep CR, Zeisel A, Kostler WJ, Lauriola M, Jacob-Hirsch J, Haibe-Kains B, et al. Modeling invasive breast cancer: growth factors propel progression of HER2-positive premalignant lesions. Oncogene 2012;31:3569–83 [DOI] [PMC free article] [PubMed] [Google Scholar]
- 14.Pradeep CR, Kostler WJ, Lauriola M, Granit RZ, Zhang F, Jacob-Hirsch J, et al. Modeling ductal carcinoma in situ: a HER2-Notch3 collaboration enables luminal filling. Oncogene 2012;31:907–17 [DOI] [PMC free article] [PubMed] [Google Scholar]
- 15.Hennessy BT, Lu Y, Gonzalez-Angulo AM, Carey MS, Myhre S, Ju Z, et al. A Technical Assessment of the Utility of Reverse Phase Protein Arrays for the Study of the Functional Proteome in Non-microdissected Human Breast Cancers. Clin Proteomics 2010;6:129–51 [DOI] [PMC free article] [PubMed] [Google Scholar]
- 16.Chaluvally-Raghavan P, Jeong KJ, Pradeep S, Silva AM, Yu S, Liu W, et al. Direct Upregulation of STAT3 by MicroRNA-551b-3p Deregulates Growth and Metastasis of Ovarian Cancer. Cell Rep 2016;15:1493–504 [DOI] [PMC free article] [PubMed] [Google Scholar]
- 17.Parashar D, Geethadevi A, Aure MR, Mishra J, George J, Chen C, et al. miRNA551b-3p Activates an Oncostatin Signaling Module for the Progression of Triple-Negative Breast Cancer. Cell Rep 2019;29:4389–406 e10 [DOI] [PMC free article] [PubMed] [Google Scholar]
- 18.Livak KJ, Schmittgen TD. Analysis of relative gene expression data using real-time quantitative PCR and the 2(-Delta Delta C(T)) Method. Methods 2001;25:402–8 [DOI] [PubMed] [Google Scholar]
- 19.Komurov K, Dursun S, Erdin S, Ram PT. NetWalker: a contextual network analysis tool for functional genomics. BMC Genomics 2012;13:282. [DOI] [PMC free article] [PubMed] [Google Scholar]
- 20.Jagadish N, Gupta N, Agarwal S, Parashar D, Sharma A, Fatima R, et al. Sperm-associated antigen 9 (SPAG9) promotes the survival and tumor growth of triple-negative breast cancer cells. Tumour Biol 2016;37:13101–10 [DOI] [PubMed] [Google Scholar]
- 21.Gong X, Hou Z, Endsley MP, Gronseth EI, Rarick KR, Jorns JM, et al. Interaction of tumor cells and astrocytes promotes breast cancer brain metastases through TGF-beta2/ANGPTL4 axes. NPJ Precis Oncol 2019;3:24. [DOI] [PMC free article] [PubMed] [Google Scholar]
- 22.Nair B, Wong-Riley MT. Transcriptional Regulation of Brain-derived Neurotrophic Factor Coding Exon IX: ROLE OF NUCLEAR RESPIRATORY FACTOR 2. J Biol Chem 2016;291:22583–93 [DOI] [PMC free article] [PubMed] [Google Scholar]
- 23.Wang IC, Chen YJ, Hughes D, Petrovic V, Major ML, Park HJ, et al. Forkhead box M1 regulates the transcriptional network of genes essential for mitotic progression and genes encoding the SCF (Skp2-Cks1) ubiquitin ligase. Mol Cell Biol 2005;25:10875–94 [DOI] [PMC free article] [PubMed] [Google Scholar]
- 24.Mani SA, Guo W, Liao MJ, Eaton EN, Ayyanan A, Zhou AY, et al. The epithelial-mesenchymal transition generates cells with properties of stem cells. Cell 2008;133:704–15 [DOI] [PMC free article] [PubMed] [Google Scholar]
- 25.Emde A, Pradeep CR, Ferraro DA, Ben-Chetrit N, Sela M, Ribba B, et al. Combining epitope-distinct antibodies to HER2: cooperative inhibitory effects on invasive growth. Oncogene 2011;30:1631–42 [DOI] [PMC free article] [PubMed] [Google Scholar]
- 26.Zwang Y, Sas-Chen A, Drier Y, Shay T, Avraham R, Lauriola M, et al. Two phases of mitogenic signaling unveil roles for p53 and EGR1 in elimination of inconsistent growth signals. Mol Cell 2011;42:524–35 [DOI] [PMC free article] [PubMed] [Google Scholar]
- 27.Chaluvally-Raghavan P, Zhang F, Pradeep S, Hamilton MP, Zhao X, Rupaimoole R, et al. Copy number gain of hsa-miR-569 at 3q26.2 leads to loss of TP53INP1 and aggressiveness of epithelial cancers. Cancer Cell 2014;26:863–79 [DOI] [PMC free article] [PubMed] [Google Scholar]
- 28.Goel HL, Languino LR. Integrin signaling in cancer. Cancer Treat Res 2004;119:15–31 [DOI] [PubMed] [Google Scholar]
- 29.Amit I, Citri A, Shay T, Lu Y, Katz M, Zhang F, et al. A module of negative feedback regulators defines growth factor signaling. Nat Genet 2007;39:503–12 [DOI] [PubMed] [Google Scholar]
- 30.Casey RC, Burleson KM, Skubitz KM, Pambuccian SE, Oegema TR Jr., Ruff LE, et al. Beta 1-integrins regulate the formation and adhesion of ovarian carcinoma multicellular spheroids. Am J Pathol 2001;159:2071–80 [DOI] [PMC free article] [PubMed] [Google Scholar]
- 31.Hoadley KA, Yau C, Wolf DM, Cherniack AD, Tamborero D, Ng S, et al. Multiplatform analysis of 12 cancer types reveals molecular classification within and across tissues of origin. Cell 2014;158:929–44 [DOI] [PMC free article] [PubMed] [Google Scholar]
- 32.Morel AP, Lievre M, Thomas C, Hinkal G, Ansieau S, Puisieux A. Generation of breast cancer stem cells through epithelial-mesenchymal transition. PLoS One 2008;3:e2888. [DOI] [PMC free article] [PubMed] [Google Scholar]
- 33.Reginato MJ, Mills KR, Paulus JK, Lynch DK, Sgroi DC, Debnath J, et al. Integrins and EGFR coordinately regulate the pro-apoptotic protein Bim to prevent anoikis. Nat Cell Biol 2003;5:733–40 [DOI] [PubMed] [Google Scholar]
- 34.Siwak DR, Carey M, Hennessy BT, Nguyen CT, McGahren Murray MJ, Nolden L, et al. Targeting the epidermal growth factor receptor in epithelial ovarian cancer: current knowledge and future challenges. J Oncol 2010;2010:568938. [DOI] [PMC free article] [PubMed] [Google Scholar]
- 35.Geethadevi A, Parashar D, Bishop E, Pradeep S, Chaluvally-Raghavan P. ERBB signaling in CTCs of ovarian cancer and glioblastoma. Genes Cancer 2017;8:746–51 [DOI] [PMC free article] [PubMed] [Google Scholar]
- 36.Pradeep S, Kim SW, Wu SY, Nishimura M, Chaluvally-Raghavan P, Miyake T, et al. Hematogenous metastasis of ovarian cancer: rethinking mode of spread. Cancer Cell 2014;26:77–91 [DOI] [PMC free article] [PubMed] [Google Scholar]
- 37.Farley J, Fuchiuji S, Darcy KM, Tian CQ, Hoskins WJ, McGuire WP, et al. Associations between ERBB2 amplification and progression-free survival and overall survival in advanced stage, suboptimally-resected epithelial ovarian cancers: A Gynecologic Oncology Group study. Gynecologic Oncology 2009;113:341–7 [DOI] [PMC free article] [PubMed] [Google Scholar]
- 38.Bookman MA. Developmental chemotherapy and management of recurrent ovarian cancer. J Clin Oncol 2003;21:149s–67s [DOI] [PubMed] [Google Scholar]
- 39.Yarden Y, Pines G. The ERBB network: at last, cancer therapy meets systems biology. Nat Rev Cancer 2012;12:553–63 [DOI] [PubMed] [Google Scholar]
- 40.Yarden Y, Sliwkowski MX. Untangling the ErbB signalling network. Nat Rev Mol Cell Biol 2001;2:127–37 [DOI] [PubMed] [Google Scholar]
- 41.Posadas EM, Liel MS, Kwitkowski V, Minasian L, Godwin AK, Hussain MM, et al. A phase II and pharmacodynamic study of gefitinib in patients with refractory or recurrent epithelial ovarian cancer. Cancer 2007;109:1323–30 [DOI] [PMC free article] [PubMed] [Google Scholar]
- 42.Sheng Q, Liu J. The therapeutic potential of targeting the EGFR family in epithelial ovarian cancer. Brit J Cancer 2011;104:1241–5 [DOI] [PMC free article] [PubMed] [Google Scholar]
- 43.Gordon AN, Finkler N, Edwards RP, Garcia AA, Crozier M, Irwin DH, et al. Efficacy and safety of erlotinib HCl, an epidermal growth factor receptor (HER1/EGFR) tyrosine kinase inhibitor, in patients with advanced ovarian carcinoma: results from a phase II multicenter study. Int J Gynecol Cancer 2005;15:785–92 [DOI] [PubMed] [Google Scholar]
- 44.Bookman MA, Darcy KM, Clarke-Pearson D, Boothby RA, Horowitz IR. Evaluation of monoclonal humanized anti-HER2 antibody, trastuzumab, in patients with recurrent or refractory ovarian or primary peritoneal carcinoma with overexpression of HER2: a phase II trial of the Gynecologic Oncology Group. J Clin Oncol 2003;21:283–90 [DOI] [PubMed] [Google Scholar]
Associated Data
This section collects any data citations, data availability statements, or supplementary materials included in this article.