Abstract
The present study was executed to analyze the functional phytochemicals of hulless barley grass grown under different intensities of ultraviolet stress. The wheat seedlings were imposed to 0.5, 1.0, 1.5, 2.0, and 2.5 h ultraviolet radiation and harvested in different times at vegetative stage. Specifically, the contents of total polyphenols, total flavonoids, total triterpenes, total polysaccharides, proanthocyanidins, and chlorophyll were determined and antioxidants capacity was evaluated by OH• and 2,2’-azino-bis(3-ethylbenzothiazoline-6-sulfonic acid) (ABTS) scavenging ability. A mathematical model (Technique for Order Preference by Similarity to Ideal Solution, TOPSIS) was also employed for the comprehensive evaluation of functional components of hulless barley grass at different growth stages. The results showed that the UV stress could efficiently improve/preserve the contents of total polyphenols, total flavonoids, total triterpenes, total polysaccharides, proanthocyanidins, chlorophyll a, chlorophyll b, and total chlorophyll, as well as the OH• and ABTS scavenging capacity. TOPSIS evaluation revealed that the highest phytochemical contents were yield on the 15th day under 1.0 h ultraviolet treatment.
1. Introduction
Hulless barley (Hordeum vulgare L. var. nudum Hook. f), which is also called naked barley or qingke in Tibet, is categorized into Poaceae (the grass family).1−3 Being an excellent barley germplasm resource, hulless barley has good adaption capacity, strong antiadversity ability and is stable in yielding.2 Hulless barley is consumed as the staple food in the Qinghai-Tibet Plateau including Sichuan, Gansu, Qinghai, and Tibet provinces in China that possesses 77% of the global hulless barley hereditary assets.3 The consumption of whole grain flour of hulless barley is progressively increased as a functional food as it helps to reduce the risks of diseases, such as diabetes, colonic cancer, high blood pressure, gallstones, and hyperlipidemia.4 Recently, cereal grasses are gaining recognition as functional food with potential medical and health benefits.5 The consumption of barley grass as a herbal medicine has been reported in Compendium of Materia Medica in Ming Dynasty of ancient China, as well as in Greek and Roman civilizations.6,7 Its modern interest was sparked in the second half of the 20th century by Dr. Yoshihide Hagiwara who used the grass to nurse himself back to health from mercury poisoning,8 which drew much attention to the therapeutic properties of gramineae grass. In Nepal, the pressed juice of barley grass, also known as “Jamara Ko Juice” and usually harvested on the seventh day, is very popular among residents.9 Barley grass extract was proved to possess potentials of antiobesity, antidiabetes, circulatory disorders prevention, antiarthritis, cholesterol reducing, anticancer, antianemia, anti-inflammation, antioxidant, and renal difficulties suppression, which could be attributed to the existence of nutritional components of fiber, vitamins, or other phytochemicals such as β-glucan, phenolic acids, flavonoids, and so on.10−12 However, the information of functional phytochemicals of hulless barley grass still remains scarce.
In addition, the harsh environment in Tibetan Plateau including high salinity, cold temperatures, and drought endows the highland hulless barley strong ability to resist adversities13 and the adverse environment influences the content of plant secondary products.14 Wu et al.15 noted that the β-glucan in ripen grains was dramatically decreased by PEG-simulated drought stress in the tested Tibet wild barley. Ma et al.16 found that 60 mM NaCl treatment on 0–6 days hulless barley seedlings increased the polyphenol (Free/Bound) contents, while Lilia et al. showed a different accumulation pattern.17 Across abiotic stressors, there are a lot of studies on the augmentation of plant secondary products of functional phytochemicals including phenolics and flavonoids under drought18−21 and salinity stress.22−25 The high ultraviolet radiation, which is also characterized as a harsh climate, causes certain physiological changes in plants such as accumulation of UV-B-absorbing compounds.26 Li et al.27 found that the contents of anthocyanin and flavonoid accumulated significantly under UV-B stress or under the co-treatment of UV-B and NaCl stress, while the contents of photosynthetic pigments and chlorophyll fluorescence decreased. Moreover, for experimental/herbal use, the barley grass was usually harvested within 2 weeks.10,28 Hence, there is still lack of information on long-term accumulation patterns of the phytochemicals in hulless barley grass exceeding the prescriptive harvesting times at the vegetative stage. In the present study, the contents of the main functional compounds such as polyphenols, flavonoids, proanthocyanins, triterpenes, polysaccharides, chlorophyll a, chlorophyll b, and total chlorophyll and the antioxidant activity of hulless barley grass at different harvesting times at vegetative stages (from 10th to 23rd day after sowing of seeds) under different UV-C stresses were explored, which would provide a theoretical basis for the healthcare utilization and natural pharmaceuticals sourcing. The antioxidant capacity was evaluated through OH• and 2,2’-azino-bis(3-ethylbenzothiazoline-6-sulfonic acid) (ABTS) scavenging ability. The correlation analysis between the phytochemicals and antioxidant activity was carried out and a mathematic model was also established for the comprehensive evaluation of the nutrition of the grass.
2. Results and Discussion
2.1. Total Triterpenes (TT)
Triterpenes, which were widely distributed in cereals, vegetables, fruits, and other pharmacological plants and mushrooms, are well known for their biological effects.29 In our present study, the TT contents ranged from 9.50 ± 0.37 to 63.67 ± 9.25 mg UAE/g, which was similar to the level of fruits like jujubes,14 sugarcane,30 or other traditional herbal plants like loquat leaves,31Terminalia chebula,32 bamboo grass,33 and Ganoderma lingzhi (decreased from the young stage to mature stage).34 Barley grass on the 15th day of UV irradiation showed even higher TT contents than these herbal plants. All of the UV-treated groups showed a similar accumulation pattern and significantly peaked in the TT contents on the 15th harvest day (Figure 1, p < 0.05). The TT contents of the UV-treated groups were obviously higher than that of the control group before the 17th harvest day except treatment of UV1.0, UV1.5, and UV2.5 on the 17th day (p < 0.05). On the 19th day, no significant differences were found between the UV-treated and the control groups in exception of UV2.5. Before the 21st day, the UV-treated groups had a non-/significant higher TT content than the control group,; however, on the 23rd day, the control group significantly outranked the UV1.0, UV1.5, UV2.0, and UV2.5 groups (p < 0.05). The UV treatment could lead to the accumulation of TT contents in the short term when the plants modulate themselves to cope with the UV adverse, but soon would decrease the TT contents through inhibiting its synthesis or decomposition.
Figure 1.
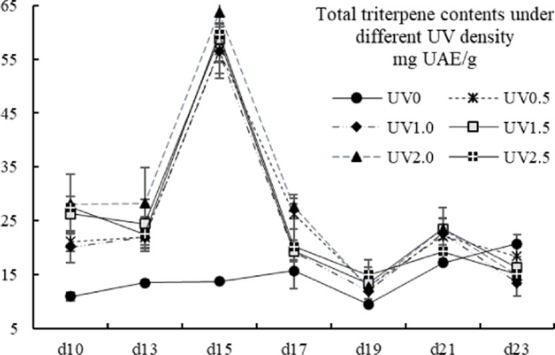
Total triterpene contents of different UV-treated groups in different growth times. Vertical bars represent SD (n=3).
2.2. Total Polyphenol (TP)
The TP contents of the present study ranged from 111.38 ± 0.00 to 3715.19 ± 65.48 mg GAE/100g. The value of the UV0 group varied from 111.38 ± 0.00 to 498.54 ± 6.08 mg GAE/100g, which shared a similar level with corn, wheat, and barley and their corresponding sprouts or grass.28 The TP contents of the UV-treated groups fell into the same level of vegetables and fruits35−37 and Pu-erh tea,38 but was 5–10 times lower than tea from Sri Lanka39 or Argentina.40 A quite similar accumulation pattern of the UV-treated groups was found in between the TP and the TT contents (Figure 2), which was in consistence with previous studies,33,41 indicating that polyphenol and triterpene might share some of the synthetic route that could be affected by the UV radiation. On the 15th harvest day, an obvious accumulation peak was spotted, and the highest TP content was found in groups UV0.5 and UV1.0 (no significant differences between UV0.5 and UV1.0, p < 0.05). All of the UV-treated groups showed significantly higher TP contents than the control group before the 19th harvest day and significantly declined from the 21st to 23rd day (p < 0.05). On the 19th day, the TP contents of the UV0-, UV1.0-, and UV1.5-treated groups were obviously lower than the UV0.5, UV2.0, and UV2.5 ones. On the 23rd day, no significant differences were observed between all of the groups (p < 0.05), meaning long-time UV radiation had adverse effects on the accumulation of TP. The optimum choice for achieving high TP contents could be the treatment of UV0.5 with 1-day interval for 15 days.
Figure 2.
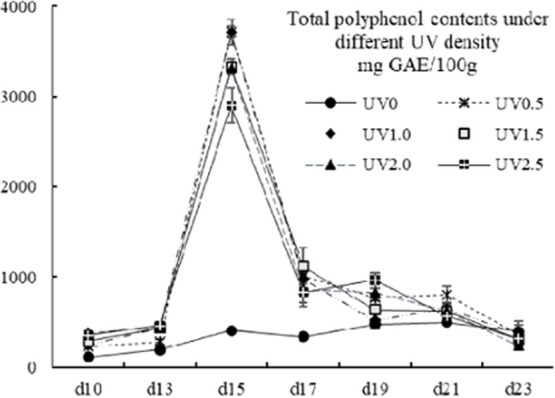
Total polyphenol contents of different UV-treated groups in different growth times. Vertical bars represent SD (n=3).
2.3. Total Flavonoids (TF)
The TF contents of the UV groups showed an undulating descent trend (Figure 3), in accordance with that of several hulless barley cultivars of a previous study,42 whereas the control group declined gradually (p < 0.05). The TF contents ranged from 32.83 ± 0.52 to 248 ± 44.16 mg RE/100g, which was comparable to some tropical fruits43,44 and some Chinese herbs,45 or was much higher than some common vegetables from Japan.46 In the present study, except for the treatment groups of UV0.5 on the 13th day, UV2.0 and UV2.5 on the 17th day, and UV1.5 and UV2.0 on the 19th day, all other treated groups exhibited significantly higher TF contents than the control group (p < 0.05). For individual TF, it is recommended to harvest on the 10th day to accumulate higher contents.
Figure 3.
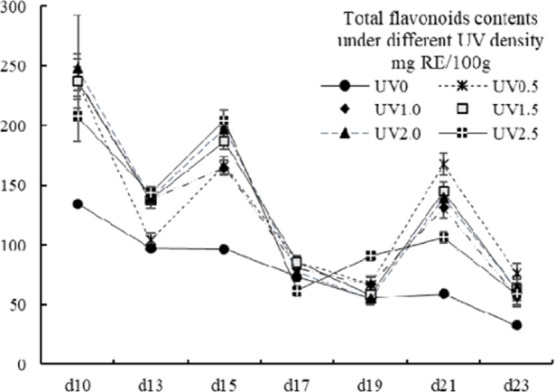
Total flavonoids contents of different UV-treated groups in different growth times. Vertical bars represent SD (n=3).
2.4. Total Proanthocyanidins (TPA)
The total proanthocyanidins (TPA) contents ranged from 1.70 ± 0.63 to 4.60 ± 0.03 mg CE/g, which showed the same level of hulless barley grains47 but was higher than whole rice.48 The TPA contents of all of the UV-treated groups decreased dramatically with prolonging of the harvest day, in accordance with that of Nigella sativa(49) and maize leaves of Arper cultivar,50 but significantly higher than the control group, which just showed a nonsignificant decline trend (p < 0.05) (Figure 4). On the same harvest day, no significant differences were found in between all of the UV-treated groups in exception of the ones harvested on the 19th day. On the 19th day, the TPA contents of the groups of UV0.5, UV1.0, and UV1.5 were obviously higher than those of UV2.0, UV2.5, and UV0 (p < 0.05).
Figure 4.
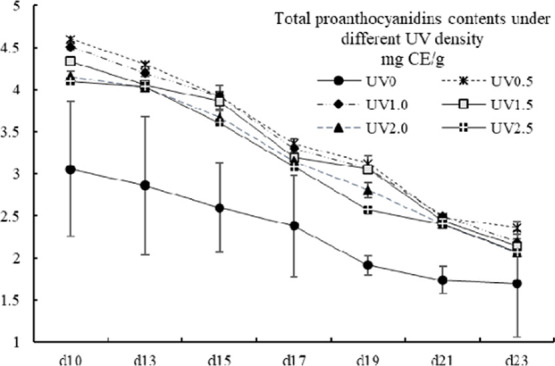
Total proanthocyanidins contents of different UV-treated groups in different growth times. Vertical bars represent SD (n=3).
2.5. Total Soluble Polysaccharides
Barley sprouts are abound with soluble fiber components, especially β-glucan, and have a lot of beneficial effects on human beings; hence, it draws much attention.4,15,51 β-Glucan could be a major part of the polysaccharides.6 In the present study, the TSP contents (19.75 ± 0.19 to 6.83 ± 0.08 mg GE/g) of all of the UV-treated groups decreased dramatically with the prolonging of growth time, which was in consistence with β-glucan in previous studies.42,52 However, the TSP contents of the UV-treated groups were still significantly higher than those of the control groups (p < 0.05) (Figure 5), of which the decline trend was more moderate than the UV groups. An interesting finding was that the rank of the TSP contents of the same harvest day generally followed UV0.5 > UV1.0 > UV1.5 > UV2.0 > UV2.5 > UV0, which might indicate that less intense UV stress reserved more TSP contents. It could also be inferred that the polysaccharides contributed to the protection of hulless barley grass from UV stress.
Figure 5.
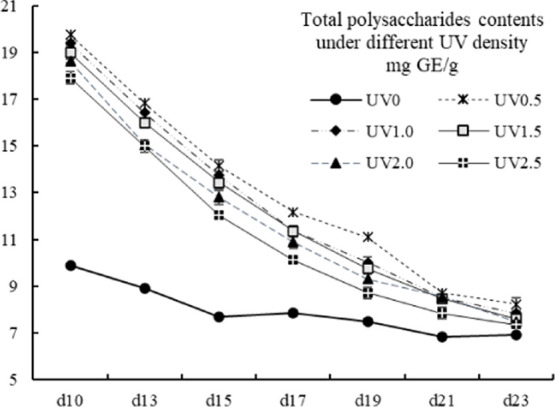
Total soluble polysaccharides contents of different UVtreated groups in different growth times. Vertical bars represent SD (n=3).
2.6. Chlorophyll
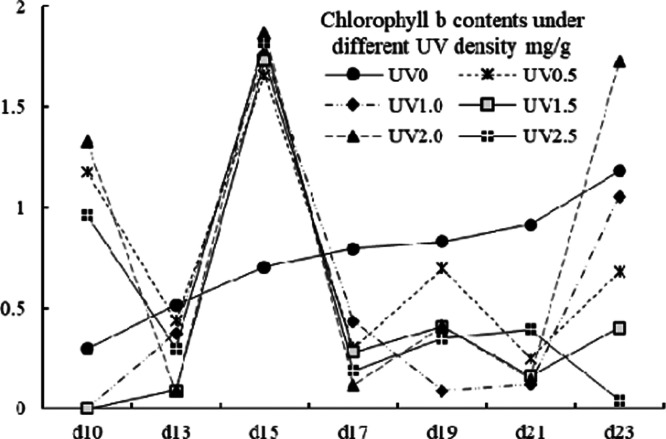
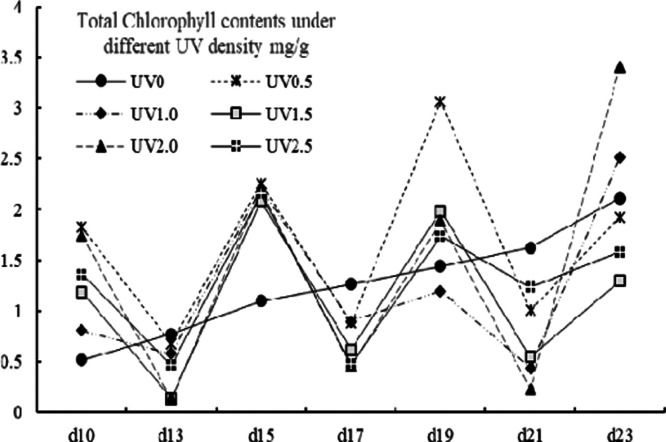
The effects of UV stress on the variation patterns of chlorophyll a, chlorophyll b, and total chlorophyll (denoted as Ca, Cb, and CTch, respectively) are shown in Figures 6, 7, and 8. The values of Ca, Cb, and CTch were ranging from 0.05 to 2.37, 0.00 to 1.87 and from 0.14 to 3.40 mg/g. For chlorophyll a contents, the UV-treated groups showed an irregular fluctuating trend, whereas the control group showed a steady increase trend. From the 13th to 19th day, an increase of Ca content was observed in all groups and an accumulation peak was spotted on the 19th day in UV-treated groups. The Cb content of the control group grew steadily and was higher than that of the UV-treated groups in exception of the treatment of UV0.5, UV2.0, and UV2.5 on the 10th day, and all UV groups on the 15th day. An obvious accumulation peak of the UV groups in Cb content was observed on the 15th day. As for total chlorophyll contents, the control group as well exhibited a different variation mode from the UV-treated groups, which varied undulatorily with the harvest day (shown in Figure 8). It had been thought that UV would prompt the decomposition of chlorophyll; however, in many of the cases, the Ca, Cb, and CTch contents of the UV-treated groups actually went against the hypothesis. The chlorophyll was regarded as “green blood” for its beneficial properties;53 therefore, UV treatment could be a good option to improve this functional factor.
Figure 6.
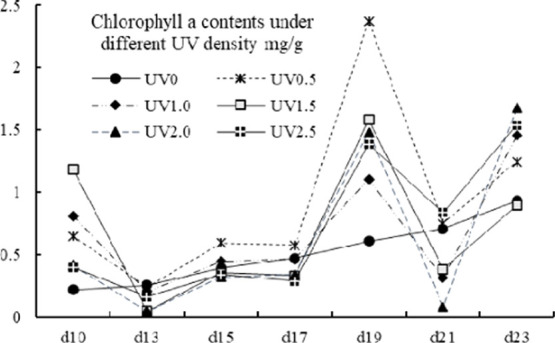
Total chlorophyll a contents of different UV-treated groups in different growth times.
Figure 7.
Total chlorophyll b contents of different UV-treated groups in different growth times.
Figure 8.
Total chlorophyll contents of different UV-treated groups in different growth times.
2.7. ABTS Scavenging Ability
The values of ABTS scavenging capacity were ranging from 0.60 ± 0.04 to 3.13 ± 0.04 mg VCE/g. A similar changing pattern in ABTS scavenging capacity was shared between the UV-treated groups, the values of which were significantly higher than the control group (p < 0.05) (Figure 9). The ABTS scavenging ability increased moderately except for a peak which appeared on the 15th day.
Figure 9.
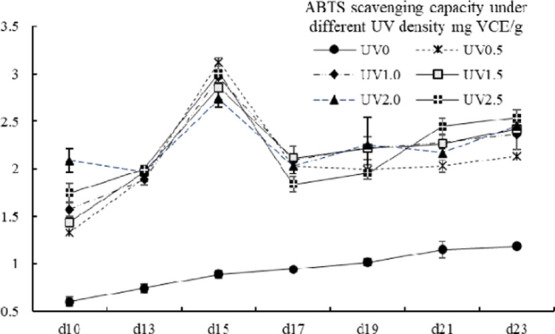
ABTS scavenging capacity of different UV-treated groups in different growth times. Vertical bars represent SD (n=3).
2.8. OH• Scavenging Capacity
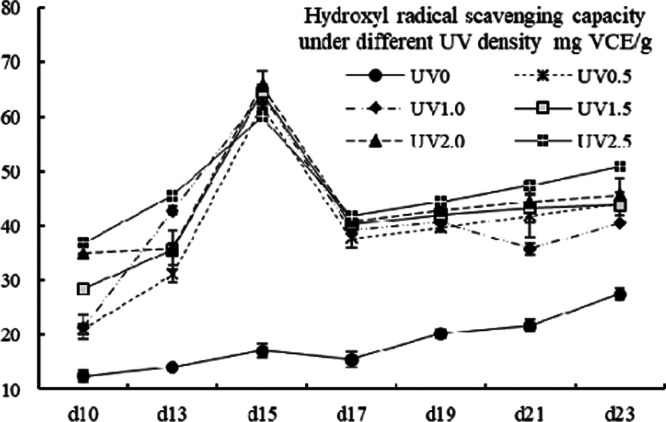
The variation mode of OH• scavenging capacity was similar to that of the ABTS scavenging ability (shown in Figure 10) with value ranging from 65.86 ± 2.68 to 12.48 ± 1.01 mg VCE/g. Aside from a peak on the 15th day, the value of the UV-treated groups generally grew moderately (p < 0.05). The value of the control group increased moderately but was significantly lower than the UV groups (p < 0.05).
Figure 10.
OH• scavenging capacity of different UV-treated groups in different growth times. Vertical bars represent SD (n=3).
2.9. Correlation Analysis
The correlation coefficients of total triterpenes, total polyphenols, total flavonoids, total proanthocyandins, total soluble polysaccharides, chlorophyll a, chlorophyll b, total chlorophyll, and ABTS and OH• scavenging abilities on different harvest days are shown in Tables 1–7.
Table 1. Correlation Coefficients of Total Triterpenes, Total Polyphenols, Total Flavonoids, Total Proanthocyandins, Total Soluble Polysaccharides, Chlorophyll a, Chlorophyll b, Total Chlorophyll, and ABTS and OH• Scavenging Abilities of Hulless Young Barley Grass on the 10th Harvest Daya,b.
| correlation results on d10 | TT | TP | TF | TPA | TSP | Ca | Cb | CTch | ABTS | OH |
|---|---|---|---|---|---|---|---|---|---|---|
| TT | 1 | 0.967** | 0.776 | 0.638 | 0.773 | 0.355 | 0.402 | 0.709 | 0.906* | 0.950** |
| TP | 1 | 0.725 | 0.553 | 0.703 | 0.170 | 0.472 | 0.665 | 0.965** | 0.973** | |
| TF | 1 | 0.934** | 0.968** | 0.604 | 0.237 | 0.686 | 0.818* | 0.578 | ||
| TPA | 1 | 0.981** | 0.651 | 0.151 | 0.617 | 0.651 | 0.417 | |||
| TSP | 1 | 0.612 | 0.228 | 0.681 | 0.776 | 0.581 | ||||
| Ca | 1 | –0.518 | 0.074 | 0.184 | 0.097 | |||||
| Cb | 1 | 0.815* | 0.460 | 0.467 | ||||||
| CTch | 1 | 0.661 | 0.610 | |||||||
| ABTS | 1 | 0.882* | ||||||||
| OH | 1 |
Correlations between the data obtained were run using a standard Pearson correlation.
**P < 0.01; *P < 0.05 (two-tailed).
Table 7. Correlation Coefficients of Total Triterpenes, Total Polyphenols, total flavonoids, Total Proanthocyandins, Total Soluble Polysaccharides, Chlorophyll a, Chlorophyll b, Total Chlorophyll, and ABTS and OH• Scavenging Ability of Hulless Young Barley Grass on the 23rd Harvest Daya,b.
| correlation results on d23 | TT | TP | TF | TPA | TSP | Ca | Cb | CTch | ABTS | OH |
|---|---|---|---|---|---|---|---|---|---|---|
| TT | 1 | 0.543 | –0.415 | –0.477 | –0.319 | –0.701 | 0.029 | –0.279 | –0.866* | –0.687 |
| TP | 1 | –0.418 | –0.186 | 0.005 | –0.542 | –0.193 | –0.389 | –0.673 | –0.656 | |
| TF | 1 | 0.946** | 0.870* | 0.363 | –0.229 | –0.027 | 0.743 | 0.780 | ||
| TPA | 1 | 0.961** | 0.311 | –0.282 | –0.092 | 0.713 | 0.687 | |||
| TSP | 1 | 0.209 | –0.140 | –0.022 | 0.511 | 0.469 | ||||
| Ca | 1 | 0.245 | 0.629 | 0.596 | 0.610 | |||||
| Cb | 1 | 0.908* | –0.290 | –0.427 | ||||||
| CTch | 1 | 0.025 | –0.079 | |||||||
| ABTS | 1 | 0.934** | ||||||||
| OH | 1 |
Correlations between the data obtained were run using a standard Pearson correlation.
**P < 0.01; *P < 0.05 (two-tailed).
On the 10th day (Table 1), the TP, TT, and TF contents showed a significant positive correlation with ABTS scavenging ability (p < 0.01, p < 0.05, and p < 0.05, respectively). The TP and TT contents significantly correlated with OH• scavenging ability (the correlation coefficients were 0.973 and 0.950, respectively, P < 0.01). Based on the correlation coefficients (r), the functional factors that contributed to the ABTS/OH• scavenging ability were of the order: TP > TT > TF > TPA.
On the 13th day (Table 2), the TPA, TT, and TP positively correlated with ABTS scavenging ability (r = 0.960**, 0.886*, and 0.832*, respectively), whereas TP, TF, and TPA significantly correlated with OH• scavenging ability (p < 0.05). According to the correlation coefficients, it could be seen that the main phytochemicals that contributed to ABTS scavenging ability followed the order TPA > TT > TP > TF. The main phytochemicals contributing to OH• scavenging ability followed the order TP > TF > TPA > TT.
Table 2. Correlation Coefficients of Total Triterpenes, Total Polyphenols, Total Flavonoids, Total Proanthocyandins, Total Soluble Polysaccharides, Chlorophyll a, Chlorophyll b, Total Chlorophyll, and ABTS and OH• Scavenging Abilities of Hulless Young Barley Grass on the 13th Harvest Daya,b.
| correlation results on d13 | TT | TP | TF | TPA | TSP | Ca | Cb | CTch | ABTS | OH |
|---|---|---|---|---|---|---|---|---|---|---|
| TT | 1 | 0.811 | 0.742 | 0.784 | 0.767 | –0.803 | –0.853* | –0.837* | 0.886* | 0.705 |
| TP | 1 | 0.987** | 0.685 | 0.671 | –0.708 | –0.757 | –0.741 | 0.832* | 0.916* | |
| TF | 1 | 0.561 | 0.547 | –0.717 | –0.753 | –0.742 | 0.733 | 0.865* | ||
| TPA | 1 | 0.994** | –0.348 | –0.440 | –0.410 | 0.960** | 0.824* | |||
| TSP | 1 | –0.360 | –0.450 | –0.419 | 0.947** | 0.799 | ||||
| Ca | 1 | 0.995** | 0.998** | –0.550 | –0.404 | |||||
| Cb | 1 | 0.999** | –0.631 | –0.481 | ||||||
| CTch | 1 | –0.604 | –0.456 | |||||||
| ABTS | 1 | 0.890* | ||||||||
| OH | 1 |
Correlations between the data obtained were run using a standard Pearson correlation.
**P < 0.01; *P < 0.05 (two-tailed).
On the 15th day (Table 3), all of the phytochemicals except chlorophyll a had a significantly positive correlation with ABTS and OH• free-radical scavenging ability. On the 17th day (Table 4), the TPA and TP contents showed a significant correlation with ABTS scavenging ability (p < 0.01) and OH• scavenging ability (p < 0.05). Interestingly, both the ABTS and OH• scavenging abilities had a negative correlation with chlorophyll b. The main phytochemicals contributing to ABTS and OH• scavenging abilities were of the order TPA > TP > TT > TF.
Table 3. Correlation Coefficients of Total Triterpenes, Total Polyphenols, Total Flavonoids, Total Proanthocyandins, Total Soluble Polysaccharides, Chlorophyll a, Chlorophyll b, Total Chlorophyll, and ABTS and OH• Scavenging Abilities of Hulless Young Barley Grass on the 15th Harvest Daya,b.
| correlation results on d15 | TT | TP | TF | TPA | TSP | Ca | Cb | CTch | ABTS | OH |
|---|---|---|---|---|---|---|---|---|---|---|
| TT | 1 | 0.942** | 0.949** | 0.927** | 0.913* | –0.042 | 0.996** | 0.977** | 0.960** | 0.990** |
| TP | 1 | 0.793 | 0.993** | 0.994** | 0.243 | 0.933** | 0.980** | 0.969** | 0.975** | |
| TF | 1 | 0.779 | 0.749 | –0.283 | 0.951** | 0.877* | 0.870* | 0.901* | ||
| TPA | 1 | 0.996** | 0.252 | 0.917* | 0.966** | 0.969** | 0.966** | |||
| TSP | 1 | 0.306 | 0.897* | 0.959** | 0.956** | 0.955** | ||||
| Ca | 1 | –0.075 | 0.155 | 0.185 | 0.035 | |||||
| Cb | 1 | 0.973** | 0.956** | 0.985** | ||||||
| CTch | 1 | 0.990** | 0.984** | |||||||
| ABTS | 1 | 0.969** | ||||||||
| OH | 1 |
Correlations between the data obtained were run using a standard Pearson correlation.
**P < 0.01; *P < 0.05 (two-tailed).
Table 4. Correlation Coefficients of Total Triterpenes, Total Polyphenols, Total Flavonoids, Total Proanthocyandins, Total Soluble Polysaccharides, Chlorophyll a, Chlorophyll b, Total Chlorophyll, and ABTS and OH• Scavenging Abilities of Hulless Young Barley Grass on the 17th Harvest Daya,b.
| correlation results on d17 | TT | TP | TF | TPA | TSP | Ca | Cb | CTch | ABTS | OH |
|---|---|---|---|---|---|---|---|---|---|---|
| TT | 1 | 0.468 | 0.282 | 0.620 | 0.648 | 0.090 | –0.732 | –0.540 | 0.591 | 0.573 |
| TP | 1 | 0.515 | 0.947** | 0.949** | –0.106 | –0.725 | –0.603 | 0.966** | 0.883* | |
| TF | 1 | 0.419 | 0.593 | 0.528 | 0.007 | 0.191 | 0.406 | 0.112 | ||
| TPA | 1 | 0.976** | 0.011 | –0.767 | –0.594 | 0.973** | 0.911* | |||
| TSP | 1 | 0.138 | –0.695 | –0.494 | 0.943** | 0.828* | ||||
| Ca | 1 | 0.490 | 0.734 | –0.174 | –0.391 | |||||
| Cb | 1 | 0.952** | –0.823* | –0.925** | ||||||
| CTch | 1 | –0.703 | –0.859* | |||||||
| ABTS | 1 | 0.950** | ||||||||
| OH | 1 |
Correlations between the data obtained were run using a standard Pearson correlation.
**P < 0.01; *P < 0.05 (two-tailed).
On the 19th day (Table 5), only the TPA and TT contents correlated significantly with ABTS and OH• scavenging abilities, respectively (p < 0.05). On the 21st day, just TPA contents showed a significant correlation with ABTS and OH• scavenging abilities (p < 0.01, p < 0.05 respectively) (Table 6). However, on the 23rd day (Table 7), the TT content was found to have a significantly negative correlation with ABTS scavenging ability, which was opposite to the previous results on the 15th day, and the reason behind this remained unclear. If it could be explained that on different growth stages the varied relationship between the phytochemicals and antioxidant activity was due to the contents of different compounds, how could the hypothesis interpret the inconsistence of the correlation between the TT contents and antioxidant activity? Hence, conclusions could not be made that a phytochemical correlated to or contributed to its antioxidant capacity from one single test, because the TT demonstrated positive correlation with ABTS scavenging ability on the 10th, 13th, and 15th days but negatively correlated with it on the 23rd day. Another interesting finding was that the TPA always showed a positive correlation with TSP.
Table 5. Correlation Coefficients of Total Triterpenes, Total Polyphenols, Total Flavonoids, Total Proanthocyandins, Total Soluble Polysaccharides, Chlorophyll a, Chlorophyll b, Total Chlorophyll, and ABTS and OH• Scavenging Ability of Hulless Young Barley Grass on the 19th Harvest Daya,b.
| correlation results on d19 | TT | TP | TF | TPA | TSP | Ca | Cb | CTch | ABTS | OH |
|---|---|---|---|---|---|---|---|---|---|---|
| TT | 1 | 0.829* | 0.696 | 0.546 | 0.404 | 0.561 | –0.490 | 0.305 | 0.695 | 0.892* |
| TP | 1 | 0.628 | 0.225 | 0.194 | 0.539 | –0.125 | 0.433 | 0.419 | 0.671 | |
| TF | 1 | 0.070 | 0.043 | 0.170 | –0.324 | 0.021 | 0.153 | 0.444 | ||
| TPA | 1 | 0.938** | 0.740 | –0.556 | 0.439 | 0.900* | 0.799 | |||
| TSP | 1 | 0.855* | –0.294 | 0.648 | 0.724 | 0.632 | ||||
| Ca | 1 | 0.040 | 0.914* | 0.566 | 0.607 | |||||
| Cb | 1 | 0.442 | –0.750 | –0.701 | ||||||
| CTch | 1 | 0.203 | 0.260 | |||||||
| ABTS | 1 | 0.939** | ||||||||
| OH | 1 |
Correlations between the data obtained were run using a standard Pearson correlation.
**P < 0.01; *P < 0.05 (two-tailed).
Table 6. Correlation Coefficients of Total Triterpenes, Total Polyphenols, Total Flavonoids, Total Proanthocyandins, Total Soluble Polysaccharides, Chlorophyll a, Chlorophyll b, Total Chlorophyll, and ABTS and OH• Scavenging Ability of Hulless Young Barley Grass on the 21st Harvest Daya,b.
| correlation results on d21 | TT | TP | TF | TPA | TSP | Ca | Cb | CTch | ABTS | OH |
|---|---|---|---|---|---|---|---|---|---|---|
| TT | 1 | 0.628 | 0.881* | 0.811 | 0.937** | –0.718 | –0.937** | –0.935** | 0.653 | 0.610 |
| TP | 1 | 0.888* | 0.692 | 0.810 | –0.044 | –0.633 | –0.385 | 0.392 | 0.442 | |
| TF | 1 | 0.881* | 0.971** | –0.331 | –0.882* | –0.687 | 0.666 | 0.711 | ||
| TPA | 1 | 0.932** | –0.311 | –0.954** | –0.716 | 0.928** | 0.854* | |||
| TSP | 1 | –0.483 | –0.962** | –0.817* | 0.753 | 0.727 | ||||
| Ca | 1 | 0.571 | 0.884* | –0.256 | –0.160 | |||||
| Cb | 1 | 0.888* | –0.861* | –0.769 | ||||||
| CTch | 1 | –0.633 | –0.527 | |||||||
| ABTS | 1 | 0.907* | ||||||||
| OH | 1 |
Correlations between the data obtained were run using a standard Pearson correlation.
**P < 0.01; *P < 0.05 (two-tailed).
2.10. TOPSIS Ranking Results
The decision matrix for ranking was established as X = (xij)m × n, where m represents groups under different UV treatments on different harvest days and n represents the six criteria of TT, TP, TF, TPA, TSP, and CTch contents. The weight of each individual criterion was ωi = 1. The positive and negative ideal solutions (A+ and A–, respectively) are shown below.
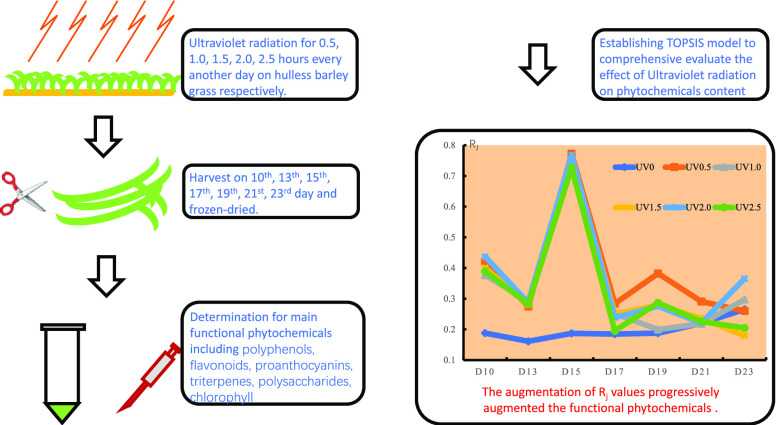
The relative closeness (Rj) to the ideal solution was calculated and expressed as in Figure 11. The higher the Rj value, the higher the comprehensive content of the main phytochemicals. The top five groups of comprehensively high phytochemicals contents were (ranking from the highest amount) UV0.5, UV2.0, UV1.0, UV1.5, and UV2.5 harvested on the 15th day.
Figure 11.
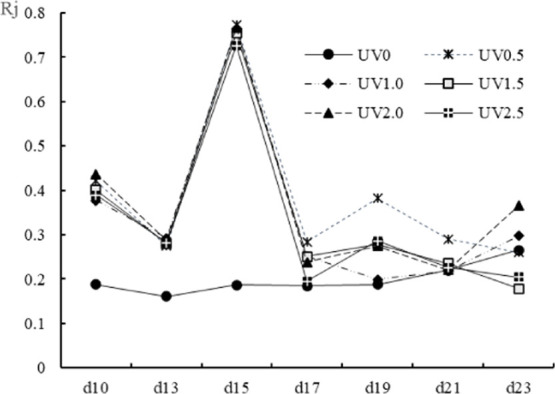
Rj values of different UV-treated groups harvested on different days. Rj meant the closeness coefficient. The augmentation of Rj values progressively augmented the functional phytochemical contents.
2.11. Principal Components Analysis (PCA) of the UV Treatments × Harvest Day Interactions
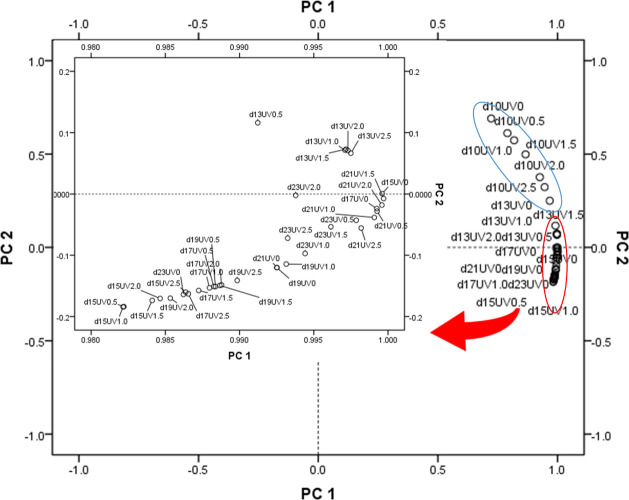
PCA was performed to elucidate on quality parameters (TT, TP, TF, TPA, TSP, CTch, and ABTS/OH• scavenging ability) under different UV stress at different harvest days. The similarities or differences among the UV-treated groups are intuitively seen from Figure 12. The first PCA axis, explaining 94.55% of the variance, correlated with TT, TP, and antioxidant activity. The second PCA axis accounted for 5.32% of the variance correlated with TF, TPA, and TSP, which showed high contents on the 10th and 13th days.
Figure 12.
PCA of the UV treatments × harvest date interactions in six treatments in seven harvest periods. PC1 explained 94.55% of the variance and correlated with TT, TP, and antioxidant activity. PC2 accounted for 5.32% of the variance and correlated with TF, TPA, and TSP.
3. Conclusions
The UV treatments could efficiently improve the contents of the main functional phytochemicals in hulless barley grass, namely, TT, TP, TF, TPA, TSP, and CTch. The harvest day and UV density also affected the compounds content. The highest values of the compounds contents were 63.67 ± 9.25 mg UAE/g, 3175 ± 65.48 mg GAE/100g, 248.28 ± 44.16 mg GAE/100g, 45.97 ± 0.31 mg CE/g, 19.75 ± 0.19 mg GE/g, and 3.40 mg/g and were observed in groups of UV2.0 on the 15th day, UV0.5 on the 15th day, UV2.0 on the 10th day, UV0.5 on the 10th day, UV0.5 on the 10th day, and UV2.0 on the 23rd day, respectively. According to the correlation analysis, the main functional factors contributing to the antioxidant ability varied with growth period, and even the same phytochemical such as TT correlated positively or negatively with antioxidant activity based on the difference of harvest time. TOPSIS analysis showed that the top five groups with comprehensively high phytochemical contents ranking from the highest amount were UV0.5-, UV2.0-, UV1.0-, UV1.5-, and UV2.5-treated groups harvested on the 15th day, which lay a theoretical basis for the production of grass leaves powder of optimum quality.
4. Materials and Methods
4.1. Chemicals
Ascorbic acid, gallic acid, vanilline, and Folin-Ciocalteu reagent were purchased from Sinopharm Chemical Reagent Co., Ltd (Shanghai, China). Rutin and catechin were bought from Shanghai Yuanye Bio-Technology Co., Ltd (Shanghai, China). Ursolic acid and 2,2′-azino-bis(3-ethylbenzthiazoline-6-sulfonic acid) (ABTS) were, respectively, purchased from Cool Chemistry Co., Ltd (Beijing, China) and Shanghai Aladdin Bio-Chem Technology Co., Ltd (Shanghai, China). Hoagland reagents were bought from Qingdao Hope Bio-Technology Co., Ltd (Qingdao, China). All other chemicals or reagents were of analytical or HPLC grade.
4.2. Plant Materials and UV Treatment
4.2.1. UV Treatment
Hulless barley seeds were purchased from Taobao online retail platform and planted in plant tissue culture rack in a growth chamber. The seeds were washed thrice, sown evenly in four rectangular pieces in a 32.5 × 24.5 × 4.5 cm hydroponic tray (80 ± 2 g/tray), and then immersed in deionized water for 24 h in the dark to let malt. The germinated seeds were grown in 1/2 Hoagland solution (refreshed every another day) at 22 ± 1 °C under a light irradiance of 16 h photoperiod (20 W). Six-day-old seedlings were brought to impose UV radiation (40 W, Ozone free) for 0.5, 1.0, 1.5, 2.0, and 2.5 h and are noted as UV0.5, UV1.0, UV1.5, UV2.0, and UV2.5 groups, respectively, while the control group was noted as UV0. All of the UV-treated groups were rested for 1–2 days and then harvested. The grass sampling was conducted on the 10th, 13th, 15th, 17th, 19th, 21st, and 23rd days after sowing of seeds and immediately freeze-dried.
4.2.2. Preparation of Hulless Barley Grass Extracts
Grass extracts to be analyzed for total triterpenes (TT), total polyphenol (TP), total flavonoids (TF), total proanthocyanidins (TPA), and antioxidant activity were prepared as follows: The dried grass was ground using an electric grinder and passed through an 80-mesh sieve. A 0.5 g weight sample of each treated group was defatted using ligarine (30–60 °C) for 30 min and ultrasonicated with 25 mL of 80% methanol for 20 min. The mixture was filtered and rinsed, and the residues were reextracted twice. The three filtrates were pooled, evaporated under vacuum at 45 °C, redissolved, and brought to 50 mL with 80% menthol. Extracts were prepared for total soluble polysaccharides analysis as follows: The above residues (0.2 g) were again extracted twice using 100 mL of deionized water in a boiling water bath for 30 min. The crude polysaccharides were combined and standardized to 250 mL. All of the extracts were stored at −20 °C in the dark until use except the polysaccharides extracts, which were stored at 0–4 °C and detected within 2 days.
4.3. Determination of Total Triterpenes Content
The TT contents were detected using the vanillin-HClO4 assay method30 with some modifications. Five-times diluted grass extracts or aliquots (0.5 mL) of 0.2–1.2 mL of ursolic acid solution (0.1 mg/mL) were evaporated to dryness in a 100 °C water bath and added in 0.2 mL of vanillin/acetic acid solution (W/V). Perchloric acid (1.0 mL) was mixed in before incubation for 10 min in a 60 °C water bath. After the mixture was chilled to ambient temperature, 5 mL of acetic acid was added and let to stand for 15 min. The absorbance was detected at 548 nm versus a blank solution. The results were expressed on a dry basis as mg ursolic acid equivalent/g (mg UAE/g DW).
4.4. Determination of Total Polyphenol Content
The TP contents were determined using Folin-Ciocalteu colorimetric method54,55 with slight adjustment. Briefly, 125 μL of the grass extracts or standard gallic acid solutions (0–600 μg/mL) was well mixed with 125 μL of Folin-Ciocalteu reagents. The mixtures were allowed to rest for 6 min and then reacted with 1.25 mL of 7% Na2CO3 (aqueous solution). Deionized water was added to adjust to the final volume of 4 mL. After 90 min standing at room temperature, the samples were measured at 760 nm versus the blank. The TP contents were calculated using an equation from the standard curve and expressed as mg gallic acid equivalents/100g on basis of dry weight (mg GAE/100g DW).
4.5. Determination of Total Flavonoids Content
A colorimetrical method56−58 with minor modification was employed for the detection of TF contents. The grass extracts or standard rutin solution (2.0 mL, 10–60 mg/L) were mixed with 0.75 mL of 5% NaNO2 solution. After 5 min, 0.5 mL of 10% Al(NO3)3 was added and mixed well. The mixtures were let to stand for 6 min before addition of 4 mL of 5% NaOH to terminate the reaction and standardized to 25 mL. Finally, the absorbance was detected after 15 min. A standard curve was plotted to draw an equation, which was used to calculate the TF contents. The results were expressed as rutin equivalent on a dry weight basis (denoted as mg RE/100g).
4.6. Determination of Total Proanthocyanidins Content
The TPA contents were measured using modified vanillin-H2SO4 assay method.59 Five-times diluted grass extracts or aliquots (0.5 mL) of catechin standard solution (20–100 μg/mL catechin in 80% methanol), 2.5 mL of 30% sulfuric acid/acetic acid solution (V/V), and 2.5 mL of 1% vanillin/acetic acid (W/V) were subsequently added and mixed evenly. A control mixture of the sample was prepared using 80% methanol instead of vanillin standards. After incubation for 15 min in a 30 °C water bath, the absorbance was measured at 500 nm versus the control. The TPA contents were calculated from the standard curve and expressed as mg catechin equivalents/g sample (mg CE/g DW).
4.7. Determination of Total Soluble Polysaccharides (TSP) Content
The detection of total polysaccharides contents was conducted using phenol–sulfuric acid assay method.60,61 The standard D-glucose solution (1.2 mL, 10–50 μg/mL) or samples were mixed with 0.2 mL of 6% phenol and then 2.5 mL of H2SO4. After incubation in a 50 °C water bath for 30 min, the absorbance was measured at 490 nm versus a blank. The contents were expressed as mg glucose equivalent/g DW (mg GE/g DW).
4.8. Determination of Chlorophyll a, Chlorophyll b, and Total Chlorophyll Content
The chlorophyll contents were measured using the methods previously reported62,63 with some modifications. The grass powder (0.2 mg) was mixed with 20 mL of 80% acetone for 30 min prior to absorbance (A) reading at 663 and 645 nm. Chlorophyll concentration in grams per liter was calculated using the following equations
where Ca and Cb are the concentrations of chlorophyll a and chlorophyll b, respectively.
The contents of chlorophyll were expressed as mg/g DW.
4.9. TOPSIS Model Establishments
The TOPSIS (Technique Performance by Similarity to Ideal Solution) mathematical model to solve ranking problems of multiple criteria decision making was employed to comprehensively evaluate the effect of different UV densities on the phytochemicals. The specific performances were referred to the procedures proposed by Hwang and Yoon.64
4.10. Antioxidant Activity
4.10.1. ABTS Scavenging Activity
The ABTS scavenging activity of the grass extracts was evaluated based on previous reports,65,66 with some adjustments. The ABTS solution was prepared by the reaction of 10 mL of 7 mM ABTS (prepared in 20 mM pH4.5 acetate buffer) and 10 mL of 2.45 mM potassium persulfate for 12–14 h at room temperature in the dark. The ABTS working solution was made by diluting ABTS solution to an absorbance of 0.7 ± 0.01 at 734 nm using acetate buffer. Then, 3 mL of the working solution was mixed with 2 mL of each sample or standard solution (5, 10, 15, 20, and 25 μg/mL ascorbic acid). The absorbance was read at 734 nm after standing for 30 min at room temperature. ABTS scavenging ability was calculated as follows
where A0 is the absorbance of the mixture of 2 mL of 80% methanol and 3 mL of ABTS working solution; A1 is the absorbance of the mixture of 2 mL of grass extracts or standard solution and 3 mL 80% methanol; and A2 is the absorbance of the mixture of 2 mL of grass extracts or standard solution and ABTS working solution. The ABTS scavenging ability of the sample was calculated using a standard curve and expressed as μg Vc equivalent/g DW.
4.10.2. OH• Scavenging Activity
OH• scavenging activity was measured according to a previously reported assay67,68 with some adjustments. Briefly, 2.0 mL of 6.0 mM FeSO4, 2.0 mL of sample solutions or standard ascorbic acid solution (5, 10, 15, 20, 25 μg/mL), and 2 mL of 6.0 mM hydrogen peroxide were subsequently added. After 10 min of rest, 2.0 mL of 6 mM salicylic acid solution was mixed in. The absorbance was read at 510 nm versus deionized water as a blank after 30 min reaction, and the OH• scavenging activity were calculated from the following equation
where A2 is the absorbance of 2 mL of the sample solution mixed with 2 mL of FeSO4, 2 mL of H2O2, and 2 mL of salicylic acid; A1 is the absorbance of the mixture without H2O2; and A0 is the absorbance of the mixture without sample solution. The OH• scavenging ability of the sample was calculated from a standard curve and expressed as μg Vc equivalent/g DW.
4.11. Statistical Analysis
All of the tests were performed in triplicate. The results were shown as mean ± standard deviation (SD). The difference analysis was carried out using Duncan’s new multiple range tests. The correlation analysis was conducted using a standard Pearson correlation. All of the statistics handling including principal component analysis were carried out using IBM SPSS Statistics version 20.0 software (IBM Corp.). Asterisks indicate significant differences (**p < 0.01, *p < 0.05).
Acknowledgments
This work was funded by 2019 College Students’ Innovative and Entrepreneurial Education and Training Program of Anhui Province (201910379111, 201910379119) and the 13th College Student Research Project of Suzhou University (KYLXYBXM19-102). The work was also funded by a Research-Platform Open Project of Suzhou University (2019ykf13, 2017ykf06), Doctoral Research Startup Fund of Suzhou University (2019jb22), a Key Project of College Natural Science Research sponsored by Anhui Provincial Department of Education with project No. KJ2019A0665, Academic Leaders Project of Suzhou University (2018XJXS02), National Engineering Laboratory Open Fund project (NEL-SCRT 002), and National College students' Innovative and Entrepreneurial Education and Training Program (202010379046).
The authors declare no competing financial interest.
References
- Yang P.; Liu X.; Yang W.; Feng Z. Diversity analysis of the developed qingke (hulless barley) cultivars representing different growing regions of the Qinghai-Tibet Plateau in China using sequencerelated amplified polymorphism (SRAP) markers. Afr. J. Biotechnol. 2010, 9, 8530–8538. [Google Scholar]
- Liu X.-c.; Gou L.; Yang P.; Liu X.-j.; Wang X.-w.; He S.-p.; Li G.; Feng Z.-y. Genetic Diversity of Hordein on Qingke (Hulless Barley) Varieties from the Qinghai-Tibet Plateau of China. J. Plant Genet. Resour. 2008, 9, 180–185. [Google Scholar]
- Li Y.; Long C.; Kato K.; Yang C.; Sato K. Indigenous knowledge and traditional conservation of hulless barley (Hordeum vulgare) germplasm resources in the Tibetan communities of Shangri-la, Yunnan, SW China. Genet. Resour. Crop Evol. 2011, 58, 645–655. 10.1007/s10722-010-9604-2. [DOI] [Google Scholar]
- Lin S.; Guo H.; Lu M.; Lu M. Y.; Gong J. D. B.; Wang L.; Zhang Q.; Qin W.; Wu D. T. Correlations of Molecular Weights of beta-Glucans from Qingke (Tibetan Hulless Barley) to Their Multiple Bioactivities. Molecules 2018, 23, 1710–1724. 10.3390/molecules23071710. [DOI] [PMC free article] [PubMed] [Google Scholar]
- Chaturvedi N.; Sharma P.; Rohtagi S. Preliminary Phytochemical, Nutritional Potential of cereal Grass Powder Based Products for Effective Management of Diabetes. Int. J. Adv. Pharm., Biol. Chem. 2013, 2, 234–240. [Google Scholar]
- Siebenhandl-Ehn S.; Kinner M.; Leopold L. F.; Poppernitsch B. M.; Pruckler M.; Wurbs P.; Poisinger S.; Kalas E.; Berghofer E.; Grausgruber H.. Hulless Barley—A Rediscovered Source for Functional Foods Phytochemical Profile and Soluble Dietary Fibre Content in Naked Barley Varieties and Their Antioxidant Properties. In Phytochemicals—Bioactivities and Impact on Health; Rasooli I., Eds.; IntechOpen, 2011; pp 269–294. [Google Scholar]
- Wang W.; Liu C. Q.; Liu C. J.; Da-Jing L. I.; Jian-Jun L. I. Research progress in barley leaf powder. Sci. Technol. Food Ind. 2017, 38, 395–399. [Google Scholar]
- Shi Y.; Wang M.; Juan X. U.; Qiu-Hiu H. U. Determination of Nutritious Components and Antioxidant Activities of Wheat Seedling Juice. Food Sci. 2005, 26, 115–121. [Google Scholar]
- Panthi M.; Subba R. K.; Raut B.; Khanal D. P.; Koirala N. Bioactivity evaluations of leaf extract fractions from young barley grass and correlation with their phytochemical profiles. BMC Complementary Med. Ther. 2020, 20, 64–72. 10.1186/s12906-020-2862-4. [DOI] [PMC free article] [PubMed] [Google Scholar]
- Zeng Y.; Pu X.; Yang J.; Du J.; Yang X.; Li X.; Li L.; Zhou Y.; Yang T. Preventive and Therapeutic Role of Functional Ingredients of Barley Grass for Chronic Diseases in Human Beings. Oxid. Med. Cell. Longevity 2018, 2018, 3232080 10.1155/2018/3232080.. [DOI] [PMC free article] [PubMed] [Google Scholar]
- PaulíčkoVá I.; EhrENbErgEroVá J.; FIEdlEroVá V.; Gabrovska D.; Havlova P.; Holasova M.; Kopáček J.; Ouhrabková J.; Pinkrová J.; Rysová J. Evaluation of barley grass as a potential source of some nutritional substances. Czech. J. Food Sci. 2007, 25, 65–72. 10.17221/754-CJFS. [DOI] [Google Scholar]
- Idehen E.; Tang Y.; Sang S. Bioactive phytochemicals in barley. J. Food Drug Anal. 2017, 25, 148–161. 10.1016/j.jfda.2016.08.002. [DOI] [PMC free article] [PubMed] [Google Scholar]
- Liang J.; Xin C.; Deng G.; Pan Z.; Zhang H.; Qiao L.; Yang K.; Hai L.; Yu M. Dehydration induced transcriptomic responses in two Tibetan hulless barley (Hordeum vulgare var. nudum) accessions distinguished by drought tolerance. BMC Genomics 2017, 18, 775–789. 10.1186/s12864-017-4152-1. [DOI] [PMC free article] [PubMed] [Google Scholar]
- Kou X.; Chen Q.; Li X.; Li M.; Kan C.; Chen B.; Zhang Y.; Xue Z. Quantitative assessment of bioactive compounds and the antioxidant activity of 15 jujube cultivars. Food Chem. 2015, 173, 1037–1044. 10.1016/j.foodchem.2014.10.110. [DOI] [PubMed] [Google Scholar]
- Wu X.; Zeng F.; Zhang G. PEG-simulated drought stress and spike in vitro culture are used to study the impact of water stress on barley malt quality. Plant Growth Regul. 2016, 81, 243–252. 10.1007/s10725-016-0201-z. [DOI] [Google Scholar]
- Ma Y.; Wang P.; Chen Z.; Gu Z.; Yang R. NaCl stress on physio-biochemical metabolism and antioxidant capacity in germinated hulless barley (Hordeum vulgare L.). J. Sci. Food Agric. 2019, 99, 1755–1764. 10.1002/jsfa.9365. [DOI] [PubMed] [Google Scholar]
- Lilia E.; Salah R.; Hajer S. A.; Abderrazak D.; Majida E. H.; Ismail E. H. Effect of salt treatment on the expression of phenolics and peroxidase activity assessed in two barley cultivars Acsad 1230 and Arig 8. J. Agron. 2005, 4, 196–202. 10.3923/ja.2005.196.202. [DOI] [Google Scholar]
- Sarker U.; Oba S. Drought stress effects on growth, ROS markers, compatible solutes, phenolics, flavonoids, and antioxidant activity in Amaranthus tricolor. Appl. Biochem. Biotechnol. 2018, 186, 999–1016. 10.1007/s12010-018-2784-5. [DOI] [PubMed] [Google Scholar]
- Sarker U.; Oba S. Drought stress enhances nutritional and bioactive compounds, phenolic acids and antioxidant capacity of Amaranthus leafy vegetable. BMC Plant Biol. 2018, 18, 258 10.1186/s12870-018-1484-1. [DOI] [PMC free article] [PubMed] [Google Scholar]
- Sarker U.; Oba S. Response of nutrients, minerals, antioxidant leaf pigments, vitamins, polyphenol, flavonoid and antioxidant activity in selected vegetable amaranth under four soil water content. Food Chem. 2018, 252, 72–83. 10.1016/j.foodchem.2018.01.097. [DOI] [PubMed] [Google Scholar]
- Sarker U.; Oba S. Catalase, superoxide dismutase and ascorbate-glutathione cycle enzymes confer drought tolerance of Amaranthus tricolor. Sci. Rep. 2018, 8, 16496 10.1038/s41598-018-34944-0. [DOI] [PMC free article] [PubMed] [Google Scholar]
- Sarker U.; Oba S. Augmentation of leaf color parameters, pigments, vitamins, phenolic acids, flavonoids and antioxidant activity in selected Amaranthus tricolor under salinity stress. Sci. Rep. 2018, 8, 12349 10.1038/s41598-018-30897-6. [DOI] [PMC free article] [PubMed] [Google Scholar]
- Sarker U.; Islam M. T.; Oba S. Salinity stress accelerates nutrients, dietary fiber, minerals, phytochemicals and antioxidant activity in Amaranthus tricolor leaves. PLoS One 2018, 13, e0206388 10.1371/journal.pone.0206388. [DOI] [PMC free article] [PubMed] [Google Scholar]
- Sarker U.; Oba S. Salinity stress enhances color parameters, bioactive leaf pigments, vitamins, polyphenols, flavonoids and antioxidant activity in selected Amaranthus leafy vegetables. J. Sci. Food Agric. 2019, 99, 2275–2284. 10.1002/jsfa.9423. [DOI] [PubMed] [Google Scholar]
- Sarker U.; Oba S. The response of salinity stress-induced A. tricolor to growth, anatomy, physiology, non-enzymatic and enzymatic antioxidants. Front. Plant Sci. 2020, 11, 559876 10.3389/fpls.2020.559876. [DOI] [PMC free article] [PubMed] [Google Scholar]
- Li Q.; Wang Z.; Zhao Y.; Zhang X.; Zhang S.; Bo L.; Wang Y.; Ding Y.; An L. Putrescine protects hulless barley from damage due to UV-B stress via H2S- and H2O2-mediated signaling pathways. Plant Cell Rep. 2016, 35, 1155–1168. 10.1007/s00299-016-1952-8. [DOI] [PubMed] [Google Scholar]
- Li F.Effects of Co-treatment of Enhanced UV-B Radiation and Salt Stress on the Physiological and Biochemical Characteristics in Different Cultivars of Hulless Barley Seedlings. Master Thesis, Lanzhou University, 2011. [Google Scholar]
- Niroula A.; Khatri S.; Khadka D.; Timilsina R. Total phenolic contents and antioxidant activity profile of selected cereal sprouts and grasses. Int. J. Food Prop. 2019, 22, 427–437. 10.1080/10942912.2019.1588297. [DOI] [Google Scholar]
- Song L.; Zhang L.; Xu L.; Ma Y.; Lian W.; Liu Y.; Wang Y. Optimized Extraction of Total Triterpenoids from Jujube (Ziziphus jujuba Mill.) and Comprehensive Analysis of Triterpenic Acids in Different Cultivars. Plants 2020, 9, 412 10.3390/plants9040412. [DOI] [PMC free article] [PubMed] [Google Scholar]
- Feng S.; Luo Z.; Zhang Y.; Zhong Z.; Lu B. Phytochemical contents and antioxidant capacities of different parts of two sugarcane (Saccharum officinarum L.) cultivars. Food Chem. 2014, 151, 452–458. 10.1016/j.foodchem.2013.11.057. [DOI] [PubMed] [Google Scholar]
- Erasto M.; Shuang Z.; Zongping Z.; Jie C. Subcritical water extraction of bioactive compounds from dry loquat (Eriobotrya japonica) leaves and characterization of triterpenes in the extracts. Afr. J. Biotechnol. 2016, 15, 1041–1049. 10.5897/AJB2016.15316. [DOI] [Google Scholar]
- Chang C. L.; Lin C. S. Phytochemical Composition, Antioxidant Activity, and Neuroprotective Effect of Terminalia chebula Retzius Extracts. J. Evidence-Based Complementary Altern. Med. 2012, 2012, 125247 10.1155/2012/125247. [DOI] [PMC free article] [PubMed] [Google Scholar]
- Ni Q.; Zhang Y.; Xu G.; Gao Q.; Gong L.; Zhang Y. Influence of Harvest Season and Drying Method on the Antioxidant Activity and Active Compounds of Two Bamboo Grass Leaves. J. Food Process. Preserv. 2014, 38, 1565–1576. 10.1111/jfpp.12116. [DOI] [Google Scholar]
- Nakagawa T.; Zhu Q.; Tamrakar S.; Amen Y.; Mori Y.; Suhara H.; Kaneko S.; Kawashima H.; Okuzono K.; Inoue Y.; Ohnuki K.; Shimizu K. Changes in content of triterpenoids and polysaccharides in Ganoderma lingzhi at different growth stages. J. Nat. Med. 2018, 72, 734–744. 10.1007/s11418-018-1213-y. [DOI] [PubMed] [Google Scholar]
- Brat P.; Georgé S.; Bellamy A.; Chaffaut L. D.; Scalbert A.; Mennen L.; Arnault N.; Amiot M. J. Daily polyphenol intake in France from fruit and vegetables. J. Nutr. 2006, 136, 2368–2373. 10.1093/jn/136.9.2368. [DOI] [PubMed] [Google Scholar]
- Denev P.; Lojek A.; Ciz M.; Kratchanova M. Antioxidant activity and polyphenol content of Bulgarian fruits. Bulg. J. Agric. Sci. 2013, 19, 22–27. [Google Scholar]
- Marinova D.; Ribarova F.; Atanassova M. Total phenolics and total flavonoids in Bulgarian fruits and vegetables. J. Univ. Chem. Technol. Metall. 2005, 40, 255–260. [Google Scholar]
- Musci M.; Yao S. Optimization and validation of Folin–Ciocalteu method for the determination of total polyphenol content of Pu-erh tea. Int. J. Food Sci. Nutr. 2017, 68, 913–918. 10.1080/09637486.2017.1311844. [DOI] [PubMed] [Google Scholar]
- Jayasekera S.; Molan A. L.; Garg M.; Moughan P. J. Variation in antioxidant potential and total polyphenol content of fresh and fully-fermented Sri Lankan tea. Food Chem. 2011, 125, 536–541. 10.1016/j.foodchem.2010.09.045. [DOI] [Google Scholar]
- Anesini C.; Ferraro G. E.; Filip R. Total polyphenol content and antioxidant capacity of commercially available tea (Camellia sinensis) in Argentina. J. Agric. Food Chem. 2008, 56, 9225–9229. 10.1021/jf8022782. [DOI] [PubMed] [Google Scholar]
- Alqahtani A.; Tongkao-on W.; Li K. M.; Razmovski-Naumovski V.; Chan K.; Li G. Q. Seasonal Variation of Triterpenes and Phenolic Compounds in Australian Centella asiatica (L.) Urb. Phytochem. Anal. 2015, 26, 436–443. 10.1002/pca.2578. [DOI] [PubMed] [Google Scholar]
- Liang Y.; Dang B.; Yang X.; Zhang J.; Du Y.; Liang F. Study on changes of nutrients, polyphenol contents, and antioxidant activities of germinated hulless barley. J. Food Sci. Technol. 2019, 37, 70–81. [Google Scholar]
- Kubola J.; Siriamornpun S.; Meeso N. Phytochemicals, vitamin C and sugar content of Thai wild fruits. Food Chem. 2011, 126, 972–981. 10.1016/j.foodchem.2010.11.104. [DOI] [Google Scholar]
- Maisuthisakul P.; Suttajit M.; Pongsawatmanit R. Assessment of phenolic content and free radical-scavenging capacity of some Thai indigenous plants. Food Chem. 2007, 100, 1409–1418. 10.1016/j.foodchem.2005.11.032. [DOI] [Google Scholar]
- Liu H.; Qiu N.; Ding H.; Yao R. Polyphenols contents and antioxidant capacity of 68 Chinese herbals suitable for medical or food uses. Food Res. Int. 2008, 41, 363–370. 10.1016/j.foodres.2007.12.012. [DOI] [Google Scholar]
- Khanam U. K. S.; Oba S.; Yanase E.; Murakami Y. Phenolic acids, flavonoids and total antioxidant capacity of selected leafy vegetables. J. Funct. Foods 2012, 4, 979–987. 10.1016/j.jff.2012.07.006. [DOI] [Google Scholar]
- Lin S.; Guo H.; Gong J. D. B.; Lu M.; Lu M.-Y.; Wang L.; Zhang Q.; Qin W.; Wu D.-T. Phenolic profiles, β-glucan contents, and antioxidant capacities of colored Qingke (Tibetan hulless barley) cultivars. J. Cereal Sci. 2018, 81, 69–75. 10.1016/j.jcs.2018.04.001. [DOI] [Google Scholar]
- Min B.; Gu L.; McClung A. M.; Bergman C. J.; Chen M.-H. Free and bound total phenolic concentrations, antioxidant capacities, and profiles of proanthocyanidins and anthocyanins in whole grain rice (Oryza sativa L.) of different bran colours. Food Chem. 2012, 133, 715–722. 10.1016/j.foodchem.2012.01.079. [DOI] [Google Scholar]
- Zribi I.; Omezzine F.; Haouala R. Variation in phytochemical constituents and allelopathic potential of Nigella sativa with developmental stages. S. Afr. J. Bot. 2014, 94, 255–262. 10.1016/j.sajb.2014.07.009. [DOI] [Google Scholar]
- Hichem H.; Mounir D.; Naceur E. A. Differential responses of two maize (Zea mays L.) varieties to salt stress: Changes on polyphenols composition of foliage and oxidative damages. Ind. Crops Prod. 2009, 30, 144–151. 10.1016/j.indcrop.2009.03.003. [DOI] [Google Scholar]
- Kaur K.; Sharma V.; Kaur S.; Shaveta S.; Kaur H. Hulless Barley: A new era of research for food purposes. J. Cereal Res. 2019, 11, 114–124. 10.25174/2249-4065/2019/83719. [DOI] [Google Scholar]
- Senhofa S.; Ķince T.; Galoburda R.; Cinkmanis I.; Sabovics M.; Sturite I. Effects of germination on chemical composition of hull-less spring cereals. Res. Rural Dev. 2016, 1, 91–97. [Google Scholar]
- Wangcharoen W.; Phimphilai S. Chlorophyll and total phenolic contents, antioxidant activities and consumer acceptance test of processed grass drinks. J. Food Sci. Technol. 2016, 53, 4135–4140. 10.1007/s13197-016-2380-z. [DOI] [PMC free article] [PubMed] [Google Scholar]
- Sarker U.; Oba S. Nutraceuticals, antioxidant pigments, and phytochemicals in the leaves of Amaranthus spinosus and Amaranthus viridis weedy species. Sci. Rep. 2019, 9, 20413 10.1038/s41598-019-50977-5. [DOI] [PMC free article] [PubMed] [Google Scholar]
- Sarker U.; Hossain M. M.; Oba S. Nutritional and antioxidant components and antioxidant capacity in green morph Amaranthus leafy vegetable. Sci. Rep. 2020, 10, 1336 10.1038/s41598-020-57687-3. [DOI] [PMC free article] [PubMed] [Google Scholar]
- Sarker U.; Oba S.; Daramy Moses A. Nutrients, minerals, antioxidant pigments and phytochemicals, and antioxidant capacity of the leaves of stem amaranth. Sci. Rep. 2020, 10, 3892 10.1038/s41598-020-60252-7. [DOI] [PMC free article] [PubMed] [Google Scholar]
- Sarker U.; Oba S. Nutritional and bioactive constituents and scavenging capacity of radicals in Amaranthus hypochondriacus. Sci. Rep. 2020, 10, 19962 10.1038/s41598-020-71714-3. [DOI] [PMC free article] [PubMed] [Google Scholar]
- Sarker U.; Oba S. Phenolic profiles and antioxidant activities in selected drought-tolerant leafy vegetable amaranth. Sci. Rep. 2020, 18287 10.1038/s41598-020-71727-y. [DOI] [PMC free article] [PubMed] [Google Scholar]
- Zhao P.; Liu J. Y.; Zhang Y. P. Determination of proanthocyanidins molar concentration using vanillin. China Food Addit. 2011, 03, 219–224. [Google Scholar]
- Xi X.; Wei X.; Wang Y.; Chu Q.; Xiao J. Determination of tea polysaccharides in Camellia sinensis by a modified phenol-sulfuric acid method. Arch. Biol. Sci. 2010, 62, 669–676. 10.2298/ABS1003669X. [DOI] [Google Scholar]
- Dubois M.; Gilles K. A.; Hamilton J. K.; Rebers P.; Smith F. Colorimetric method for determination of sugars and related substances. Anal. Chem. 1956, 28, 350–356. 10.1021/ac60111a017. [DOI] [Google Scholar]
- Sarker U.; Oba S. Protein, dietary fiber, minerals, antioxidant pigments and phytochemicals, and antioxidant activity in selected red morph Amaranthus leafy vegetable. PLoS One 2019, 14, e0222517 10.1371/journal.pone.0222517. [DOI] [PMC free article] [PubMed] [Google Scholar]
- Sarker U.; Oba S. 3868Nutrients, minerals, pigments, phytochemicals, and radical scavenging activity in Amaranthus blitum leafy vegetables. Sci. Rep. 2020, 10, 3868 10.1038/s41598-020-59848-w. [DOI] [PMC free article] [PubMed] [Google Scholar]
- Yoon K.Multiple Attribute Decision Making. In Methods and Applications; Springer-Verlag: Berlin, Heidelberg, 1981. [Google Scholar]
- Yuan Q.; Lin S.; Fu Y.; Nie X.-R.; Liu W.; Su Y.; Han Q.-H.; Zhao L.; Zhang Q.; Lin D.-R. Effects of extraction methods on the physicochemical characteristics and biological activities of polysaccharides from okra (Abelmoschus esculentus). Int. J. Biol. Macromol. 2019, 127, 178–186. 10.1016/j.ijbiomac.2019.01.042. [DOI] [PubMed] [Google Scholar]
- Sarker U.; Oba S. Antioxidant constituents of three selected red and green color Amaranthus leafy vegetable. Sci. Rep. 2019, 9, 18233 10.1038/s41598-019-52033-8. [DOI] [PMC free article] [PubMed] [Google Scholar]
- Smirnoff N.; Cumbes Q. J. Hydroxyl radical scavenging activity of compatible solutes. Phytochemistry 1989, 28, 1057–1060. 10.1016/0031-9422(89)80182-7. [DOI] [Google Scholar]
- Li T.; Xiao C. Effects of Different Drying Methods on Physiological Activities of Kiwifruit. Agric. Biotechnol. 2018, 7, 68–70. [Google Scholar]


