Abstract
Characterizing the iron distribution in tissue sections is important for several pathologies. Iron content in excised tissue is typically analyzed via histochemical stains, which are dependent on sample preparation and staining protocols. In our recent studies, we examined how magnetic properties of iron can also be exploited to characterize iron distribution in tissue sections in a label free manner. To enable a histomagnetic characterization of iron in a wide variety of available tissues, it is important to extend it to samples routinely prepared for histochemical staining, which often involve use of chemical fixatives. In this study, we took a systematic approach to determine differences between unfixed and formalin-fixed murine spleen tissues in histomagnetic characterization of iron. Superconducting quantum interference device (SQUID) magnetometry and magnetic force microscopy (MFM) were used for macro- and micro-scale histomagnetic characterization. Perl’s stain was used for histochemical characterization of ferric (Fe3+) iron on adjacent sections as that used for MFM analysis. While histochemical analysis revealed a substantial difference in the dispersion of the stain between fixed versus unfixed samples, histomagnetic characterization was not dependent on chemical fixation of tissue. The results from this study reveal that histomagnetic characterization of iron is free from staining artifacts which can be present in histochemical analysis.
Keywords: histology, magnetometry, magnetic force microscopy, ferritin, iron
Introduction
Iron is an important element which regulates many physiological functions. The oxidation state, mineral composition and confinement of iron play a crucial role in iron homeostasis. The majority of iron in the human body is intracellular and is either bound to hemoglobin in erythrocytes (~70%) or stored in ferritin in hepatocytes and macrophages within the liver and spleen (25%)1. Ferritin is the largest iron-storage protein and encapsulates a 4 to 8 nm iron-rich core in its ~12 nm protein shell, primarily in the form of ferrihydrite ([Fe3+]2O3). Splenic macrophages within the red pulp, regulate the storage and recycling of ferritin(iron) by scavenging damaged or lysed erythrocytes2. A similar behavior is exhibited by macrophages in other tissues upon an insult or injury, leading to an acute or chronic accumulation of ferritin(iron) rich macrophages at the site of injury3. Spatial localization and quantification of ferritin(iron) thus holds widespread relevance in health and disease.
Histochemical staining (e.g. Perl’s stain) is the standard approach for evaluating the spatial distribution of ferritin(iron) deposits in health and disease using conventional light microscopy. Histochemical staining primarily provides a qualitative evaluation of iron with a stronger signal arising from clusters of ferritin(iron) as compared to the weak, diffuse signal from monodisperse particles4. Transmission and scanning electron microscopy (TEM or SEM) coupled with energy dispersive spectroscopy (EDS) are also used to morphologically and chemically identify ferritin(iron) distribution at the sub-cellular level5. Both histochemical staining as well as ultrastructural electron microscopy analysis involve use of chemical fixatives (e.g. formalin or glutaraldehyde) in their sample preparation protocols6,7. Several studies have indicated how the buffers6 and methodology used (e.g. immersion versus perfusion8) as well as the duration of fixation9 can significantly impact the signal arising from iron in histochemical analysis. Therefore, avoiding the use of fixatives and alternative method(s) of analysis continue to be of importance for assessment of spatial distribution of iron in histology.
Besides its characteristic chemical signature, ferritin(iron) can also be detected via its magnetic behavior. Analyses using super-conducting quantum interference device (SQUID) magnetometry10 and Mossbauer spectroscopy11 have elucidated that the iron-core of purified ferritin is superparamagnetic in nature with a magnetic moment of ~200–350 μB12–14. Magnetometry has therefore been used to analyze iron content in tissue segments both before5,15,16 or after chemical fixation17,18. We have recently elucidated how a magnetism-based microscopy technique, namely magnetic force microscopy (MFM), can also be used to spatially localize ferritin(iron)-rich domains in mammalian tissues in a manner synergistic with histochemical staining3,19. However, to enable a widespread use of histomagnetic analysis of iron, it is important to evaluate how the routinely used sample processing conditions (in particular the use of chemical fixatives) impacts its iron assessment via histomagnetic approaches.
In this study, we take a comprehensive approach to study the effects of chemical fixatives on histomagnetic and histochemical analysis of iron in tissue sections. Murine spleen tissue was processed without and with formalin fixation (a commonly used chemical fixative) and subjected to analysis via SQUID magnetometry, TEM, MFM and Perl’s histochemical stain. Image analysis was performed to quantify parameters like particle size and intensity of signal. We elucidate how histomagnetic approaches offer a unique advantage by being insensitive to the use of fixatives.
Methods and Materials
Spleen Tissue:
All animal work was performed in agreement with The Ohio State University Institutional Animal Care and Use Committee. Studies were performed on either 8 month (for SQUID studies) or 15 month (for Perl’s and MFM analysis) old heterozygous DDR1+/− mice with a 129Sv/C57BL6 background20.
Super-Conducting Quantum Interference Device (SQUID) Magnetometry:
Upon euthanasia, spleens (n=5) were extracted and dissected into half lengthwise. For every animal, each half was immersed in either phosphate buffered solution (PBS) or formalin for 48 hours to generate unfixed (UN) or formalin-fixed (FF) samples, respectively. After fixation, the samples were rinsed twice in distilled water and then subjected to dehydration in a graded ethanol series. Thereafter the samples underwent a two-hour critical point drying (CPD) process in a Tousimis Autosamdri®−931 in an environment of liquid CO2. After CPD, the individual samples were placed in cylindrical, thin-wall transparent fluoropolymer fluorinated ethylene propylene (FEP) tubing (Norell) approximately 5mm in height.
SQUID magnetometry was performed by using a MPMS-3 magnetometer (Quantum Design). To ascertain the blocking temperature (TB) of the samples zero-field cooled (ZFC) measurements were obtained at a 1 mT applied magnetic field (to break symmetry). The temperature during ZFC measurements was changed at a rate of 3 K/min. Thereafter, magnetometry measurements were performed at 10, 30 and 300 K to measure magnetization versus applied field (M-H) curves. DC fields in the range −7T to 7T were applied to samples and magnetization was recorded at a minimum of 120 points. After SQUID magnetometry, the mass of each tissue segment and its total iron content was evaluated using atomic absorption spectroscopy (AAS) analysis. Magnetization was normalized with regards to total iron content.
For tissue samples, the magnetic signal in M-H curves is a combination of diamagnetic, paramagnetic and superparamagnetic contributions. The susceptibility from diamagnetic and paramagnetic contributions is constant and, therefore, adds a linear component to the superparamagnetic signal from ferritin. In order to isolate the superparamagnetic signal, the diamagnetic contribution was determined by evaluating the slope of M-H curves at high fields (>7 T), where the signal from ferritin is nearly saturated. The susceptibility from this region of the M-H curve was then used to calculate the paramagnetic/diamagnetic contributions to magnetization at each field. Finally, this magnetization was subtracted from the original data, leaving only signal from superparamagnetic contributions (Figure S1). The M-H curves thus obtained were utilized to ascertain the saturation magnetization, Ms (maximum value of M).
To estimate size of magnetic particles, a MATLAB curve fitting tool was used to fit M-H curves with the Langevin equation. The magnetization and applied fields were imported as and z respectively. The variable D from the Langevin equation,
| (1) |
was used to measure the magnetic moment, m, using
| (2) |
where k is the Boltzmann constant, T is temperature and μ0 is the vacuum permeability. Once m was determined, the particle core radius, r, was estimated by assuming that the particles were spherical and using the (volume) saturation magnetization of ferritin (8 A∙m2)21 at 30 K as follows:
| (3) |
Transmission Electron Microscopy (TEM):
From the tissues processed for SQUID magnetometry, a small segment (~1 mm) of the tissue (after the fixation step) was dissected for TEM analysis. TEM sample preparation and imaging was performed in accordance with our previous protocol3. Briefly, the tissue segments were rinsed with PBS and subjected to osmium tetroxide stain (1% percent, 1 hour). Thereafter the samples were dehydrated in graded ethanol series, embedded in Spurr’s resin and sectioned using a Leica Ultracut UCT ultramicrotome (Leica-Microsystems). Thick sections were sectioned with ~750 nm depth and stained with a Basic Fuchsin stain to determine orientation and regions of interest. Thin sections were cut at ~100 nm depth and collected onto copper grids. No post-stains were done on thin sections. Samples were imaged using a JEOL JEM-1400 (JEOL, Peabody, MA) at 80 kV equipped with an Olympus Veleta camera.
Atomic Absorption Spectroscopy (AAS):
Post-SQUID analysis, the tissue samples were weighed to determine their mass and subjected to digestion via a Parr microwave digestion bomb with 0.5 mL or 1.0 mL of trace metal grade concentrated nitric acid (Fisher Scientific). The digestion bomb was sealed and placed in an 1150 W microwave for 20 s. Upon cooling, the digested material was transferred to a volumetric flask and brought to a volume of 10.00 mL by using nanopure water22. A flame atomic absorption spectrometer (Shimadzu AA-7000) was used to determine the concentration of Fe in the spleen samples. The iron hollow cathode lamp was set to 248.3 nm and a slit width of 0.2 nm was used during analysis. The air-acetylene mixture had a flow rate of 2.2 L/min. Standards of Fe were prepared in the range of 0.5–10.0 ppm using 1000 ppm Fe stock solution (Acros Organics, AAS grade). Each standard and sample were measured at least 4 times. Concentration of the samples was determined by using the linear regression fit of absorption versus concentration of the standards.
Perl’s staining:
Upon euthanasia, spleens (n=6) were extracted and dissected into three segments (~5 mm) along their length for microscopy analysis. The three segments from each spleen were subjected to treatment with one of the three fixatives: formalin (10%), glutaraldehyde (2%) or PBS control. After incubating the samples in their respective solution for 24 hours, they were rinsed three times with PBS and thereafter embedded in Optimal Cutting Temperature (OCT), flash frozen in liquid nitrogen and stored at −80°C till further use. OCT embedded tissue was cryo-sectioned to a thickness of 5 μm on glass slides. Histochemical Perl’s staining was performed on three adjacent sections from each OCT block as described earlier3. Briefly, after removing the OCT via several rinses in PBS, the sections were incubated with 0.1% Triton X-100/PBS, briefly rinsed with PBS and then incubated in hydrogen peroxide (6% H2O2 in methanol). After another brief PBS rinse, slides were incubated in a 50% potassium ferrocyanide and 50% hydrochloric acid solution for 20 minutes. Slides were rinsed in PBS and dehydrated in graded ethanol. Finally, slides were mounted with Permount™ Mounting Medium.
Slides were imaged using an Axio Imager.Z2 (Zeiss) microscope equipped with an Axiocam 503 Color (Zeiss) camera and a Zen 2.3pro software. All slides were imaged at a constant exposure setting of 250μs and 800μs for 10x and 20x magnification, respectively. FIJI ImageJ was used to analyze images for particle size and percent area stained by utilizing the threshold feature to isolate stained particles and areas.
Magnetic Force Microscopy (MFM):
Adjacent sections as those used for Perl’s staining were sectioned to a thickness of 5 μm and mounted on poly-lysine coated glass cover slips as described earlier3. After washing off OCT and drying the sections in ambient air, MFM imaging was performed using a Multimode AFM equipped with a Nanoscope IIIa Controller (Bruker). Magnetically coated high-moment MFM probes (ASYMFMHM, Asylum Research) were used to scan the samples at a scan rate of 2 Hz with 512 lines per scan. MFM images were acquired in the interleaved lift mode at lift heights (z) ranging from 0 to over 100 nm.
MFM phase images at a lift height of 30 nm were used to measure phase difference and particle size by using the NanoScope Analysis 1.9 software. Phase difference was measured using the section analysis feature while the area of particles was measured using the threshold feature (for phase ≤ −10°) of the software. Measurements were performed on at least n=10 particles per sample for each treatment for each animal.
Statistical analysis:
An unpaired student’s t-test assuming equal variance was used to compare the various parameters across fixed and unfixed samples. All statistical analysis performed considered a p-value <0.01 significant.
Results
Macroscale histomagnetic characterization
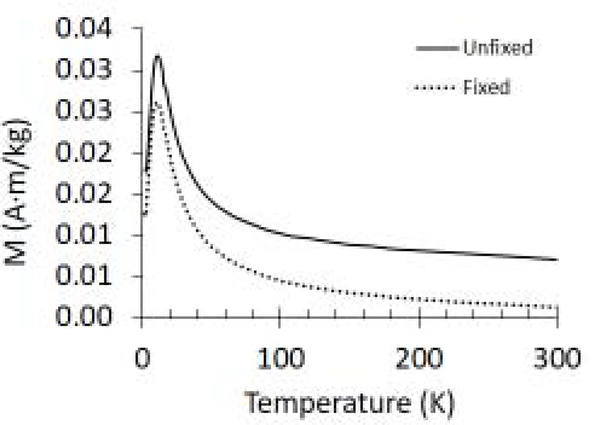
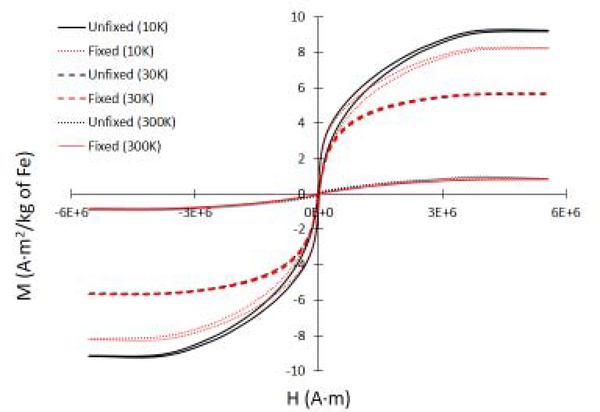
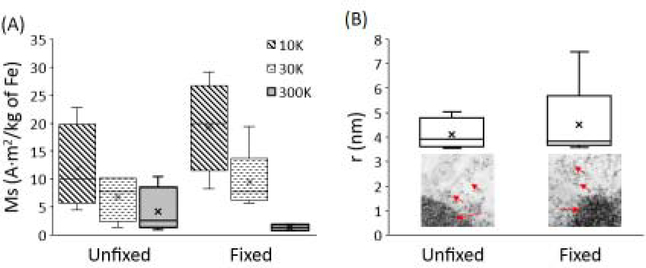
Super-conducting quantum interference device (SQUID) magnetometry was used to characterize the macroscopic, ensemble-average magnetic properties of unfixed (UN) and formalin-fixed (FF) tissue samples. As shown in Figure 1, the blocking temperature, TB, estimated from ZFC curves was 11 ± 0.45 and 11 ± 0.66 K for UN and FF samples, respectively, and did not change significantly across samples. Hysteresis curves (M-H curves) were recorded slightly below (at 10 K) and above (30 and 300 K) TB for each sample. Figure 2 shows an increase in the magnetization (M) with applied magnetic fields (H). No complete saturation was observed even at high H, which is commonly found in the magnetometry studies of ferritin21. The saturation magnetization (Ms) determined at each temperature did not significantly differ across UN versus FF samples (Figure 3A). The M-H curves were also utilized to estimate the particle size of magnetic carriers. The average particle radius in UN and FF samples was 3.8 ± 0.2 nm and 3.8 ± 0.1 nm, respectively, with no statistically significant difference between the two samples (Figure 3B). The particle size determined from SQUID magnetometry was found to correspond to the size of ferritin(iron) cores as determined from TEM images of spleen tissue in our current as well as earlier study19.
Figure 1:
ZFC curves used to determine the blocking temperature TB for fixed and unfixed samples as indicated.
Figure 2:
Magnetization (M) vs. Applied Field (H) i.e. M-H curves at three different temperatures for fixed and unfixed spleen tissue samples as indicated. The shapes of the curves reveal minimal hysteresis and a reduction in magnetization from 10 K to 300 K, characteristic of superparamagnetic material (ferritin).
Figure 3:
(A) Saturation magnetization (Ms) ascertained using M-H curves at respective temperatures. (B) Average particle size from Langevin fitting of M-H graphs. Inset: TEM images of electron dense ferritin particles (red arrows) in/near the lysosomes in cells. No significant difference between fixed versus unfixed samples were found in any of these parameters (p>0.01).
Microscale histomagnetic characterization
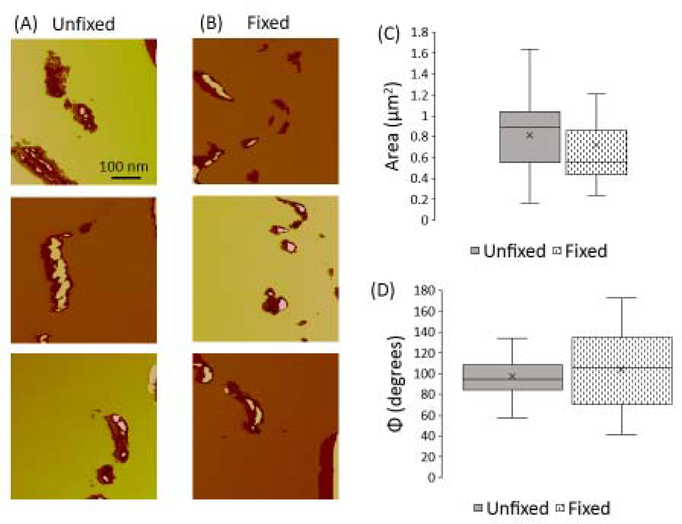
To characterize the magnetic behavior of ferritin(iron) deposits at the microscale level, we employed magnetic force microscopy (MFM) analysis on unstained tissue sections. MFM phase images at a lift-height (z) of 30 nm were utilized to assess long-range attractive magnetic forces between the MFM probe and the magnetic domains in the sample. The magnitude of the negative phase shift corresponds to the intensity of magnetic interaction between the probe and samples. Figure 4A–B shows typical MFM phase images for UN and FF samples. Figures 4C–D show how the area (regions corresponding to MFM signal) and the intensity (magnitude of phase shift) of MFM signal were not significantly different between UN versus FF samples.
Figure 4:
Magnetic force microscopy (MFM) phase images of (A) unfixed and (B) formalin-fixed samples acquired at a lift height of z= 30 nm. The area (C) and magnitude (D) of MFM phase shift revealed no significant difference across fixed and unfixed samples.
Microscale histochemical characterization
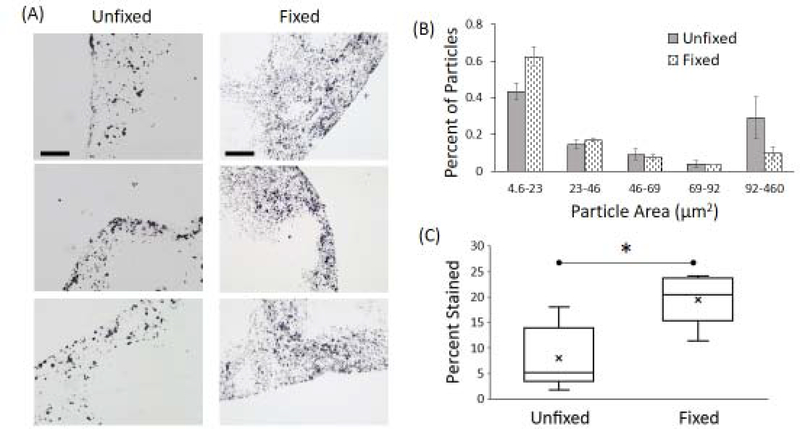
To determine the distribution of ferric iron (Fe3+), in the form of ferrihydrite found in ferritin cores, Perl’s staining was performed on adjacent sections to those used for MFM analysis. As shown in Figure 5A, UN sections showed well-defined, tightly packed particulate iron deposits while FF samples showed an increase in the dispersion of iron. Particle size analysis showed an abundance of smaller particles in FF samples as compared to UN samples (Figure 5B). Further, FF samples revealed an increase in the percent area stained positive for iron (Figure 5C).
Figure 5:
(A) Perl’s stained images (black particles) for unfixed and formalin-fixed mouse spleen tissue to characterize the distribution of ferric iron (Fe3+) via histochemical staining. Scale bars are 100μm. (B) Normalized distribution showing the area of Perl’s stained particles. Formalin-fixed samples exhibited a higher percentage of smaller particles compared to unfixed samples. (C) Percentage of total area stained in each sample. Formalin-fixed samples had significantly larger fraction of stained area (“*” represents p<0.01).
Discussion
Our macroscale SQUID magnetometry measurements indicate that the TB, shape of M-H curves, and Ms values as well as average particle size (from Langevin fit) indicates no significant changes between fixed and unfixed samples. An earlier report on one sample had indicated that the magnetization values of brain tissue after seven day fixation in formalin decreases its magnetization23. However, our results are consistent with a recent study, which reported that formalin fixation even for extended periods (~ 5 months) did not yield significant differences in magnetometry analysis of brain tissue24. Since the magnetic properties of nanoparticles are sensitive to their size, as well as chemical structure of iron oxide (e.g. change from ferrihydrite to magnetite) we postulate that the ferritin iron cores had a similar composition in both fixed and unfixed samples25 and interparticle interactions did not change considerably with treatment condition. This is also indicated by our TB values of ~ 11 K determined for both fixed and unfixed murine spleen tissue, which are in agreement with ~ 10 K reported for human spleen5.
Our microscale histomagnetic analysis via MFM could further map individual iron deposits in tissue sections in a semi-quantitative manner. As shown in our previous studies, the size(s) of MFM-positive regions corresponds to ferritin(iron)-rich lysosomes3,19. No significant differences were observed in either the intensity of MFM signal or the size of MFM positive regions between the unfixed and fixed samples, indicating that the lysosomal ferritin(iron) did not undergo significant changes upon fixative treatment, at least within the sensitivity of the used techniques.
Histochemical staining on the other hand showed significant differences in iron distribution with more dispersed staining in formalin-fixed tissue. A similar feature was also observed in glutaraldehyde fixed tissues (Figure S2). Our results agree with previous studies which have addressed the biochemical cause for discrepancies between fixed and non-fixed samples. Tissue immersed in formalin for short or extended time periods (<30 days) have shown iron leeching9. Formalin has been shown to naturally oxidize26,27 and react with Perl’s stain28 forming formic acid which has a larger reactivity to ferrocyanide resulting in a staining artifact.
Thus, taken together, our results elucidate that the macro- and micro-scale evaluation of iron in biological tissues via histomagnetic approaches is not significantly affected by use of chemical fixatives. Histomagnetic approaches can also offer an advantage over histochemical approaches to better correlate in-vivo estimates of iron (ascertained using magnetic resonance imaging) with its ex-vivo analysis on fixed or unfixed tissues.
Supplementary Material
Macro- and micro-scale magnetic characterization of ferritin(iron) is independent of chemical fixatives in biological tissues.
Magnetic force microscopy can serve as a label-free and complementary method to histochemical iron staining
Acknowledgements
This work was supported in part by a seed grant (to GA and DM) from the Chronic Brain Injury program at The Ohio State University, by the NSF CBET award 1403574 (to GA) and a pre-doctoral fellowship (to KW) via the NIH T32 GM118291-01A1 award. S.D.O. acknowledges the National Institute of Standards and Technology for use of their SQUID magnetometer.
Footnotes
Declaration of interests
The authors declare that they have no known competing financial interests or personal relationships that could have appeared to influence the work reported in this paper.
Supporting Information
Figures S1 and S2 are provided as supplemental data.
Publisher's Disclaimer: This is a PDF file of an unedited manuscript that has been accepted for publication. As a service to our customers we are providing this early version of the manuscript. The manuscript will undergo copyediting, typesetting, and review of the resulting proof before it is published in its final form. Please note that during the production process errors may be discovered which could affect the content, and all legal disclaimers that apply to the journal pertain.
References
- 1.Ghafourian K, Shapiro JS, Goodman L & Ardehali H Iron and Heart Failure: Diagnosis, Therapies, and Future Directions. JACC Basic to Transl. Sci 5, 300–313 (2020). [DOI] [PMC free article] [PubMed] [Google Scholar]
- 2.Soares MP & Hamza I Macrophages and Iron Metabolism. Immunity 44, 492–504 (2016). [DOI] [PMC free article] [PubMed] [Google Scholar]
- 3.Blissett AR et al. Sub-cellular In-situ Characterization of Ferritin(iron) in a Rodent Model of Spinal Cord Injury. Sci. Rep 8, 3567 (2018). [DOI] [PMC free article] [PubMed] [Google Scholar]
- 4.Harrison PM & Arosio P The ferritins: molecular properties, iron storage function and cellular regulation. Biochim. Biophys. Acta - Bioenerg 1275, 161–203 (1996). [DOI] [PubMed] [Google Scholar]
- 5.Kopáni M et al. Iron oxides in human spleen. BioMetals 28, 913–928 (2015). [DOI] [PubMed] [Google Scholar]
- 6.Meguro R, Asano Y, Iwatsuki H & Shoumura K Perfusion-Perls and -Turnbull methods supplemented by DAB intensification for nonheme iron histochemistry: Demonstration of the superior sensitivity of the methods in the liver, spleen, and stomach of the rat. Histochem. Cell Biol 120, 73–82 (2003). [DOI] [PubMed] [Google Scholar]
- 7.Meguro R et al. Nonheme-iron histochemistry for light and electron microscopy: a historical, theoretical and technical review. Arch. Histol. Cytol 70, 1–19 (2007). [DOI] [PubMed] [Google Scholar]
- 8.Meguro R et al. The presence of ferric and ferrous iron in the nonheme iron store of resident macrophages in different tissues and organs: histochemical demonstrations by the perfusion-Perls and -Turnbull methods in the rat. Arch. Histol. Cytol 68, 171–183 (2005). [DOI] [PubMed] [Google Scholar]
- 9.Chua-Anusorn W, Webb J, Macey DJ, Pootrakul P & St. Pierre, T. G. The effect of histological processing on the form of iron in iron-loaded human tissues. Biochim. Biophys. Acta - Mol. Basis Dis 1360, 255–261 (1997). [DOI] [PubMed] [Google Scholar]
- 10.Vohralik PF & Lam SKH NanoSQUID detection of magnetization from ferritin nanoparticles. Supercond. Sci. Technol 22, (2009). [Google Scholar]
- 11.Allen PD, St Pierre TG, Chua-Anusorn W, Ström V & Rao KV Low-frequency low-field magnetic susceptibility of ferritin and hemosiderin. Biochim. Biophys. Acta - Mol. Basis Dis 1500, 186–196 (2000). [DOI] [PubMed] [Google Scholar]
- 12.Kilcoyne SH & Cywinski R Ferritin: a model superparamagnet. J. Magn. Magn. Mater 140–144, 1466–1467 (1995). [Google Scholar]
- 13.Frankel RB, Papaefthymiou GC & Watt GD Variation of superparamagnetic properties with iron loading in mammalian ferritin. Hyperfine Interact 66, 71–82 (1991). [Google Scholar]
- 14.Gilles C et al. Magnetic hysteresis and superantiferromagnetism in ferritin nanoparticles. J. Magn. Magn. Mater 241, 430–440 (2002). [Google Scholar]
- 15.Kirschvink JL, Kobayashi-Kirschvink A & Woodford BJ Magnetite biomineralization in the human brain. Proc. Natl. Acad. Sci. U. S. A 89, 7683–7687 (1992). [DOI] [PMC free article] [PubMed] [Google Scholar]
- 16.Hautot D et al. Preliminary observation of elevated levels of nanocrystalline iron oxide in the basal ganglia of neuroferritinopathy patients. Biochim. Biophys. Acta - Mol. Basis Dis 1772, 21–25 (2007). [DOI] [PMC free article] [PubMed] [Google Scholar]
- 17.Kumar P et al. A novel approach to quantify different iron forms in ex-vivo human brain tissue. Sci. Rep 6, 38916 (2016). [DOI] [PMC free article] [PubMed] [Google Scholar]
- 18.Bulk M et al. Quantitative comparison of different iron forms in the temporal cortex of Alzheimer patients and control subjects. Sci. Rep 8, 6898 (2018). [DOI] [PMC free article] [PubMed] [Google Scholar]
- 19.Blissett AR, Ollander B, Penn B, McTigue DM & Agarwal G Magnetic mapping of iron in rodent spleen. Nanomedicine Nanotechnology, Biol. Med 13, 977–986 (2017). [DOI] [PMC free article] [PubMed] [Google Scholar]
- 20.Tonniges JR et al. Collagen Fibril Ultrastructure in Mice Lacking Discoidin Domain Receptor 1. Microsc. Microanal 22, 599–611 (2016). [DOI] [PMC free article] [PubMed] [Google Scholar]
- 21.Brooks RA, Vymazal J, Goldfarb RB, Bulte JWM & Aisen P Relaxometry and magnetometry of ferritin. Magn. Reson. Med 40, 227–235 (1998). [DOI] [PubMed] [Google Scholar]
- 22.OPERATING INSTRUCTIONS for Parr Microwave Acid Digestion Bombs.
- 23.Dobson J & Grassi P Magnetic properties of human hippocampal tissue—Evaluation of artefact and contamination sources. Brain Res. Bull 39, 255–259 (1996). [DOI] [PubMed] [Google Scholar]
- 24.van der Weerd L, Lefering A, Webb A, Egli R & Bossoni L Effects of Alzheimer’s disease and formalin fixation on the different mineralised-iron forms in the human brain. bioRxiv 2020.06.02.129593 (2020) doi: 10.1101/2020.06.02.129593. [DOI] [PMC free article] [PubMed] [Google Scholar]
- 25.Farrell D, Cheng Y, McCallum RW, Sachan M & Majetich SA Magnetic interactions of iron nanoparticles in arrays and dilute dispersions. J. Phys. Chem. B 109, 13409–13419 (2005). [DOI] [PubMed] [Google Scholar]
- 26.Fox CH, Johnson FB, Whiting J & Roller PP Formaldehyde fixation. J. Histochem. Cytochem 33, 845–853 (1985). [DOI] [PubMed] [Google Scholar]
- 27.Thavarajah R et al. Chemical and physical basics of routine formaldehyde fixation. J. Oral Maxillofac. Pathol 16, 400–405 (2012). [DOI] [PMC free article] [PubMed] [Google Scholar]
- 28.Birkl C et al. Effects of formalin fixation and temperature on MR relaxation times in the human brain. NMR Biomed 29, 458–465 (2016). [DOI] [PubMed] [Google Scholar]
Associated Data
This section collects any data citations, data availability statements, or supplementary materials included in this article.


