

Abstract
Esophageal cancer (EC) is a highly aggressive disease, and its progression involves a complex gene regulation network. Transcription factor SOX2 is amplified in various cancers including EC. A pathway involving SOX2 regulation of microRNAs (miRNAs) and their target genes has been previously revealed. This study aims to delineate the ability of SOX2 to influence the EC progression, with the involvement of miR-30e/USP4/SMAD4/CK2 axis. SOX2 expression was first examined in the clinical tissue samples from 30 EC patients. Effects of SOX2 on proliferation, migration, and invasion alongside tumorigenicity of transfected cells were examined by means of gain- and loss-of-function experiments. EC tissues and cells exhibited high expression of SOX2, miR-30e, and CK2 and poor expression of USP4 and SMAD4. Mechanistically, SOX2 was positively correlated with miR-30e and upregulated the expression of miR-30e. miR-30e specifically targeted USP4, which induced deubiquitination of SMAD4 and promoted its expression. Meanwhile, SMAD4 was enriched in the CK2 promoter region and thus inhibited its expression. SOX2 stimulated EC cell proliferative, invasive, and migratory capacities in vitro and tumor growth in vivo by regulating the miR-30e/USP4/SMAD4/CK2 axis. Collectively, our work reveals a novel SOX2-mediated regulatory network in EC that may be a viable target for EC treatment.
Keywords: esophageal cancer, SOX2, microRNA-30e, USP4, SMAD4, CK2, EMT, invasion
Graphical Abstract
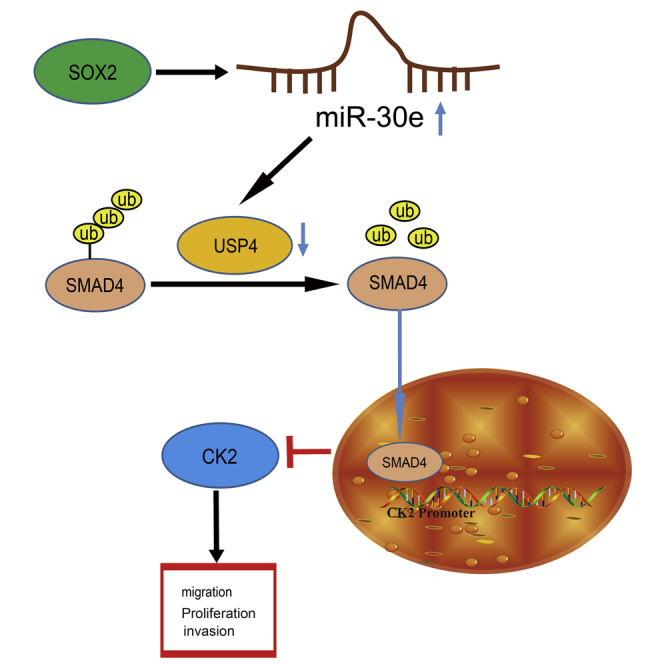
SOX2-upregulated miR-30e targets USP4 and decreases its expression, thus reducing SMAD4 expression to activate CK2, which ultimately leads to esophageal cancer (EC) cell proliferation, invasion, and migration. This study reveals a novel SOX2-mediated regulatory network in EC that may be a viable target for EC treatment.
Introduction
As one of the deadliest cancers, esophageal cancer (EC) ranks eighth on the list of most frequently occurring cancers in association with great mortality on a global scale.1 Currently, esophageal squamous cell cancer (ESCC) and esophageal adenocarcinoma constitute two major histological types of EC, which together account for nearly 90% incidence rate of EC.2,3 In addition, EC is influenced by various risk factors, including genetic factors (such as tylosis) and infectious agents.4 Moreover, fast growth and invasion is a major trigger of the malignancy of EC.5 Due to the involvement of a complex and important gene regulation network in EC development,6 it is critical to figure out the molecular mechanism underlying EC.
Sex determining region Y-box 2 (SOX2) is referred to as a stem cell transcription factor, which has been widely identified to correlate to normal development and cancer.7 SOX2 has been documented to increase the migration, invasion, and proliferation of cancer cells, thus being linked to cancer progression.8 A prior study revealed that SOX2 downregulation could decrease EC cell proliferation and stemness.9 Meanwhile, another study unraveled that SOX2 acted as a tumor-promoter in ESCC development by elevating cell proliferation.10 Moreover, SOX2 can regulate the expression of microRNA-30e-5p (miR-30e-5p) to promote breast cancer cell migration.11 miR-30e is referred to as a member of the miR-30 family that is involved in the regulation of cell differentiation, senescence, apoptosis, and the pathogenesis of tumors.12 miR-30e upregulation can promote glioma cell invasion by upregulating EGFR.13 Furthermore, the expression of miR-30e has been determined in EC cell lines and it is associated with shorter overall and disease-free survival in patients succumbed to EC.14 miRNAs are a kind of extremely conserved small single-stranded non-coding RNA and have the potency to modulate gene expression in a posttranscriptional fashion by interacting with the 3′ untranslated region (UTR) of specific target mRNAs.15 The Starbase database used in our study predicted the targeting relationship between miR-30e and ubiquitin-specific protease 4 (USP4) in EC. USP4, a member of USPs that engages in deubiquitination that is referred to as an inverse event of ubiquitination, is capable of modulating multiple cancer-related pathways, thus playing a prominent role in both physiological and pathological processes such as tumor initiation and progression.16 Significantly increased expression of USP4 has been identified in EC cancer tissues and USP4 shows a positive correlation with the pathology grade and prognosis.17 USP4 participates in numerous signaling pathways by promoting the cleavage of ubiquitin from serious protein substrates.18 Of note, USP4 has been documented to decrease Drosophila protein, mothers against decapentaplegic homolog 4 (SMAD4) monoubiquitination to sustain SMAD4 activity.19 Moreover, a research by Singhi et al.20 unraveled that SMAD4 downregulation correlated to the promotion of disease recurrence and poor survival of patients with esophageal adenocarcinoma. Additionally, SMAD4 has been acknowledged to decrease the expression of casein kinase 2 (CK2) to protect against flow induced arteriovenous malformations.21 Importantly, the promoting role of CK2 was identified in EC progression by a prior study.22 Considering the above findings, we hypothesized that the SOX2/miR-30e/USP4/SMAD4/CK2 axis will play an important role in EC progression. Thus, this study was conducted involving an array of in vitro and in vivo assays with the purpose of verifying this hypothesis.
Results
Upregulation of SOX2 Was Observed in EC Tissues and Cells and Negatively Correlated with Clinical Prognosis
Aiming at dissecting out the role of SOX2 in EC, the expression of SOX2 in EC and adjacent normal tissues was examined, which found that SOX2 was significantly overexpressed in EC clinical tissues (Figure 1A). Immunohistochemical results also showed that SOX2 expression was obviously higher in EC tissues than that seen in adjacent normal tissues (Figure 1B). Besides, patients with high SOX2 expression had shorter osteoporosis (OS) and disease free survival (DFS) than those with low expression of SOX2 (Figure 1C). Then, the expression of SOX2 was determined in four EC cells (Eca109, EC9706, KYSE150, and TE-1). As depicted in Figure 1D, the results of qRT-PCR and western blot analysis revealed that SOX2 was much higher in EC cell lines than that in normal human esophageal epithelial cells (HEECs), with the lowest expression shown in Eca109 cell lines and the highest expression in TE-1 cell lines. Thus, the two cell lines were selected for subsequent experiments.
Figure 1.

SOX2 Is Highly Expressed in EC Tissues and Cells, which Is Negatively Correlated with EC Patients’ Prognosis
(A) mRNA expression of SOX2 in EC tissues and adjacent normal tissues detected by qRT-PCR (n = 30). (B) Quantitation of SOX2 protein in EC tissues and adjacent normal tissues by immunohistochemical assay. (C) Kaplan-Meier analysis showing the correlation of SOX2 expression with OS and DFS of EC patients. (D) SOX2 expression determined by qRT-PCR and western blot analysis in EC cell lines (Eca109, EC9706, KYSE150, and TE-1) and normal esophageal epithelial cells (HEEC). ∗p < 0.05, ∗∗p < 0.01, ∗∗∗p < 0.001, ∗∗∗∗p < 0.0001. Paired t test was used for comparison between data of EC tissues and adjacent normal tissues, and one-way ANOVA was used for data comparison among multiple groups. Data are shown as mean ± standard deviation of three technical replicates.
SOX2 Promoted Proliferative, Invasive, and Migratory Capacities and Epithelial-Mesenchymal Transition (EMT) of EC Cells via miR-30e Upregulation in Vitro
A prior study revealed that SOX2 promoted miR-30e expression in breast cancer cells.11 Then, we aimed to verify whether SOX2 promoted the occurrence of EC by increasing miR-30e expression. qRT-PCR results clarified that, miR-30e expression was strikingly high in EC tissues (Figure 2A). Meanwhile, the expression of miR-30e was determined in HEEC normal human esophageal epithelial cells and EC cells (Eca109 and TE-1), and the results manifested that miR-30e expression was obviously higher in Eca109 and TE-1 cells than in HEEC cells, in which the expression of miR-30e was lower in Eca109 cells than in TE-1 cells (Figure 2B). Then, Pearson’s correlation coefficient displayed a positive correlation between miR-30e expression and SOX2 expression (Figure 2C). SOX2 was overexpressed in Eca109 cells, and the expression of miR-30e was determined by qRT-PCR. As demonstrated in Figure 2D, the expression of SOX2 and miR-30e was appreciably increased in Eca109 cells overexpressing SOX2 (Figure 2D). To further investigate whether SOX2 affected the proliferative, invasive, and migratory capacities of EC cells through miR-30e, we transfected Eca109 cells with overexpression (oe)-SOX2 or in combination with miR-30e inhibitor plasmids. In Eca109 cells, compared with the treatment with oe-negative control (NC) + inhibitor-NC, the expression of SOX2 was increased prominently following treatment with oe-SOX2 + miR-30e inhibitor, but that of miR-30e did not change severely (Figure 2E). In addition, Figures 2F–2H shows that overexpression of SOX2 elevated cell proliferative, invasive, and migratory capacities, whereas further treatment with miR-30e inhibitor reversed these effects in Eca109 cells. Meanwhile, the results of western blot analysis exhibited that the oe-SOX2 treatment enhanced the expression of N-cadherin and Vimentin but diminished that of E-cadherin in Eca109 cells, which was reversed following co-treatment with oe-SOX2 and miR-30e inhibitor (Figure 2I). Additionally, we treated TE-1 cells with short hairpin RNA (shRNA)-SOX2 or in combination with miR-30e mimic, and then repeated all the above-mentioned experiments in TE-1 cells, which exhibited consistent results with those from Eca109 cells (Figure S1). The aforementioned data supported that SOX2 increased miR-30e expression and consequently promoted cell proliferative, invasive, and migratory capacities, as well as EMT in EC cells.
Figure 2.

SOX2 Promotes Proliferation, Migration, and Invasion, as well as EMT of Eca109 Cells via miR-30e Upregulation In Vitro
(A) Expression of miR-30e in EC tissues and adjacent normal tissues (n = 30) determined by qRT-PCR. (B) Expression of miR-30e in two EC cell lines (Eca109 and TE-1) and normal esophageal epithelial cells detected by qRT-PCR. (C) Pearson correlation analysis of SOX2 expression with miR-30e expression. (D) Expression of SOX2 and miR-30e in Eca109 cells transfected with oe-SOX2 detected by qRT-PCR. Eca109 cells were transfected with oe-SOX2 or in combination with miR-30e inhibitor. (E) Expression of SOX2 and miR-30e in Eca109 cells measured by qRT-PCR. (F) Proliferation of Eca109 cells detected by EdU assay (×200). (G) Quantitation of migration of Eca109 cells detected by scratch test. (H) Quantitation of invasion of Eca109 cells detected by Transwell assay. (I) Quantitative western blot analysis of EMT-related proteins (E-cadherin, N-cadherin, and Vimentin) in Eca109 cells. ∗p < 0.05, ∗∗p < 0.01, ∗∗∗p < 0.001, ∗∗∗∗p < 0.0001. Paired t test was used for comparison between data of EC tissues and adjacent normal tissues, while unpaired data between the other two groups were compared by unpaired t test. Comparisons among multiple groups were performed using one-way ANOVA. Data are shown as mean ± standard deviation of three technical replicates.
Targeted Inhibition of USP4 by miR-30e Promoted Proliferative, Invasive, and Migratory Capacities and EMT of EC Cells in Vitro
To further investigate the downstream target genes of miR-30e in EC, the downstream target genes were predicted in the Starbase database, which showed that USP4 had a targeting relationship with miR-30e (Figure 3A). Analysis on an EC-related expression dataset GSE89102 revealed 5,657 differentially expressed genes (DEGs), which consisted of 3,574 upregulated and 2,083 downregulated genes. Figure 3B is a heatmap illustrating the DEGs, among which, the expression of USP4 gene was downregulated in EC tissues, which was analyzed by the GSE89102 dataset (Figure 3C). Meanwhile, the expression of USP4 was even lower in EC than that in normal controls using the GEPIA website (Figure 3D). qRT-PCR and immunohistochemistry documented that USP4 was indeed noticeably decreased in EC tissues in contrast to that seen in adjacent normal tissues (Figures 3E and 3F). Also, it was found that USP4 was observably lowered in Eca109 and TE-1 cells than that seen in HEEC cells, with higher expression in Eca109 cells than in TE-1 cells (Figures 3G and 3H). Next, Pearson’s correlation coefficient presented that an inverse correlation was witnessed in miR-30e expression and USP4 expression (Figure 3I). Furthermore, dual luciferase reporter assay manifested that the luciferase activity of USP4-wild-type (WT) was diminished in 293T cells following transfection with miR-30e mimic while that of USP4-MUT was not affected (Figure 3J), which indicated that miR-30e specifically bound to the 3′ UTR of USP4 gene. Next, the expression of USP4 was silenced in Eca109 cells, and qRT-PCR alongside western blot analysis was implemented in order to detect the silencing efficiency, which exhibited that both sh-USP4-1 and sh-USP4-2 substantially decreased the expression of USP4, of which sh-USP4-1 produced a more pronounced decline (Figures 3K and 3L). Furthermore, miR-30e was overexpressed in Eca109 cells treated with sh-USP4. miR-30e mimic resulted in a decline of USP4 expression in Eca109 cells, which was neutralized by means of overexpression of both miR-30e and USP4 (Figure 3M). This result further implied that regulation on the USP4 expression was achieved by miR-30e in EC cells.
Figure 3.

miR-30e Promotes Cell Proliferation, Migration, Invasion, and EMT in Eca109 Cells by Targeting USP4 In Vitro
(A) Putative miR-30e binding sites in the 3′ UTR of USP4 mRNA in the Starbase database. (B) A heatmap of DEGs in the EC gene expression profiling GSE89102, in which each row represents a DEG, and each column represents a sample. (C) Expression of USP4 analyzed in the EC gene expression profiling GSE89102. (D) Expression of USP4 in EC analyzed by the GEPIA website, where red represents cancer tissues and black represents normal control tissues. (E) mRNA expression of USP4 examined by qRT-PCR in EC tissues and adjacent normal tissues (n = 30). (F) Quantitation of USP4 protein in EC tissues and adjacent normal tissues by immunohistochemistry analysis. (G) Expression of USP4 examined by qRT-PCR in Eca109, TE-1, and HEEC cells. (H) Quantitative western blot analysis of USP4 protein in Eca109, TE-1, and HEEC cells. (I) Pearson correlation analysis of USP4 expression with miR-30e expression. (J) miR-30e binding to USP4 confirmed by dual luciferase reporter assay in 293T cells. (K) Silencing efficiency of USP4 expression in Eca109 cells measured by qRT-PCR. (L) Silencing efficiency of USP4 expression in Eca109 cells measured by quantitative western blot analysis. Eca109 cells were transfected with mimic-NC + vector, miR-30e mimic + vector, and miR-30e mimic + USP4. (M) Expression of USP4 and miR-30e determined by qRT-PCR in Eca109 cells. (N) Quantitation of EdU-positive Eca109 cells. (O) Quantitation of migration of Eca109 cells detected by scratch test. (P) Quantitation of invasion of Eca109 cells detected by Transwell assay. (Q) Quantitative western blot analysis of EMT-related proteins (E-cadherin, N-cadherin, and Vimentin) in Eca109 cells. ∗p < 0.05, ∗∗p < 0.01, ∗∗∗p < 0.001, ∗∗∗∗p < 0.0001. Paired t test was used for comparison between data of EC tissues and adjacent normal tissues, while unpaired data between the other two groups were compared by unpaired t test. Comparisons among multiple groups were performed using one-way ANOVA. Data are shown as mean ± standard deviation of three technical replicates.
The findings from assays of EdU, scratch test, and Transwell revealed that Eca109 cell proliferative, invasive, and migratory capacities were enhanced following miR-30e mimic treatment, which was abrogated by further USP4 overexpression (Figures 3N–3P). Additionally, western blot analysis revealed that miR-30e mimic treatment increased the expression of N-cadherin and Vimentin while decreasing that of E-cadherin in Eca109 cells, which was reversed by concomitant overexpression of miR-30e and USP4 (Figure 3Q). Additionally, we treated TE-1 cells with miR-30e inhibitor or in combination with sh-USP4, and then repeated all the above-mentioned experiments in TE-1 cells, which exhibited consistent results with those from Eca109 cells (Figure S2). The above results suggested that miR-30e promoted cell proliferative, invasive, and migratory capacities, and EMT by targeting USP4 in EC cells.
USP4 Promoted Deubiquitination of SMAD4 to Increase its Translocation into Nuclei in EC Cells
To further investigate the regulatory mechanism of USP4 in EC, we found that USP4 deubiquitinated SMAD4 from a previously published study.19 Thus, we subsequently explored whether USP4-regulated deubiquitination of SMAD4 to be involved in EC. According to the results of qRT-PCR and immunohistochemistry, SMAD4 expression was significantly lower in clinical samples of EC than in adjacent normal tissues (Figures 4A and 4B). Furthermore, a positive correlation was witnessed between USP4 expression and SMAD4 expression (Figure 4C). We performed immunofluorescence co-localization detection of USP4 and SMAD4 in TE-1 cells and found that both USP4 and SMAD4 existed in the cytoplasm, with an obvious co-localization phenomenon (Figure 4D). GST pull-down in vitro exhibited that USP4 interacted with SMAD4 (Figure 4E). In the presence of hemagglutinin-ubiquitin (HA-Ub), the ubiquitination of SMAD4 was examined using mutated USP4 (CS; K48- and K63-site mutations that only form lys48 and lys63 polyubiquitin, respectively) and USP4-WT after interaction with SMAD4. After immunoprecipitation of SMAD4, we found that USP4-WT was able to remove the monomeric ubiquitination of SMAD4, but mutant (CS) USP4 did not remove the ubiquitination of SMAD4 (Figure 4F). Then we purified two different forms of SMAD4 in 293T cells treated with different concentrations of USP4, namely ubiquitination-modified (SMAD4-1 × Ub) and free SMAD4, and found that with the increase of USP4 treatment concentration, ubiquitination-modified SMAD4 (SMAD4-1 × Ub) was gradually decreased while free SMAD4 was gradually increased (Figure 4G). Besides, SMAD4 was found to be deubiquitinated when being co-incubated with USP4, and free SMAD4 also increased significantly with increase of incubation time (Figure 4H). This process was very rapid, with 50% of ubiquitinated SMAD4 deubiquitinated within 20 min after USP4 addition (Figure 4I). These results demonstrated that ubiquitinated SMAD4 was a substrate of USP4.
Figure 4.

USP4 Overexpression Increases the Deubiquitination and Translocation of SMAD4 into Nuclei in Cells
(A) SMAD4 mRNA expression in EC tissues and adjacent normal tissues detected by qRT-PCR (n = 30). (B) Quantitation of SMAD4 protein in EC tissues and adjacent normal tissues by immunohistochemical analysis (n = 30). (C) Pearson correlation analysis of USP4 expression with SMAD4 expression. (D) Immunofluorescence detection of SMAD4 and USP4 localization in TE-1 cells (×400). (E) GST pull-down detection of SMAD4 and USP4 interaction. (F) coIP detection of the effect of USP4 on SMAD4 ubiquitination. (G) Immunoblotting detection of ubiquitination of SMAD4 after 30-min co-incubation of different concentrations of USP4 with purified Flag-SMAD4. (H) Western blot analysis of the effect of the optimal concentration (20 nm) of recombinant USP4 on the deubiquitination of SMAD4. (I) The effect of the optimal concentration (20 nm) of recombinant USP4 on the deubiquitination of SMAD4. (J) Immunoblotting analysis of whole-cell lysate and immunoprecipitate of HEK293T cells with stable expression of HA-Ub after transfection of Flag SMAD4 or Flag-SMAD4 K519R. (K) Ubiquitination status of SMAD4 after incubation of 508-529 covalent ubiquitin peptide with 100 nM USP4 on K519 for different times. (L) SMAD4 ubiquitination status was observed by immunoblotting after affinity purification of the tagged SMAD4 protein in TE-1 cells. (M) Western blot analysis of ubiquitination of SMAD4 in cells stably expressing HA-Ub after transfection with Myc-USP4-WT or Myc-USP4-CS, respectively. (N) Western blot analysis of the effect of USP4 inhibition on the ubiquitination of SMAD4 in cells stably expressing HA-Ub. (O) Immunofluorescence detection of SMAD4 expression in cytoplasm and nucleus (×400). (P) Western blot analysis of SMAD4 protein in cytoplasm and nucleus of TE-1 cells. ∗p < 0.05, ∗∗p < 0.01, ∗∗∗p < 0.001, ∗∗∗∗p < 0.0001. Paired t test was used for comparison between data of EC tissues and adjacent normal tissues, while unpaired data between the other two groups were compared by unpaired t test. Comparisons among multiple groups were performed using one-way ANOVA. Data are shown as mean ± standard deviation of three technical replicates.
The conversion of lysine 519 to arginine specifically abolished the ubiquitination of SMAD4 (Figure 4J). After incubation with USP4, ubiquitinated SMAD4 peptide level reduced while free SMAD4 peptide level enhanced (Figure 4K). These data indicated that the ubiquitin molecule linked to SMAD4 covalently was cleaved by USP4, and that lysine at position 519 was the site specifically targeted by USP4.
In order to verify that USP4 deubiquitination modified SMAD4 in vivo, the labeled SMAD4 protein was affinity purified in TE-1 cells. As reported in Figure 4L, the monomer and multi-chain ubiquitination of SMAD4 appeared, and ectopic expression of USP4-WT inhibited the ubiquitination of SMAD4, while ectopic expression of the catalytically inactive mutant USP4 (CS) failed to inhibit the ubiquitination of SMAD4. Endogenous SMAD4 was mainly modified by means of monoubiquitination, and only trace multichain ubiquitination was observed. Additionally, ectopically expressed USP4-WT not mutant USP4-CS eliminated endogenous SMAD4 mononucleotide (Figure 4M). Importantly, the suppression of endogenous USP4 could enhance the single stranding of endogenous SMAD4 (Figure 4N), suggesting that USP4 was a key regulator of intracellular SMAD4. In summary, USP4 targeted monomer ubiquitination of SMAD4 to deubiquitinate and modify SMAD4.
Further, the effect of USP4 on SMAD4 translocation into nuclei was detected by immunofluorescence assay. After USP4 was overexpressed in TE-1 cells, translocation of SMAD4 into nuclei was increased (Figure 4O). After nuclear-cytoplasmic fractionation of TE-1 cells upon different treatments, western blot detection on the expression of SMAD4 in cytoplasm and nucleus presented consistent trend with that of immunofluorescence assay (Figure 4P). The above experimental results showed that USP4 promoted the deubiquitination and translocation of SMAD4 into nuclei in EC cells.
SMAD4 Reduced Proliferative, Invasive, and Migratory Capacities and EMT of EC Cells by Transcriptionally Inhibiting CK2 Expression in Vitro
The above experiments demonstrated that SMAD4 deubiquitination promoted its translocation into nuclei, and previous evidence has suggested that SMAD4 inhibited the expression of CK2 as a transcription factor in the nucleus.21 The qRT-PCR and immunohistochemistry results presented that CK2 expression was significantly increased in EC tissues in comparison to that seen in adjacent normal tissues (Figures 5A and 5B). A negative correlation was noted in CK2 expression and SMAD4 expression was (Figure 5C). In addition, silencing SMAD4 elevated the expression of CK2 in Eca109 cells, among which sh-SMAD4-2 had a better effect, and thus was chosen for subsequent experiments (Figures 5D and 5E). Chromatin immunoprecipitation (ChIP) results showed that the enrichment of SMAD4 was decreased in the promoter region of CK2 when SMAD4 was silenced in Eca109 cells (Figure 5F).
Figure 5.

SMAD4 Decreased CK2 Expression to Suppress Proliferation, Migration, Invasion, and EMT of Eca109 Cells In Vitro
(A) CK2 mRNA expression in EC tissues and adjacent normal tissues detected by qRT-PCR (n = 30). (B) Quantitation of CK2 protein in EC tissues and adjacent normal tissues by immunohistochemical analysis (n = 30). (C) Pearson correlation analysis of CK2 expression with SMAD4 expression. (D) mRNA expression of SMAD4 and CK2 in Eca109 cells treated with sh-SMAD4-1 or sh-SMAD4-2 detected by qRT-PCR. (E) Quantitative western blot analysis of SMAD4 and CK2 proteins in Eca109 cells treated with sh-SMAD4-1 or sh-SMAD4-2. (F) Enrichment of SMAD4 in CK2 promoter region determined by ChIP assay in sh-SMAD4-treated Eca109 cells. Eca109 cells were transfected with sh-NC, sh-SMAD4, and sh-SMAD4 + sh-CK2. (G) Expression of SMAD4 and CK2 in Eca109 cells measured by qRT-PCR. (H) Proliferation of Eca109 cells detected by EdU assay (×200). (I) Quantitation of migration of Eca109 cells detected by scratch test. (J) Quantitation of invasion of Eca109 cells detected by Transwell assay. (K) Quantitative western blot analysis of EMT-related proteins (E-cadherin, N-cadherin, and Vimentin) in Eca109 cells. ∗p < 0.05, ∗∗p < 0.01, ∗∗∗p < 0.001, ∗∗∗∗p < 0.0001. Paired t test was used for comparison between data of EC tissues and adjacent normal tissues, while unpaired data between the other two groups were compared by unpaired t test. Comparisons among multiple groups were performed using one-way ANOVA. Data are shown as mean ± standard deviation of three technical replicates.
Eca109 cells were treated with sh-SMAD4 or in combination with sh-CK2. qRT-PCR results exhibited that the expression of CK2 was enhanced in sh-SMAD4-treated Eca109 cells, but simultaneous silencing of CK2 and SMAD4 reduced the expression of CK2 in Eca109 cells (Figure 5G). As demonstrated in Figures 5H–5J, sh-SMAD4 treatment triggered an elevation of Eca109 cell proliferative, invasive, and migratory capacities, which was reversed by additional silencing of CK2. As documented in Figure 5K, expression of N-cadherin and Vimentin was significantly enhanced, while that of E-cadherin was significantly reduced in sh-SMAD4-treated Eca109 cells, which was negated following simultaneous silencing of SMAD4 and CK2. Additionally, we treated TE-1 cells with oe-SMAD4 or in combination with oe-CK2, and then repeated all the above-mentioned experiments in TE-1 cells, which exhibited consistent results with those from Eca109 cells (Figure S3). These results demonstrated that SMAD4 reduced CK2 expression in EC cells, thus repressing proliferative, invasive, and migratory capacities and EMT.
SOX2 Increased Tumor Growth of EC in Nude Mice by Mediating the USP4/SMAD4/CK2 Axis via miR-30e
To verify the above results in vivo, we subcutaneously injected TE-1 cells transfected with different lentiviral plasmids into nude mice. The tumor growth of mice was significantly enhanced following SOX2 overexpression, while that was significantly lowered in response to CK2 silencing, which was negated following the treatment with lv-oe-SOX2 + sh-CK2 (Figures 6A and 6B).
Figure 6.

SOX2 Modulates the USP4/SMAD4/CK2 Axis via miR-30e Upregulation to Induce the Tumor Growth of EC in Nude Mice
Mice were treated with lv-oe-NC + sh-NC, lv-oe-NC + sh-CK2, lv-oe-SOX2 + sh-NC, or lv-oe-SOX2 + sh-CK2. (A) Quantitation of tumor volume of mice (n = 12). (B) Quantitation of tumor weight of mice (n = 12). (C) Expression of SOX2, miR-30e, USP4, SMAD4, and CK2 in mouse tumor tissues determined by qRT-PCR (n = 12). (D) Quantitative western blot analysis of SOX2, USP4, SMAD4, and CK2 proteins in mouse tumor tissues (n = 12). (E) Quantitation of Ki67 expression in mouse tumor tissues detected by immunohistochemistry. (F) Quantitation of lung metastatic nodules after H&E staining in mice (n = 12). ∗p < 0.05, ∗∗p < 0.01, ∗∗∗p < 0.001, ∗∗∗∗p < 0.0001. All measurement data were shown as mean ± standard deviation. Unpaired data between the two groups were compared by unpaired t test. Comparisons among multiple groups were performed using one-way ANOVA. Comparisons of tumor volume data between groups at different time points were conducted using repeated-measures ANOVA.
After overexpression of SOX2, the expression of miR-30e and CK2 was increased and that of USP4 and SMAD4 was decreased. Moreover, after simultaneous silencing of CK2 and overexpression of SOX2, the expression of SOX2, miR-30e, USP4, and SMAD4 did not change prominently, while that of CK2 was decreased severely (Figures 6C and 6D). From immunohistochemistry results, SOX2 overexpression enhanced but CK2 silencing diminished Ki67 positive cells in mouse tumor tissues, which was abolished by simultaneous silencing of CK2 and overexpression of SOX2 (Figure 6E). According to hematoxylin and eosin (H&E) staining, lung metastasis was elevated by overexpressing SOX2 but was reduced by silencing CK2 in mouse tumor tissues, which was rescued by simultaneous silencing of CK2 and overexpression of SOX2 (Figure 6F). In summary, SOX2 facilitated tumor growth by regulating the USP4/SMAD4/CK2 axis via miR-30e upregulation in nude mice.
Discussion
Despite improvement in diagnosis and treatment strategies, the prognosis of EC is still noted to be poor, with a total 5-year survival rate of 15%–20%.23 The critical functions of miRNAs have been documented in EC progression recently.24 The present study intended to dissect out the roles of SOX2-mediated miR-30e in biology and tumor growth of EC cells. Intriguingly, our data from tissue samples, cancer cell lines, and animal experiments elucidated that SOX2-upregulated miR-30e targeted USP4 and decreased its expression, thus reducing SMAD4 expression to activate CK2, which ultimately led to EC cell proliferative, invasive, and migratory capacities.
We first found that SOX2 was upregulated seen in both EC tissues and cells and that SOX2 overexpression elevated EC cell proliferative, invasive, and migratory capacities and EMT. SOX2 has been involved in numerous cancers, such as prostate cancer, ovarian cancer, and breast cancer.25, 26, 27 Concurred with our results, a prior study indicated SOX2 upregulation in EC samples and that SOX2 overexpression enhanced EC cell proliferation and invasion.28 Meanwhile, a study by Ishida et al.29 also revealed the high SOX2 expression in esophageal small-cell carcinoma. Moreover, Gen et al.11 have denoted that as an amplification target of 3q26.3 in ESCC, SOX2 upregulation promotes ESCC cell proliferation in vitro. Besides, another study uncovered high SOX2 expression in clinical samples from ESCC patients and that SOX2 overexpression stimulated cell invasion and metastasis in ESCC cells,30 which was identical to our findings.
Furthermore, the data obtained by Liu et al.12 found that SOX2 positively modulated miR-30e expression in breast cancer cells, which supported our results that SOX2 overexpression increased miR-30e expression in EC cells. Our study identified the upregulation of miR-30e in EC tissues and cells, which was supported by the data from a previous study.14 In addition, the current study revealed the promoting effect of miR-30e on the EC cell proliferation, invasion, and migration, which deserves further investigation due to the elusive knowledge of such effect in EC. Besides, our data reached a conclusion that USP4 was a target gene of miR-30e. miRNAs have the potency to regulate gene expression in a post-transcriptional manner by binding the 3′ UTR of their target gene mRNA, inducing the inhibition of mRNA degradation or translation.31 Likewise, USP4 has been demonstrated to be a potential target of several miRNAs and their interaction is essential in controlling tumor invasion, metastasis and survival.32,33 USP4 is known to regulate various normal and abnormal physiological functions, including pathological cardiac hypertrophy, osteoblast differentiation, and tumorigenesis.34,35 Additionally, USP4 has contradictory functions in different tumors with tissue and tumor specificity.36, 37, 38 Importantly, a prior study has elucidated that USP4 upregulation predicts a better prognosis in patients suffering from EC,17 which was partially in line with our results. However, some of the conclusions in this study are contrary to our results, so we verified the role of USP4 in EC. Our data confirmed that USP4 expression was poor in EC tissues and cells and that ectopic expression of USP4 contributed to repression of EC cell proliferation, invasion, migration, and EMT. Interestingly, research by Liang et al.32 elaborated that USP4 possessed tumor-suppressive potential in breast cancer by reducing cell proliferation, migration, and invasion, which indirectly supported our results. Meanwhile, in a mouse model of lung cancer, USP4 knockdown enhances tumorigenesis and tumor growth.39 A recent work uncovers a positive correlation between USP4 expression and SOX2 expression in lung cancer.40 However, our study revealed an adverse relationship between them, maybe due to the difference of the study subjects, laboratory environment, and the detection methods used.
In the subsequent experiments, we observed that USP4 targeted monoubiquitination of SMAD4 to promote the deubiquitination of SMAD4 and its entry into the nucleus in EC cells. Zhou et al.19 observed the similar results in mouse embryonic stem cells. Ubiquitination of SMAD4 could promote its translocation into nuclei and then affect the downstream genes.41 Furthermore, SMAD4 repression contributes to elevation of SOX2 expression in the context of lung squamous cell carcinoma.42 More importantly, the present study characterized that SMAD4 diminished CK2 expression through transcription in EC cells, which was in line with a previous study.21 Particularly, we also found that SMAD4 declined cell proliferation, invasion, migration, and EMT in EC by downregulating CK2. A prior study showed that SMAD4 downregulation could lead to promotion of metastasis and recurrence of EC.20 Another study also identified that SMAD4 suppression elevated cell migration and invasion in ovarian cancer.43 Meanwhile, a study by Yoo et al.22 unraveled that CK2 overexpression triggered the increase of EC cell invasion, which was in line with our findings. In addition, treatment with CK2 inhibitor leads to reduced expression of SOX2 in glioblastoma brain tumor initiating cells.44 Collectively, the aforementioned data supported the potential of SOX2 to aggravate EC through regulation of the miR-30e/USP4/SMAD4/CK2 signaling axis.
Taken together, the findings of our study suggested that SOX2 increased miR-30e expression, promoted the miR-30e-mediated USP4 inhibition, suppressed the deubiquitination of SMAD4, and upregulated CK2 expression, ultimately inducing EC cell migration, migration, and invasion (Figure 7). Notably, our findings on the pro-proliferative action of SOX2 provide new insights into the mechanism of this malignant disease and offer potential targets for translational applications. Meanwhile, further investigations are required to reveal the underlying mechanism by which miR-30e influences EC cells.
Figure 7.

A Schematic for the SOX2/miR-30e/USP4/SMAD4/CK2 Regulatory Network in EC
SOX2-upregulated miR-30e targets USP4 and decreases its expression, thus reducing SMAD4 expression to activate CK2, which ultimately leads to EC cell proliferation, invasion, and migration.
Materials and Methods
Ethics Statement
The Ethics Committee of The First Affiliated Hospital of Zhengzhou University provided ethical approval for the experiments involving human beings in this study, which were guided by the Declaration of Helsinki. Ethical agreements by written informed consent were obtained from the donors or their relatives. The First Affiliated Hospital of Zhengzhou University approved our animal experiments, which was conducted in accordance with the principles in the Guide for the Care and Use of Laboratory Animals published by the US National Institutes of Health. Efforts were made to avoid all unnecessary distress to the animals.
Clinical Samples
Fresh human EC and corresponding adjacent non-neoplastic esophageal samples were harvested from 30 patients (17 males and 13 females; aged 48.53 ± 12.35 years) who underwent single surgical resection at The First Affiliated Hospital of Zhengzhou University between 2012 and 2013. These patients underwent surgical resection without preoperative chemoradiotherapy. All tissue specimens were immediately stored in liquid nitrogen or stored at −80°C. In addition, 96 patients referred to The First Affiliated Hospital of Zhengzhou University in the same period were followed up from the time of discharge after operation for 60 months. The OS rate and DFS rate were statistically analyzed.
Immunohistochemistry
Tissue specimens were paraffin-embedded, sectioned, hydrated, and dehydrated by alcohol gradient, followed by 20-min immersion in 3% methanol H2O2. Following the antigen retrieval, the sections were blocked in normal goat serum blocking solution. Next, the sections underwent overnight incubation with primary rabbit anti-human antibodies (acquired from a company named Abcam, Cambridge, UK) to SOX2 (ab97959, 1:1,000), USP4 (ab236987, 1:1,000), SMAD4 (ab244370, 1:1,000), and CK2 (ab236987, 1:1,000) at 4°C, followed by additional 20-min incubation with secondary goat anti-rabbit immunoglobulin G (IgG; ab6785, 1:1,000, acquired from Abcam, Cambridge, UK) at the controlled temperature of 37°C. Then horseradish peroxidase (HRP)-labeled streptomyces ovalbumin working solution was adopted to incubate the sections, followed by color development in 3,3′-diaminobenzidine (DAB). Subsequently, the sections were counterstained in hematoxylin and reverted to blue in 1% ammonia water. The sections were observed under a microscope and photographed in five randomly selected visual fields with high power from each section, with 100 cells counted per field.
Cell Treatment
Human esophageal epithelial cell line HEEC and human esophageal cancer cell lines (Eca109, EC9706, KYSE150, and TE-1) were attained from the Cell Bank, China Center for Type Culture Collection (Wuhan, Hubei, P.R. China). EC9706 and TE-1 or Eca109 and KYSE150 were subjected to culture in DMEM or RPMI 1640 medium (GIBCO by Life Technologies, Grand Island, NY, USA) encompassing 10% FBS and 10% penicillin-streptomycin at the controlled temperature of 37°C with 5% CO2. After being trypsinized, the cells were subjected to passage at a ratio of 1:3. Upon reaching 70%–80% confluence, cells were subjected to culture in a plate with 6 wells at a density of 3 × 10⁵ cells/well.
Eca109 and TE-1 cells that had grown to the logarithmic growth phase were subjected to seeding into a plate with 6 wells (4 × 10⁵ cells/well). In accordance with the manuals of Lipofectamin 2000 reagents (11668-019, Invitrogen, NY, CA, USA), 70%–80% confluent Eca109 cells were transfected with oe-NC, inhibitor-NC, oe-SOX2, miR-30e inhibitor, mimic-NC, vector, miR-30e mimic, USP4, sh-NC, sh-SMAD4-1, sh-SMAD4-2, sh-SMAD4, and sh-CK2 alone or in combination, whereas 70%–80% confluent TE-1 cells were transfected with sh-NC, sh-SOX2-1, sh-SOX2-2, miR-30e mimic, inhibitor-NC, miR-30e inhibitor, sh-USP4, oe-SMAD4, and oe-CK2 alone or in combination. Transfection sequences and plasmids (shRNA plasmid, pIEx-4-BmU6M; overexpression plasmid, pcDNA3.1[+]) were acquired from a company named Shanghai GenePharma (Shanghai, P.R. China). The sequences are listed in Table 1. After a culture of 48 h, the medium was renewed and the cells were further cultured for duration of 24–48 h before the subsequent experiments were performed.
Table 1.
Sequences for Cell Transfection
| Primer | Sequence |
|---|---|
| miR-30e mimic | 5′-UGUAAACAUCCUUGACUGGAAG-3′ |
| miR-30e inhibitor | 5′-CUUCCAGTCAAGGATGUUUACA-3′ |
| mimic-NC | 5′-UUUGUACUACACAAAAGUACUG-3′ |
| inhibitor-NC | 5′-CAGUACUUUUGUGUAGUACAAA-3′ |
| sh-SMAD4-1 | 5′-CGAGTTGTATCACCTGGAATT-3′ |
| sh-SMAD4-2 | 5′-GTACTTCATACCATGCCGATT-3′ |
| sh-SMAD4-3 | 5′-GCAGACAGAAACTGGATTAAA-3′ |
| sh-USP4-1 | 5′-CCGGCCCAACTGTAAGAAGCAT-3′ |
| sh-USP4-2 | 5′-CGGGCCCAGAATGTGCTAAGG-3′ |
| sh-USP4-3 | 5′-GGCGTGGAATAAACTACTAC-3′ |
| sh-CK2-1 | 5′-TCAAGATGACTACCAGCTGTT-3′ |
| sh-CK2-2 | 5′-CACGTTCAATTCCTGGTT-3′ |
| sh-CK2-3 | 5′-GCGCCAGAAGGTGGCGGTGAAG-3′ |
| sh-NC | 5′-AATTCTCCGAACGTGTCACGT-3′ |
A lentiviral packaging system was subjected to construction by LV5-GFP (lentiviral gene overexpression vector green fluorescent protein) along with pSIH1-H1-copGFP (lentiviral gene silencing vector). The packaged virus was co-transfected into 293T cells, and the supernatant was collected after a period of 48 h of cell culture. The supernatant after centrifugation and filtration contained virus particles. After detection of viral titers, viruses in the growth index phase were collected and transduced into cells: lentiviral vector (lv)-oe-NC + sh-NC, lv-oe-SOX2 + sh-NC, lv-oe-NC + sh-CK2, and lv-oe-SOX2 + sh-CK2. When the cells were in logarithmic phase, they were trypsinized and titrated to 5 × 10⁴ cells/mL cell suspension which was then seeded into the plate with 6 wells (2 mL per well), followed by overnight culture at the controlled temperature of 37°C. The efficiency of GFP expression was observed by means of a fluorescence microscope 48 h after infection, whereas the detection on the expression of related genes in cells was implemented by means of qRT-PCR.
qRT-PCR
TRIzol reagents (16096020, Thermo Fisher Scientific, Waltham, MA, USA) were adopted for total RNA extraction from tissues. For mRNA, the reverse transcription was implemented by means of a First Strand cDNA Synthesis Kit (RR047A, Takara, Tokyo, Japan) to obtain complementary DNA (cDNA). For miR, the reverse transcription was implemented with a poly(A) tailing assay kit (B532451, Shanghai Sangon Biotechnology, Shanghai, P.R. China; containing universal PCR primer R and U6 universal PCR primer R) to obtain poly(A) tail-containing cDNA of miR. Samples were added using SYBR Premix Ex Taq II (Perfect Real Time) kit (DRR081, Takara), and qRT-PCR was operated on an ABI 7500 instrument (Applied Biosystems, Foster City, CA, USA) based on the instructions of TaqMan Gene Expression Assays protocol. With U6 and GAPDH working as endogenous controls, the relative expression of each target gene was calculated by 2–ΔΔCt. The primer sequences are depicted in Table 2.
Table 2.
Primer Sequences for qRT-PCR
| Gene | Forward Sequence (5′-3′) | Reverse Sequence (5′-3′) |
|---|---|---|
| SOX2 | 5′-GGGCTCTGTGGTCAAGTC-3′ | 5′-TAGTCGGCATCACGGTTT-3′ |
| miR-30e | 5′-TGTAAACATCCTTGACTGGAAGG-3′ | 5′-CCAGTGCGAATACCTCGGAC-3′ |
| USP4 | 5′-AAGGAAGCCTGGGAGAAT-3′ | 5′-GCAGTGGCAGCGTTAGAT-3′ |
| SMAD4 | 5′-AGTCCCTGGATCACCGACAG-3′ | 5′-GTTTCTTGCCTCTTGGTTGCT-3′ |
| CK2 | 5′-TGTCCGAGTTGCTTCCCGATACTT-3′ | 5′-TTGCCAGCATACAACCCAAACTCC-3′ |
| U6 | 5′-GGTCGGGCAGGAAAGAGGGC-3′ | 5′-GCTAATCTTCTCTGTATCGTTCC-3′ |
| GAPDH | 5′-TGGTGGGTATGGGTCAGAAGGACTC-3′ | 5′-CATGGCTGGGGTGTTGAAGGTCTCA-3′ |
Western Blot Analysis
Total protein was extracted from cells by means of radio-immunoprecipitation assay (RIPA) lysis buffer (Beyotime Biotechnology, Shanghai, P.R. China). Then the concentration of the extracted protein was determined using a bicinchoninic acid kit (20201ES76, Yeasen Company, Shanghai, P.R. China). Next, after quantification based on different concentrations, the protein was separated by means of polyacrylamide gel electrophoresis (PAGE), and then electroblotted onto a polyvinylidene fluoride membrane (IPVH85R, Millipore, Darmstadt, Germany) by means of the wet-transfer method. Following 1-h sealing in 5% BSA at the ambient temperature, the membrane was left to be probed overnight at the controlled temperature of 4°C with primary rabbit anti-human antibodies to SOX2 (ab97959, 1:100), USP4 (ab236987, 1:5,000), SMAD4 (ab244370, 1:5,000), CK2 (MAB7957, 1:25, R&D Systems, Minneapolis, MN, USA), E-cadherin (ab15148, 1:500), β-catenin (ab2365, 1:500), N-cadherin (ab207608, 1:1,000), Vimentin (ab137321, 1:2,000), H3 (ab1791, 1:1,000), and GAPDH (ab9785, 1:2,500). The aforementioned antibodies were attained from a company named Abcam, Cambridge, UK, except CK2. Thereafter, the membrane was re-probed with HRP-labeled secondary goat anti-rabbit IgG (ab205718, 1:20,000, attained from Abcam, Cambridge, UK) for duration of 1 h at the ambient temperature. After development, the ImageJ 1.48u software (National Institutes of Health, Bethesda, MD, USA) was employed for the purpose of protein quantitative analysis. The relative protein content was expressed as the ratio of the gray value of the corresponding protein band to that of the GAPDH protein band (endogenous control).
EdU Assay
After Eca109 and TE-1 cells were subjected to culture in a plate with 96 wells (5 × 10³ cells/well) for duration of 6 h, they were labeled with EdU. Following 2-h incubation with the use of 100 μL EdU medium, the cells in each well were stained with 100 μL of 1 × Apollo staining solution in dark for 30 min. After this, cells were incubated with 100 μL of 1 × Hoechst 33342 solution in the dark at the ambient temperature. Subsequent to staining, 100 μL portion of anti-fluorescence quenching tablet was added into each well. The cells were observed under a fluorescence microscope, whereupon EdU-labeled cells were recorded. The positive labeled cells were those whose nuclei were stained in red, and the counting of the positive and negative cells in any three visual fields was implemented under a microscope. EdU labeling rate (%) = positive cells/(positive cells + negative cells) × 100%.
Scratch Test
Cells were subjected to seeding in a plate with 6 wells at a density of 2.5 × 10⁴ cells/cm2. After duration of 24 h of culture, the medium was removed, and scratches were made using 10 μL sterilized disposable pipettes. Further culture was conducted with DMEM containing 5% FBS. Cells of each well that were cultured at duration of 0 h and 24 h after wounding were observed under an inverted microscope. ImageJ software was employed for measuring the width of each scratch whereupon the cell migratory capacity was evaluated by means of comparing the scratch width of each group. Migration distance = scratch width observed at 0 h – scratch width observed at 24 h.
Transwell Assay
In vitro cell invasion detection was performed in a plate with 24 wells with the use of Transwell chambers (8-mm wells; Corning, Corning, NY, USA). In the polycarbonate membrane Transwell chamber containing Matrigel, 600 mL culture solution containing 20% FBS was dropped into the lower chamber in advance. After duration of 48 h of transfection, Eca109 and TE-1 cells were subjected to resuspension in FBS-free medium, and 1 × 10⁶ mL cells were seeded into the upper chamber, followed by 24-h culture at the controlled temperature of 37°C with the atmosphere of 5% CO2. The Transwell chambers were subjected to fixation with 5% glutaraldehyde and stained with 0.1% crystal violet. After the wiping of surface cells by means of cotton balls, the remaining cells were observed under an inverted fluorescence microscope in 5 randomly selected fields of view, with the mean value considered as the cells crossing the chamber.
Microarray-Based Gene-Expression Profiling
EC-related gene expression profiling GSE89102 was retrieved from the GEO database available at https://www.ncbi.nlm.nih.gov/gds, and subsequent differential analysis was performed using the “limma” software package in R language. There were 10 samples on the gene expression profiling, including 5 normal samples and 5 EC samples. DEGs on the gene expression profiling were then screened with |logFC| >1 and p <0.05 set as thresholds.
Dual Luciferase Reporter Assay
Dual-luciferase reporter vectors of USP4 3′ UTR and mutant plasmids with mutations in the binding site of miR-30e were constructed, namely PmirGLO-USP4-WT and PmirGLO-USP4-MUT. USP4-3′ UTR-WT and USP4-3′ UTR-MUT were cloned using Sac I and Not I restriction enzyme cleavage sites in pmirGLO. The reporter plasmids were respectively co-transfected with miR-30e mimic plasmid and NC-mimic plasmid into 293T cells, respectively. After duration of 24 h, the cells were lysed whereupon the luciferase activity was detected by means of a Dual-Luciferase Reporter Assay System. The ratio of firefly luciferase activity to Renilla luciferase activity worked as the relative luciferase activity.
ChIP Assay
TE-1 cells and Eca109 cells in the logarithmic growth phase were subjected to culture with 1% formaldehyde for 10-min cross-linking, which was next terminated with 125 mM glycine. After supplementation with protease inhibitor mixture, the cells were subjected to centrifugation at 5,000 rpm for duration of 5 min, resuspension in nuclear separation buffer, lysing in ice-water bath for 10 min, and sonication so as to attain 200–1,000 bp chromatin fragments. The 100 μL supernatant (DNA fragments) was added with 900 μL portion of ChIP Dilution Buffer and 20 μL of 50 × PIC and with 60 μL portion of Protein A Agarose/Salmon Sperm DNA. Meanwhile, 20 μL portion of supernatant was used as Input. In the experimental groups, the supernatant was added with 1 μL rabbit anti-SMAD4 antibody (ab244370, Abcam, Cambridge, UK), whereas 1 μL rabbit anti-IgG antibody (ab172730, Abcam, Cambridge, UK) was supplemented into the supernatant in the NC group. Each tube was supplemented with 60 μL Protein A Agarose/Salmon Sperm DNA. The cells were subjected to centrifugation at 700 rpm for duration of 1 min. The precipitates were washed and eluted using 250 mL portion of ChIP wash buffer, and de-crosslinked with the use of 20 mL portion of 5 M NaCl. DNA was recovered after de-crosslinking. Quantification on the CK2 promoter sequence occurring in the complex was implemented by qRT-PCR.
Coimmunoprecipitation (CoIP) Assay
Cells that had been transfected were lysed in lysis buffer containing 50 mM portion of Tris-HCl (pH = 7.4), 150 mM portion of NaCl, 10% portion of glycerol, 1 mM portion of EDTA, and 0.5% portion of NP-40 and protease inhibitor, whereupon cell debris was cleared by means of centrifugation. Cleared cell lysates were incubated with 1 lysed anti-HA or anti-FLAG antibody (Sigma, St. Louis MO, USA) and 15Si protein A/G beads for duration of 2 h. After extensive washing, beads were boiled at 100°C for duration of 5 min. Proteins were next separated by means of SDS-PAGE and electroblotted onto a nitrocellulose membrane (Millipore, Temecula, CA, USA), followed by immunoblotting.
Immunofluorescence Assay
When the cell confluence was 50%, the cells were fixed in 4% paraformaldehyde, and permeated with 2% Triton X-100. After blocking with 2% BSA, antibodies (Abcam, Cambridge, UK) to SMAD4 (ab244370, 1:100) and USP4 (ab236987, 1:100) were added into the slide for overnight incubation at the controlled temperature of 4°C, followed by 2-h incubation with fluorescent-labeled secondary antibody goat anti-rabbit IgG H&L (ab150080, 1:400, Abcam, Cambridge, UK). The slide was stained with 2 μg/mL portion of 4′,6-diamidino-2-phenylindole (DAPI) and mounted. Thereafter, detection on expression of LC3II was implemented under a fluorescence microscope, and the ImageJ software served to quantify fluorescence intensity.
Glutathione-S-Transferase (GST) Pull-Down Assay
GST-USP4 fusion protein was expressed and then purified from E. coli in SMAD4 and USP4 GST pull-down experiments. The purified fusion protein was immobilized on glutathione Sepharose 4B microspheres and incubated with cell lysis for duration of 2 h at a temperature of 4°C. The detected antibodies were determined by means of western blot analysis.
Ubiquitination Experiment
Cells underwent lysing in RIPA buffer (which was composed of 20 mM portion of NAP [pH 7.4], 150 mM NaCl, 1% Triton, 1% SDS, and 0.5% sodium-deoxycholate) supplemented with protease inhibitors and 10 mM portion of NEM. The lysate was sonicated, heated, diluted in RIPA buffer with 0.1% SDS, and centrifuged at a temperature of 4°C (16,103 × g, 15 min). The supernatant underwent incubation with the specific antibody and A-Sepharose protein at a temperature of 4°C for 3 h. After washing, the binding proteins were eluted in 2× SDS buffer, separated by means of SDS-PAGE, and analyzed by means of immunoblotting.
Protein Purification
GST-USP4-WT and mutant expression were cloned into pGEX-4T1 vector. GST-USP4 plasmids underwent transforming into E. coli strain BL21, respectively. The protein expression was induced by 24-h treatment with 0.1 mM portion of Isopropyl-beta-d-1-thiolgalactopyranoside (IPTG) at 16°C. The protein was resuspended with PBS containing 0.5% portion of Triton X-100 and 1 mM portion of PMSF after harvesting, followed by ultrasound treatment. The recombinant GST-tagged protein was purified by means of glutathione Sepharose 4B beads. To purify USP4 protein, we removed the biotin label of GST. In order to purify SMAD4 from mammalian cells, Flag-SMAD4 expression plasmid was transfected into HEK293T cells. SMAD4 protein was immunoprecipitated from cell lysis by means of a-Flag-M2 resin overnight, and then eluted with Flag peptide.
Nuclear-Cytoplasmic Fractionation
Cells were subjected to suspension with Hypotonic buffer A (10 mM portion of HEPES; pH 7.5, 0.5 mM portion of DTT, 10 mM portion of KCl, 1.5 mM portion of MgCl2) that consisted of protease inhibitors and RNase inhibitors. Cells were subjected to incubation on ice for duration of 10 min, and centrifuged at 1,000 × g 4°C for duration of 10 min. The supernatant underwent further centrifugation at 15,000 × g for duration of 15 min to obtain the cytoplasmic fraction. The precipitate underwent 2 rinses in hypotonic buffer, and suspension in hypotonic buffer B. Whereupon, incubation at 4°C for duration of 30 min, gentle rotation, and centrifugation at 6,000 × g and 4°C for duration of 10 min were implemented. The precipitate was rinsed with hypotonic buffer once and suspended with RIPA buffer containing protease inhibitors and RNase inhibitors. After 30-min incubation at the controlled temperature of 4°C, the precipitate was gently rotated and centrifuged at 15,000 × g for duration of 20 min. The supernatant was the nucleus part.
Xenograft Animal Model
BALB/c male nude mice (5–6 weeks old) from the Animal Center of the Chinese Academy of Sciences were randomly arranged into 4 groups with 12 mice in each group. TE-1 cells (1 × 10⁶ cells/mouse, 100 μL) stably transfected with different plasmids were subcutaneously injected into the right side of mice and grouped into: lv-oe-NC + sh-NC, lv-oe-SOX2 + sh-NC, lv-oe-NC + sh-CK2, and lv-oe-SOX2 + sh-CK2 groups. Measurement on tumor volume and weight was implemented every 5 days, followed by volume calculation: 0.5 × length × width.2 Subsequent to 25 days, the mice were euthanized by anesthesia with 2% sodium pentobarbital (30 mg/kg). Tumors of mice were taken and weighed. The measurements were repeated three times in each group. The lung tissues of mice were fixed and paraffin embedded.
H&E Staining
Lung tissues of mice were subjected to overnight fixation in 10% neutral formaldehyde solution, paraffin-embedded, and sectioned. The sections were then subjected to dewaxing in xylene, hydration in gradient alcohol, and staining with H&E solution, followed by routine dehydration, clearing, and sealing with resin. Lung tissue histomorphological changes were finally observed under a high-power microscope.
Statistical Analysis
All measurement data in the study were shown as a form of mean ± SD and analyzed by means of the SPSS 21.0 software, with p <0.05 considered as a level of statistical significance. In all patients, qRT-PCR and western blot analysis results conformed to normal distribution and were analyzed by means of paired t test, while unpaired data between the other two groups were compared by means of unpaired t test. Multi-group comparisons were implemented by means of one-way ANOVA, followed by Tukey’s post hoc test, whereas comparisons of tumor volume data between groups at different time points were conducted using repeated-measures ANOVA, followed by Bonferroni post hoc test. Pearson’s correlation coefficient was adopted for correlation analysis between indicators. With the median SOX2 as the boundary, the indicators were divided into high and low expression, and the prognostic impact of the disease was analyzed by the Kaplan-Meier method.
Availability of Data and Material
The datasets generated/analyzed during the current study are available.
Acknowledgments
We acknowledge and appreciate our colleagues for their valuable suggestions and technical assistance for this study. This work was supported by Youth Foundation of the National Natural Science Foundation of China(number 81702971); Key Scientific Research Projects of Colleges and Universities of Henan Province(number 18A320054); Science and Technology Research Projects of Henan Province(number 182102310116); and Youth Talent Lifting Projects of Henan Province (number 2020HYTP050).
Author Contributions
Y.Y., X.F., and Y.R. designed the study. K.W. and X.T. collated the data, F.W. and D.L. carried out data analyses and produced the initial draft of the manuscript. S.Z. and Y.F. contributed to drafting the manuscript. All authors have read and approved the final submitted manuscript.
Declaration of Interests
The authors declare no competing interests.
Footnotes
Supplemental Information can be found online at https://doi.org/10.1016/j.omtn.2020.10.027.
Contributor Information
Yuxia Fan, Email: fccfanyx@zzu.edu.cn.
Song Zhao, Email: zhaosong@zzu.edu.cn.
Supplemental Information
References
- 1.Lin E.W., Karakasheva T.A., Hicks P.D., Bass A.J., Rustgi A.K. The tumor microenvironment in esophageal cancer. Oncogene. 2016;35:5337–5349. doi: 10.1038/onc.2016.34. [DOI] [PMC free article] [PubMed] [Google Scholar]
- 2.Napier K.J., Scheerer M., Misra S. Esophageal cancer: A Review of epidemiology, pathogenesis, staging workup and treatment modalities. World J. Gastrointest. Oncol. 2014;6:112–120. doi: 10.4251/wjgo.v6.i5.112. [DOI] [PMC free article] [PubMed] [Google Scholar]
- 3.Jackie Oh S., Han S., Lee W., Lockhart A.C. Emerging immunotherapy for the treatment of esophageal cancer. Expert Opin. Investig. Drugs. 2016;25:667–677. doi: 10.1517/13543784.2016.1163336. [DOI] [PubMed] [Google Scholar]
- 4.El-Zimaity H., Di Pilato V., Novella Ringressi M., Brcic I., Rajendra S., Langer R., Dislich B., Tripathi M., Guindi M., Riddell R. Risk factors for esophageal cancer: emphasis on infectious agents. Ann. N Y Acad. Sci. 2018;1434:319–332. doi: 10.1111/nyas.13858. [DOI] [PubMed] [Google Scholar]
- 5.Xu Y., Lu S. Regulation of β-catenin-mediated esophageal cancer growth and invasion by miR-214. Am. J. Transl. Res. 2015;7:2316–2325. [PMC free article] [PubMed] [Google Scholar]
- 6.Huang X., Zhou X., Hu Q., Sun B., Deng M., Qi X., Lü M. Advances in esophageal cancer: A new perspective on pathogenesis associated with long non-coding RNAs. Cancer Lett. 2018;413:94–101. doi: 10.1016/j.canlet.2017.10.046. [DOI] [PubMed] [Google Scholar]
- 7.Metz E.P., Rizzino A. Sox2 dosage: A critical determinant in the functions of Sox2 in both normal and tumor cells. J. Cell. Physiol. 2019;234:19298–19306. doi: 10.1002/jcp.28610. [DOI] [PMC free article] [PubMed] [Google Scholar]
- 8.Hüser L., Novak D., Umansky V., Altevogt P., Utikal J. Targeting SOX2 in anticancer therapy. Expert Opin. Ther. Targets. 2018;22:983–991. doi: 10.1080/14728222.2018.1538359. [DOI] [PubMed] [Google Scholar]
- 9.Wang Z., Kang L., Zhang H., Huang Y., Fang L., Li M., Brown P.J., Arrowsmith C.H., Li J., Wong J. AKT drives SOX2 overexpression and cancer cell stemness in esophageal cancer by protecting SOX2 from UBR5-mediated degradation. Oncogene. 2019;38:5250–5264. doi: 10.1038/s41388-019-0790-x. [DOI] [PubMed] [Google Scholar]
- 10.Gen Y., Yasui K., Nishikawa T., Yoshikawa T. SOX2 promotes tumor growth of esophageal squamous cell carcinoma through the AKT/mammalian target of rapamycin complex 1 signaling pathway. Cancer Sci. 2013;104:810–816. doi: 10.1111/cas.12155. [DOI] [PMC free article] [PubMed] [Google Scholar]
- 11.Liu K., Xie F., Gao A., Zhang R., Zhang L., Xiao Z., Hu Q., Huang W., Huang Q., Lin B. SOX2 regulates multiple malignant processes of breast cancer development through the SOX2/miR-181a-5p, miR-30e-5p/TUSC3 axis. Mol. Cancer. 2017;16:62. doi: 10.1186/s12943-017-0632-9. [DOI] [PMC free article] [PubMed] [Google Scholar]
- 12.Liu M.M., Li Z., Han X.D., Shi J.H., Tu D.Y., Song W., Zhang J., Qiu X.L., Ren Y., Zhen L.L. MiR-30e inhibits tumor growth and chemoresistance via targeting IRS1 in Breast Cancer. Sci. Rep. 2017;7:15929. doi: 10.1038/s41598-017-16175-x. [DOI] [PMC free article] [PubMed] [Google Scholar]
- 13.Kwak S.Y., Kim B.Y., Ahn H.J., Yoo J.O., Kim J., Bae I.H., Han Y.H. Ionizing radiation-inducible miR-30e promotes glioma cell invasion through EGFR stabilization by directly targeting CBL-B. FEBS J. 2015;282:1512–1525. doi: 10.1111/febs.13238. [DOI] [PubMed] [Google Scholar]
- 14.Hu Y., Correa A.M., Hoque A., Guan B., Ye F., Huang J., Swisher S.G., Wu T.T., Ajani J.A., Xu X.C. Prognostic significance of differentially expressed miRNAs in esophageal cancer. Int. J. Cancer. 2011;128:132–143. doi: 10.1002/ijc.25330. [DOI] [PMC free article] [PubMed] [Google Scholar]
- 15.Ivey K.N., Srivastava D. Micrornas as developmental regulators. Cold Spring Harb. Perspect. Biol. 2015;7:a008144. doi: 10.1101/cshperspect.a008144. [DOI] [PMC free article] [PubMed] [Google Scholar]
- 16.Wang Y., Zhou L., Lu J., Jiang B., Liu C., Guo J. USP4 function and multifaceted roles in cancer: a possible and potential therapeutic target. Cancer Cell Int. 2020;20:298. doi: 10.1186/s12935-020-01391-9. [DOI] [PMC free article] [PubMed] [Google Scholar]
- 17.Yao R., Pu J., Fan R., Zhu W., Ding X., Shen X., Zhang T. Ubiquitin-specific protease 4 improves the prognosis of the patients in esophageal cancer. Cancer Biomark. 2017;20:317–323. doi: 10.3233/CBM-170308. [DOI] [PubMed] [Google Scholar]
- 18.Zhong M., Jiang Q., Jin R. USP4 expression independently predicts favorable survival in lung adenocarcinoma. IUBMB Life. 2018;70:670–677. doi: 10.1002/iub.1755. [DOI] [PubMed] [Google Scholar]
- 19.Zhou F., Xie F., Jin K., Zhang Z., Clerici M., Gao R., van Dinther M., Sixma T.K., Huang H., Zhang L., Ten Dijke P. USP4 inhibits SMAD4 monoubiquitination and promotes activin and BMP signaling. EMBO J. 2017;36:1623–1639. doi: 10.15252/embj.201695372. [DOI] [PMC free article] [PubMed] [Google Scholar]
- 20.Singhi A.D., Foxwell T.J., Nason K., Cressman K.L., McGrath K.M., Sun W., Bahary N., Zeh H.J., Levy R.M., Luketich J.D., Davison J.M. Smad4 loss in esophageal adenocarcinoma is associated with an increased propensity for disease recurrence and poor survival. Am. J. Surg. Pathol. 2015;39:487–495. doi: 10.1097/PAS.0000000000000356. [DOI] [PMC free article] [PubMed] [Google Scholar]
- 21.Ola R., Künzel S.H., Zhang F., Genet G., Chakraborty R., Pibouin-Fragner L., Martin K., Sessa W., Dubrac A., Eichmann A. Smad4 prevents flow induced arteriovenous malformations by inhibiting casein kinase 2. Circulation. 2018;138:2379–2394. doi: 10.1161/CIRCULATIONAHA.118.033842. [DOI] [PMC free article] [PubMed] [Google Scholar]
- 22.Yoo J.Y., Choi H.K., Choi K.C., Park S.Y., Ota I., Yook J.I., Lee Y.H., Kim K., Yoon H.G. Nuclear hormone receptor corepressor promotes esophageal cancer cell invasion by transcriptional repression of interferon-γ-inducible protein 10 in a casein kinase 2-dependent manner. Mol. Biol. Cell. 2012;23:2943–2954. doi: 10.1091/mbc.E11-11-0947. [DOI] [PMC free article] [PubMed] [Google Scholar]
- 23.Hesari A., Azizian M., Sheikhi A., Nesaei A., Sanaei S., Mahinparvar N., Derakhshani M., Hedayt P., Ghasemi F., Mirzaei H. Chemopreventive and therapeutic potential of curcumin in esophageal cancer: Current and future status. Int. J. Cancer. 2019;144:1215–1226. doi: 10.1002/ijc.31947. [DOI] [PubMed] [Google Scholar]
- 24.Sakai N.S., Samia-Aly E., Barbera M., Fitzgerald R.C. A review of the current understanding and clinical utility of miRNAs in esophageal cancer. Semin. Cancer Biol. 2013;23(6 Pt B):512–521. doi: 10.1016/j.semcancer.2013.08.005. [DOI] [PubMed] [Google Scholar]
- 25.Dorsett K.A., Jones R.B., Ankenbauer K.E., Hjelmeland A.B., Bellis S.L. Sox2 promotes expression of the ST6Gal-I glycosyltransferase in ovarian cancer cells. J. Ovarian Res. 2019;12:93. doi: 10.1186/s13048-019-0574-5. [DOI] [PMC free article] [PubMed] [Google Scholar]
- 26.Vaddi P.K., Stamnes M.A., Cao H., Chen S. Elimination of sox2/oct4-associated prostate cancer stem cells blocks tumor development and enhances therapeutic response. Cancers (Basel) 2019;11:1331. doi: 10.3390/cancers11091331. [DOI] [PMC free article] [PubMed] [Google Scholar]
- 27.Yin Y., Xie C.M., Li H., Tan M., Chen G., Schiff R., Xiong X., Sun Y. The FBXW2-MSX2-SOX2 axis regulates stem cell property and drug resistance of cancer cells. Proc. Natl. Acad. Sci. USA. 2019;116:20528–20538. doi: 10.1073/pnas.1905973116. [DOI] [PMC free article] [PubMed] [Google Scholar]
- 28.Wang Z., Qiao Q., Chen M., Li X., Wang Z., Liu C., Xie Z. miR-625 down-regulation promotes proliferation and invasion in esophageal cancer by targeting Sox2. FEBS Lett. 2014;588:915–921. doi: 10.1016/j.febslet.2014.01.035. [DOI] [PubMed] [Google Scholar]
- 29.Ishida H., Kasajima A., Kamei T., Miura T., Oka N., Yazdani S., Ozawa Y., Fujishima F., Sakurada A., Nakamura Y. SOX2 and Rb1 in esophageal small-cell carcinoma: their possible involvement in pathogenesis. Mod. Pathol. 2017;30:660–671. doi: 10.1038/modpathol.2016.222. [DOI] [PubMed] [Google Scholar]
- 30.Forghanifard M.M., Ardalan Khales S., Javdani-Mallak A., Rad A., Farshchian M., Abbaszadegan M.R. Stemness state regulators SALL4 and SOX2 are involved in progression and invasiveness of esophageal squamous cell carcinoma. Med. Oncol. 2014;31:922. doi: 10.1007/s12032-014-0922-7. [DOI] [PubMed] [Google Scholar]
- 31.Ali Syeda Z., Langden S.S.S., Munkhzul C., Lee M., Song S.J. Regulatory mechanism of microrna expression in cancer. Int. J. Mol. Sci. 2020;21:1723. doi: 10.3390/ijms21051723. [DOI] [PMC free article] [PubMed] [Google Scholar]
- 32.Liang Y., Song X., Li Y., Ma T., Su P., Guo R., Chen B., Zhang H., Sang Y., Liu Y. Targeting the circbmpr2/mir-553/usp4 axis as a potent therapeutic approach for breast cancer. Mol. Ther. Nucleic Acids. 2019;17:347–361. doi: 10.1016/j.omtn.2019.05.005. [DOI] [PMC free article] [PubMed] [Google Scholar]
- 33.Zhang L., Xing M., Wang X., Cao W., Wang H. MiR-148a suppresses invasion and induces apoptosis of breast cancer cells by regulating USP4 and BIM expression. Int. J. Clin. Exp. Pathol. 2017;10:8361–8368. [PMC free article] [PubMed] [Google Scholar]
- 34.Wijnhoven P., Konietzny R., Blackford A.N., Travers J., Kessler B.M., Nishi R., Jackson S.P. Usp4 auto-deubiquitylation promotes homologous recombination. Mol. Cell. 2015;60:362–373. doi: 10.1016/j.molcel.2015.09.019. [DOI] [PMC free article] [PubMed] [Google Scholar]
- 35.Xiao L., Peng X., Liu F., Tang C., Hu C., Xu X., Wang M., Luo Y., Yang S., Song P. AKT regulation of mesothelial-to-mesenchymal transition in peritoneal dialysis is modulated by Smurf2 and deubiquitinating enzyme USP4. BMC Cell Biol. 2015;16:7. doi: 10.1186/s12860-015-0055-7. [DOI] [PMC free article] [PubMed] [Google Scholar]
- 36.Xing C., Lu X.X., Guo P.D., Shen T., Zhang S., He X.S., Gan W.J., Li X.M., Wang J.R., Zhao Y.Y. Ubiquitin-specific protease 4-mediated deubiquitination and stabilization of prl-3 is required for potentiating colorectal oncogenesis. Cancer Res. 2016;76:83–95. doi: 10.1158/0008-5472.CAN-14-3595. [DOI] [PubMed] [Google Scholar]
- 37.Yun S.I., Kim H.H., Yoon J.H., Park W.S., Hahn M.J., Kim H.C., Chung C.H., Kim K.K. Ubiquitin specific protease 4 positively regulates the WNT/β-catenin signaling in colorectal cancer. Mol. Oncol. 2015;9:1834–1851. doi: 10.1016/j.molonc.2015.06.006. [DOI] [PMC free article] [PubMed] [Google Scholar]
- 38.Hwang S.J., Lee H.W., Kim H.R., Lee H., Shin C.H., Yun S.I., Lee D.H., Kim D.H., Kim K.K., Joo K.M., Kim H.H. Ubiquitin-specific protease 4 controls metastatic potential through β-catenin stabilization in brain metastatic lung adenocarcinoma. Sci. Rep. 2016;6:21596. doi: 10.1038/srep21596. [DOI] [PMC free article] [PubMed] [Google Scholar]
- 39.Lai C.Y., Yeh D.W., Lu C.H., Liu Y.L., Chuang Y.C., Ruan J.W., Kao C.Y., Huang L.R., Chuang T.H. Epigenetic silencing of ubiquitin specific protease 4 by snail1 contributes to macrophage-dependent inflammation and therapeutic resistance in lung cancer. Cancers (Basel) 2020;12:148. doi: 10.3390/cancers12010148. [DOI] [PMC free article] [PubMed] [Google Scholar]
- 40.Li F., Hu Q., He T., Xu J., Yi Y., Xie S., Ding L., Fu M., Guo R., Xiao Z.J., Niu M. The deubiquitinase usp4 stabilizes twist1 protein to promote lung cancer cell stemness. Cancers (Basel) 2020;12:1582. doi: 10.3390/cancers12061582. [DOI] [PMC free article] [PubMed] [Google Scholar]
- 41.Dupont S., Mamidi A., Cordenonsi M., Montagner M., Zacchigna L., Adorno M., Martello G., Stinchfield M.J., Soligo S., Morsut L. FAM/USP9x, a deubiquitinating enzyme essential for TGFbeta signaling, controls Smad4 monoubiquitination. Cell. 2009;136:123–135. doi: 10.1016/j.cell.2008.10.051. [DOI] [PubMed] [Google Scholar]
- 42.Wang Y., Tan X., Tang Y., Zhang C., Xu J., Zhou J., Cheng X., Hou N., Liu W., Yang G. Dysregulated tgfbr2/erk-smad4/sox2 signaling promotes lung squamous cell carcinoma formation. Cancer Res. 2019;79:4466–4479. doi: 10.1158/0008-5472.CAN-19-0161. [DOI] [PubMed] [Google Scholar]
- 43.Chu P., Liang A., Jiang A., Zong L. miR-205 regulates the proliferation and invasion of ovarian cancer cells via suppressing PTEN/SMAD4 expression. Oncol. Lett. 2018;15:7571–7578. doi: 10.3892/ol.2018.8313. [DOI] [PMC free article] [PubMed] [Google Scholar]
- 44.Rowse A.L., Gibson S.A., Meares G.P., Rajbhandari R., Nozell S.E., Dees K.J., Hjelmeland A.B., McFarland B.C., Benveniste E.N. Protein kinase CK2 is important for the function of glioblastoma brain tumor initiating cells. J. Neurooncol. 2017;132:219–229. doi: 10.1007/s11060-017-2378-z. [DOI] [PMC free article] [PubMed] [Google Scholar]
Associated Data
This section collects any data citations, data availability statements, or supplementary materials included in this article.
Supplementary Materials
Data Availability Statement
The datasets generated/analyzed during the current study are available.