Abstract
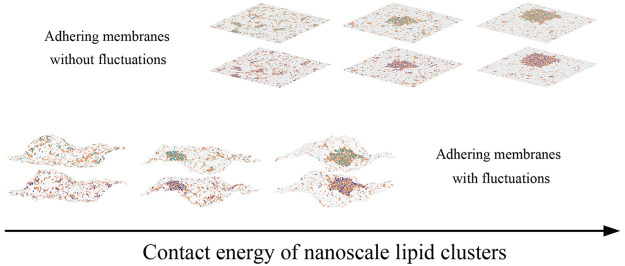
Nanoscale molecular clusters in cell membranes can serve as platforms to recruit membrane proteins for various biological functions. A central question is how these nanoclusters respond to physical contacts between cells. Using a statistical mechanics model and Monte Carlo simulations, we explore how the adhesion of cell membranes affects the stability and coalescence of clusters enriched in receptor proteins. Our results show that intercellular receptor–ligand binding and membrane shape fluctuations can lead to receptor aggregation within the adhering membranes even if large-scale clusters are thermodynamically unstable in nonadhering membranes.
Keywords: cell membrane, adhesion, receptor proteins, nanoscale lipid clusters, thermal fluctuations, Monte Carlo simulations
Biological cells need to respond to various stimuli. Receptor molecules embedded in the cell membrane detect diverse biomolecules in the cell surroundings and transmit the information to the interior of the cell. Some of the membrane receptors have been reported to associate with lipid rafts,1 which are nanoscale molecular clusters enriched in sphingolipid, cholesterol, and proteins.2 The lipid rafts can be stabilized and made to coalesce, forming platforms that function in membrane signaling.2,3 There are possibly many mechanisms that lead to the stabilization and functionality of lipid rafts, and they are the subject of a long-standing debate and intense research.1−6 A central question is how lipid rafts respond to physical contacts between cells. Here we discuss the effect of cell–cell adhesion on the stabilization and coalescence of lipid rafts.
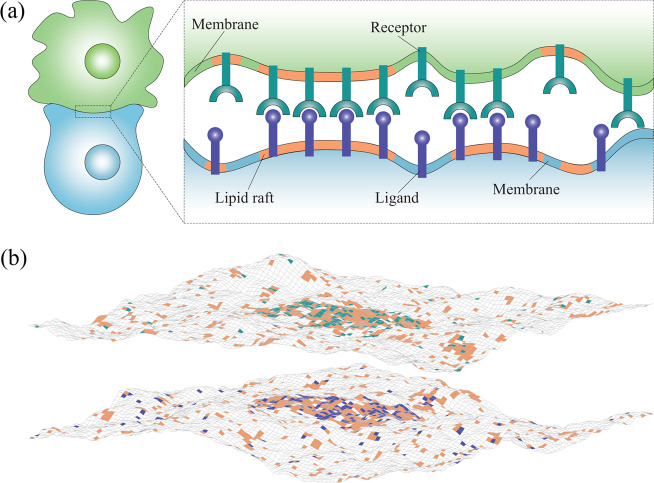
The adhesion of cell membranes is caused by the specific binding of membrane-anchored receptor proteins to their cognate ligand proteins anchored in the apposing membrane (Figure 1a). The suppression of conformational fluctuations of adhering membranes by receptor–ligand binding leads to an effective lateral attraction between the receptor–ligand complexes.7−10 This effective, fluctuation-induced attraction alone is not strong enough to induce lateral phase separation within the adhering membranes. More precisely, if the adhesion of tensionless membranes is mediated by only one type of receptor–ligand complex, then additional interactions, such as direct attraction between the adhesion molecules11 or generic repulsion between the apposing membranes,12 are necessary for the separation between a phase depleted of the receptor and ligand proteins and a phase enriched in the receptor–ligand complexes.
Figure 1.
Illustration of the system under study. (a) Cartoon of the contact zone of two adhering cells. Lipid rafts are shown in orange; membrane-anchored receptors, in green; and membrane-anchored ligands, in blue. (b) Snapshot from Monte Carlo simulations of two membranes that adhere via receptor–ligand complexes. Lipid rafts, receptors, and ligands are represented by square patches in orange, green, and blue, respectively. One adhesion protein (receptor or ligand) occupies a single membrane patch. The coupling between lipid rafts and adhesion proteins is reflected in the colocalization of blue and green patches with orange patches. A ligand binds to a receptor only if they are located at apposing membrane patches and the distance between these two patches is within the receptor–ligand binding range. Lipid rafts have a tendency to coalesce because of the hydrophobic mismatch between the rafts and the membrane matrix. Both lipid rafts and adhesion proteins diffuse within the membranes. The humps on the membranes arise from thermal fluctuations.
Here we study a system in which the receptor and ligand proteins are weakly coupled to lipid rafts (Figure 1a). This type of coupling between adhesion proteins and lipid rafts has been observed in biological experiments.13−15 We demonstrate that three factors together – (i) the weak propensity of the lipid rafts to coalesce, (ii) the weak coupling between the adhesion proteins and the lipid rafts, and (iii) the fluctuation-induced attraction between the receptor–ligand complexes – can overcome the mixing entropy and thus lead to phase separation within the adhering membranes, even in situations when the lipid rafts do not coalesce into large, stable domains within free, nonadhering membranes. We also quantify the relative impact of factors (i), (ii) and (iii) on the lateral phase separation.
Model
The adhesion of cell membranes involves multiple length scales ranging from angstroms (specific binding of the receptors to their ligands) to micrometers (lateral size of a typical cell adhesion zone). To deal with the complexity of the biological system, it is necessary to use simplified theoretical models and apply suitable approximations.10,16 We employ a modeling approach that has been widely used to study both the equilibrium properties11,17,18 and the dynamic behavior of biomembranes.19,20 It is based on representing membranes by surfaces whose elastic deformations are described by the Helfrich Hamiltonian21 and then discretizing these surfaces into “patches” of linear size a larger than the membrane thickness (Figure 1b). For two membranes that have no spontaneous curvature and that are on average parallel, the Helfrich Hamiltonian can be written in a discretized form as11,17
| 1 |
where κ = κ1κ2/(κ1 + κ2) is the effective bending rigidity modulus of the two membranes with rigidities κ1 and κ2, li is the distance between two apposing membrane patches with index i = (ix, iy), and Δdli is the discretized Laplacian of field l = {li}, which is proportional to the local mean curvature around membrane patch i. We assume that bending rigidity modului κ1 and κ2 take a typical value of 10 kBT,22−24 leading to the effective bending rigidity modulus κ = 5 kBT, where kB is the Boltzmann constant and T is room temperature.
We set a = 10 nm to match the average exclusion radius of membrane proteins.25 Then, by analogy to lattice-gas-type models, a patch in one membrane can accommodate only one receptor (R) and a patch in the other membrane can accommodate only one ligand (L). The spatial distribution of R’s is described by composition field m+ = {mi+} with mi = 0 or 1 indicating the absence or presence of R at patch i, respectively. Likewise, the spatial distribution of L’s is described by composition field m– = {mi–} with mi = 0 or 1.
To ensure the
specific binding, R binds L only if they are located
on opposite membrane patches and the distance li between these two patches is within the
R–L binding range, i.e.,  , where lc is
the extension of the R–L complex and lb is the width of the binding potential. The total energy of
R–L binding is11,17,26,27
| 2 |
where θ(···) is the Heaviside step function. We assume that lb = 1 nm and lc = 15 nm26,27 and that the energy of the R–L binding, Ub > 0, is in the range of 3 to 6 kBT.23,24
The distribution of lipid rafts in the membrane containing R’s is described by a composition field n+ = {ni+} with ni = 0 or 1. The value ni+ = 1 indicates that the membrane patch with index i is within a lipid raft. The value ni = 0 means that the membrane patch with index i does not belong to a lipid raft. Likewise, the distribution of lipid rafts in the membrane containing L’s is described by composition field n– = {ni–} with ni = 0 or 1. The total energy of coupling between adhesion proteins and lipid rafts is23
| 3 |
where Ua > 0 is a coupling energy that can be understood as follows: if R or L is moved from a lipid raft to a non-raft region of the membrane, then the energy of the system is increased by Ua. The value of Ua is chosen to be between 3 and 4 kBT so that the protein concentration within the lipid rafts is in the range reported in experimental studies.1
To take account of the hydrophobic mismatch between the lipid rafts and the membrane matrix, we introduce a contact energy U > 0 between the nearest-neighbor patches occupied by the rafts, which is analogous to the interaction energy in the two-dimensional lattice-gas model. This short-ranged attraction is the driving force for the coalescence of the lipid rafts into large domains, whereas the entropy of the lattice-gas-type system favors disordered states with many separate rafts. The total energy of the lipid rafts
| 4 |
is a sum of contributions from all pairs of nearest-neighbor patches i, j.
The model for adhering membranes is defined by Hamiltonian E(l, n±, m±) = E1(l) + E2(l, m±) + E3(n±, m±) + E4(n±). We study this mesoscopic model within the framework of classical statistical mechanics using both Monte Carlo (MC) simulations and mean-field (MF) theory, as detailed in the Supporting Information (SI).
Without a loss of generality,
we assume symmetry in the composition
of the two membranes, i.e., the area concentration of R’s is
equal to the area concentration of L’s,  , and the two membranes have the same area
fraction of the raft-type patches,
  , where N is the total
number of patches in one membrane. In our MF calculations and MC simulations,
the area concentration of adhesion proteins, cp, is varied between 0 and 0.2/a2, which corresponds to a maximal concentration of 2000/μm2,22 whereas the membrane area fraction x of raft-type patches is varied to up to 0.3.28
Results and Discussion
Consider now planar membranes (li = lc for all patches i) without the adhesion proteins (cp = 0). The membrane model introduced above then reduces to the two-dimensional lattice-gas model. The rafts coalesce into large domains if U > U*. If U < U*, then the rafts are typically small and distributed more or less uniformly in the membranes. According to the exact solution of the two-dimensional Ising model on the square lattice,29 the transition between the ordered and disordered phases occurs at U = U* as given by
| 5 |
The phase-transition line ends at the
critical point given by  and U = U0*, where
  . Within MF theory, however, U0 = kBT.
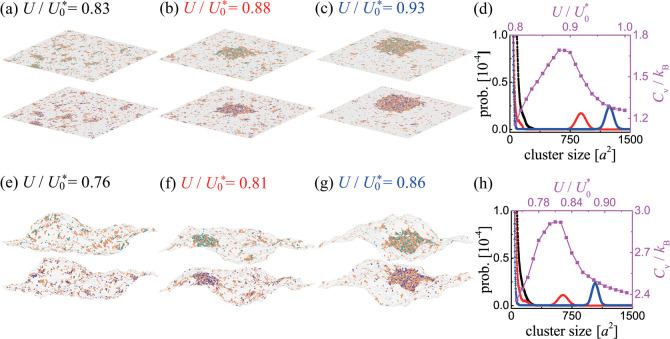
Consider now planar membranes (with li = lc for all patches i) in the presence of the adhesion proteins (cp > 0) that preferentially partition into lipid rafts (Figure 2a–d). The three snapshots from the MC simulations shown in panels a–c indicate a transition from a disordered phase with many small rafts (panel a, U/U0* = 0.83) to an ordered phase with a large raft-type domain (panel c, U/U0 = 0.93). This transition is quantified by the domain size distributions shown in black, red, and blue in Figure 2d.
Figure 2.
Snapshots from MC simulations of planar (a–c) and fluctuating (e–g) membranes. The color code is the same as in Figure 1 (i.e., lipid rafts are shown in orange; receptors, in green; and ligands, in blue). Here, cp = 0.05/a2, Ub = 6 kBT, and Ua = 3 kBT. The values of the contact energy U are indicated. (d) Size distributions of raft clusters for U/U0* = 0.83 (black), 0.88 (red), and 0.93 (blue) as well as Cv as a function of U/U0 (purple) obtained from the MC simulations of the planar membranes. (h) Size distributions of raft clusters for U/U0* = 0.76 (black), 0.81 (red), and 0.86 (blue) as well as the Cv versus U/U0 curve (purple) obtained from the MC simulations of the fluctuating membranes.
The purple line in Figure 2d shows the heat capacity per membrane patch, Cv, as a function of U/U0*. The maximum in the heat capacity indicates a phase transition, which occurs at U/U0 = 0.88 in this case. Interestingly, in the absence of the adhesion proteins, when cp = 0, the phase transition takes place at U > U0* according to eq 5. Therefore, the adhesion proteins that associate with the lipid rafts promote lateral phase separation (i.e., they cause a substantial decrease in the value of contact energy U at which the phase separation occurs). This effect results from the coalescence of the lipid rafts that is favored by the translational entropy of the R–L complexes associated with the rafts.
Consider now a system in which thermal fluctuations cause local transverse displacements of the adhering membranes (Figure 2e–h). The three snapshots from the MC simulations shown in panels e–g indicate a phase transition occurring as U is increased from U/U0* = 0.76 to U/U0 = 0.86. The qualitative differences in the domain size distributions (black, red, and blue lines in panel h) indicate the phase transition at U/U0* = 0.81. The heat capacity per membrane patch (purple line in panel h) attains its maximum value also at U/U0 = 0.81.
Taken together, Figure 2 shows that the phase transition occurs in planar membranes at U/U0* = 0.88 and in fluctuating membranes at U/U0 = 0.81. Therefore, membrane thermal fluctuations decrease the value of U at which phase separation occurs. This result implies that there can be regions in the model parameter space where the planar membrane system is in the disordered phase while the fluctuating membrane system is in the ordered phase.
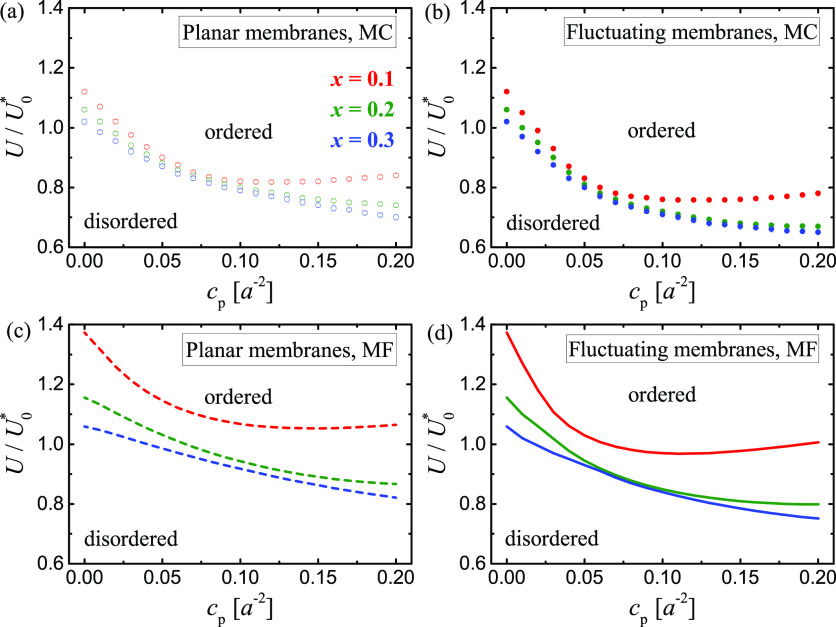
To explore the phase behavior further, we performed a series of MC simulation runs with cp ranging from 0 to 0.2/a2, U/U0* ranging from 0.6 to 1.2, and x = 0.1, 0.2, or 0.3. The values of other parameters were fixed at Ub = 6 kBT, lb = 1 nm, lc = 15 nm, and Ua = 3 kBT. We simulated membranes with sizes of up to 100 × 100 a2, with negligible finite-size effects (SI), and identified the phase transitions based on the domain size distributions and the Cv versus U plots, as illustrated in Figure 2. The resulting phase diagrams for the planar and fluctuating membrane systems are shown in Figure 3a,b, respectively. In both cases, the phase diagrams for x = 0.2 and 0.3 are rather similar. For x = 0.1, however, the phase-transition lines are nonmonotonic in the cp–U plane. Importantly, an increase in protein concentration from cp = 0 to, say, 1/(25 a2) causes the phase transition to occur at a significantly smaller contact energy U, which reflects the adhesion-induced phase separation.
Figure 3.
Phase diagrams for the planar (a and c) and fluctuating (b and d) membrane systems as obtained from the MC simulations (a and b) and the MF calculations (c and d) with Ub = 6 kBT and Ua = 3 kBT. (a and b) The circles indicate the phase-transition points determined from the Cv versus U plots as in Figure 2d,h. (c and d) The lines show the location of phase transitions predicted by MF theory.
A careful comparison of the phase diagrams in Figure 3a,b indicates that
membrane
thermal fluctuations tend to decrease the values of U at which the phase transitions occur. Importantly, this effect is
not only observed in the MC simulations but also confirmed by numerical
calculations within MF theory. In fact, the MF phase diagrams (Figure 3c,d) are in very
good qualitative agreement with the phase diagrams obtained from the
MC simulations (Figure 3a,b). Note that for the sake of comparing panels a and c and panels
b and d, we rescale U by  for the MC data and by U0* = kBT for the MF results. The
minor quantitative discrepancies between the MC and MF results in Figure 3 result from the
MF approximation, which assumes that fluctuations of local composition
variables ni and ni– around the average value ⟨ni⟩ = ⟨ni–⟩ are small
(SI).
The stronger effect of adhesion-induced phase separation in the fluctuating membrane systems can be explained as follows: the formation of the R–L complexes suppresses fluctuations of the adhering membranes, which results in an effective, membrane-mediated, lateral attraction between the R–L complexes.7−9 This lateral attraction between the raft-associated protein complexes leads to an enhancement in the coalescence of the rafts. Therefore, lateral phase separation in the fluctuating membrane system can occur at smaller values of contact energy U than in the planar membrane system.
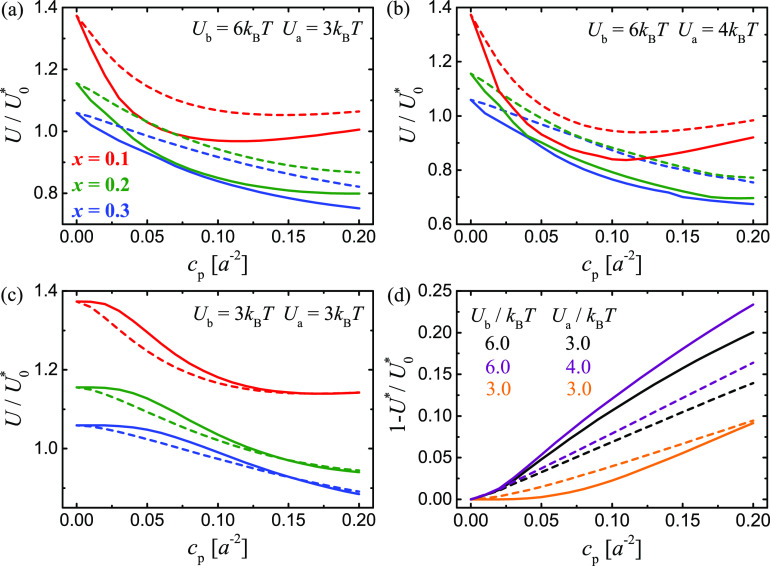
Panels a–c of Figure 4 show MF phase diagrams for different values of Ub, Ua, and x for both the planar (dashed lines) and fluctuating (solid lines) membrane systems. These diagrams together quantify the relative impact of different factors (such as the receptor–ligand binding, the propensity of the lipid rafts to coalesce, the coupling between the adhesion proteins and the lipid rafts, and the membrane shape fluctuations) on the lateral phase separation. We note that, in the parameter range studied here, these factors can impact the phase behavior of the adhering membranes with comparable importance.
Figure 4.
MF results for the planar (dashed lines) and fluctuating (solid lines) membrane systems. (a–c) Phase diagrams for different values of Ub, Ua, and x. (d) Shift of the critical contact energy U* relative to U0* = kBT as a function of protein concentration cp for different values of Ub and Ua.
By comparing Figure 4a,b, we can see that the phase diagram does not change qualitatively if Ua is increased from 3 to 4 kBT. However, by comparing Figure 4a,c we notice that the phase-transition lines change their shape if Ub is decreased from 6 to 3 kBT. Moreover, in Figure 4c, the dashed lines lie below the solid lines, which means that the membrane fluctuations weaken the propensity of the adhering membranes to phase separate, in opposition to the conclusion drawn from the phase diagrams in panels a and b.
Because the R–L complexes locally constrain the membranes, the conformational entropy of the fluctuating membranes disfavors R–L bond formation. Therefore, for a given set of model parameter values, the average number of R–L complexes is smaller in the fluctuating membrane system than in the planar membrane system (Figure S1). One effect of the membrane fluctuations is thus a decrease in the average area concentration of the R–L complexes. This effect leads to less-efficient stabilization of the raft domains by the raft-associated adhesion proteins in the fluctuating membrane system than in the planar membrane system. A second effect is the enhancement of raft coalescence that is induced by the effective lateral attraction between the raft-associated protein complexes in the fluctuating membrane system. If the membrane adhesion is sufficiently weak (i.e., if both Ub and cp are sufficiently small), then the latter effect is dominated by the former effect and, in that case, the lateral phase separation is induced more efficiently in the planar membrane system than in the fluctuating membrane system, as shown in the phase diagram in Figure 4c. On the other hand, if the adhesion is stronger (i.e., if Ub and cp are sufficiently large), then the fluctuating membrane system has a greater propensity to phase separate than the planar membrane system, as shown in the phase diagram in Figure 4b.
MF theory also allows us to explore how the critical contact energy U* depends on the model parameters. In Figure 4d, we show the shift of the critical contact energy, (1 – U*)/U0*, as a function of cp for different values of Ub and Ua. The dashed and solid lines correspond to the planar and fluctuating membrane systems, respectively. If the R–L binding is rather strong (Ub = 6 kBT), then the shift of U* relative to U0 is larger for the fluctuating membrane system (black and purple lines). On the other hand, if the R–L binding is weak (Ub = 3 kBT), then the shift of U* relative to U0* is larger for the planar membrane system (orange lines). These results are conceptually consistent with the phase diagrams displayed in Figure 4a–c. We also note that the dashed lines in Figure 4d are much closer together than the solid lines, which implies in particular that variations in Ub at constant cp lead to larger changes in U* for the fluctuating membrane system than for the planar membrane system. This observation indicates that membrane fluctuations make the critical behavior of the model system more sensitive to the strength of the receptor–ligand binding.
Conclusions
In the ordered phase at U > U*, the receptor proteins are aggregated within the raft domains. Receptor aggregation induced by ligand binding is a ubiquitous process triggering intracellular signals.30−33 Different molecular mechanisms have been proposed by which ligands promote aggregation of their receptors and thus cause the cytoplasmic domains of the aggregated receptors to remain in close proximity for times much longer than random motions of freely diffusing receptors permit. The novel mechanism for receptor aggregation that we have presented here involves collective, cooperative, membrane-mediated interactions between the intercellular receptor–ligand complexes.
We have shown here that thermally excited undulations of the membranes can either facilitate or impede the adhesion-induced receptor aggregation, depending on the strength of the receptor–ligand binding (Figure 4), which may have profound implications for our understanding of physical mechanisms of cellular signaling. In fact, the strength of receptor–ligand binding can be actively modulated in living cells. For example, interactions between the T-cell receptor (TCR) and the major histocompatibility complex (MHC) are modulated by peptides displayed at the MHC molecules,34 and the ability of the TCR to discriminate “foreign” from “self” peptides is a requirement of an effective adaptive immune response. Our theory predicts how the peptide-modulated strength of the TCR-MHC binding can regulate the TCR aggregation. Because the MHC proteins are present in lipid rafts,13,14 our theory implies, in this particular case, that the chemical composition of the MHC-bound peptide can directly affect the TCR aggregation.
Acknowledgments
The authors thank Thomas R. Weikl for stimulating discussions and Julian C. Shillcock for critical reading of this letter. L.L., J.H., and F.S. acknowledge support from the Programs in the National Key Research and Development Program of China (grant no. 2016YFA0501601), the National Natural Science Foundation of China (grants nos. 21504038, 21973040, 11902327, and 11972041), the Strategic Priority Research Program of the Chinese Academy of Sciences (grant no. XDB22040102), and the Opening Fund of State Key Laboratory of Nonlinear Mechanics. B.R. acknowledges support from the National Science Centre, Poland (grant no. 2016/21/B/NZ1/00006). The numerical calculations in this letter were performed at the computing facilities of the High Performance Computing Center (HPCC) of Nanjing University.
Supporting Information Available
The Supporting Information is available free of charge at https://pubs.acs.org/doi/10.1021/acs.nanolett.9b04596.
Detailed description of Monte Carlo simulations and mean-field theory (PDF)
The authors declare no competing financial interest.
Supplementary Material
References
- Simons K.; Toomre D. Lipid rafts and signal transduction. Nat. Rev. Mol. Cell Biol. 2000, 1, 31–39. 10.1038/35036052. [DOI] [PubMed] [Google Scholar]
- Lingwood D.; Simons K. Lipid rafts as a membrane-organizing principle. Science 2010, 327, 46–50. 10.1126/science.1174621. [DOI] [PubMed] [Google Scholar]
- Simons K.; Sampaio J. L. Membrane organization and lipid rafts. Cold Spring Harbor Perspect. Biol. 2011, 3, a004697. 10.1101/cshperspect.a004697. [DOI] [PMC free article] [PubMed] [Google Scholar]
- Fan J.; Sammalkorpi M.; Haataja M. Lipid microdomains: structural correlations, fluctuations, and formation mechanisms. Phys. Rev. Lett. 2010, 104, 118101. 10.1103/PhysRevLett.104.118101. [DOI] [PubMed] [Google Scholar]
- Levental I.; Veatch S. L. The continuing mystery of lipid rafts. J. Mol. Biol. 2016, 428, 4749–4764. 10.1016/j.jmb.2016.08.022. [DOI] [PMC free article] [PubMed] [Google Scholar]
- Sezgin E.; Levental I.; Mayor S.; Eggeling C. The mystery of membrane organization: composition, regulation and roles of lipid rafts. Nat. Rev. Mol. Cell Biol. 2017, 18, 361–374. 10.1038/nrm.2017.16. [DOI] [PMC free article] [PubMed] [Google Scholar]
- Weikl T. R.; Asfaw M.; Krobath H.; Rozycki B.; Lipowsky R. Adhesion of membranes via receptor-ligand complexes: Domain formation, binding cooperativity, and active processes. Soft Matter 2009, 5, 3213–3224. 10.1039/b902017a. [DOI] [Google Scholar]
- Speck T.; Reister E.; Seifert U. Specific adhesion of membranes: Mapping to an effective bond lattice gas. Phys. Rev. E 2010, 82, 021923. 10.1103/PhysRevE.82.021923. [DOI] [PubMed] [Google Scholar]
- Fenz S. F.; Bihr T.; Schmidt D.; Merkel R.; Seifert U.; Sengupta K.; Smith A.-S. Membrane fluctuations mediate lateral interaction between cadherin bonds. Nat. Phys. 2017, 13, 906–913. 10.1038/nphys4138. [DOI] [Google Scholar]
- Steinkuehler J.; Rozycki B.; Alvey C.; Lipowsky R.; Weikl T. R.; Dimova R.; Discher D. E. Membrane fluctuations and acidosis regulate cooperative binding of ‘marker of self’ protein CD47 with the macrophage checkpoint receptor SIRP alpha. J. Cell Sci. 2019, 132, jcs216770. 10.1242/jcs.216770. [DOI] [PMC free article] [PubMed] [Google Scholar]
- Weikl T.; Lipowsky R. Adhesion-induced phase behavior of multicomponent membranes. Phys. Rev. E: Stat. Phys., Plasmas, Fluids, Relat. Interdiscip. Top. 2001, 64, 011903. 10.1103/PhysRevE.64.011903. [DOI] [PubMed] [Google Scholar]
- Weikl T.; Andelman D.; Komura S.; Lipowsky R. Adhesion of membranes with competing specific and generic interactions. Eur. Phys. J. E: Soft Matter Biol. Phys. 2002, 8, 59–66. 10.1140/epje/i2002-10008-2. [DOI] [PubMed] [Google Scholar]
- Anderson H.; Hiltbold E.; Roche P. Concentration of MHC class II molecules in lipid rafts facilitates antigen presentation. Nat. Immunol. 2000, 1, 156–162. 10.1038/77842. [DOI] [PubMed] [Google Scholar]
- Anderson H. A.; Roche P. A. MHC class II association with lipid rafts on the antigen presenting cell surface. Biochim. Biophys. Acta, Mol. Cell Res. 2015, 1853, 775–780. 10.1016/j.bbamcr.2014.09.019. [DOI] [PMC free article] [PubMed] [Google Scholar]
- Murai T.; Sato C.; Sato M.; Nishiyama H.; Suga M.; Mio K.; Kawashima H. Membrane cholesterol modulates the hyaluronan-binding ability of CD44 in T lymphocytes and controls rolling under shear flow. J. Cell Sci. 2013, 126, 3284–3294. 10.1242/jcs.120014. [DOI] [PubMed] [Google Scholar]
- Curk T.; Wirnsberger P.; Dobnikar J.; Frenkel D.; Saric A. Controlling cargo trafficking in multicomponent membranes. Nano Lett. 2018, 18, 5350–5356. 10.1021/acs.nanolett.8b00786. [DOI] [PubMed] [Google Scholar]
- Asfaw M.; Rozycki B.; Lipowsky R.; Weikl T. R. Membrane adhesion via competing receptor/ligand bonds. Europhys. Lett. 2006, 76, 703–709. 10.1209/epl/i2006-10317-0. [DOI] [Google Scholar]
- Li L.; Wang X.; Shao Y.; Li W.; Song F. Entropic pressure between fluctuating membranes in multilayer systems. Sci. China: Phys., Mech. Astron. 2018, 61, 128711. 10.1007/s11433-018-9264-x. [DOI] [Google Scholar]
- Noguchi H.; Gompper G. Shape transitions of fluid vesicles and red blood cells in capillary flows. Proc. Natl. Acad. Sci. U. S. A. 2005, 102, 14159–14164. 10.1073/pnas.0504243102. [DOI] [PMC free article] [PubMed] [Google Scholar]
- Bahrami A. H.; Weikl T. R. Curvature-mediated assembly of janus nanoparticles on membrane vesicles. Nano Lett. 2018, 18, 1259–1263. 10.1021/acs.nanolett.7b04855. [DOI] [PubMed] [Google Scholar]
- Helfrich W. Elastic properties of lipid bilayers - theory and possible experiments. Z. Naturforsch., C: J. Biosci. 1973, 28, 693–703. 10.1515/znc-1973-11-1209. [DOI] [PubMed] [Google Scholar]
- Hu J.; Lipowsky R.; Weikl T. R. Binding constants of membrane-anchored receptors and ligands depend strongly on the nanoscale roughness of membranes. Proc. Natl. Acad. Sci. U. S. A. 2013, 110, 15283–15288. 10.1073/pnas.1305766110. [DOI] [PMC free article] [PubMed] [Google Scholar]
- Li L.; Hu J.; Shi X.; Shao Y.; Song F. Lipid rafts enhance the binding constant of membrane-anchored receptors and ligands. Soft Matter 2017, 13, 4294–4304. 10.1039/C7SM00572E. [DOI] [PubMed] [Google Scholar]
- Li L.; Hu J.; Xu G.; Song F. Binding constant of cell adhesion receptors and substrate-immobilized ligands depends on the distribution of ligands. Phys. Rev. E: Stat. Phys., Plasmas, Fluids, Relat. Interdiscip. Top. 2018, 97, 012405. 10.1103/PhysRevE.97.012405. [DOI] [PubMed] [Google Scholar]
- Tsourkas P. K.; Longo M. L.; Raychaudhuri S. Monte Carlo study of single molecule diffusion can elucidate the mechanism of B cell synapse formation. Biophys. J. 2008, 95, 1118–1125. 10.1529/biophysj.107.122564. [DOI] [PMC free article] [PubMed] [Google Scholar]
- Krobath H.; Rozycki B.; Lipowsky R.; Weikl T. R. Binding cooperativity of membrane adhesion receptors. Soft Matter 2009, 5, 3354–3361. 10.1039/b902036e. [DOI] [Google Scholar]
- Rozycki B.; Lipowsky R.; Weikl T. R. Segregation of receptor-ligand complexes in cell adhesion zones: phase diagrams and the role of thermal membrane roughness. New J. Phys. 2010, 12, 095003. 10.1088/1367-2630/12/9/095003. [DOI] [Google Scholar]
- Fallahi-Sichani M.; Linderman J. J. Lipid raft-mediated regulation of G-protein coupled receptor signaling by ligands which influence receptor dimerization: A computational study. PLoS One 2009, 4, e6604. 10.1371/journal.pone.0006604. [DOI] [PMC free article] [PubMed] [Google Scholar]
- Montroll E.; Potts R.; Ward J. Correlations and spontaneous magnetization of 2-dimensional Ising model. J. Math. Phys. 1963, 4, 308–322. 10.1063/1.1703955. [DOI] [Google Scholar]
- Metzger H. Transmembrane signaling - the joy of aggregation. J. Immunol. 1992, 149, 1477–1487. [PubMed] [Google Scholar]
- Schlessinger J. Cell signaling by receptor tyrosine kinases. Cell 2000, 103, 211–225. 10.1016/S0092-8674(00)00114-8. [DOI] [PubMed] [Google Scholar]
- Ozaki K.; Leonard W. Cytokine and cytokine receptor pleiotropy and redundancy. J. Biol. Chem. 2002, 277, 29355–29358. 10.1074/jbc.R200003200. [DOI] [PubMed] [Google Scholar]
- Su X.; Ditlev J. A.; Hui E.; Xing W.; Banjade S.; Okrut J.; King D. S.; Taunton J.; Rosen M. K.; Vale R. D. Phase separation of signaling molecules promotes T cell receptor signal transduction. Science 2016, 352, 595–599. 10.1126/science.aad9964. [DOI] [PMC free article] [PubMed] [Google Scholar]
- Rudolph M. G.; Stanfield R. L.; Wilson I. A. How TCRs bind MHCs, peptides, and coreceptors. Annu. Rev. Immunol. 2006, 24, 419–466. 10.1146/annurev.immunol.23.021704.115658. [DOI] [PubMed] [Google Scholar]
Associated Data
This section collects any data citations, data availability statements, or supplementary materials included in this article.


