

Abstract
BACKGROUND AND AIMS:
The role of the intestinal microbiome in alcoholic hepatitis is not established. The aims of this study were to: (1) characterize the fecal microbial ecology associated with alcoholic hepatitis, (2) relate microbiome changes to disease severity and (3) infer the functional relevance of shifts in microbial ecology.
METHODS:
The fecal microbiome in patients with moderate or severe alcoholic hepatitis (MAH and SAH) was compared to healthy (HC) and heavy drinking controls (HDC). Microbial taxa were identified by 16S pyrosequencing. Functional metagenomics was performed using PICRUSt. Fecal short chain fatty acids (SCFA) were measured using an LC/MS platform.
RESULTS:
78 participants (HC, n=24; HDC, n=20; MAH, n=10; SAH, n=24) were studied. Heavy drinking had a distinct signature compared to healthy controls with depletion of Bacteroidetes (46% vs 26%; p=0.01). Alcoholic hepatitis was associated with a distinct microbiome signature compared to heavy drinking controls (AUC=0.826); differential abundance of Ruminococcaceae, Veillonellaceae, Lachnospiraceae, Porphyromonadaceae, and Rikenellaceae families were the key contributors to these differences. The beta diversity was significantly different amongst the groups (PERMANOVA p < 0.001). Severe alcoholic hepatitis was associated with increased Proteobacteria (SAH 14% vs. HDC 7% and SAH vs. HC 2%, p=0.20 and 0.01 respectively). Firmicutes abundance declined from HDC to MAH to SAH (63% vs. 53% vs. 48% respectively, p=0.09 HDC vs. SAH). Microbial taxa did not distinguish between moderate and severe alcoholic hepatitis (PERMANOVA p= 0.785). SCFA producing bacteria (Lachnospiraceae and Ruminococcaceae) were decreased in alcoholic hepatitis, and a similar decrease was observed in fecal short chain fatty acids among alcoholic hepatitis patients.
CONCLUSIONS:
There are distinct changes in fecal microbiome associated with development of but not severity of alcoholic hepatitis.
Keywords: Fecal microbiome, Metagenomics, Alcoholic Hepatitis, Fecal short chain fatty acids (SCFA)
BACKGROUND AND INTRODUCTION
Alcoholic liver disease (ALD) poses a significant public health burden (1). Alcoholic hepatitis (AH) is a serious form of ALD with a high 90-day mortality (~30%) and dismal one-year outcomes (2, 3). The pathogenesis of alcoholic hepatitis is only partially understood and there is a paucity of rationally targeted therapies that have succeeded in phase 2B and 3 clinical trials. Of note, there are no approved therapies for alcoholic hepatitis and existing treatments such as steroids are marginally effective and limited by a risk for sepsis (4, 5). These data underscore the need to better understand the biology of alcoholic hepatitis and leverage this information to develop novel preventive and treatment strategies.
Sustained consumption of high levels of alcohol (> 40–60 gms daily for women and men respectively) is needed before alcoholic hepatitis develops (6). However, despite high levels of alcohol consumption, only a subset of individuals develop alcoholic hepatitis while others do not manifest liver disease and there remain gaps in understanding the natural course of the acute disease despite studies over five decades (3, 7). It is therefore likely that factors apart from alcohol hepatotoxicity may influence the onset and progression of alcoholic hepatitis.
Recent studies have focused on the intestinal microbiome as a key player in the development of several liver diseases, mostly concentrating on nonalcoholic fatty liver disease. Also, fecal transplantation has been studied for both alcoholic hepatitis and nonalcoholic fatty liver disease suggesting a role for the microbiome in these conditions (8).
Quantitative and qualitative changes in intestinal bacteria, altered intestinal permeability, and bacterial products such as endotoxins are linked to the development of ALD and progression to cirrhosis in experimental and human disease (9) (10). In a mixed group of cirrhotic patients (with alcoholic and non-alcoholic fatty liver disease), microbiota from the phylum Firmicutes decreased and Proteobacteria increased; Bacteroidetes have also been reported to decrease (11, 12) (13). However, these data are not specific for alcohol-induced liver disease and there is a paucity of data to determine if there are distinct changes in the fecal microbiome in well-defined cases of alcoholic hepatitis.
A small recent study of 13 patients with severe alcoholic hepatitis found higher Hemophilus and Campylobacter along with Lactobacilli and Lactococcus compared to those with alcoholic pancreatitis (14). However, this study did not distinguish between the effects of alcohol consumption alone versus those related to alcoholic hepatitis. It therefore remains unclear if there are distinct changes induced by alcohol consumption and if there are additional distinct changes with development of alcoholic hepatitis or specific patterns of changes linked to the severity of alcoholic hepatitis. The changes in the intestinal microbiome have also been shown to be associated with functional changes in the bile acids in plasma and stool in alcoholic patients (15). We have previously reported that there are indeed distinct microbial signatures associated with alcohol consumption and alcoholic hepatitis in the circulating microbiome (16). Whether similar changes are present in the fecal microbiome also remains unknown.
The objectives of the current study were to: (1) characterize the microbial ecology in patients with alcoholic hepatitis to identify a microbial signature of the condition distinct from that due to heavy alcohol consumption alone; (2) relate changes in microbial ecology to disease severity; and (3) infer the functional relevance of shifts in microbial ecology with disease severity using both metagenomic analyses and targeted fecal metabolites.
MATERIALS AND METHODS
This study was performed by the sites involved in the TREAT consortium from 2014–2018. The TREAT consortium includes three clinical sites (Virginia Commonwealth University, Indiana University and Mayo Clinic), a data coordinating center (Indiana University) and a microbiome analysis core (George Mason University). This consortium is funded by the NIAAA and includes a registry of subjects with alcoholic hepatitis and controls consuming large amounts of alcohol who do not have clinically overt liver disease. Healthy non-drinking controls (referred to as HC in figures) with no evidence of liver disease were enrolled solely at VCU. All subjects provided informed consent and the study was approved by the institutional review boards (IRB) at each center. Sample collection and bacterial DNA extraction was performed at VCU whereas the microbiome analysis was performed at George Mason University. The investigators have fully participated in the design, performance and analysis of the study and take full responsibility of the contents of the manuscript. The NIAAA did not participate in the conduct of the studies but provided feedback on the contents of the manuscript.
Patient Population
Alcoholic Hepatitis was defined by the development of jaundice, hepatomegaly and elevated AST with AST:ALT ratio > 1 in an individual with a history of sustained heavy alcohol consumption (> 5 units daily) within 6 weeks of diagnosis in accordance with the NIAAA consensus definition (17). Those with concomitant alternate etiologies of liver disease such as hepatitis C were excluded. Also, those with active gastrointestinal bleeding, sepsis and those on antibiotics at the time of diagnosis were excluded. Patients receiving lactulose or rifaximin for hepatic encephalopathy were also excluded. The severity of alcoholic hepatitis was defined by a MELD score less than or equal to 20 versus those with higher levels(18). Based on the MELD score, patients were categorized to have moderate or severe alcoholic hepatitis (MAH or SAH).
Individuals with suspected alcoholic hepatitis were initially evaluated and liver enzymes and functions measured along with computation of the MELD score. All patients were assessed clinically for infection and blood cultures obtained along with chest X-ray and urine examination. In those with ascites, a diagnostic paracentesis was performed and the presence of spontaneous bacterial peritonitis excluded. Stool studies for infection were performed as clinically indicated. Participants were considered to have met entry criteria if they met inclusion criteria and had none of the exclusion criteria.
A control population without an alcohol use disorder and obvious liver disease served as a healthy control group. These individuals were asymptomatic, had a normal physical examination, normal liver enzymes and functions and absence of sonographic evidence of liver disease or a CAP score < 250 db/sec and liver stiffness measurement < 6 kp on fibroscan (16). Another set of heavy drinking controls (referred to as HDC in figures) who were consuming more than 5 units of alcohol daily but had no overt evidence of liver disease (normal liver enzymes, normal liver function and absence of jaundice or hepatomegaly) were also included to evaluate the impact of heavy alcohol consumption without clinically evident alcoholic hepatitis.
Stool samples collection and analysis
Here we briefly outline samples collection and analysis, full details regarding intestinal microbiome methodology are provided in the Supporting Information. Based on prior studies of the stool microbiome, a standardized approach to stool collection was established and a standard operating procedure put in place (19). Briefly, to interrogate and characterize gut microbiome composition, we used the 16S rRNA. Length Heterogeneity PCR (LH-PCR) fingerprinting was routinely used to rapidly survey our samples and standardize the community amplification. We then interrogated the microbial taxa associated with the gut mucosal microbiome using Multitag Sequencing (MTS) on the samples (19). Statistical data analysis was performed based on the operational taxonomic unit (OTU) table obtained using customized PERL scripts as described in the Supporting Information. All analyses were done with R software. The full analysis script is available in the Supporting Information. Rare taxa were filtered with default settings implemented in function PERFect_perm() in R software package PERFect (20). Alpha Diversity Analysis was performed on the filtered OTU counts table. Principle Coordinates Analysis (PCoA) was performed on the sample pairwise Bray-Curtis dissimilarity measures derived from the taxa relative abundance table. PICRUSt was used for inferred metagenomic analyses as previously described (21). Enrichment of abundant taxa or function (relative abundance of KEGG orthologous groups (KO)) between treatment groups was performed using the linear discriminant analysis effect size (LEfSe) (22) based on taxa genus level with a threshold logarithmic LDA score set at 2.0. Random forest classification and regression models with K-fold (K=3) cross validation procedure based on taxa genus level relative abundance data were used to build the prediction models of alcoholic hepatitis and MELD score, respectively. Model significance was evaluated using rf.significance() function in R package rfUtilities.
Fecal metabolite identification of short chain fatty acids
Stool from heavy drinking controls and alcoholic hepatitis patients was tested for short chain fatty acids (SCFA). SCFA concentrations were measured from fecal samples using an LC/MS platform as previously described (23). Log transformation and imputation of missing values was performed, if any, with the minimum observed value for each compound. Welch’s two-sample t-test was used to identify SCFA that differed significantly between HDC and AH patients. Additional details are provided in the supporting information.
RESULTS
Study cohort
A total of 78 subjects (HC, n=24; HDC, n=20; MAH, n=10; SAH, n=24) were studied (Table 1). The study groups were comparable for race and BMI with male predominance among alcohol groups. The healthy controls group were younger than alcohol consuming groups (heavy drinking controls, moderate and severe alcoholic hepatitis groups combined). The alcoholic hepatitis patients had lower cholesterol, albumin and platelets and had higher AST, ALT, bilirubin, white blood count. As expected, compared to heavy drinking controls, subjects with alcoholic hepatitis had higher INR, MELD, Child-Pugh and DF scores; these measures of disease severity were highest in those with severe alcoholic hepatitis. While for many participants time since last drink was not available (25% of HDC, 60% of MAH, and 16.7% of SAH), there was, on average, a progressive but non-significant (Kruskal-Wallis p=0.22; Supplementary Figure 1) time increase in time since last alcohol consumption from HDC, to MAH and SAH. The mental status of the patients was similar between the groups. There was higher use of acid suppressant medications (proton pump inhibitors or H2 receptor blockers) in patients with SAH (Table 1). However, this did not significantly affect the fecal microbial composition (PERMANOVA 0.106, supplementary Figure 2 (A)).
Table 1.
Characteristics of the Study Cohort
| HC | HDC | MAH | SAH | p-value | ||
|---|---|---|---|---|---|---|
| Number of participants | 24 | 20 | 10 | 24 | ||
| Age (mean (SD)) | 39.29 (12.26) | 46.43 (13.56) | 53.34 (7.22) | 43.53 (11.39) | 0.017 | |
| Gender (%) | F | 13 (54.2) | 8 (40.0) | 2 (20.0) | 12 (50.0) | 0.286 |
| M | 11 (45.8) | 12 (60.0) | 8 (80.0) | 12 (50.0) | ||
| Race (%) | White | 22 (91.7) | 18 (90.0) | 9 (90.0) | 23 (95.8) | 0.754 |
| Black or African American | 1 (4.2) | 1 (5.0) | 1 (10.0) | 0 (0.0) | ||
| Asian | 1 (4.2) | 0 (0.0) | 0 (0.0) | 0 (0.0) | ||
| More than one race | 0 (0.0) | 1 (5.0) | 0 (0.0) | 1 (4.2) | ||
| BMI (mean (SD)) | 27.26 (6.04) | 29.50 (7.56) | 28.96 (3.70) | 28.83 (5.70) | 0.670 | |
| Missing | 0 (0) | 5 (25) | 0 (0) | 0 (0) | ||
| Average number of drinks per day (mean (SD)) | --- | 17.93 (14.26) | 23.00 (16.01) | 12.23 (8.65) | 0.092 | |
| Missing | --- | 6 (30) | 3 (30) | 1 (4.2) | ||
| Total cholesterol – mg/dL (mean (SD)) | 169.35 (32.87) | 178.20 (33.96) | 91.00 (--) | 119.50 (0.71) | 0.101 | |
| Missing | 1 (4.2) | 15 (75) | 9(90) | 22(91.7) | ||
| Hemoglobin – g/dL (mean (SD)) | 14.01 (0.93) | 13.25 (1.40) | 10.75 (2.02) | 10.55 (1.81) | <0.001 | |
| Missing | 3 (12.5) | 0 (0) | (0) | 0 (0) | ||
| AST – U/L (mean (SD)) | 23.17 (10.41) | 25.15 (8.07) | 137.10 (70.01) | 121.75 (46.82) | <0.001 | |
| ALT – U/L (mean (SD)) | 22.00 (10.89) | 25.10 (12.03) | 68.50 (35.32) | 39.96 (20.20) | <0.001 | |
| Bilirubin – mg/dL (mean (SD)) | 0.57 (0.18) | 0.43 (0.26) | 4.77 (3.51) | 20.10 (10.85) | <0.001 | |
| 2 (8.3) | 0 (0) | 1 (10) | 0 (0) | |||
| Albumin – g/dL (mean (SD)) | --- | 4.06 (0.52) | 2.64 (0.48) | 2.77 (0.51) | <0.001 | |
| Missing | --- | 1 (5) | 3 (30) | 1 (4.2) | ||
| WBC – × 109 cells/L (mean (SD)) | 5.96 (1.34) | 6.74 (2.62) | 10.68 (7.30) | 16.35 (11.94) | <0.001 | |
| 3 (12.5) | 0 (0) | 0 (0) | 0 (0) | |||
| Platelet - × 109 per liter (mean (SD)) | 289.38 (66.41) | 262.30 (53.87) | 175.10 (126.66) | 156.75 (88.31) | <0.001 | |
| Missing | 3 (12.5) | 0 (0) | 0 (0) | 0 (0) | ||
| Creatinine – mg/dL (mean (SD)) | 0.76 (0.11) | 0.89 (0.35) | 0.66 (0.24) | 1.05 (0.66) | 0.094 | |
| Missing | 10 (41.7) | 1 (5) | 0 (0) | 0 (0) | ||
| INR (mean (SD)) | 1.00 (0.07) | 1.01 (0.15) | 1.32 (0.19) | 2.02 (0.40) | <0.001 | |
| Missing | 5(20.8) | 0(0) | 0(0) | 0(0) | ||
| MELD Score (mean (SD)) | --- | 7.37 (1.74) | 14.60 (3.41) | 26.50(5.08) | <0.001 | |
| Missing | --- | 1 (5) | 0 (0) | 0 (0) | ||
| Child-Pugh score (mean (SD)) | --- | 5.21 (0.43) | 8.43 (1.13) | 10.48 (1.70) | <0.001 | |
| Missing | --- | 6 (30) | 3 (30) | 1 (4.2) | ||
| DF score (mean (SD)) | --- | 12.54 (8.79) | 35.33 (5.06) | 81.33 (31.75) | <0.001 | |
| Missing | --- | 9 (45) | 7 (70) | 15 (65.2) | ||
| Time since last drink, days (mean (SD)) | --- | 8.20 (5) | 14.25 (14.64) | 16.55 (12.62) | 0.081 | |
| Missing | --- | 5 (25) | 6 (60) | 4 (16.7) | ||
| GCS (mean (SD)) | --- | 15 (0) | 15 (0) | 14.35 (1.37) | 0.137 | |
| Missing | --- | 7 (35) | 4 (40) | 1 (4.2) | ||
| Acid reducing medication (%) | Yes | 0 | 10 (50) | 3 (30) | 10 (41.7) | 0.001 |
| No | 24 (100) | 10 (50) | 7 (70) | 14 (58.3) |
Abbreviations: ALT, alanine aminotransferase; AST, aspartate aminotransferase; BMI, body mass index; WBC, while blood count; INR, international normalized ratio; MELD, model for end-stage disease; DF, discriminant function; GCS, Glasgow coma scale; HC, healthy controls; HDC, heavy drinking controls; MAH, mild alcoholic hepatitis; SAH, severe alcoholic hepatitis.
Alterations in fecal microbiome composition due to alcohol consumption
In order to determine the effects of alcohol consumption, we first compared the microbial taxa in heavy drinking alcohol controls versus healthy controls. Compared to healthy controls, at a phylum level, heavy drinking controls were enriched in Firmicutes (49% vs. 62%, p= 0.08), with significant concomitant marked depletion in Bacteroidetes (46% vs. 26%, p=0.01, Figure 1 A–B). As a result, the ratio of Firmicutes to Bacteroidetes (2.39 vs. 1.05, p=0.02) was 127% higher in heavy drinking controls vs. healthy controls (Figures 1C–D). Although the Firmicutes to Bacteroidetes ratio remained higher in those with alcoholic hepatitis compared to healthy controls (27% higher in moderate alcoholic hepatitis and 48.6% higher in severe alcoholic hepatitis, Figure 1D), the Firmicutes abundance declined in a stepwise manner from heavy drinking controls to moderate alcoholic hepatitis and then severe alcoholic hepatitis (HDC 62% vs. MAH 53% vs. SAH 48%, p=0.09 HDC vs. SAH; Figures 1B and 1E–F).
Fig 1.
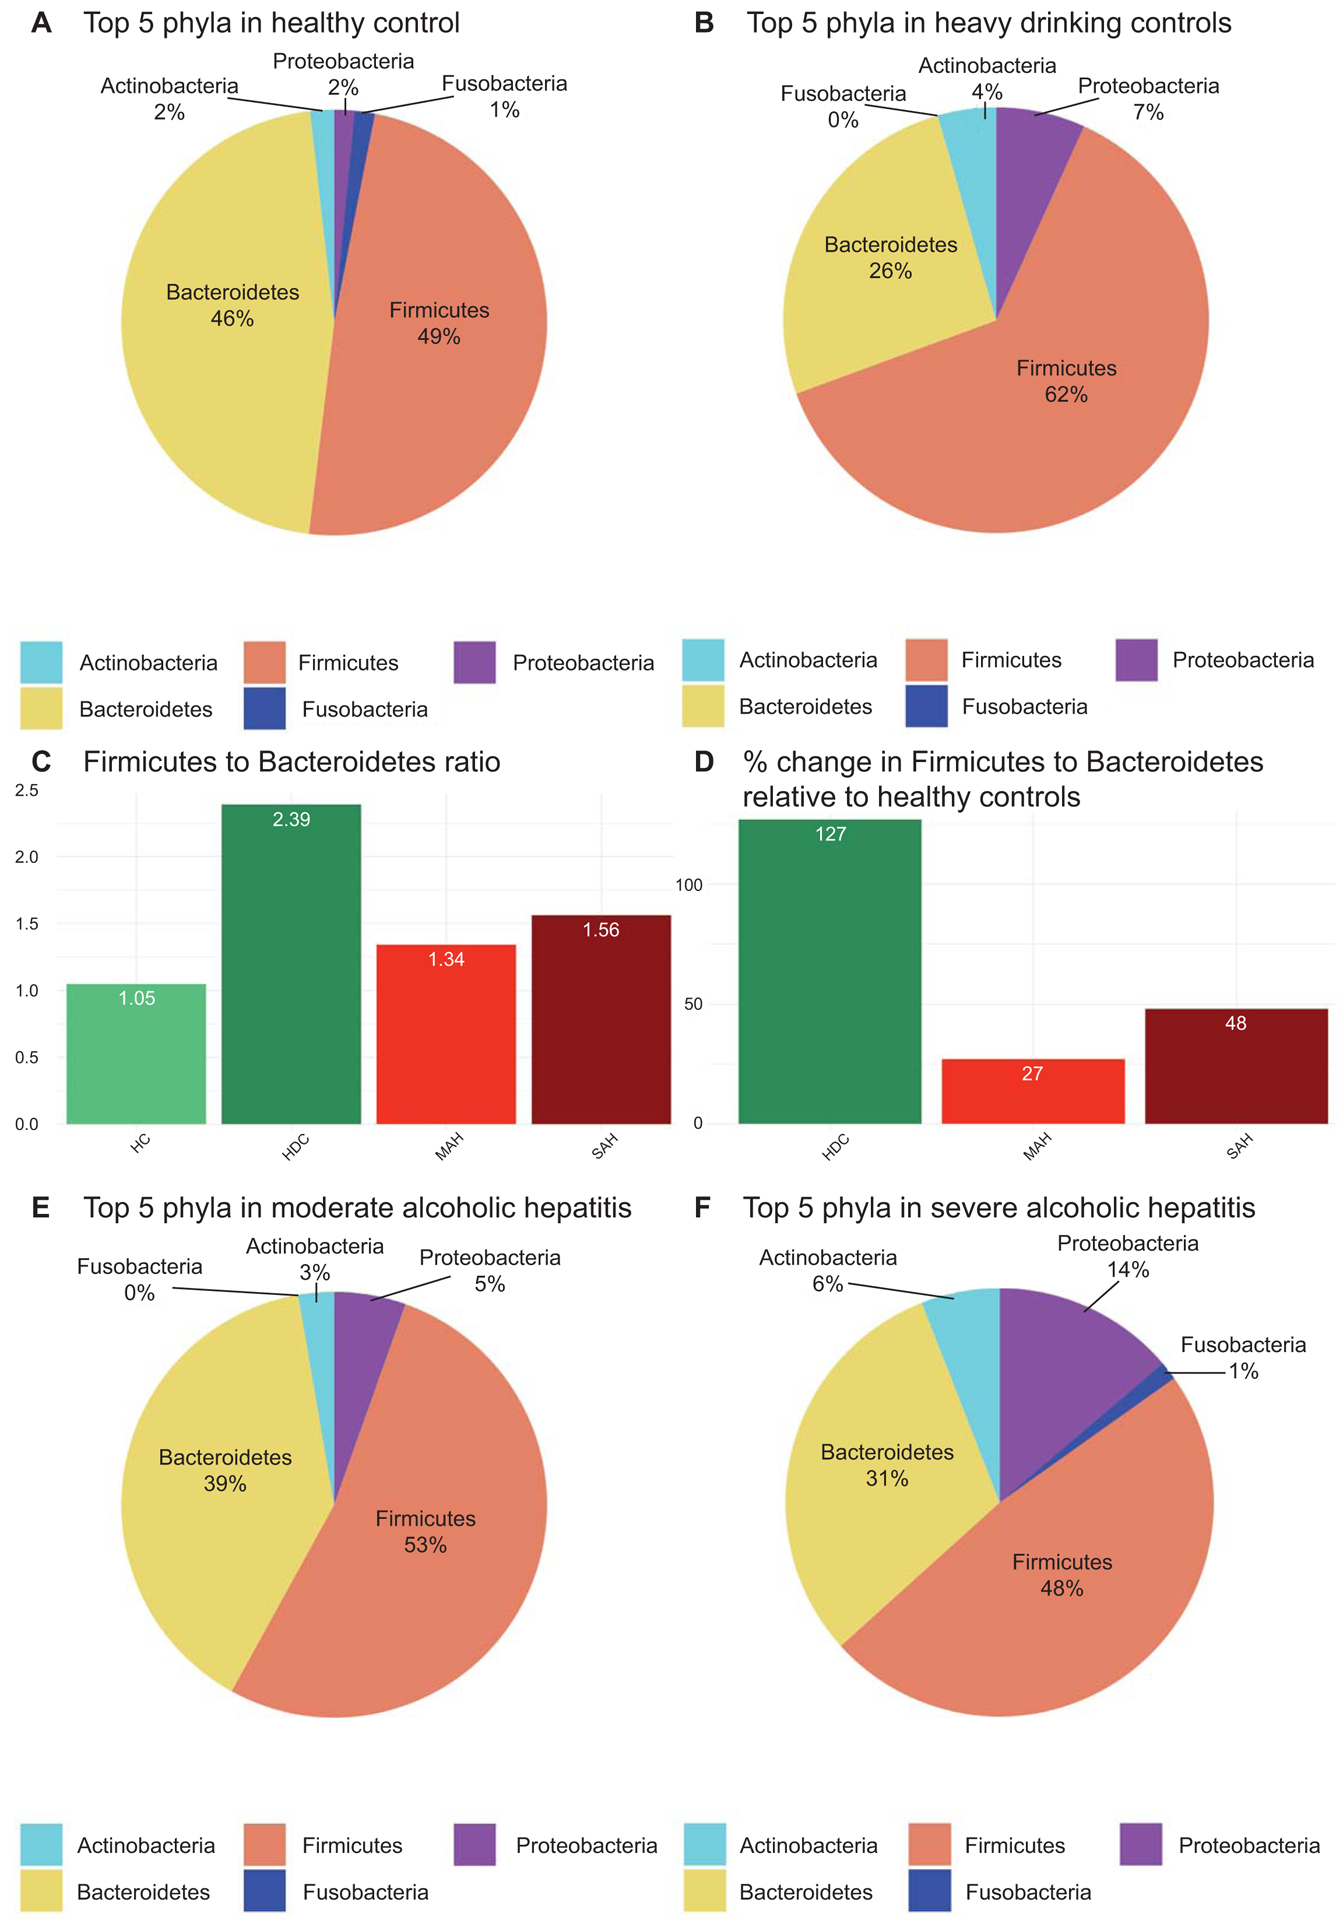
Phylum level mean relative abundance and ratio of relative abundances by patient comparison groups. (A) Top 5 most abundant average relative abundance for the healthy control group; (B) Top 5 most abundant average relative abundance for the heavy drinking control relative abundance; (C) Ratio of average Firmicutes to average Bacteroidetes for each comparison group; (D) Percent change of average Firmicutes to average Bacteroidetes ratio by each comparison group; (E) Top 5 most abundant average relative abundance for the moderate and (F) severe alcoholic hepatitis.
The proportion of Proteobacteria increased modestly from healthy controls to heavy drinking controls and moderate alcoholic hepatitis. There was however a further significant step up in the Proteobacteria population in those with severe alcoholic hepatitis compared to both healthy and heavy drinking controls (SAH 14% vs. HDC 7% and SAH vs. HC 2%, p=0.20 and 0.01 respectively, Figures 1A–B and 1E–F).
Development of alcoholic hepatitis is associated with distinct changes in the fecal microbiome:
At a genus level, the overall Shannon alpha diversity was significantly different across four groups (Kruskal-Wallis p = 0.02) (Figure 2A). There were no significant differences in diversity between healthy and heavy drinking controls. There was a trend for decreased diversity in moderate alcoholic hepatitis (MAH-HC= −1.20; p=0.17) which was further amplified in severe alcoholic hepatitis (SAH – HC = −1.93; p = 0.05). Compared to heavy drinking controls, mild and severe alcoholic hepatitis participants had significantly decreased alpha diversity (MAH – HDC = −2.05; p = 0.06) and (SAH – HDC = −2.97; p = 0.01).
Fig 2.
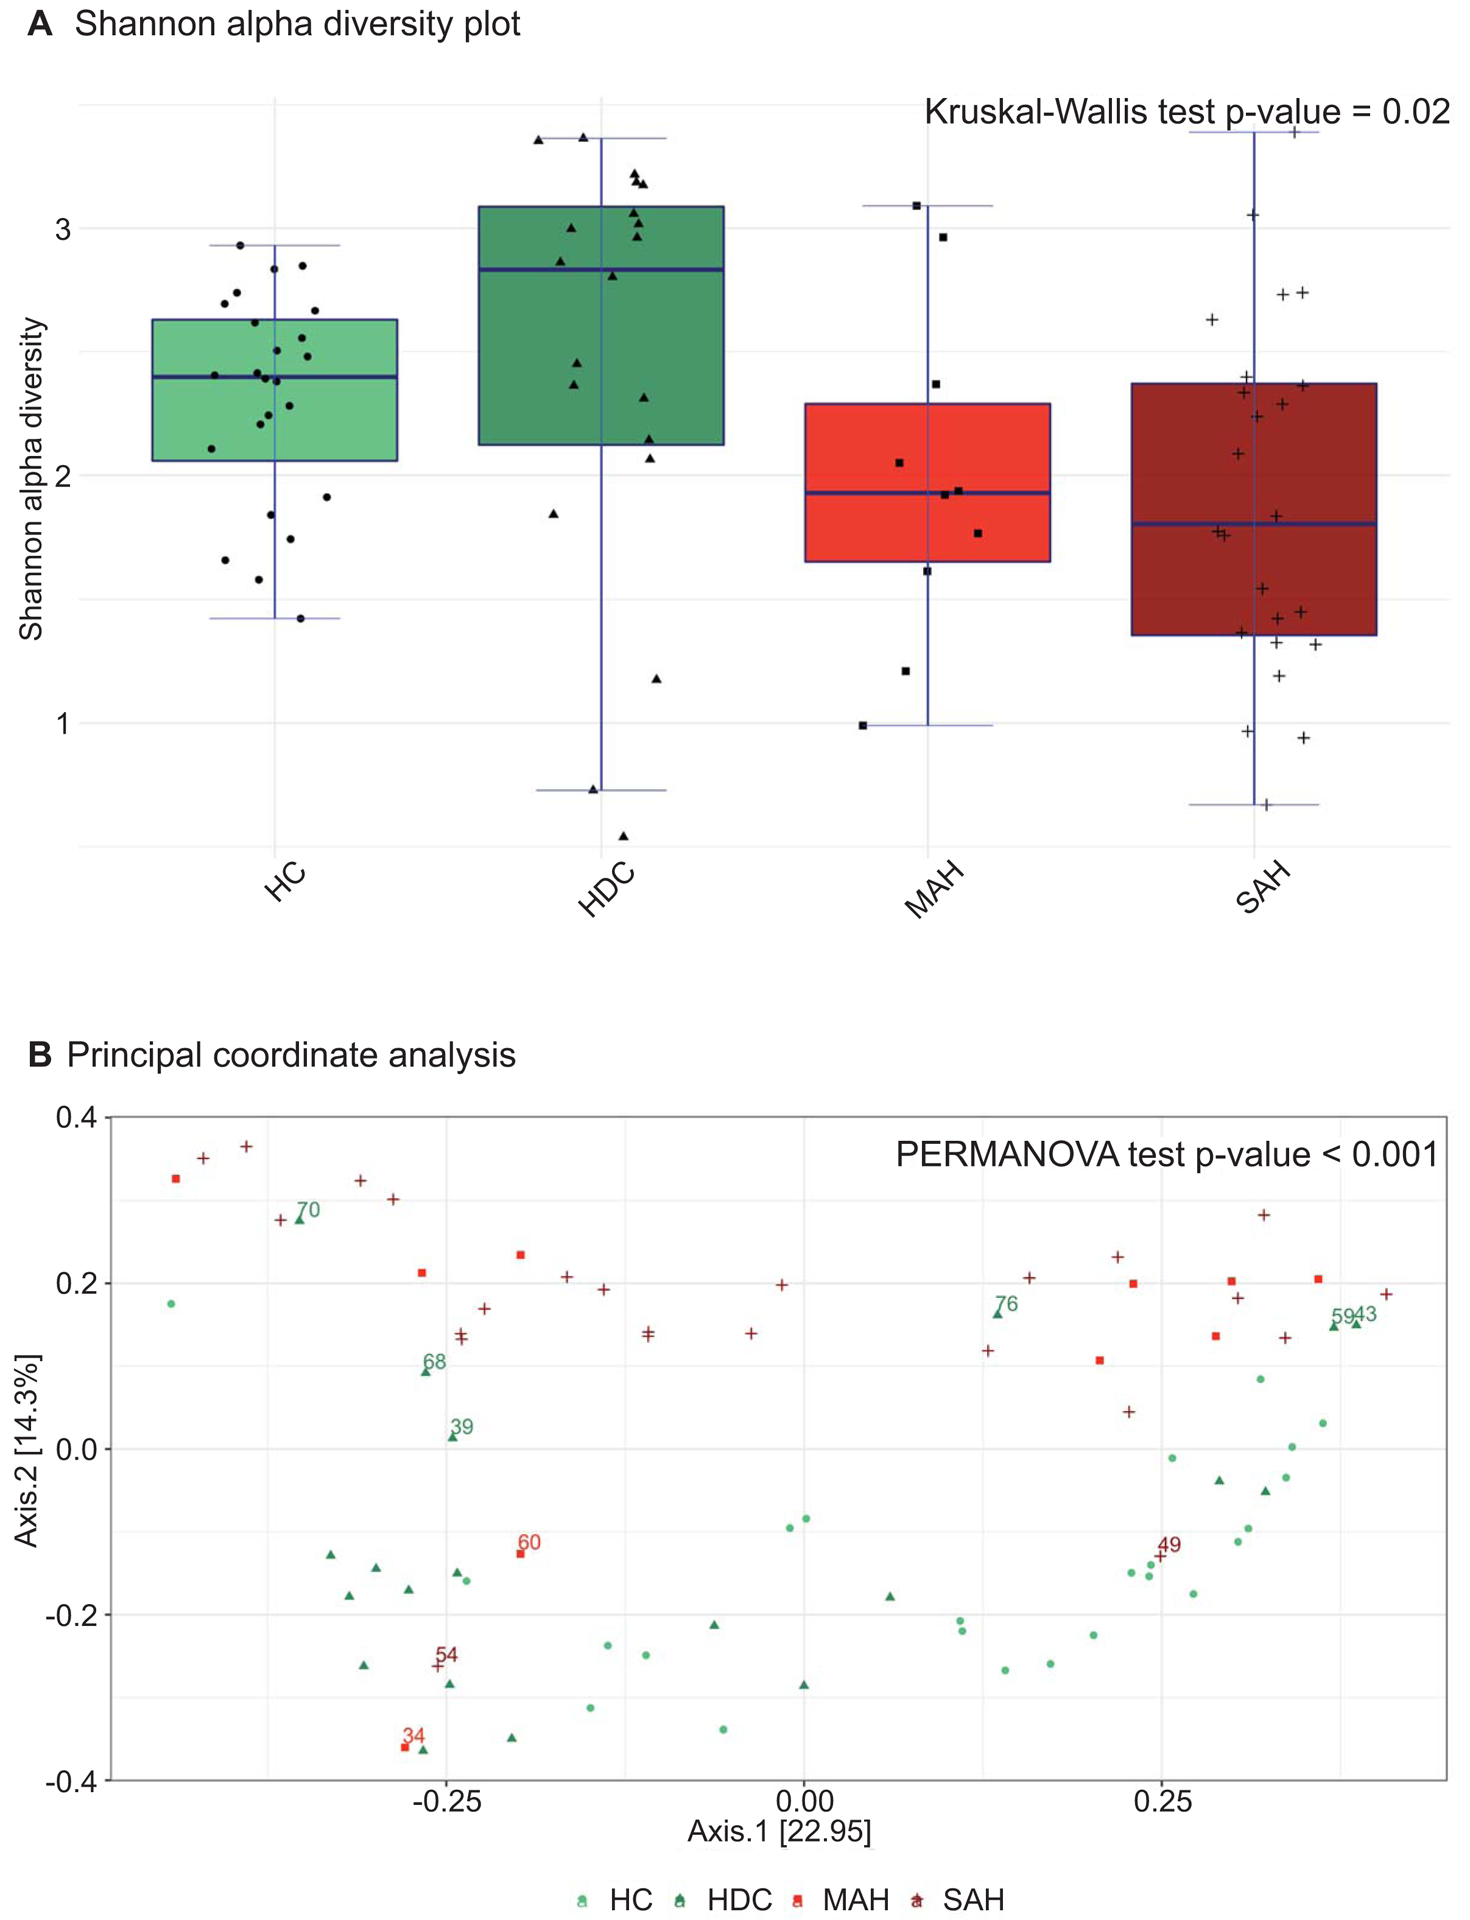
(A) Genus level alpha and beta diversity analyses by patient comparison groups. (A) Shannon alpha diversity plots representing decreased species diversity in AH patients from controls; (B) Principal coordinate analysis (PCoA) Bray‐Curtis distance plots depicting the relationships between the microbiomes with respect to alcohol use and AH study groups.
Principal Coordinate Analyses (PCoA) of pairwise Bray-Curtis distances for the first two principal components that explain 37.2% variability is shown (Figure 2B). The global bacterial composition was significantly different across the four groups (PERMANOVA test p < 0.001). The control (HC and HDC) and hepatitis (MAH and SAH) patients were distinctly separated on the PCoA plots, indicating that although the microbiome composition within controls (HC and HDC) and disease (MAH and SAH) were similar, the alcoholic hepatitis and control groups were distinct. The development of alcoholic hepatitis is thus associated with a distinct change in microbial composition, which is not a simple function of alcohol consumption alone.
It is interesting to note that the changes in microbiome composition was not homogeneous from patient to patient within any single group. Several heavy drinking controls (labeled 70, 68, 39, 76, 59, 43 in Figure 2B) had a microbiota composition similar to the moderate and severe alcoholic hepatitis groups. Two of these patients (labeled 59 and 68) had MELD scores of 10 and 8, respectively. On the other hand, the microbiome of two moderate alcoholic hepatitis (60, 34) and one severe alcoholic hepatitis (54) patients in this cohort was closely related to the microbiome composition of the heavy drinking control group. The MELD scores of these patients were 14, 19, and 23, respectively. One severe alcoholic hepatitis patient’s (49) microbiome was similar to healthy controls, and this person’s corresponding MELD score was 22. The microbial composition of the outliers could not be explained by the use of concomitant medications.
Differential alterations in microbiome due to alcohol consumption and alcoholic hepatitis
The differential enrichment of specific bacteria at family and genus level is shown in histograms (Figure 3), based on an LDA score > 2 for pairwise comparisons. For each comparison group enriched taxa are represented by a horizontal bar with the length that corresponds to the degree of enrichment in that group.
Fig 3.
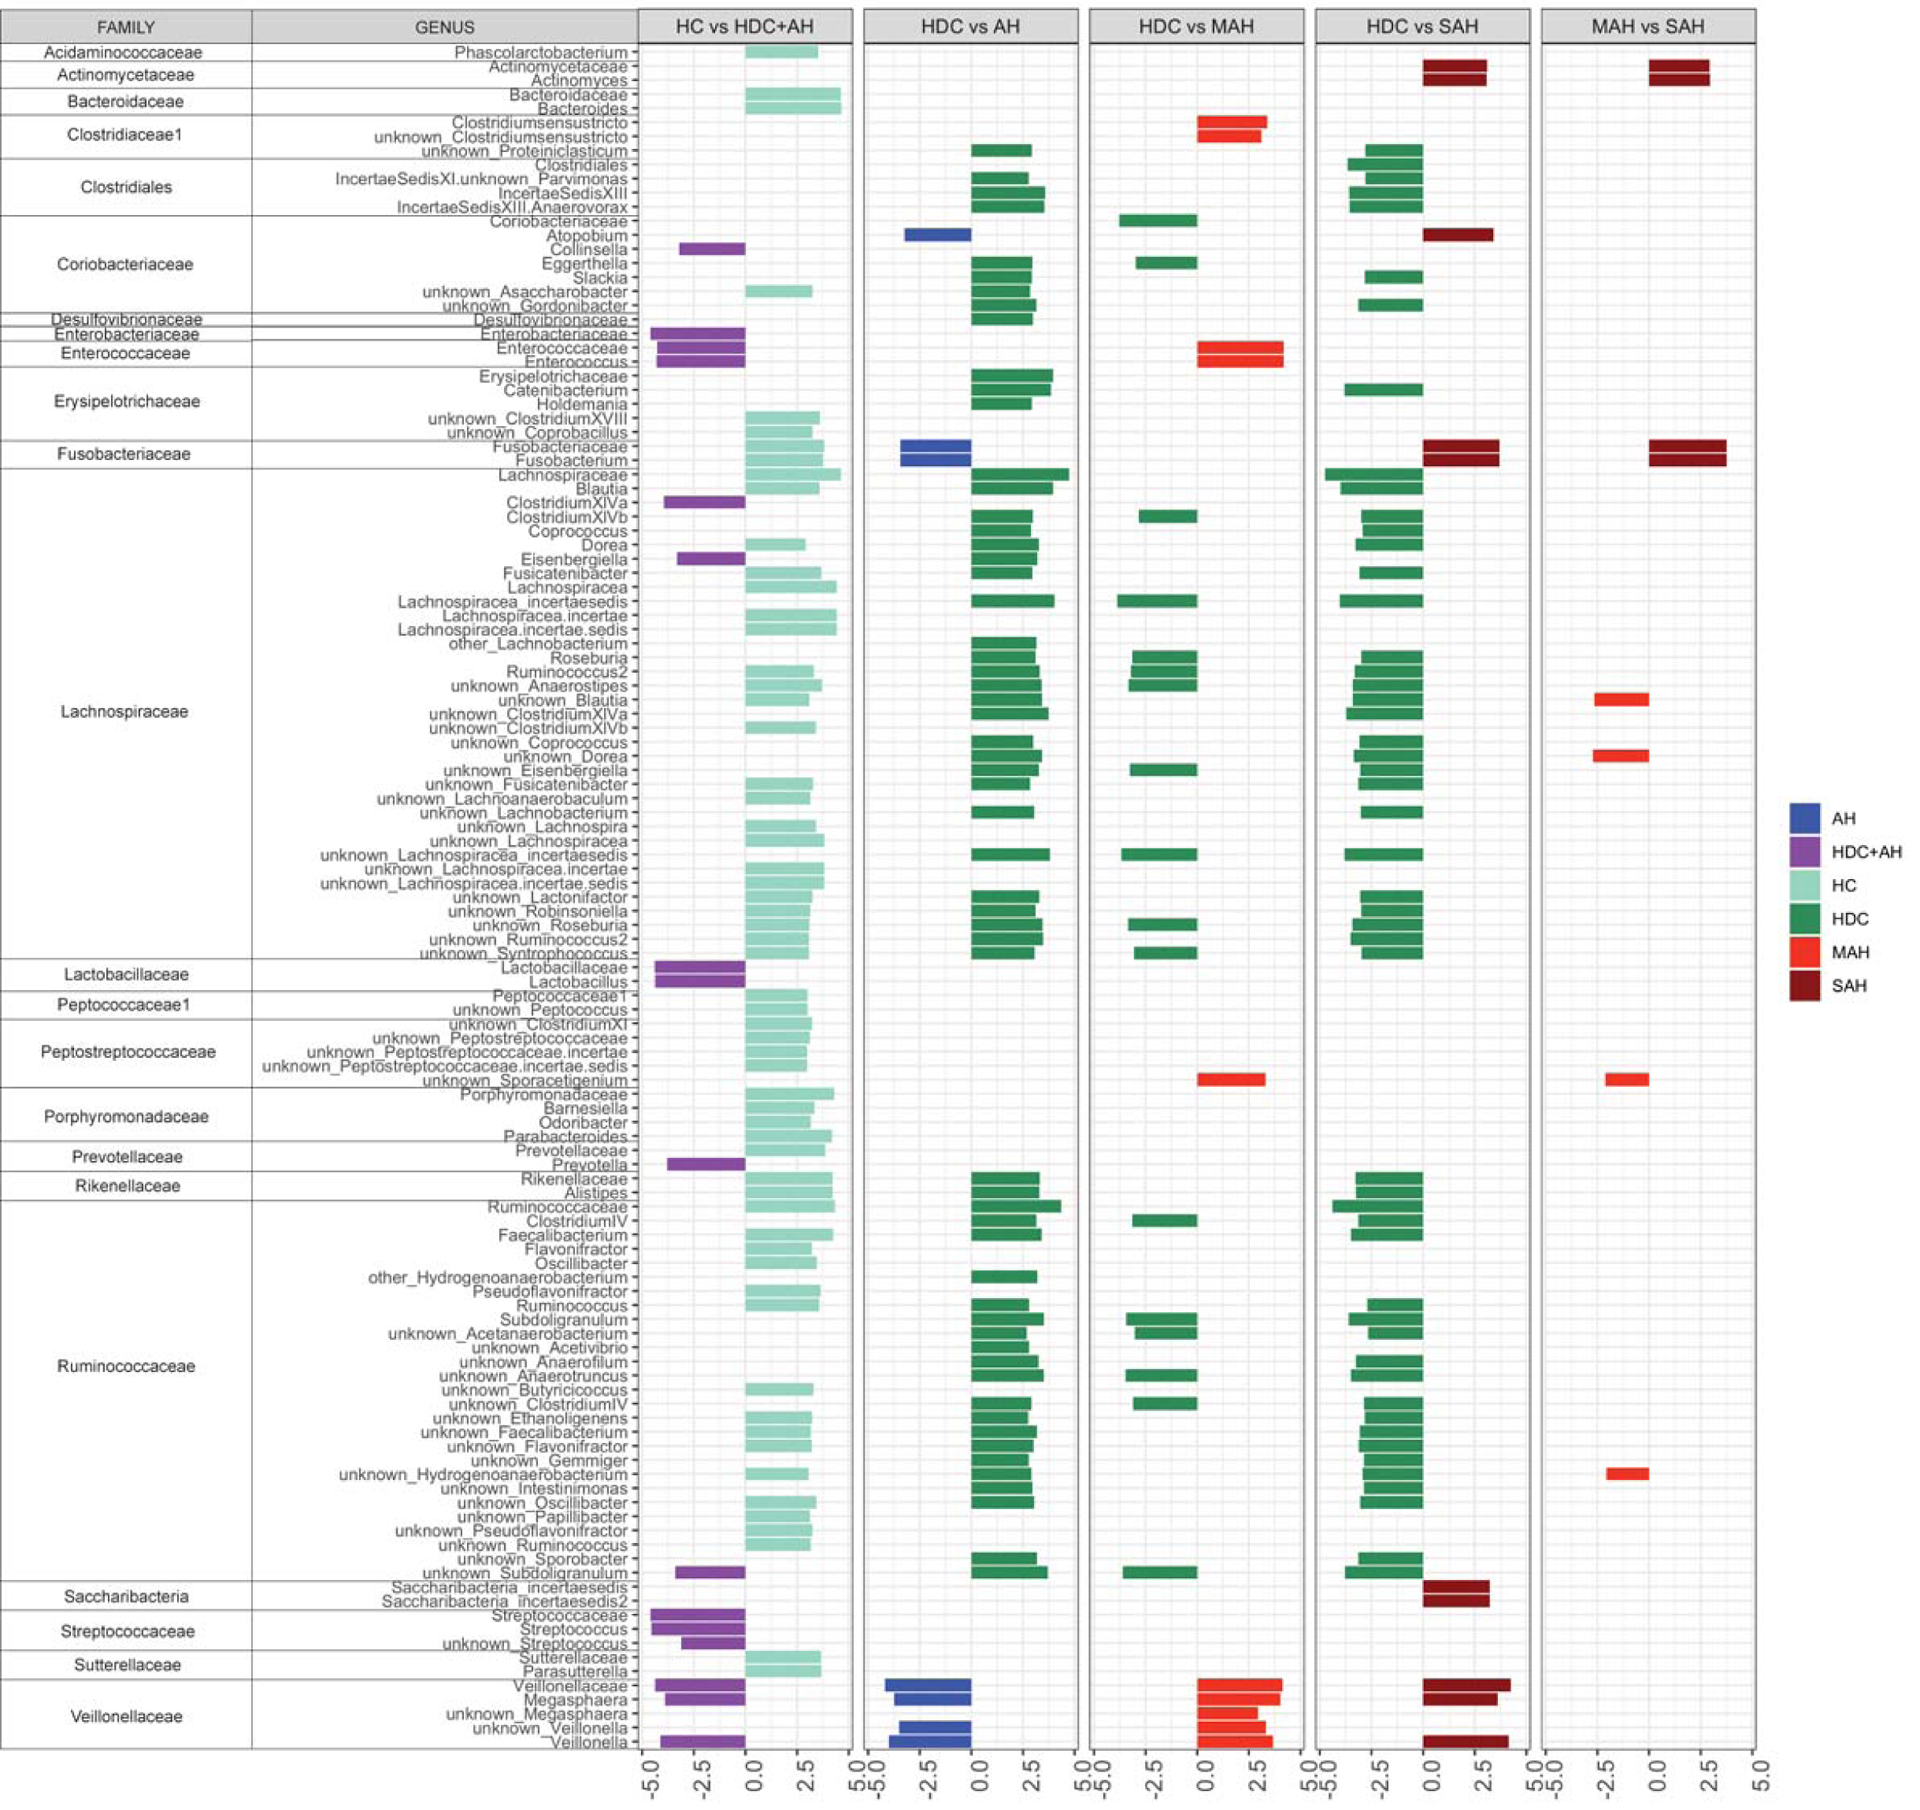
LEfSe plots of pairwise analysis for 16S rDNA sequence analysis for (1) HD versus Alcoholics (HDC, MAH and SAH combined); (2) HDC versus AH (MAH and SAH combined); (3) HDC versus MAH; (4) HDC versus SAH; and (5) MAH versus SAH colored by the enrichment in corresponding group. The family and subsequent genus levels are sorted alphabetically, and the corresponding LDA scores for each pairwise analysis are indicated in columns to the right according to level of alcohol use (LDA score > 2.0; P < 0.05). Longer bar size corresponds to larger degree on enrichment in that group.
Alcohol consumption is associated with differential enrichment in specific microbiota
To characterize the effect of alcohol consumption on gut microbiota, intestinal microbiota of healthy controls was compared to that of individuals with heavy alcohol consumption (i.e. HDC, SAH and MAH groups combined). Enterobacteriaceae, Lachnospiraceae (Clostridium XIVa and Eisenbergiella), Lactobacillaceae, and Prevotellaceae (genus Prevotella), Saccharibacteria, Streptococcaceae, and Veillonellaceae were enriched in patients with heavy alcohol consumption. On the other hand, Acidaminococcaceae, Bacteroidaceae, Erysipelotrichaceae, multiple genera of Lachnospiraceae family, Peptococcaceae1, Peptostreptococcaceae, Porphyromonadaceae, Prevotellaceae, Rikenellaceae, Ruminococcaceae (multiple genera), and Sutterellaceae were enriched in healthy controls.
Alcoholic hepatitis is associated with distinct changes in fecal microbiome
In an effort to gauge the effect of hepatitis on the gut microbiome in those with heavy alcohol consumption, we first compared heavy drinking controls to alcoholic hepatitis (MAH and SAH combined); Coriobacteriaceae Atopobium, Fusobacteriaceae Fusobacterium and several genera of Veillonellaceae family were enriched in alcoholic hepatitis patients. Multiple additional taxa from Coriobacteriaceae (distinct from Coriobacteriaceae Atopobium) were enriched in heavy drinking controls. In addition, Enterococcaeae, Lachnospiraceae, and Ruminococcaeae families were also enriched in heavy drinking controls.
We next compared heavy drinking controls to moderate alcoholic hepatitis patients. Coriobacteriaceae and Coriobacteriaceae Eggerthella, as well as several taxa from Lachnospiraceae, and Ruminococcaeae family were enriched in heavy drinking controls. The taxa families enriched in moderate alcoholic hepatitis were Closteridiales, Enterococcaeae, Enterococcaeae, Peptostreptococcaceae, and Veillonellaceae. Next, comparing heavy drinking controls to severe alcoholic hepatitis patients, Actinomycetaceae, Coriobacteriaceae Atopobium, Fusobacteriaceae, Saccharibacteria incertaesedis, and Veillonellaceae families were enriched in patients who developed severe alcoholic hepatitis. In contrast, Closteridiales, Lachnospiraceae and Ruminococcaeae families were significantly enriched in heavy drinking controls.
Enrichment of Fusobacteria with disease severity within the population of those with alcoholic hepatitis
To further determine the relationship of microbiome changes to the severity of alcoholic hepatitis, we compared microbial taxa at a genus level in those with moderate versus severe alcoholic hepatitis. Patients with severe alcoholic hepatitis had increased Actinomycetaceae and Fusobacteriaceae compared to those with moderate alcoholic hepatitis. Lachnospiraceae and Ruminococcaeae (families enriched in control subjects compared to alcoholic hepatitis), as well as Peptostreptococceae were enriched in moderate alcoholic hepatitis.
A microbiome signature for alcoholic hepatitis distinct from alcohol consumption alone
To investigate the ability of microbiota to discriminate alcoholic hepatitis patients from heavy drinking controls, we considered all subjects with heavy alcohol consumption (i.e. heavy drinking controls, moderate and severe alcoholic hepatitis patients). Analysis of the intestinal microbiome composition discriminated alcoholic hepatitis (PERMANOVA p-value = 0.002) from those with heavy alcohol consumption. The K-fold cross-validated random forest classification model was used to further rank individual microbiome discriminative ability. Taxa relative abundance in heavy drinking control and alcoholic hepatitis groups for the top 20 discriminating genera are displayed in Figure 4A-left panel. While most discriminating taxa were observed at low relative abundance levels, Veillonellaceae Veillonella and Bacteroidaceae Bacteroides were the most abundant taxa enriched in alcoholic hepatitis, while Lachnospiraceae Lachnospiracea incertae sedis were the most abundant taxa enriched in heavy drinking controls. Ranking of taxa genera contribution to the predictive accuracy of the model is available in the Supporting Information. Alcoholic hepatitis could thus be distinguished from heavy drinking controls with a relatively high predictive accuracy based on microbiome composition alone (final model AUC = 0.826; see Figure 4B).
Fig 4.
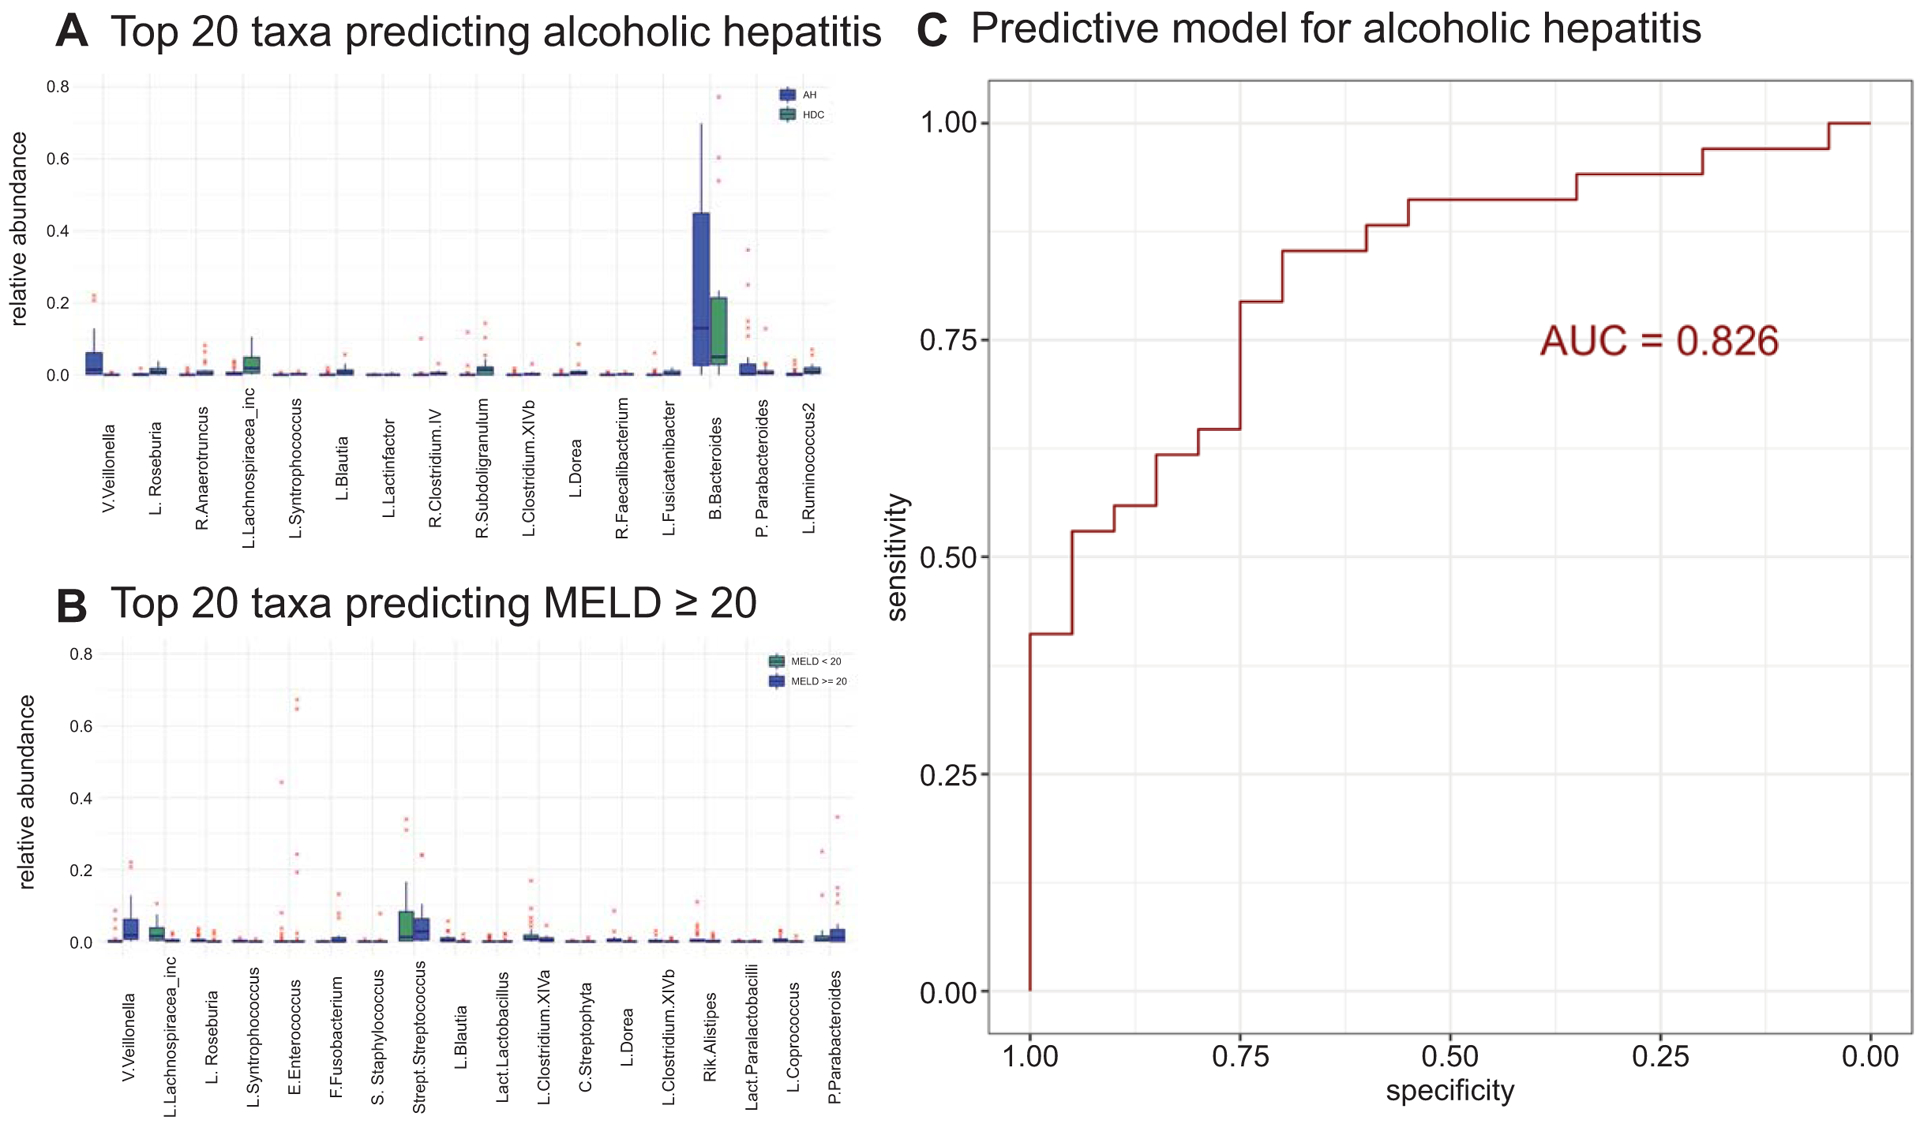
Genus level random forest predictive modeling of AH. (A) Relative abundance for top 20 taxa for the prediction model of AH (left panel) and MELD score (right panel). Taxa arranged on the x‐axis in decreasing order of importance for pre‐ dictive modeling (that is taxa to the left are most important). (B) Re‐ ceiver operating characteristic (ROC) curve for the predictive model of AH. Larger area under the ROC curve (AUC) value corresponds to stronger predictive ability of the model to discriminate HDC from AH patients. Abbreviations: B., Bacteroidaceae; C., Chloroplast; E., Enterococcaceae; F., Fusobacteriaceae; L., Lachnospiraceae or Lachnospiraceae unknown; Lachnospiracea inc, Lachnospiracea incertae sedis; Lact., Lactobacillaceae unknown; P., Porphyromonadaceae; R., Ruminococcaceae unknown or Ruminococcaceae; Rik., Rikenellaceae; S., Staphylococcaceae; Strept., Streptococcaceae; V., Veillonellaceae.
Impact on treatment of alcoholic hepatitis on the fecal microbiome:
We further evaluated the use of steroids and pentoxifylline in this population. 10 patients received steroids (severe alcoholic hepatitis = 7), 3 patients received pentoxifylline (severe alcoholic hepatitis = 3), and 2 patients received both steroids and pentoxifylline (severe alcoholic hepatitis = 2). Principal components coordinate analysis beta diversity plots indicated that the taxa in these patients clustered differently from other patients with similar severity of alcoholic hepatitis. This is included as supplementary Figure 2 (B). These differences were driven by a decrease in Lachnospiraceae (Blautia, ClostridiumXlVa, Lachnospiracea_incertae_sedis), Erysipelotrichaceae and Bacteroidaceae Bacteroides; and an increase in Synergistaceae Aminiphilus and Prevotellaceae Paraprevotella in patients on Pentoxyfilline. For patients on steroids, the differences were driven by a decrease in Coriobacteriaceae Collinsella, Rikenellaceae Alistipes, Ruminococcaceae Butyricicoccus, Lachnospiraceae Fusicatenibacter and an increase in Veillonellaceae Veillonella in these patients. However, these differences did not contribute to the overall differences between heavy drinking controls and alcoholic hepatitis and removing these patients maintained the separation of alcoholic hepatitis patients from heavy drinking controls (PERMANOVA = 0.001).
Microbiome composition was associated with MELD score in alcohol-consuming groups
Using the MELD score as a surrogate for underlying alcoholic hepatitis, we also examined the microbial composition in all alcohol consuming groups (i.e. heavy drinking controls, moderate and severe alcoholic hepatitis patients). The random forest regression model (R2= 31.55%) for the MELD score prediction based on intestinal microbiota at genus level identified Veillonellaceae Veillonella, Lachnospiraceae Lachnospiracea incertae sedis, Streptococcaceae Streptococcus and Bacteroidaceae Bacteroides as the most abundant genera among the top 20 taxa that contribute to the predictive accuracy of the model (Figure 4A-right panel).
Microbiome composition does not distinguish between moderate and severe alcoholic hepatitis categories
To further answer the question if the microbial composition was linked to the severity of alcoholic hepatitis once it developed, we examined the relationship between the fecal microbial composition and categories of alcoholic hepatitis severity (18). In contrast to the analysis above (Figure 4), this analysis focused on those with either moderate or severe alcoholic hepatitis only. Two modeling approaches were taken: 1) a prediction model to identify mild to moderate versus severe alcoholic hepatitis; and 2) a prediction model of MELD score as a continuum. Results indicate that intestinal microbiome composition is not a sufficient factor for discriminating mild to moderate alcoholic hepatitis categories (PERMANOVA p-value = 0.785). We further evaluated the association between microbiota and MELD score as a continuum using Random Forest regression. Overall, the model was not significant (p=0.776) with low association (R2= 0.33%) indicating that while microbiome composition changed with development of alcoholic hepatitis, it was not a predictor of the severity of the disease.
Link between differences in taxonomic composition and fecal metabolites
To infer the functional relevance of shifts in microbial ecology with disease severity, we analyzed targeted fecal metabolites (short chain fatty acids (SCFA) to characterize the functional consequences of differences in the taxonomic distribution and stool microbiota. SCFA’s were selected for targeted metabolomics due to their known role in: 1) the integrity of the intestinal epithelial barrier, gut and systemic inflammatory responses including hepatic inflammation and hepatic metabolism (24, 25). Furthermore, our data indicated that alcoholic hepatitis was associated with a significant decrease in Lachnospiraceae and Ruminococcaceae families (Figure 3, column2 and Figure 5a), which are well known SCFA producers in the intestine (26).
Fig 5.
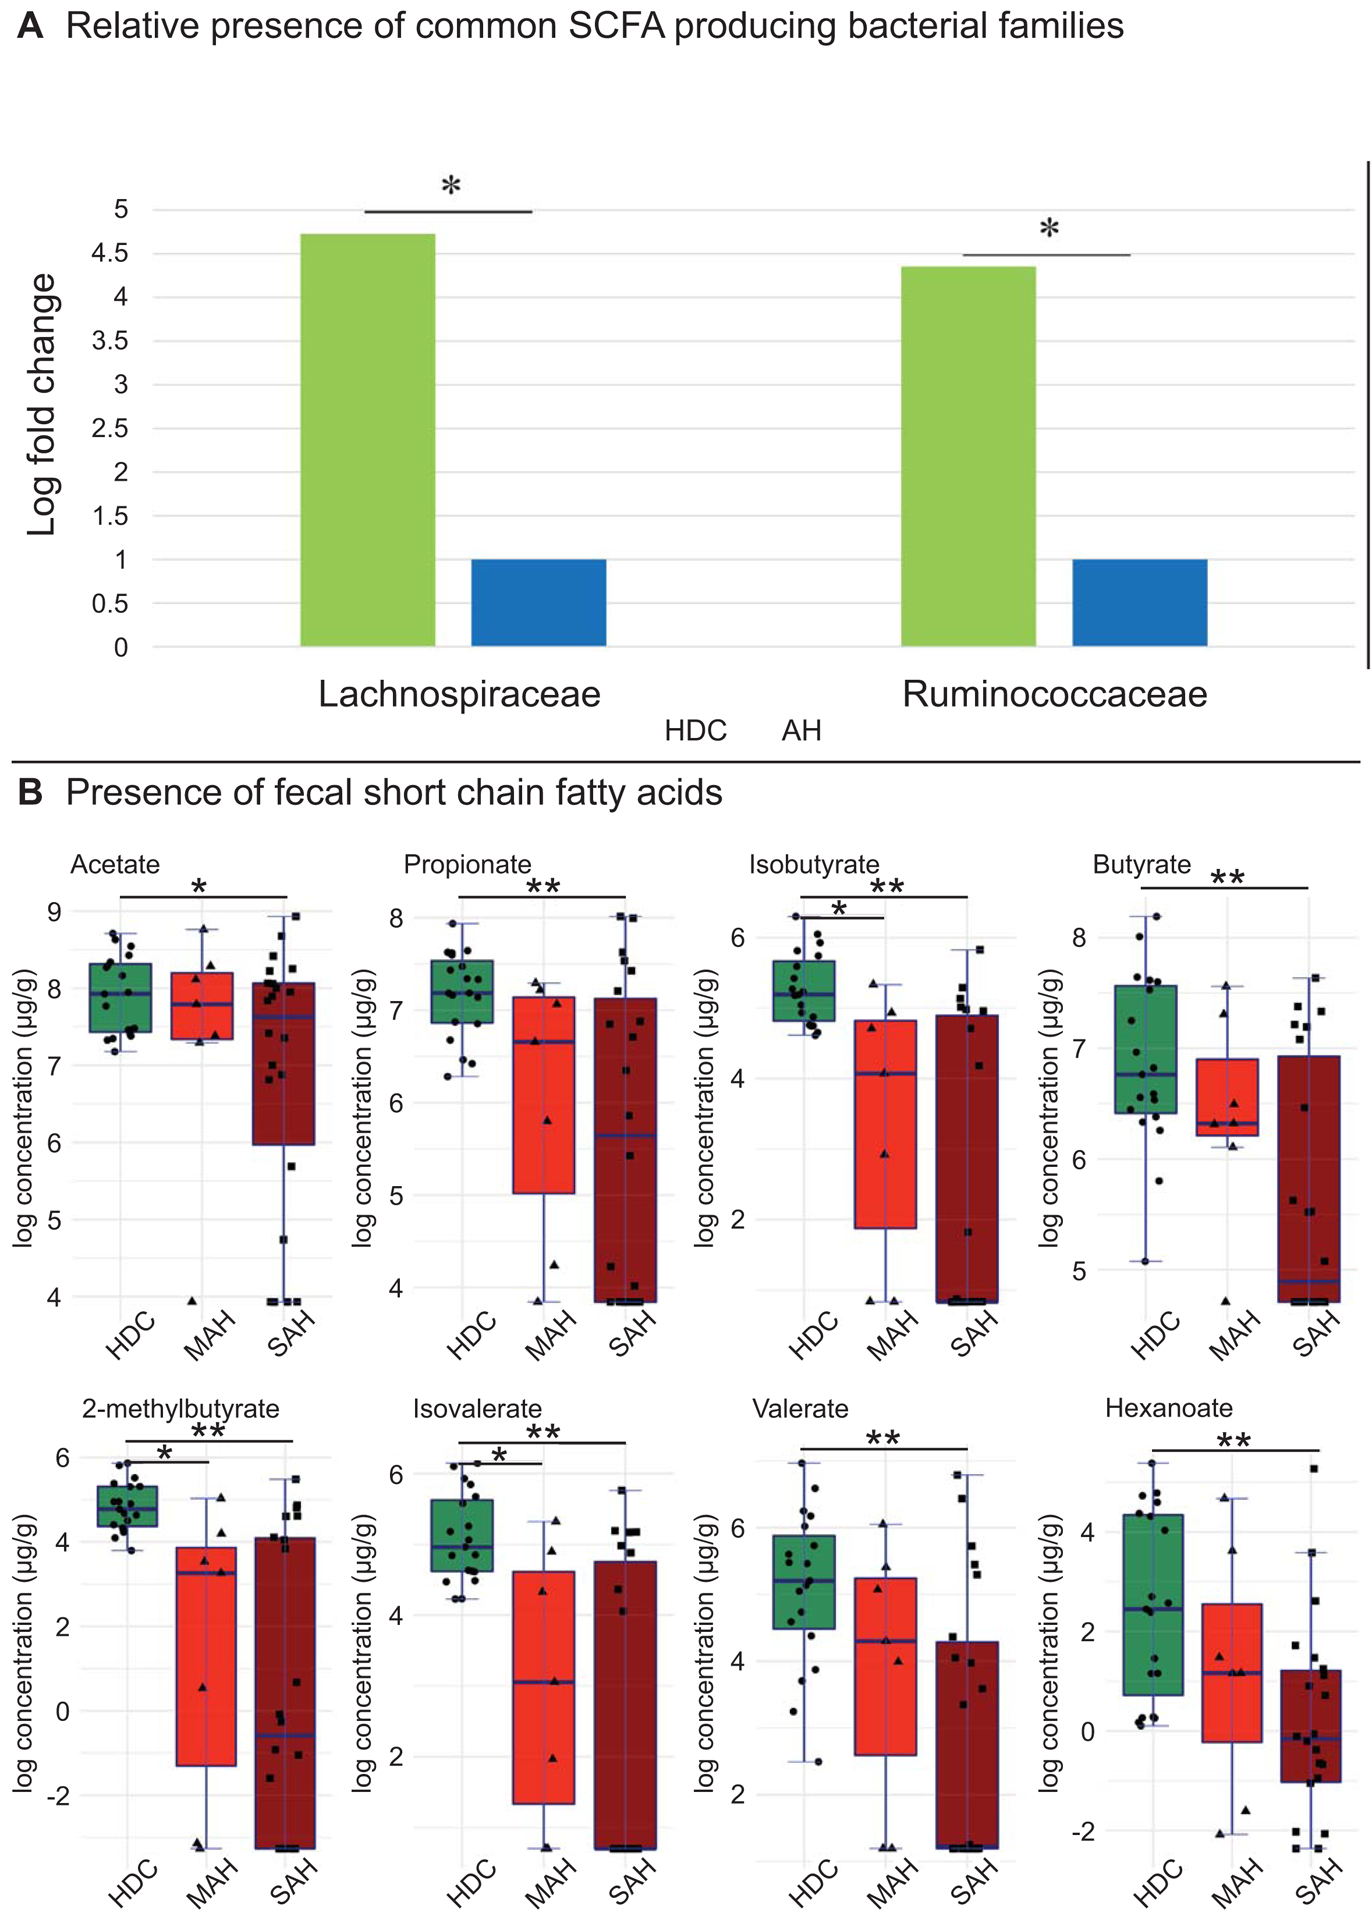
Changes in microbiota linked to functional changes in stool metabolites. (A) Comparison of Lachnospiraceae and Ruminococcaceae families (LEfSe log fold change) between heavy drinking controls and alcoholic hepatitis patients (MAH and SAH combined). (B) Targeted stool metabolomics of short chain fatty acids (log concentration) compared between heavy drinking controls, moderate and severe alcoholic hepatitis patients. Horizontal segment endpoints in each plot represent the significant results for comparison between groups used in two sample t‐test (eg. for acetate: between HDC and SAH). Significance codes: * 0.01< P ≤ 0.05, **P ≤ 0.01.
Among MAH patients, 7 out of 20 genera within the Lachnospiraceaea family (where repeat genera such as Lachnospiraceaea blautia and Lachnospiraceaea unknown blautia were considered as the same organism) and 4 out of 18 genera within the Ruminococcaceae were reduced (Figure 3, column 3). In SAH patients, 15 out of 20 genera within the Lachnospiraceaea family and 14 out of 18 genera within the Ruminococcaceae were reduced (Figure 3 column 4). Lachnospiraceae Roseburia were significantly reduced in both MAH and SAH as compared to HDC, while Ruminococcaceae Faecalibacterium was only reduced in SAH as compared to HDC. A more detailed comparison between specific genera within Lachnospiraceae and Ruminococcaceae families across these groups is provided in the Supporting Information.
Apart from Lachnospiraceae and Ruminococcaceae families, other known SCFA producing bacteria Erysipelotrichaceae Catenibacterium was also reduced in SAH as compared to HDC, but not in MAH as compared to HDC. However, the known SCFA producing bacteria Veillonellaceae Veillonella and Veillonellacaeae Megasphaera were enriched in both MAH and SAH as compared to HDC.
Concurrently, there was a significant decrease in all measured SCFAs detected in stool of patients with SAH as compared to HDC, namely acetate, propionate, butyrate, isobutyrate, 2-methylbutyrate, isovalerate, valerate and hexanoate (Fig 5b). Comparing MAH to HDC patients, a significant decrease was seen in 3 of these fecal metabolites, namely isobutyrate, 2-methylbutyrate, and isovalerate. However, there was no significant difference in fecal SCFA concentrations between MAH and SAH.
Functional intestinal metagenome in alcohol consuming subjects
Inferred metagenomic analysis using PICRUSt was performed to predict the functional potential of the intestinal metagenome in relation to the alcohol consumption and presence of alcoholic hepatitis. These are shown in Figure 6.
Fig 6.

LEfSe plots of pairwise analysis for the inferred metagenome metabolic pathway for (1) HD versus Alcoholics (HDC, MAH and SAH combined); (2) HDC versus AH (MAH and SAH combined); (3) HDC versus MAH; (4) HDC versus SAH; and (5) MAH versus SAH colored by the enrichment in corresponding group. The family and subsequent genus levels are sorted alphabetically, and the corresponding LDA scores for each pairwise analysis are indicated in columns to the right according to level of alcohol use (LDA score > 2.0; P < 0.05). Longer bar size corresponds to larger degree on enrichment in that group.
Number of metabolic pathways decreases with alcohol consumption
Multiple amino acid metabolism pathways including alanine, aspartate and glutamate metabolism, amino acid related enzymes, arginine and proline, cysteine and methionine, glycine, serine and threonine, histidine, phenylalanine tyrosine and tryptophan biosynthesis pathways were enriched in healthy controls compared to those who consumed alcohol regardless of disease status, while a single tryptophan metabolic pathway was enriched in the latter group. Among carbohydrate pathways, amino and nucleotide sugars as well as starch and sucrose metabolism was enriched in healthy controls, while ascorbate and aldarate and propanoate metabolism were enriched in alcohol consuming groups. Sphingolipid metabolism was enriched in healthy controls, while Biosynthesis of unsaturated fatty acids and fatty acids was enriched in the groups with alcohol consumption. Finally, multiple energy metabolic pathways were enriched in healthy controls. Most xenobiotics pathways were also enriched in this group.
Development of alcoholic hepatitis leads to additional changes in the metagenome
In comparison of heavy drinking controls versus alcoholic hepatitis (MAH + SAH), arginine and proline, lysine, phenylalanine, tyrosine and tryptophan, valine, leucine and isoleucine biosynthesis pathways were enriched in heavy drinking controls, while tryptophan metabolic, tyrosine and valine leucine and isoleucine degradation were enriched in alcoholic hepatitis. Ascorbate and aldarate and citrate acid cycle pathways were enriched in alcoholic hepatitis. Multiple energy and lipid metabolic pathways were enriched in heavy drinking controls, while glucan biosynthesis and metabolism as well as xenobiotic pathways were enriched in alcoholic hepatitis.
Comparing heavy drinking controls to moderate alcoholic hepatitis, xenobiotics biodegradation and metabolism and metabolism of terpenoids and polyketides was enriched in moderate alcoholic hepatitis. Further, comparing heavy drinking controls versus severe alcoholic hepatitis, arginine, proline, lysine, phenylalanine, tyrosine, tryptophan, valine, leucine and isoleucine biosynthesis amino acids metabolic pathways were enriched in heavy drinking controls. Tryptophan, tyrosine and valine leucine and isoleucine degradation amino acids metabolic pathways were enriched in severe alcoholic hepatitis. Lipid metabolism was enriched in heavy drinking controls, while multiple carbohydrate, glycan and xenobiotics metabolic pathways were enriched in severe alcoholic hepatitis. Finally, in comparison of moderate versus severe alcoholic hepatitis, none of metabolic pathways was significantly enriched in either group.
DISCUSSION
It is generally believed that the intestinal microbiome plays an important role in the genesis of alcoholic liver disease (27). The current study supports this paradigm and demonstrates that heavy alcohol consumption is associated with changes in the microbiome. The development of alcoholic hepatitis is further associated with changes in the intestinal microbial composition that are distinct from those associated with alcohol consumption per se. However, the microbial composition does not distinguish between moderate versus severe alcoholic hepatitis.
Most prior studies in ALD have focused on finding unique and novel bacteria or bacterial functions and attempted to relate them to disease biology. In this study, as noted by others for cirrhosis in general (11, 28), there is a decrease in bacterial diversity in those with alcoholic hepatitis. This was accompanied by decreased functionality, as determined by both inferred metagenomics and targeted metabolomics. We have further previously demonstrated this in the circulating microbiome of individuals with alcoholic hepatitis (21). It is also well established that the microbiota in the intestine have diverse functions which are required to maintain the normal symbiotic relationship between the host and the gut microbiome (29). The observed decrease in diversity in heavy drinking controls, both in terms of taxa and inferred functionality, raise the possibility that loss of the normal diverse set of functions constrict and rebalance the factors protective against liver disease versus those that are injurious thus increasing the susceptibility to alcohol-induced liver injury. In this setting, additional changes or superimposed factors such as binge drinking may trigger development of the clinical syndrome of alcoholic hepatitis. While this is only a hypothesis, it is biologically plausible and we believe worthy of future investigation in specifically designed studies.
In a prior study (21), it was found that the relative abundance of the phylum Bacteroidetes in the circulating microbiome was decreased in those with alcoholic hepatitis. The current study demonstrates similar findings in the stool in such patients further corroborating the observation. However, while there was progressive de-enrichment of Fusobacteria in the circulation from heavy drinking controls to moderate alcoholic hepatitis to severe alcoholic hepatitis, the Fusobacterial abundance was virtually undetectable in the stool of heavy drinking controls and mild-to-moderate alcoholic hepatitis patients and low abundance was noted in severe alcoholic hepatitis. The biological significance of these findings is not established. It is possible that Fusobacteria produce protective factors and their depletion in stool and blood increase propensity for alcoholic hepatitis. This remains to be experimentally verified.
The majority of genera significantly decreased in alcoholic hepatitis patients as compared to the heavy drinking controls were from the Lachnospiraceae and Ruminococcaceae families, which are well known SCFA producers in the intestine. Our SCFA targeted metabolomic analyses findings indicate that there is a decrease in SCFA in alcoholic hepatitis along with decreased levels of SCFA producing bacteria. These suggest a potential pathological role of these changes in alcoholic hepatitis. Additional future shot-gun metabolomics may reveal both loss of function as well as gain of function of the microbiome in alcoholic hepatitis.
Another noteworthy finding is that the clinically defined populations were not homogeneous in terms of the fecal microbial composition in the current study. Several patients in the alcohol drinking control group had a microbial composition similar to that of patients with alcoholic hepatitis. Some of these individuals had a MELD in the 8–10 range (ID 59 and 68 in Figure 2B) suggesting that they may have had more significant underlying liver disease than was evident based on the criteria used to define controls. There were also several patients with moderate (ID 60, 34) or severe (ID 54) alcoholic hepatitis whose microbiome resembled control populations. This raises the interesting possibility that there may be sub-populations within the larger population of individuals with clinically defined alcoholic hepatitis based on their fecal microbiome. If so, it would be relevant to evaluate in future large cohort studies, if the natural history of these individuals is different from those with a typical signature of alcoholic hepatitis and if they respond differently to specific therapeutic regimens.
This study used a clinical definition of alcoholic hepatitis based on the NIAAA consensus (17). It is however known that when a diagnosis of alcoholic hepatitis is made on clinical grounds alone, some patient may have cirrhosis with superimposed alcoholic hepatitis whereas others may have alcoholic hepatitis alone and yet others have decompensated cirrhosis. The latter possibility is less likely because patients were evaluated for clinical sepsis which is usually the decompensating factor associated with decompensated cirrhosis alone. Regardless, the signature identified in this study reflects that of a population defined clinically and some of these patients may also have cirrhosis.
An additional limitation is that metagenomics infers the functional consequences of changes in microbial taxa and does not provide a direct read-out of microbial functionality. The ability to evaluate the microbial transcriptome in stool is however challenging due to the RNAases in stool. Application of robust methods to interrogate microbial gene expression in stool and linkage to the metabolite profile in stool and urine will be needed to translate the observations of this study to understand how they lead to disease. Regardless of these limitations, the findings of this study provide novel insights in to the microbial signature of alcoholic hepatitis and allow specific hypothesis generation that set the stage for mechanistic studies and eventually targeted intervention to modulate the microbiome to alter susceptibility to disease and disease progression.
In summary, the current study provides novel information on the changes in the fecal microbiome induced by heavy alcohol consumption and the additional changes associated with development of alcoholic hepatitis of increasing severity. They provide both insights on the relationship of the fecal microbiome to disease development and progression and allow generation of specific hypotheses that will allow the field to progress and lead to a more complete understanding of the role of the fecal microbiome in alcoholic hepatitis.
Supplementary Material
Sources of funding support:
UO1 AA021891–01 to Dr. Arun Sanyal
CTSA UL1TR002649 to support Smirnova
T32 DK07150–40 to Dr. Arun Sanyal
Role of funder: The work was primarily funded by NIAAA via a UO1 grant to Dr. Sanyal. NCATS supported the VCU CTSA which provided support to Dr. Smirnova for the proposed analyses. Samples were also collected in the VCU CCTR what is supported by the CTSA award to VCU. These NIH institutes did not have a direct role in the design and conduct of the studies.
Footnotes
Access to Data: The authors will submit the data set including the meta-data and microbiome taxonomy to the NIH data warehouse. A copy will be kept at the data coordinating center of the TREAT consortium and made available to investigators after this work has been published.
Conflicts of Interest:
Dr. Ekaterina Smirnova: No conflicts to disclose
Dr. Puneet Puri: No conflicts to disclose
Dr. Mark Muthiah: No conflicts to disclose
Kalyani Daitya: No conflicts to disclose
Naga Chalasani: No conflicts to disclose
Suthat Liangpunsakul: No conflicts to disclose
Vijay Shah: No conflicts relevant to this study to disclose.
Kayla Gelow: No conflicts to disclose
Faridoddin Mirshahi: No conflicts to disclose. He has ownership interest in Sanyal Biotechnologies
Dr. Velimir Luketic: No relevant conflicts. He has received grant support from Intercept, Genfit.
Dr. Mohammed Siddiqui: No relevant conflicts. He has received grant support from Nusirt, Immuron and Taiwan J Pharmaceuticals.
Dr. Arun Sanyal: None for this project. Dr. Sanyal is President of Sanyal Biotechnology and has stock options in Tiziana, Durect, Indalo, Inversago. He has served as a consultant to Medimmune, Astra Zeneca, Nitto Denko, Nimbus, Salix, Tobira, Takeda, Terns, Conatus, Lilly, Poxel, Blade, Surrozen, Birdrock, Siemens, Madrigal, Novartis, Pfizer, Hemoshear, Novo Nordisk, Gilead, Exhalenz, Bristol Myers Squibb, Glympse and Genfit. He has been an unpaid consultant to Intercept, Zafgen, Prosciento, Iquvia, NGM Bio, Echosens, Immuron, Syntlogic, Zafgen, Zydus, Nordic Bioscience. His institution has received grant support from Gilead, Salix, Tobira, Intercept, Merck, Astra Zeneca, Zydus and Novartis.
Dr. Patrick Gillevet: No conflicts to disclose
REFERENCES
- 1.Adejumo AC, Cholankeril G, Iqbal U, Yoo ER, Boursiquot BC, Concepcion WC, Kim D, et al. Readmission Rates and Associated Outcomes for Alcoholic Hepatitis: A Nationwide Cohort Study. Dig Dis Sci 2019. [DOI] [PubMed] [Google Scholar]
- 2.Nguyen TA, DeShazo JP, Thacker LR, Puri P, Sanyal AJ. The Worsening Profile of Alcoholic Hepatitis in the United States. Alcohol Clin Exp Res 2016;40:1295–1303. [DOI] [PMC free article] [PubMed] [Google Scholar]
- 3.Lourens S, Sunjaya DB, Singal A, Liangpunsakul S, Puri P, Sanyal A, Ren X, et al. Acute Alcoholic Hepatitis: Natural History and Predictors of Mortality Using a Multicenter Prospective Study. Mayo Clin Proc Innov Qual Outcomes 2017;1:37–48. [DOI] [PMC free article] [PubMed] [Google Scholar]
- 4.Vergis N, Atkinson SR, Knapp S, Maurice J, Allison M, Austin A, Forrest EH, et al. In Patients With Severe Alcoholic Hepatitis, Prednisolone Increases Susceptibility to Infection and Infection-Related Mortality, and Is Associated With High Circulating Levels of Bacterial DNA. Gastroenterology 2017;152:1068–1077 e1064. [DOI] [PMC free article] [PubMed] [Google Scholar]
- 5.Mitchell MC, Friedman LS, McClain CJ. Medical Management of Severe Alcoholic Hepatitis: Expert Review from the Clinical Practice Updates Committee of the AGA Institute. Clin Gastroenterol Hepatol 2017;15:5–12. [DOI] [PMC free article] [PubMed] [Google Scholar]
- 6.Savolainen VT, Liesto K, Mannikko A, Penttila A, Karhunen PJ. Alcohol consumption and alcoholic liver disease: evidence of a threshold level of effects of ethanol. Alcohol Clin Exp Res 1993;17:1112–1117. [DOI] [PubMed] [Google Scholar]
- 7.Lischner MW, Alexander JF, Galambos JT. Natural history of alcoholic hepatitis. I. The acute disease. Am J Dig Dis 1971;16:481–494. [DOI] [PubMed] [Google Scholar]
- 8.Philips CA, Phadke N, Ganesan K, Augustine P. Healthy donor faecal transplant for corticosteroid non-responsive severe alcoholic hepatitis. BMJ Case Rep 2017;2017. [DOI] [PMC free article] [PubMed] [Google Scholar]
- 9.Cresci GA. The gut microbiome: a new frontier for alcohol investigation. Alcohol Clin Exp Res 2015;39:947–949. [DOI] [PMC free article] [PubMed] [Google Scholar]
- 10.Lowe PP, Gyongyosi B, Satishchandran A, Iracheta-Vellve A, Ambade A, Kodys K, Catalano D, et al. Alcohol-related changes in the intestinal microbiome influence neutrophil infiltration, inflammation and steatosis in early alcoholic hepatitis in mice. PLoS One 2017;12:e0174544. [DOI] [PMC free article] [PubMed] [Google Scholar]
- 11.Bluemel S, Wang L, Kuelbs C, Moncera K, Torralba M, Singh H, Fouts DE, et al. Intestinal and hepatic microbiota changes associated with chronic ethanol administration in mice. Gut Microbes 2019:1–11. [DOI] [PMC free article] [PubMed] [Google Scholar]
- 12.Bluemel S, Williams B, Knight R, Schnabl B. Precision medicine in alcoholic and nonalcoholic fatty liver disease via modulating the gut microbiota. Am J Physiol Gastrointest Liver Physiol 2016;311:G1018–G1036. [DOI] [PMC free article] [PubMed] [Google Scholar]
- 13.Jacobs JP, Dong TS, Agopian V, Lagishetty V, Sundaram V, Noureddin M, Ayoub WS, et al. Microbiome and bile acid profiles in duodenal aspirates from patients with liver cirrhosis: The Microbiome, Microbial Markers and Liver Disease Study. Hepatol Res 2018;48:1108–1117. [DOI] [PMC free article] [PubMed] [Google Scholar]
- 14.Ciocan D, Rebours V, Voican CS, Wrzosek L, Puchois V, Cassard AM, Perlemuter G. Characterization of intestinal microbiota in alcoholic patients with and without alcoholic hepatitis or chronic alcoholic pancreatitis. Sci Rep 2018;8:4822. [DOI] [PMC free article] [PubMed] [Google Scholar]
- 15.Ciocan D, Voican CS, Wrzosek L, Hugot C, Rainteau D, Humbert L, Cassard AM, et al. Bile acid homeostasis and intestinal dysbiosis in alcoholic hepatitis. Aliment Pharmacol Ther 2018;48:961–974. [DOI] [PubMed] [Google Scholar]
- 16.Puri P, Liangpunsakul S, Christensen JE, Shah VH, Kamath PS, Gores GJ, Walker S, et al. The circulating microbiome signature and inferred functional metagenomics in alcoholic hepatitis. Hepatology 2018;67:1284–1302. [DOI] [PMC free article] [PubMed] [Google Scholar]
- 17.Crabb DW, Bataller R, Chalasani NP, Kamath PS, Lucey M, Mathurin P, McClain C, et al. Standard Definitions and Common Data Elements for Clinical Trials in Patients With Alcoholic Hepatitis: Recommendation From the NIAAA Alcoholic Hepatitis Consortia. Gastroenterology 2016;150:785–790. [DOI] [PMC free article] [PubMed] [Google Scholar]
- 18.Dunn W, Jamil LH, Brown LS, Wiesner RH, Kim WR, Menon KV, Malinchoc M, et al. MELD accurately predicts mortality in patients with alcoholic hepatitis. Hepatology 2005;41:353–358. [DOI] [PubMed] [Google Scholar]
- 19.Gillevet P, Sikaroodi M, Keshavarzian A, Mutlu EA. Quantitative assessment of the human gut microbiome using multitag pyrosequencing. Chem Biodivers 2010;7:1065–1075. [DOI] [PMC free article] [PubMed] [Google Scholar]
- 20.Smirnova E, Huzurbazar S, Jafari F. PERFect: PERmutation Filtering test for microbiome data. Biostatistics 2018. [DOI] [PMC free article] [PubMed] [Google Scholar]
- 21.Puri P, Liangpunsakul S, Christensen JE, Shah VH, Kamath PS, Gores GJ, Walker S, et al. The circulating microbiome signature and inferred functional metagenomics in alcoholic hepatitis. Hepatology 2018;67:1284–1302. [DOI] [PMC free article] [PubMed] [Google Scholar]
- 22.Segata N, Izard J, Waldron L, Gevers D, Miropolsky L, Garrett WS, Huttenhower C. Metagenomic biomarker discovery and explanation. Genome Biol 2011;12:R60. [DOI] [PMC free article] [PubMed] [Google Scholar]
- 23.Shin SY, Fauman EB, Petersen AK, Krumsiek J, Santos R, Huang J, Arnold M, et al. An atlas of genetic influences on human blood metabolites. Nat Genet 2014;46:543–550. [DOI] [PMC free article] [PubMed] [Google Scholar]
- 24.Sahuri-Arisoylu M, Brody LP, Parkinson JR, Parkes H, Navaratnam N, Miller AD, Thomas EL, et al. Reprogramming of hepatic fat accumulation and ‘browning’ of adipose tissue by the short-chain fatty acid acetate. Int J Obes (Lond) 2016;40:955–963. [DOI] [PubMed] [Google Scholar]
- 25.van der Beek CM, Dejong CHC, Troost FJ, Masclee AAM, Lenaerts K. Role of short-chain fatty acids in colonic inflammation, carcinogenesis, and mucosal protection and healing. Nutr Rev 2017;75:286–305. [DOI] [PubMed] [Google Scholar]
- 26.Flint HJ, Duncan SH, Scott KP, Louis P: Links between diet, gut microbiota composition and gut metabolism In: Proc Nutr Soc. Volume 74 England, 2015; 13–22. [DOI] [PubMed] [Google Scholar]
- 27.Brenner DA, Paik YH, Schnabl B. Role of Gut Microbiota in Liver Disease. J Clin Gastroenterol 2015;49 Suppl 1:S25–27. [DOI] [PMC free article] [PubMed] [Google Scholar]
- 28.Fan X, Peters BA, Jacobs EJ, Gapstur SM, Purdue MP, Freedman ND, Alekseyenko AV, et al. Drinking alcohol is associated with variation in the human oral microbiome in a large study of American adults. Microbiome 2018;6:59. [DOI] [PMC free article] [PubMed] [Google Scholar]
- 29.Hartmann P, Chu H, Duan Y, Schnabl B. Gut microbiota in liver disease: too much is harmful, nothing at all is not helpful either. Am J Physiol Gastrointest Liver Physiol 2019;316:G563–G573. [DOI] [PMC free article] [PubMed] [Google Scholar]
Associated Data
This section collects any data citations, data availability statements, or supplementary materials included in this article.