

Abstract
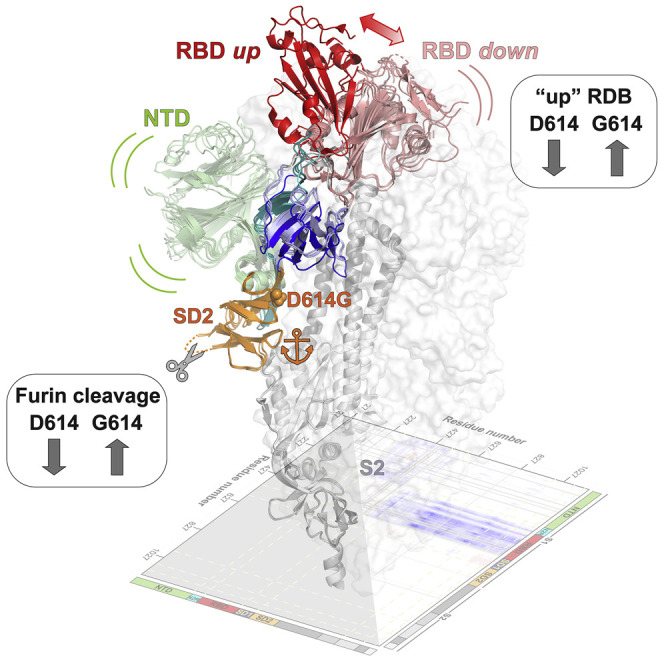
The severe acute respiratory coronavirus 2 (SARS-CoV-2) spike (S) protein is the target of vaccine design efforts to end the coronavirus disease 2019 (COVID-19) pandemic. Despite a low mutation rate, isolates with the D614G substitution in the S protein appeared early during the pandemic and are now the dominant form worldwide. Here, we explore S conformational changes and the effects of the D614G mutation on a soluble S ectodomain construct. Cryoelectron microscopy (cryo-EM) structures reveal altered receptor binding domain (RBD) disposition; antigenicity and proteolysis experiments reveal structural changes and enhanced furin cleavage efficiency of the G614 variant. Furthermore, furin cleavage alters the up/down ratio of the RBDs in the G614 S ectodomain, demonstrating an allosteric effect on RBD positioning triggered by changes in the SD2 region, which harbors residue 614 and the furin cleavage site. Our results elucidate SARS-CoV-2 S conformational landscape and allostery and have implications for vaccine design.
Keywords: COVID-19, SARS-CoV-2, spike, 2P, D614G, allostery, furin cleavage, cryo-EM
Graphical Abstract
Highlights
-
•
SARS-CoV-2 S 2P mutations do not impact its structure, stability, or antigenicity
-
•
D614G mutation increases RBD “up” state and enhances S1/S2 junction proteolysis
-
•
Structure and antigenicity reveal allostery between the S1/S2 junction and RBD
-
•
SD2 anchors the mobile RBD and NTD, separating large S1 subunit motions from S2
SARS-CoV-2 spike undergoes large conformational changes during cell fusion. Gobeil et al. identify a subdomain anchor that limits large motions in the receptor binding subunit of the pre-fusion spike from propagating to its fusion subunit. They demonstrate that the D614G mutation increases the rate of furin cleavage, which may impact infectivity.
Introduction
The severe acute respiratory coronavirus 2 (SARS-CoV-2) belongs to the β-coronavirus family of enveloped, positive-sense single-stranded RNA viruses and has one of the largest genomes among RNA viruses (de Wit et al., 2016). Of the seven known coronaviruses that infect humans, four (HCov-229E, HCoV-OC43, HCoV-NL63, HCoV-HKU1) circulate annually, causing generally mild respiratory symptoms in otherwise healthy individuals, whereas the SARS-CoV-1 and Middle East respiratory syndrome coronavirus (MERS-CoV), which are closely related to SARS-CoV-2, have resulted in the 2002–2003 SARS and 2012 MERS epidemics (Zumla et al., 2016), respectively. The ongoing pandemic of coronavirus disease 2019 (COVID-19) is a global public health emergency, with more than 85 million cases and 1.8 million deaths recorded worldwide (Dong et al., 2020) (https://coronavirus.jhu.edu).
The surface of the SARS-CoV-2 is decorated with the spike (S) glycoprotein (Ke et al., 2020; Turoňová et al., 2020) that is the target of most current vaccine development efforts (Corbett et al., 2020; Sempowski et al., 2020). In its pre-fusion conformation, the SARS-CoV-2 S protein is a large homo-trimeric glycoprotein forming a crown (from the Latin corõna) at the surface of the virus capsid. Each S protomer is subdivided into two domains, S1 and S2, which are delimited by a multibasic furin cleavage site at residues 682–685 (Figure 1 ). The S1 domain comprises the N-terminal domain (NTD), an NTD-to-receptor binding domain (RBD) linker (N2R), the RBD, and subdomains 1 and 2 (SD1 and SD2). The S2 domain contains a second protease cleavage site (S2′) followed by the fusion peptide (FP), heptad repeat 1 (HR1), the central helix (CH), the connector domain (CD), heptad repeat 2 (HR2), the transmembrane domain (TM), and a cytoplasmic tail (CT) (Figure 1). The S1 domain is responsible for recognition and binding to the host-cell angiotensin-converting enzyme 2 (ACE2) receptor. The S2 domain is responsible for viral-host-cell membrane fusion and undergoes large conformational changes (Hoffmann et al., 2020a) but only upon furin cleavage and further essential processing by cleavage at the S2′ site by TMPRSS2 and related proteases (Bestle et al., 2020; Hoffmann et al., 2020b; Matsuyama et al., 2020). Previous reports have demonstrated the central role of the dynamics of the RBD domains between a “closed” (or all RBD-down receptor inaccessible conformation) and an “open” (or RBD-up) conformation for recognition and binding to the host cell ACE2 receptor (Gui et al., 2017; Shang et al., 2020; Yuan et al., 2017).
Figure 1.

SARS-CoV-2 Spike (S) Protein Ectodomain Platform for Characterizing the Structures, Antigenicity, and Protease Susceptibility of the S Protein and D614G Mutant
(A) Domain architecture of the SARS-CoV-2 S protomer. The S1 subunit contains a signal sequence (SS), the NTD (N-terminal domain, pale green), N2R (NTD-to-RBD linker, cyan), RBD (receptor-binding domain, red), and SD1 and SD2 (subdomains 1 and 2, dark blue and orange) subdomains. The S2 subunit contains the FP (fusion peptide, dark green), HR1 (heptad repeat 1, yellow), CH (central helix, teal), CD (connector domain, purple), and HR2 (heptad repeat 2, gray) subdomains. The transmembrane domain (TM) and cytoplasmic tail (CT) have been truncated and replaced by a foldon trimerization sequence (3), an HRV3C cleavage site (HRV3C), a his-tag (His), and a strep-tag (Strep). The D614G mutation is in the SD2 domain (yellow star, green contour). The S1/S2 furin cleavage site (RRAR; red lightning) has been mutated to GSAS (blue lightning) or to an HRV3C protease cleavage site (yellow lightning). The K986P-V987P mutations between the HR1 and CH domains are indicated by a yellow star (red contour) on the S-GSAS/PP template.
(B) Representation of the trimeric SARS-CoV-2 S ectodomain with one RBD-up in a prefusion conformation (PDB: 6VSB). The S1 domain on an RBD-down protomer is shown as pale green molecular surface, while the S2 domain is shown in pale red. The subdomains on an RBD-up protomer are colored according to (A) on a ribbon diagram. Each inset corresponds to the S regions understudy and is highlighted in red on the trimeric structure (K986P-V987P, D614G, and the furin protease cleavage site).
Since the early stages of the COVID-19 pandemic, virus evolution has been followed by large-scale sequencing of the virus genomes isolated from patients, and several mutations that arose and propagated within different populations have been identified even though the virus has genetic proofreading mechanisms (Elbe and Buckland-Merrett, 2017; Korber et al., 2020). The D614G mutation in particular has attracted attention because it has quickly become the dominant variant of SARS-CoV-2 circulating worldwide (Korber et al., 2020). The D614G mutation of the S protein has been associated in numerous reports with increased fitness and/or infectivity of the virus (Korber et al., 2020; Li et al., 2020; Weissman et al., 2020). Cryoelectron microscopy (cryo-EM) structures of the S glycoprotein ectodomain have revealed that D614 is a surface residue in the vicinity of the furin cleavage site. Mutation of this residue to a glycine disrupts critical interprotomer hydrogen bond involving I834, Y837, or T859 of the S2 domain and results in a shift in the observed equilibrium between the open and closed state of the S protein ectodomain (Johnson et al., 2020; Korber et al., 2020; Weissman et al., 2020; Yurkovetskiy et al., 2020; Zhou et al., 2020) (Figure 1).
Most structures of the SARS-CoV-2 S ectodomain currently available include two mutations, one to disrupt the furin cleavage site (RRAR to GSAS = S-GSAS) and a double proline mutation (PP) of residues 986–987, designed to prevent conformational change to the post-fusion state (Wrapp et al., 2020). Originally designed for the MERS S protein (Pallesen et al., 2017), insertion of two consecutive Pro mutations at the junction of the HR1 and CH regions stabilized the pre-fusion conformation of the MERS, SARS, and HCoV-HKU S; increased protein expression and improved immunogenicity for the MERS S protein (Pallesen et al., 2017). Based on these prior data, introduction of two consecutive proline residues at the beginning of the CH was postulated as a general strategy for retaining β-coronavirus S proteins in the pre-fusion conformation. Thus, the PP mutations were carried over to the SARS-CoV-2 ectodomain (Wrapp et al., 2020) that is currently widely used in the field for vaccine and structural studies and is also the component of a vaccine candidate (Corbett et al., 2020). Although shown to stabilize the pre-fusion conformation of other coronaviruses, the effect of the PP insertion has not been systematically studied for the SARS-CoV-2 S ectodomain.
With the goal of investigating the biophysical and structural consequences of the D614G mutation and to prevent the engineered PP mutations from confounding our observations, we produced two SARS-CoV-2 S ectodomain constructs with the native K986 and V987 residues, incorporating either a D or a G at position 614 (Figure 1). The RRAR sequence in the furin cleavage site was replaced by a GSAS sequence, thus rendering the S constructs furin-cleavage deficient. To probe the effect of the D614G substitution on furin cleavage of the S protein, we either reinstated the native furin sequence or replaced it with an exogeneous HRV3C proteolysis cleavage site. We determined the cryo-EM structures of the uncleaved D614 and G614 S ectodomains, as well as the structure of the fully cleaved G614 S ectodomain, of the currently globally dominant SARS-CoV-2. Our results demonstrate the effect of the D614G substitution on S conformational diversity and furin cleavage susceptibility of the S ectodomain and reveal insights into the allostery between RBD motions and distal regions of the S protein.
Results
Structure and Stability of the SARS-CoV-2 S Ectodomain Incorporating the Native K986 and V987 Residues
Although the SARS-CoV-2 S ectodomain construct that includes mutations of residues K986 and V987, between the HR1 and CH subdomains (S2 domain), to two prolines (PPs) (named S-GSAS/PP in this study) (Figure 1) is widely used in the field, the origin of this PP construct was based upon the stabilization of the pre-fusion conformation of other coronavirus S proteins (Pallesen et al., 2017; Walls et al., 2020; Wrapp et al., 2020). Here, we generated an analogous S ectodomain construct that had the native K986 and V987 residues (named S-GSAS) (Figure 1).
In our 293F expression system (see STAR Methods for details), both the S-GSAS/PP and S-GSAS constructs expressed at similar levels, yielding about 3 mg final protein per liter of culture. Both proteins also showed similar migration profiles on SDS-PAGE and by size-exclusion chromatography (SEC) on a Superose 6 column (Figures 2A and 2B). Negative stain electron microscopy (NSEM) confirmed a high-quality S preparation for the S-GSAS construct reporting 80%–90% intact pre-fusion S trimers using NSEM quality-control metrics that we have described earlier (Edwards et al., 2020). The rest of the particle picks were classified as junk particles with no post-fusion S visible in the NSEM micrographs (Henderson et al., 2020; Wrapp et al., 2020) (Figure 2C; Data S1). This finding differs from previous observations for MERS and the SARS-CoV-1 ectodomains, which showed a mixture of the pre-fusion and postfusion conformations unless the PP mutation was included (Pallesen et al., 2017). Binding of S-GSAS and S-GSAS/PP was measured by ELISA to ACE2 and CR3022, both requiring an RBD-up conformation, Ab712199 and Ab511584, two antibodies isolated from a COVID-19 convalescent donor with epitopes mapping to the ACE2 binding site and S2 domain, respectively (Edwards et al., 2020), and 2G12, binding to a quaternary S2 glycan epitope (Acharya et al., 2020), were all nearly identical, demonstrating that both constructs showed similar antigenic behavior (Figure 2D). Using differential scanning fluorimetry (DSF) to measure the S thermostability, we found the S-GSAS and S-GSAS/PP ectodomains showed similar melting temperatures (Figure 2E).
Figure 2.

Biophysics, Antigenicity, and Structure of the S-GSAS Ectodomain in Relation to S-GSAS/PP
(A) Size-exclusion chromatography (SEC) elution profile on a Superose 6 10/300 column of the S-GSAS/PP (black) and S-GSAS (red) ectodomains. Fractions isolated for further characterization are indicated by vertical red dotted lines. Elution volumes of molecular weight standards at 669 (thyroglobulin) and 44 kDa (ovalbumin) are labeled for reference.
(B) SDS-PAGE of the SEC purified ectodomains.
(C) Representative NSEM micrograph of S-GSAS and 2D class averages (related to Data S1).
(D) Binding of ACE2 receptor ectodomain (RBD-directed), CR3022 (RBD-directed neutralizing antibody), 2G12 (S2-directed), Ab712199 (RBD-directed neutralizing antibody), and Ab511584 (S2-directed non-neutralizing antibody) to S-GSAS (red) and S-GSAS/PP (black) measured by ELISA. The schematic shows the assay format. Serially diluted S protein was bound in individual wells of 384-well plates, which were previously coated with streptavidin. Proteins were incubated and washed; then antibodies at 10 μg/mL or ACE2 with a mouse Fc tag at 2 μg/mL were added. Antibodies were incubated and washed, and binding was detected with goat anti-human horseradish peroxidase (HRP).
(E) Differential scanning fluorimetry (DSF) of the S-GSAS (red) and S-GSAS/PP (black) S ectodomains. Thermal melting inflection points (Ti) are indicated on the first derivative graph and reported in the table below from a triplicate.
(F) Side and top view of the cryo-EM reconstructions of the 1-RBD-up (EMD:22822) and the 3-RBD-down (EMD:22821) states of the S-GSAS ectodomain colored by chain. The up positioned RBD in the map is identified by an asterisk (related to Table S1 and Data S1).
(G) Superposition of the 1-up (left; PDB: 7KDH and 6VYB) and 3-down (right; PDB: 7KDG and 6VXX) structures of S-GSAS (red) and S-GSAS/PP (green). All Cα atoms were used for the superpositions.
(H) Magnified view of one protomer from the 1-RBD-up model showing residues K986 and V987 from S-GSAS (colored according to F, overlaid with S-GSAS/PP; PDB: 6VYB; yellow), showing residues P986 and P987 in sticks (related to Figure S1).
Next, we solved cryo-EM structures of the S-GSAS ectodomain (Figures 2F–2H; Data S1; Table S1), to compare with the S-GSAS/PP structures (Walls et al., 2020; Wrapp et al., 2020) and to visualize the impact that the engineered PP mutations had on the structure of the SARS-CoV-2 S ectodomain. Two populations of the S-GSAS S ectodomain were identified in the cryo-EM dataset: a “1-RBD-up” (or open) and a “3-RBD-down” (or closed) conformation (Figure 2F; Table S1). Both structures were similar to the corresponding structures of S-GSAS/PP (Walls et al., 2020), with overall root-mean-square deviations (RMSDs) of 0.45 and 0.54 Å for the 1-up and 3-down structures, respectively (Figure 2G). In the region around the PP mutations, we found the S-GSAS structures to be similar to the corresponding S-GSAS/PP structures (Figure 2H). In the S-GSAS 1-RBD-up structure, we observed that the K986 side chain was appropriately positioned to make an interprotomer salt bridge with the D427 residue of the RBD of the adjacent protomer, an interaction that would be abrogated in the PP construct. The corresponding residues in the MERS S protein, V1060 and L1061, are non-polar, and the adjacent protomers are too far to interact with these residues (Figure S1). In the SARS-CoV-1 S protein cryo-EM structure (PDB: 5XLR and 5X5B), the residues D414–D415 (equivalent to SARS-CoV-2 D427–D428) lie farther from K986, suggesting that this putative salt bridge interaction may be more transient in SARS-CoV-1.
Overall, our data show that for the SARS-CoV-2 S ectodomain, the S-GSAS construct shows similar structural, antigenic, and stability behavior as the S-GSAS/PP construct that included the K986P and V987P mutations at the junction of the CH and HR1 regions. Although these and analogous mutations had proved beneficial for the expression and stability of other CoVs (Pallesen et al., 2017), for the SARS-CoV-2 S protein, other compensating interactions may help confer stability to the pre-fusion form in the absence of the PP mutations. For the rest of this study we have used the S-GSAS construct as the platform for introducing mutations and other modifications of interest.
The SARS-CoV-2 S Glycoprotein D614G Mutation
To understand the molecular details of the S D614G mutation that arose and quickly dominated circulating SARS-CoV-2 isolates globally, we sought to assess the impact of the D614G mutation on the structure and antigenicity of the SARS-CoV-2 S ectodomain. The D614G mutated S-GSAS construct (S-GSAS/D614G) yielded an average of ∼2 mg of purified protein per liter of culture (n = 4). The SDS-PAGE, SEC, and DSF profiles of the S-GSAS/D614G (Figure 3 A) were similar to that of the S-GSAS S ectodomain (Figures 2A, 2B, and 2E). NSEM of the S-GSAS/D614G S ectodomain revealed typical and well-dispersed pre-fusion S particles (Figure 3B; Data S2).
Figure 3.

Biophysics and Structure of the S-GSAS/D614G Ectodomain
(A) (Left) SEC elution profile on a Superose 6 10/300 column of the S-GSAS/D614G (blue) ectodomain. Fractions isolated for further characterization are indicated by vertical red dotted lines. Elution volumes of standard at 669 and 44 kDa are labeled for reference. (Middle) SDS-PAGE of the SEC purified ectodomain. (right) Differential scanning fluorimetry (DSF) of S-GSAS/D614G (blue). Thermal melting inflection points (Ti) are indicated on the first derivative graph and reported in the table below from a triplicate.
(B) Representative NSEM micrograph of S-GSAS/D614G and 2D class averages (related to Data S2).
(C) Side view of the cryo-EM reconstruction of the 1-RBD-up (EMD: 22826) and the 3-RBD-down (EMD: 22825) states of the S-GSAS/D614G ectodomain colored by chain. The up positioned RBD in the map is identified by an asterisk (related to Table S1 and Data S2).
(D) (Left) Top view of the 1-RBD-up S trimer shown in (C). (Right) Subpopulations obtained by further classification (EMD: 22835, 22836, 22837, and 22838) (related to Figure S2 and Data S3).
(E) (Left) Top view of the 3-RBD-down S trimer shown in (C). (Right) Subpopulations obtained by further classification (EMD: 22831, 22832, 22833, and 22834) (related to Figure S2 and Data S3).
To visualize structural details at higher resolution, we determined the cryo-EM structures of S-GSAS/D614G construct (Figures 3C–3E; Table S1; Data S2). Two major populations of the S ectodomain were identified in the cryo-EM dataset: one population with one RBD in the “up” or ACE2 receptor-accessible conformation and the other with all three RBDs in the “down” or receptor-inaccessible conformation. Despite extensive classifications, including searching with low-pass-filtered maps of 2-up and 3-up S ectodomains, no populations of the typical 2-RBD-up or 3-RBD-up S were identified in the cryo-EM dataset, although we did identify a population with 1-RBD-up and another RBD in a partial “up” position (Figure 3D). This is in contrast with cryo-EM results of the D614G mutation published in the context of a S-GSAS/PP S that show S populations with 2- or 3-RBDs in the “up” state (Yurkovetskiy et al., 2020), suggesting that the PP mutations (K986P, V987P) may have a role in increasing the propensity of the RBD “up” forms. Indeed, restoring the interactions the K986 side chain makes with the RBD from the adjacent protomer may play a role in stabilizing the RBD “down” conformation in the S-GSAS S. The 1-RBD-up population consisted of 613,271 particles and resolved to an overall resolution of 3.0 Å, whereas the 3-RBD-down population consisted of 782,485 particles and was refined to an overall resolution of 2.8 Å with C3 symmetry applied (Figure 3C; Data S2). Both the up and down populations showed considerable heterogeneity in the S1 subunit, primarily originating from the variability in the positions of the RBD and NTD, which could be partially resolved by further classification and separation of subpopulations with different dispositions of the RBD and NTD even though falling broadly under the 1-up and 3-down categories (Figures 3D and 3E; Figure S2; Data S3). These further classifications not only allowed us to visualize the variability in the NTD and RBD positions that account for the poorer density for the S1 subunit in the consensus structures (Figure 3C), but they also allowed identification of unique subpopulations, including one with a 1-up and a partially up RBD (Figure 3D) and a 3-down population with 1 RBD disordered (Figure 3E). Comparing with the S-GSAS dataset, we observed an increased proportion of the 1-RBD-up form versus the 3-RBD-down form in the S-GSAS/D614G cryo-EM dataset. This is consistent with our previous observations made with NSEM data that showed an increase in the RBD-up population for the S-GSAS/D614G S ectodomain (Weissman et al., 2020). Our results confirm that the D614G mutation in the SD2 domain, even though distal from the RBD region, has an allosteric effect leading to alteration of up/down RBD dispositions.
To understand the nature of this allostery, we examined changes in the S protein that accompany the up and down RBD transition (Figure 4 ) by comparing the RBD-up chain in the 1-RBD-up structure with the down chains in the 1-up and the 3-down structures (Figure 3C). In each S protein protomer, the polypeptide chain folds into domains as it traverses the length of the S1 subunit before entering the S2 subunit, i.e., the NTD (residues 27–305) followed by the RBD (residues 335–521) and the SD1 (residues 529–591) and SD2 (residues 592–697) domains (Figure 4A). The NTD and RBD are connected via a 28-residue linker spanning residues 306–334 (named N2R) that stacks against the SD1 and SD2 domains (Figures 4A–4D), as it makes its way from the NTD to the RBD, essentially connecting all the individual domains in the S1 subunit, and forming “super” subdomains SD1′ and SD2′, respectively (Henderson et al., 2020). Upon overlaying the protomers with the RBD in the up position with the protomers with their RBDs in the down position by using the S2 subunit residues 908–1,035 for superpositions, we found that the down-to-up RBD motion is accompanied by a rigid body movement of the SD1′ domain resulting in a shift of up to ∼4.5 Å of the SD1 domain (Figure 4D), relative to its position in the RBD-down protomers and a shift of up to ∼7 Å in the N2R linker as it hinges to enter into the RBD. This results in a ∼20° tilt of residues 324–328 of the N2R linker region that forms part of the SD1′ super subdomain, whereas residues 311–319 of the linker that associate with the SD2 subdomain remained virtually unmoved, with only a slight tilt in the β strand accompanying large movements in the RBD and adjoining SD1′ domain (Figure 4D). Indeed, the SD2′ super subdomain that harbors the D614G mutation appears to form a conformationally invariant anchor with the highly mobile RBD and NTD domains at either end (Figure 4D). In addition, the S2 subunit remains invariant between the different protomers showing that the large movements that occur in the S1 subunit are effectively arrested by the SD2′ super subdomain conformationally invariant anchor.
Figure 4.

Domain Motions in the S-GSAS/D614G Ectodomain
(A) RBD-up chain from the structure shown in Figure 3C (PDB: 7KDL) with the S1 subunit colored by domain and the S2 subunit colored gray. RBD is colored red, NTD green, SD1 dark blue, SD2 orange, and the linker between the NTD and RBD cyan.
(B) Overlay of the individual protomers in the 1-RBD-up structure and a protomer in the C3 symmetric 3-RBD-down structure (PDB: 7KDK) shown in Figure 3C. The structures were superimposed using S2 subunit residues 908–1,035 (spanning the HR1 and CH regions). The domain colors of the up-RBD chain are as described in (A). The down-RBDs are colored salmon, and the SD1 domains from the down RBD chains are colored light blue. The linker between the NTD and RBD in the down RBD chains is colored deep teal.
(C) Zoomed-in view showing the association of the linker connecting the NTD and RBD with the SD1 and SD2 domains.
(D) Zoomed-in views of individual domains marked in (B). The N2R linker spanning residues 306–334 connects the NTD and the RBD. Residues 324–328 of the N2R linker contribute a β strand to the SD1 subdomain together forming the SD1′ “super” subdomain. Residues 311–319 of the N2R linker contribute a β strand to the SD2 subdomain together forming the SD2′ “super” subdomain.
(E) Difference distance matrices (DDMs) showing structural changes between different protomers for the structures shown in Figure 3C. The blue to white to red coloring scheme is illustrated at the bottom (related to Figure S3).
These observations are mirrored in difference distance matrices (DDMs) comparing the RBD-up and down chains (Figure 4E; Figure S3). DDM analyses (Richards and Kundrot, 1988) provide superposition-free comparisons between a pair of structures by calculating the differences between the distances of each pair of Cα atoms in a structure and the corresponding pair of Cα atoms in the second structure. The DDM analysis not only shows the large movement in the RBD region and the movement in the NTD, it also captures the movement in the SD1 domain observed in the structures. Overall, these analyses show that the D614G mutation is acquired within a key structural region, encompassing the SD2 domain and an additional β strand contributed by residues 311–319 of the N2R linker, that forms a region of relative structural stillness separating the mobile NTD and RBD, as well as isolating the motions in S1 from the S2 subunit. This distal mutation altering the RBD 1-up/3-down ratio shows that small changes in this region can translate into large allosteric effects and suggests a role for the SD2 domain in modulating RBD positioning.
Effect of the D614G Substitution on Furin Cleavage Efficiency at the S1/S2 Junction
In addition to the D614G mutation, the SD2 subdomain also harbors a multibasic furin cleavage site (residues 682–685) that separates the S1 and S2 subunits (Figure 1). Proteolytic processing of the S by furin and TMPRSS2 proteases has been shown to be important for SARS-CoV-2 infection (Bestle et al., 2020; Papa et al., 2020; Shang et al., 2020; Zumla et al., 2016). The proximity of the D614G mutation to the furin cleavage site and the increased conformational diversity observed in the cryo-EM dataset of the S-GSAS/D614G ectodomain (Figures 3C–3E) prompted us to examine the effect of the D614G substitution on furin cleavage.
Because our expression system (i.e., 293Freestyle cells) endogenously expresses furin, in order to obtain uncleaved S that we could then test for protease cleavage in vitro, we engineered a HRV3C site (eight amino acids long) to replace the furin cleavage site (four amino acids long) at the S1/S2 junction, resulting in the S-HRV3C and S-HRV3C/D614G S ectodomain constructs (Figure 1A). Both proteins expressed in 293F cells but at lower yields compared with the S-GSAS constructs (36 and 410 μg/L for the S-HRV3C and S-HRV3C/D614G proteins, respectively). SEC and SDS-PAGE profiles were similar to the S-GSAS and S-GSAS/D614G proteins, confirming well-folded and homogeneous S preparations (Figures 5A and 5B). NSEM micrographs showed characteristic kite-shaped particles (Edwards et al., 2020) for the pre-fusion S protein, and 2D classification of particles from NSEM revealed well-folded S, further confirming that S-HRV3C S retained the overall fold and structure of the S-GSAS S (Figures 5C and 5D; Data S4).
Figure 5.

The Engineered S-HRV3C/D614G Ectodomain Is More Susceptible to S1/S2 Cleavage by the HRV3C Protease Than S-HRV3C
(A) SEC elution profile on a Superose 6 10/300 column of the S-HRV3C (red) and S-HRV3C/D614G (blue) ectodomains. Fractions isolated for further characterization are indicated by vertical red dotted lines. Elution volumes of standards at 669 and 44 kDa are labeled for reference.
(B) SDS-PAGE of the SEC purified ectodomains.
(C and D) Representative NSEM micrograph of (C) S-HRV3C and (D) S-HRV3C/D614G ectodomains and 2D class averages (related to Data S4).
(E and F) SDS-PAGE of an HRV3C digestion of the (E) S-HRV3C and (F) S-HRV3C/D614G engineered ectodomains at 25°C for 24 h in the presence of 0.03 U of enzyme per microgram of ectodomain. Aliquots corresponding to 1 μg protein at the time points before HRV3C addition, at addition (0 min) and 10 min, 30 min, 60 min, 240 min, and 24 h following HRV3C addition are presented. After 24 h, 0.03 supplementary unit of the HRV3C enzyme per microgram of ectodomain was added, and aliquots were analyzed after 4 additional hours of incubation aiming at completion of the digestion (labeled Suppl.).
(G) Quantification of S protomer (200 kDa) band intensity on SDS-PAGE at the time points presented on (E) and (F) (S-HRV3C in red, S-HRV3C/D614G in blue).
NR, non-reduced sample; R, reduced sample.
To test the protease cleavage susceptibility of the HRV3C site engineered at the junction of the S1 and S2 subunits, we incubated the purified S-HRV3C and S-HRV3C/D614G S with the HRV3C enzyme and followed the digestion by analyzing aliquots taken at different time points by SDS-PAGE (Figures 5E–5G). We found that the digestion of the S-HRV3C/D614G S (Figures 5F and 5G) proceeded at a faster rate than that of the S-HRV3C S (Figures 5E–5G), with the S-HRV3C/D614G S almost 100% digested within the first 10 min of incubation, whereas the S-HRV3C constructs achieved only 50% of cleavage after 24 h, and a substantial portion remained uncleaved even upon addition of more enzyme followed by 4 additional hours of incubation. These results suggested that the D614G mutation increased the susceptibility of protease cleavage at the S1/S2 junction.
To study the effect of the D614G substitution on protease cleavage at the S1/S2 junction with the native furin site, we generated S ectodomains constructs where the furin site was restored to the native sequence, resulting in two constructs named S-RRAR and S-RRAR/D614G (Figure 1A). The proteins were expressed and purified using our usual methodology for the furin cleavage-deficient constructs (see STAR Methods). The SEC profiles (Figure 6 A) showed a higher proportion of the first higher-molecular-weight peak. A second peak eluting at a similar molecular weight as the S-GSAS S (at ∼13.8 mL elution volume) was used for further characterization. The SEC profile of the S-RRAR S preparation showed small populations of lower-molecular-weight peaks that were not observed for the S-RRAR/D614G protein (Figure 6A). On SDS-PAGE (Figure 6B), the peak corresponding to the S ectodomain showed the S-RRAR construct as having one major band at the molecular weight corresponding to the S monomer and some fainter bands corresponding to the S1 and S2 subunits, while the S-RRAR/D614G protein showed a band corresponding to the S monomer and the two bands corresponding to the molecular weights of the S1 and S2 subunits. The smaller molecular weight bands corresponding to the S1 and S2 subunits were in higher proportions in the S-RRAR/D614G S preparation compared with the S-RRAR preparation. In summary, the SEC and SDS-PAGE profiles showed that, although both the S-RRAR and S-RRAR/D614G constructs were cleaved by endogenous furin (Figure 6B) during protein expression, the S1 and S2 subunits remained together in solution (Figure 6A). Consistent with the enhanced cleavage observed for the S-HRV3C/D614G S relative to the S-HRV3C S, in the furin-site-restored Ss, we observed a higher proportion of cleaved S in S-RRAR/D614G relative to S-RRAR, suggesting that the D614G mutation makes the S more susceptible to furin cleavage. NSEM of the purified S-RRAR (Figure 6C; Data S5) and S-RRAR/D614G (Figure 6D; Data S5) confirmed that both of these furin-site-restored S- proteins formed well-folded S ectodomains.
Figure 6.

The S-RRAR/D614G Ectodomain Is More Susceptible to S1/S2 Cleavage by Furin Than S-RRAR
(A) SEC elution profile of the S-RRAR (in red) and S-RRAR/D614G (in blue) ectodomains. Fractions isolated for further characterization are indicated by vertical red dotted lines. Elution volumes of standards at 669 and 44 kDa are labeled for reference.
(B) SDS-PAGE of the SEC purified ectodomains. The S1 and S2 domains corresponding bands are identified (the left gel is a continuum of gel presented on Figure 5B; marker lane was copied).
(C and D) Representative NSEM micrograph of (C) S-RRAR and (D) S-RRAR/D614G ectodomains and 2D class averages (related to Data S5).
(E) SDS-PAGE of furin digestion of the S-RRAR and S-RRAR/D614G ectodomains at 25°C for 3 h in the presence of 0.3 U of enzyme per microgram of ectodomain in buffer containing 0.2 mM CaCl2. Aliquots corresponding to 1 μg of protein at the time points before furin addition and 3 h post-addition are presented.
(F) SEC elution profile of the S-RRAR/D614G furin digested (in blue). Fractions isolated for further characterization are indicated by vertical red dotted lines.
(G) SDS-PAGE of the S-RRAR/D614G furin digested and SEC purified ectodomain. The S1 and S2 domains corresponding bands are identified. In lane 2, the S-RRAR ectodomain was further incubated for 16 h with 0.3 U of furin per microgram of ectodomain aiming at completing the digestion.
(H) Representative NSEM micrograph and 2D class averages of the S-RRAR/D614G furin digested and SEC purified following digestion.
We next digested the SEC-purified fractions of the S-RRAR and S-RRAR/D614G ectodomains (Figures 6A–6D) in vitro by adding furin (Figure 6E). As observed for the S-HRV3C constructs, the D614 version of the S was less susceptible to cleavage than the G614 mutant for the same incubation time with the enzyme. SEC purification of the fully digested S-RRAR/D614G ectodomain revealed a peak corresponding to the ectodomain (Figure 6F). On SDS-PAGE, this peak migrated as two distinct bands corresponding to the S1 and S2 domains, thus confirming isolation of only the cleaved portion of the protein (Figure 6G). NSEM showed fully folded ectodomains for the furin-digested and SEC-purified S-RRAR/D614G protein (Figure 6H).
In summary, these results show that acquisition of the D614G mutation in the S protein SD2 domain resulted in increased furin cleavage of the S ectodomain.
Structure and Antigenicity of the Furin-Cleaved D614G S Ectodomain
To visualize the structure of the furin-cleaved S ectodomain at atomic level resolution, we obtained a cryo-EM dataset and resolved two populations of the furin-cleaved S ectodomain: a 1-RBD-up and a 3-RBD-down population (Figure 7 A; Table S1; Data S5). We observed an increased proportion of the 3-RBD-down population in the furin-cleaved S-RRAR/D614G dataset compared with the uncleaved S-GSAS/D614G ectodomain dataset. Consistent with this result, we observed reduced binding to ligands such as ACE2 and CR3022 that require the RBD to be in the up conformation for binding (Figure 7B). Decrease in binding was also observed with antibody 712199, isolated from a convalescent COVID-19 donor, with an epitope overlapping with the ACE2 binding site (Edwards et al., 2020). Antibody 2G12 that binds a quaternary glycan epitope in the S2 subunit showed a small decrease in binding with the furin-cleaved S ectodomain, whereas another COVID-19-derived S2 antibody 511584 showed an increase in binding with the furin-cleaved S ectodomain.
Figure 7.

Structure and Antigenicity of the Furin-Cleaved S-RRAR/D614G Ectodomain
(A) Side view of the cryo-EM reconstruction of the 1-RBD-up (EMD: 22824) and the 3-RBD-down (EMD: 22823) states of the furin-cleaved S-RRAR/D614G ectodomain colored by chain. The up positioned RBD in the map is identified by an asterisk. The NTDs in the asymmetric 1-RBD-up structure are labeled (related to Table S1 and Data S5).
(B) Binding of ACE2 receptor ectodomain (RBD-directed), CR3022 (RBD-directed neutralizing antibody), 2G12 (S2-directed), Ab712199 (RBD-directed neutralizing antibody), and Ab511584 (S2-directed non-neutralizing antibody) to S-GSAS/D614G (in blue) and the furin-cleaved S-RRAR/D614G ectodomain (in green) measured by ELISA. The assay format was the same as in Figure 2D.
(C) Overlay of the individual protomers in the 1-RBD-up structure (PDB: 7KDJ) and a protomer in the C3 symmetric 3-down-RBD structure (PDB: 7KDI) shown in (A). RBD-up chain with the S1 subunit colored by domain and the S2 subunit colored gray. RBD is colored red, NTD green, SD1 dark blue, SD2 orange, and the linker between the NTD and RBD cyan. The down RBDs are colored salmon, and the SD1 domains from the down RBD chains are colored light blue. The linker between the NTD and RBD in the down RBD chains is colored deep teal. Insets show zoomed-in views of individual domains similar to the depiction in Figure 4D.
(D) (Left) The protomers of the 1-RBD-up structure of the furin-cleaved S-RRAR/D614G ectodomain superimposed using residues 908–1,035 and colored by the color of their NTD as depicted in (A). Zoomed-in views show region of the SD2 domain proximal to the NTD.
We compared the different protomers in the two structures by overlaying three protomers in the asymmetric 1-RBD-up structure and one protomer from the symmetric 3-RBD-down structure using residues 908–1,035 (comprising the CH and HR1 regions) for superposition (Figure 7C). Similar to observations made with the S-GSAS/D614G S ectodomain structure, the RBD up/down motion in the furin-cleaved G614 S ectodomain was associated with a movement in the SD1 domain and in the region of the RBD-to-NTD linker that joined the SD1 β sheet. As observed for S-GSAS/D614G, the SD2 domain showed little conformational change and formed a stable motif anchoring the mobile NTD and RBD domains. These results reinforce the divergent roles that the SD1 and SD2 domains play in modulating RBD motion.
Next, we examined the region of the SD2 domain proximal to the NTD for structural changes related to NTD motion. In the symmetric 3-RBD-down S ectodomain, all NTDs are identical, each stacking against the down RBD of the adjacent promoter. In the asymmetric 1-RBD-up structure, each NTD was distinct. To distinguish between these, we named the NTDs: NTD1 was part of the up-RBD protomer. NTD1 stacked against a down RBD that contacted the up-RBD at one end and the second down-RBD at the other. NTD2 stacked against a down-RBD that contacted a down-RBD at one end, and NTD3 contacts the up-RBD (Figure 7A). Observing the NTD-proximal region on the SD2 domain (marked by a dotted square on Figure 7C) that also contacted the RBD-to-NTD linker, we noted shifts in the T602-606 loop between the different protomers. While the shifts were modest (with a maximal displacement of ∼2.2 Å), interestingly, identical trends were observed in the 1-RBD-up structures of the S-GSAS, S-GSAS/D614G, and furin-cleaved S-GSAS/D614G S ectodomains, suggesting that this region of the SD2 domain responds to NTD motion and adopts a different conformation depending on the NTD environment (Figure 7D).
Thus, these data provide further evidence for allostery in the S protein, with changes in the SD2 domain impacting RBD conformation. Although the SD2 domain remains almost structurally invariant, we observe small but reproducible changes in SD2 loops in response to RBD/NTD movement, suggesting that small changes in the SD2 region translate to large motions in the RBD/NTD region.
Discussion
Stabilized ectodomain constructs have proved to be useful tools to understand the structural properties of CoV S proteins. In particular, they have enabled high-resolution structural determination and an atomic-level understanding of the S ectodomain. They also are key components in many vaccine development pipelines. The structural similarities in the S proteins of diverse CoVs have often enabled quick translation of structural rules and ideas from one CoV S ectodomain to another. Indeed, after the onset of the recent and ongoing COVID-19 pandemic, the SARS-CoV-2 S ectodomain could be rapidly stabilized and structurally characterized by exploiting its similarities with other CoVs and following strategies that had proved successful previously (Henderson et al., 2020; Pallesen et al., 2017; Wrapp et al., 2020). Some of these stabilization strategies, such as introduction of proline residues in the fusion subunit to prevent transition from pre- to post-fusion, have been successful in stabilizing the pre-fusion conformation of diverse class I fusion proteins, including RSV F (Krarup et al., 2015), HIV-1 Env (Sanders et al., 2002), Ebola and Marburg GP (Rutten et al., 2020), influenza HA (Qiao et al., 1998), and Lassa GPC (Hastie et al., 2017). Although the underlying hypothesis for the stabilization of the S ectodomain was that introduction of two proline residues at the junction of the CH and HR1 helices would arrest conformational transition to the post-fusion form, we found that even without the PP mutations, the SARS-CoV-2 S ectodomain retains its pre-fusion form. These differences between the observed behavior of the SARS-CoV-2 S relative to other CoVs suggests that even though they retain similar overall topology and structural folds, there are differences between these CoVs that affect their structural and biological properties. Studying and accounting for these will be essential not only to understand SARS-CoV-2 but also to appreciate the nature and origin of these differences for anticipating, preparing for, and rapidly combating future CoV pandemics.
Viral surface proteins involved in receptor binding-mediated cellular entry typically consist of flexible and mobile domains that exhibit large conformational changes. Although this conformational flexibility is necessary for function, structural checkpoints are required to prevent premature activation and destabilization or unfolding of the protein structure. Conformationally silent structural islands provide the necessary stabilizing anchors for adjacent regions undergoing large motions. In this study, we have identified the SD2 domain in the SARS-CoV-2 S protein as such a conformational anchor that is spatially interspersed between the highly mobile NTD and RBD regions, while itself remaining relatively invariant in its conformation. The conformational invariability of the SD2 subdomain is reminiscent of the β sandwich structure in the HIV-1 envelope glycoprotein that connects and anchors a mobile layered architecture of the gp120 inner domain (Pancera et al., 2010). SD2 also serves to contain the movements of the RBD and NTD from the S2 subunit; thus, the S2 subunit was unchanged between the various RBD “up” and “down” protomers (Figure 4; Figure S3). This suggests a role for the SD2 domain in preventing premature triggering because of the stochastic up/down RBD motions in the SARS-CoV-2 S protein, as well as the importance of downstream events, such as ACE2 receptor engagement and TMPRSS2 protease cleavage (Bestle et al., 2020; Hoffmann et al., 2020b; Matsuyama et al., 2020), in orchestrating the full extent of pre- to post-fusion transformation. In this study, we also assigned a key role to the N2R linker that connects the NTD to the RBD within a protomer. Rather than just being a connector, this 28-residue linker is also a modulator of conformational changes that are critical for receptor engagement. The linker contributes a β strand to each of the SD1 and SD2 subdomains, thus connecting all the structural domains in the S1 subunit.
In addition to the D614G mutation, the SD2 subdomain also houses the multibasic furin cleavage site that demarcates the S1 and S2 subunits. S cleavage by furin and TMPRSS2 is an essential processing step necessary for viral infection and transmission (Hoffmann et al., 2020a; Shang et al., 2020). We provide evidence in this study that the D614G mutation enhances susceptibility of the SARS-CoV-2 S ectodomain to furin cleavage, thus raising the possibility that this is a contributor to increased fitness and transmissibility of D614G isolates.
Limitations of Study
In this paper, we study the effect of the SARS-CoV-2 S D614G mutation on S structure, focusing on RBD conformation and changes in proteolytic susceptibility at the multibasic furin cleavage site at the S1/S2 junction. Not only does the D614G mutation alter RBD up/down proportions, but it also results in increased furin cleavage susceptibility, which could be responsible for the increased transmissibility of the SARS-CoV-2 variant with the D614G mutation. It is important to consider, though, that these results are obtained in the context of an engineered soluble construct, and further studies are needed to understand if these effects translate to the native virion context. Also, this study does not investigate the effect of the D614G mutation on cleavage at the TMPRSS2 cleavage site, which remains an important question to be answered in future studies.
STAR★Methods
Key Resources Table
| REAGENT or RESOURCE | SOURCE | IDENTIFIER |
|---|---|---|
| Antibodies | ||
| ACE2 | Henderson et al., 2020 | N/A |
| CR3022 | Henderson et al., 2020 | N/A |
| 2G12 | Acharya et al., 2020 | N/A |
| Ab712199 | Acharya et al., 2020 | N/A |
| Ab511584 | Acharya et al., 2020 | N/A |
| Goat anti-rabbit-HRP | Abcam | ab97080 |
| Goat anti-human-HRP | Jackson ImmunoResearch Laboratories | 109-035-098 |
| Chemicals, Peptides, and Recombinant Proteins | ||
| Furin | New England BioLabs | P0877L |
| HRV3C | EMD millipore | 71493 |
| FreeStyle 293 Expression Medium | GIBCO | 12338018 |
| Expi293 Expression Medium | GIBCO | A1435101 |
| ExpiFectamine 293 Transfection Kit | GIBCO | A14524 |
| Hyclone SFM4HEK293 | Cytiva | SH30521.02 |
| Opti-MEM I | GIBCO | 31985-070 |
| Turbo293 | Speed BioSystems | PXX1002 |
| 10x Buffer E | IBA | 2-1000 |
| 10x Buffer R | IBA | 2-1002 |
| 10x Buffer W | IBA | 2-1003 |
| Strep-Tactin resin | IBA | 2-1201 |
| 8% Glutaraldehyde | Electron Microscopy Sciences | 16019 |
| 300mesh Cu carbon coated | Electron Microscopy Sciences | CF300-Cu |
| Uranyl formate | Electron Microscopy Sciences | 22450, S-888 |
| Quantifoil R 1.2/1.3 300 mesh | Electron Microscopy Sciences | Q350CR-14 |
| Streptavidin | Thermo Fisher Scientific | S-888 |
| Critical Commercial Assays | ||
| Superose 6 Increase 10/300 GL | Cytiva | 29091596 |
| NuPage 4-12% | Invitrogen | NP0321 |
| TMB substrate | Sera Care Life Sciences | 5120-0083 |
| Deposited Data | ||
| SARS-CoV-2 3-RBD down Spike Protein Trimer without the P986-P987 stabilizing mutations (S-GSAS) | This paper | PDB 7KDG; EMDB: 22821 |
| SARS-CoV-2 1-RBD up Spike Protein Trimer without the P986-P987 stabilizing mutations (S-GSAS) | This paper | PDB 7KDH; EMD: 22822 |
| SARS-CoV-2 D614G 3-RBD-down Spike Protein Trimer (S-GSAS-D614G consensus classification) | This paper | PDB 7KDK; EMD: 22825 |
| SARS-CoV-2 D614G 1-RBD-up Spike Protein Trimer (S-GSAS-D614G consensus classification) | This paper | PDB 7KDL; EMD: 22826 |
| SARS-CoV-2 D614G 3 RBD down Spike Protein Trimer fully cleaved by furin (S-RRAR-D614G) | This paper | PDB 7KDI; EMD: 22823 |
| SARS-CoV-2 D614G 1-RBD-up Spike Protein Trimer fully cleaved by furin (S-RRAR-D614G) | This paper | PDB 7KDJ; EMD: 22824 |
| SARS-CoV-2 D614G 3 RBD down Spike Protein Trimer (S-GSAS-D614G Sub-Classification) | This paper | PDB 7KE4; EMD: 22831 |
| SARS-CoV-2 D614G 3 RBD down Spike Protein Trimer (S-GSAS-D614G Sub-Classification) | This paper | PDB 7KE6; EMD: 22832 |
| SARS-CoV-2 D614G 3 RBD down Spike Protein Trimer (S-GSAS-D614G Sub-Classification) | This paper | PDB 7KE7; EMD: 22833 |
| SARS-CoV-2 D614G 3 RBD down Spike Protein Trimer (S-GSAS-D614G Sub-Classification) | This paper | PDB 7KE8; EMD: 22834 |
| SARS-CoV-2 D614G 1-RBD-up Spike Protein Trimer (S-GSAS-D614G Sub-Classification) | This paper | PDB 7KE9; EMD: 22835 |
| SARS-CoV-2 D614G 1-RBD-up Spike Protein Trimer (S-GSAS-D614G Sub-Classification) | This paper | PDB 7KEA; EMD: 22836 |
| SARS-CoV-2 D614G 1-RBD-up Spike Protein Trimer (S-GSAS-D614G Sub-Classification) | This paper | PDB 7KEB; EMD: 22837 |
| SARS-CoV-2 D614G 1-RBD-up Spike Protein Trimer (S-GSAS-D614G Sub-Classification) | This paper | PDB 7KEC; EMD: 22838 |
| Experimental Models: Cell Lines | ||
| Freestyle 293-F cells | GIBCO | R79007 |
| Expi293F cells | GIBCO | A14527 |
| Recombinant DNA | ||
| pαH-S-GSAS/PP | Wrapp et al., 2020 | N/A |
| pαH-S-GSAS | This paper | Addgene 164565 |
| pαH-S-GSAS/D614G | This paper | Addgene 164566 |
| pαH-S-HRV3C | This paper | Addgene 164567 |
| pαH-S-HRV3C/D614G | This paper | Addgene 164568 |
| pαH-S-RRAR | This paper | Addgene 164569 |
| pαH-S-RRAR/D614G | This paper | Addgene 164570 |
| Software and Algorithms | ||
| Relion | Scheres, 2012, 2016 | Version 3.1 |
| cryoSPARC | Punjani et al., 2017 | https://cryosparc.com |
| Phenix | Afonine et al., 2018; Liebschner et al., 2019 | Version 1.17 |
| Coot | Emsley et al., 2010 | Version 0.8.9.2 |
| Pymol | The PyMOL Molecular Graphics System (Schrödinger, LLC.). | https://pymol.org/2/ |
| UCSF Chimera | Pettersen et al., 2004 | http://www.cgl.ucsf.edu/chimera/ |
| Chimera X | Goddard et al., 2018 | https://www.rbvi.ucsf.edu/chimerax/ |
| Image Lab | Bio-Rad | Version 6.0 |
| PRISM 8 | GraphPad Software | Version 8.4.0 |
| R | R Core Team (2014). R: A language and environment for statistical computing. R Foundation for Statistical Computing, Vienna, Austria. URL http://www.R-project.org/ | version 4.0.2 |
| Bio3D | Grant et al., 2021 | version 2.4-1 |
| ImageJ | Schneider et al., 2012 | Version 1.53a |
Resource Availability
Lead Contact
Further information and requests for resources and reagents should be directed to and will be fulfilled by the Lead Contact, Priyamvada Acharya (priyamvada.acharya@duke.edu).
Materials Availability
Further information and requests for resources and reagents should be directed to Priyamvada Acharya (priyamvada.acharya@duke.edu). Plasmids generated in this study have been deposited to Addgene under the codes 164565, 164566, 164567, 164568, 164569 and 164570.
Data and Code Availability
Cryo-EM reconstructions and atomic models generated during this study are available at wwPDB and EMBD (https://www.rcsb.org; http://emsearch.rutgers.edu) under the accession codes PDB: 7KDG, 7KDH, 7KDK, 7KDL, 7KDI, 7KDJ, 7KE4, 7KE6, 7KE7, 7KE8, 7KE9, 7KEA, 7KEB, 7KEC and EMDB: 22821, 22822, 22825, 22826, 22823, 22824, 22831, 22832, 22833, 22834, 22835, 22835, 22837, 22838.
Experimental Model and Subject Details
GIBCO FreeStyle 293-F cells (embryonal, human kidney) were incubated at 37°C and 9% CO2 in a humidified atmosphere. Cells were incubated in FreeStyle 293 Expression Medium (GIBCO) with agitation at 120 rpm. Plasmids were transiently transfected into cells using Turbo293 (SpeedBiosystems) and incubated at 37°C, 9% CO2, 120 rpm for 6 days. On the day following transfection, HyClone CDM4HEK293 media (Cytiva, MA) was added to the cells.
Antibodies were produced in Expi293 cells (embryonal, human kidney). Cells were incubated in Expi293 Expression Medium at 37°C, 120 rpm and 8% CO2 in a humidified atmosphere. Plasmids were transiently transfected into cells using the ExpiFectamine 293 Transfection Kit and protocol (GIBCO).
Method Details
Plasmids
All genes in this study were synthesized and sequenced by GeneImmune Biotechnology (Rockville, MD). The SARS-CoV-2 spike protein ectodomain constructs used comprised the protein residues 1−1208 (GenBank: MN908947) with or without the D614G mutation, with or without the furin cleavage site RRAR (residue 682-685) mutated to GSAS or LEVLFQGP (HRV3C protease site), a C-terminal T4 fibritin trimerization motif, a C-terminal HRV3C protease cleavage site (except for the constructs where the furin site was mutated to an HRV3C site), a TwinStrepTag and an 8XHisTag. All spike ectodomain constructs were cloned into the mammalian expression vector pαH (Wrapp et al., 2020). For the ACE-2 construct, the C terminus was fused a human Fc region.
Protein purification
Spike ectodomains were harvested from filtered and concentrated supernatant using StrepTactin resin (IBA) and further purified by SEC using a Superose 6 10/300 GL Increase column preequilibrated in 2mM Tris, pH 8.0, 200 mM NaCl, 0.02% sodium azide. All protein purification steps were performed at room temperature in a single day. The purified proteins were flash frozen and stored at −80°C in single-use aliquots. Each aliquots were thawed by incubation (∼20 min) at 37°C before use.
Antibodies were produced in Expi293F cells and purified by Protein A affinity. ACE-2 with human Fc tag was purified by Protein A affinity chromatography.
Negative-stain electron microscopy
Samples were diluted to 100 μg/ml in 20 mM HEPES pH 7.4, 150 mM NaCl, 5% glycerol, 7.5 mM glutaraldehyde and incubated for 5 minutes before quenching the glutaraldehyde by the addition of 1 M Tris (to a final concentration of 75 mM) and 5 minutes incubation. A 5-μl drop of sample was then applied to a glow-discharged carbon-coated grid for 10-15 s, blotted, stained with 2% uranyl formate, blotted and air-dried. Images were obtained using a Philips EM420 electron microscope at 120 kV, 82,000 × magnification, and a 4.02 Å pixel size. The RELION (Scheres, 2012) program was used for particle picking, 2D and 3D class averaging.
Differential scanning fluorimetry
DSF assay was performed using Tycho NT. 6 (NanoTemper Technologies). Spike ectodomains were diluted to approximatively 0.15 mg/ml. Intrinsic fluorescence was measured at 330 nm and 350 nm while the sample was heated from 35 to 95 °C at a rate of 30°C/min. The ratio of fluorescence (350/330 nm) and inflection temperatures (Ti) were calculated by the Tycho NT. 6 apparatus.
ELISA assays
Spike samples were pre-incubated at different temperatures then tested for antibody- or ACE-2-binding in ELISA assays as previously described (Edwards et al., 2020). Assays were run in two formats. In the first format antibodies or ACE2 protein were coated on 384-well plates at 2 μg/ml overnight at 4°C, washed, blocked and followed by two-fold serially diluted spike protein starting at 25 μg/mL. Binding was detected with polyclonal anti-SARS-CoV-2 spike rabbit serum (developed in our lab), followed by goat anti-rabbit-HRP and TMB substrate. Absorbance was read at 450 nm. In the second format, serially diluted spike protein was bound in individual wells of 384-well plates, which were previously coated with streptavidin at 2 μg/mL and blocked. Proteins were incubated at room temperature for 1 hour, washed, then human mAbs were added at 10 μg/ml. Antibodies were incubated at room temperature for 1 hour, washed and binding detected with goat anti-human-HRP and TMB substrate.
Cryo-EM
Purified SARS-CoV-2 spike preparations were diluted to a concentration of ∼1.5 mg/mL in 2 mM Tris pH 8.0, 200 mM NaCl and 0.02% NaN3. A 2.5 μL drop of protein was deposited on a Quantifoil-1.2/1.3 grid that had been glow discharged for 10 s in a PELCO easiGlow Glow Discharge Cleaning System. After a 30 s incubation in > 95% humidity, excess protein was blotted away for 2.5 s before being plunge frozen into liquid ethane using a Leica EM GP2 plunge freezer (Leica Microsystems). Frozen grids were imaged in a Titan Krios (Thermo Fisher) equipped with a K3 detector (Gatan).
Quantification and Statistical Analysis
No statistical analysis were performed in this study.
Acknowledgments
Cryo-EM data were collected at the National Center for Cryo-EM Access and Training (NCCAT) and the Simons Electron Microscopy Center located at the New York Structural Biology Center, supported by the NIH Common Fund Transformative High Resolution Cryo-Electron Microscopy program (U24 GM129539) and by grants from the Simons Foundation (SF349247) and NY State. This work was performed in part at the Duke University Shared Materials Instrumentation Facility (SMIF), a member of the North Carolina Research Triangle Nanotechnology Network (RTNN), which is supported by the National Science Foundation (award number ECCS-2025064) as part of the National Nanotechnology Coordinated Infrastructure (NNCI). We thank Ed Eng, Carolina Hernandez, Daija Bobe, Mark Walters, and Holly Leddy for microscope alignments and assistance with cryo-EM data collection. We thank Jason McLellan for the pαH-S-GSAS/PP plasmid. This work was supported by an administrative supplement to NIH R01 AI145687 for coronavirus research (to P.A. and R.H.) and NC State funding for COVID research (to B.F.H.). This study utilized the computational resources offered by Duke Research Computing (https://rc.duke.edu; NIH 1S10OD018164-01) at Duke University. We thank M. DeLong, C. Kneifel, M. Newton, V. Orlikowski, T. Milledge, and D. Lane from the Duke Office of Information Technology and Research Computing for assisting with setting up and maintaining the computing environment.
Author Contributions
S.M.-C.G. and P.A. designed the study and wrote the manuscript with help from all authors. S.M.-C.G. designed SARS-CoV-2 ectodomain constructs, expressed and purified proteins, performed biophysical and biochemical studies, performed NSEM experiments, and determined and analyzed cryo-EM structures. K.J. expressed and purified proteins and performed protease cleavage experiments. S.M. and R.H. performed structural analysis related to the DDMs. K. Mansouri collected and analyzed NSEM data. R.P. performed ELISA assays. K. Manne assisted with antigenicity and stability measurements. V.S. expressed and purified proteins. M.F.K. assisted with cryo-EM sample optimization. R.J.E. supervised NSEM studies. B.F.H. supervised antigenicity measurements. P.A. supervised and led the study and reviewed all data.
Declaration of Interests
The authors declare no competing interests.
Published: January 12, 2021
Footnotes
Supplemental Information can be found online at https://doi.org/10.1016/j.celrep.2020.108630.
Supplemental Information
References
- Acharya P., Williams W., Henderson R., Janowska K., Manne K., Parks R., Deyton M., Sprenz J., Stalls V., Kopp M. A glycan cluster on the SARS-CoV-2 spike ectodomain is recognized by Fab-dimerized glycan-reactive antibodies. bioRxiv. 2020 doi: 10.1101/2020.06.30.178897. [DOI] [Google Scholar]
- Afonine P.V., Poon B.K., Read R.J., Sobolev O.V., Terwilliger T.C., Urzhumtsev A., Adams P.D. Real-space refinement in PHENIX for cryo-EM and crystallography. Acta Crystallogr. D Struct. Biol. 2018;74:531–544. doi: 10.1107/S2059798318006551. [DOI] [PMC free article] [PubMed] [Google Scholar]
- Bestle D., Heindl M.R., Limburg H., Van Lam van T., Pilgram O., Moulton H., Stein D.A., Hardes K., Eickmann M., Dolnik O. TMPRSS2 and furin are both essential for proteolytic activation of SARS-CoV-2 in human airway cells. Life Sci. Alliance. 2020;3:e202000786. doi: 10.26508/lsa.202000786. [DOI] [PMC free article] [PubMed] [Google Scholar]
- Corbett K.S., Edwards D.K., Leist S.R., Abiona O.M., Boyoglu-Barnum S., Gillespie R.A., Himansu S., Schäfer A., Ziwawo C.T., DiPiazza A.T. SARS-CoV-2 mRNA vaccine design enabled by prototype pathogen preparedness. Nature. 2020;586:567–571. doi: 10.1038/s41586-020-2622-0. [DOI] [PMC free article] [PubMed] [Google Scholar]
- de Wit E., van Doremalen N., Falzarano D., Munster V.J. SARS and MERS: recent insights into emerging coronaviruses. Nat. Rev. Microbiol. 2016;14:523–534. doi: 10.1038/nrmicro.2016.81. [DOI] [PMC free article] [PubMed] [Google Scholar]
- Dong E., Du H., Gardner L. An interactive web-based dashboard to track COVID-19 in real time. Lancet Infect. Dis. 2020;20:533–534. doi: 10.1016/S1473-3099(20)30120-1. [DOI] [PMC free article] [PubMed] [Google Scholar]
- Edwards R.J., Mansouri K., Stalls V., Manne K., Watts B., Parks R., Gobeil S.M.C., Janowska K., Li D., Lu X. Cold sensitivity of the SARS-CoV-2 spike ectodomain. bioRxiv. 2020 doi: 10.1101/2020.07.12.199588. [DOI] [PMC free article] [PubMed] [Google Scholar]
- Elbe S., Buckland-Merrett G. Data, disease and diplomacy: GISAID’s innovative contribution to global health. Glob. Chall. 2017;1:33–46. doi: 10.1002/gch2.1018. [DOI] [PMC free article] [PubMed] [Google Scholar]
- Emsley P., Lohkamp B., Scott W.G., Cowtan K. Features and development of Coot. Acta Crystallogr. D Biol. Crystallogr. 2010;66:486–501. doi: 10.1107/S0907444910007493. [DOI] [PMC free article] [PubMed] [Google Scholar]
- Goddard T.D., Huang C.C., Meng E.C., Pettersen E.F., Couch G.S., Morris J.H., Ferrin T.E. UCSF ChimeraX: Meeting modern challenges in visualization and analysis. Protein Sci. 2018;27:14–25. doi: 10.1002/pro.3235. [DOI] [PMC free article] [PubMed] [Google Scholar]
- Grant B.J., Skjærven L., Yao X.Q. The Bio3D packages for structural bioinformatics. Protein Sci. 2021;30:20–30. doi: 10.1002/pro.3923. [DOI] [PMC free article] [PubMed] [Google Scholar]
- Gui M., Song W., Zhou H., Xu J., Chen S., Xiang Y., Wang X. Cryo-electron microscopy structures of the SARS-CoV spike glycoprotein reveal a prerequisite conformational state for receptor binding. Cell Res. 2017;27:119–129. doi: 10.1038/cr.2016.152. [DOI] [PMC free article] [PubMed] [Google Scholar]
- Hastie K.M., Zandonatti M.A., Kleinfelter L.M., Heinrich M.L., Rowland M.M., Chandran K., Branco L.M., Robinson J.E., Garry R.F., Saphire E.O. Structural basis for antibody-mediated neutralization of Lassa virus. Science. 2017;356:923–928. doi: 10.1126/science.aam7260. [DOI] [PMC free article] [PubMed] [Google Scholar]
- Henderson R., Edwards R.J., Mansouri K., Janowska K., Stalls V., Gobeil S.M.C., Kopp M., Li D., Parks R., Hsu A.L. Controlling the SARS-CoV-2 spike glycoprotein conformation. Nat. Struct. Mol. Biol. 2020;27:925–933. doi: 10.1038/s41594-020-0479-4. [DOI] [PMC free article] [PubMed] [Google Scholar]
- Hoffmann M., Kleine-Weber H., Pöhlmann S. A Multibasic Cleavage Site in the Spike Protein of SARS-CoV-2 Is Essential for Infection of Human Lung Cells. Mol. Cell. 2020;78:779–784.e5. doi: 10.1016/j.molcel.2020.04.022. [DOI] [PMC free article] [PubMed] [Google Scholar]
- Hoffmann M., Kleine-Weber H., Schroeder S., Krüger N., Herrler T., Erichsen S., Schiergens T.S., Herrler G., Wu N.H., Nitsche A. SARS-CoV-2 Cell Entry Depends on ACE2 and TMPRSS2 and Is Blocked by a Clinically Proven Protease Inhibitor. Cell. 2020;181:271–280.e8. doi: 10.1016/j.cell.2020.02.052. [DOI] [PMC free article] [PubMed] [Google Scholar]
- Johnson B.A., Xie X., Kalveram B., Lokugamage K.G., Muruato A., Zou J., Zhang X., Juelich T., Smith J.K., Zhang L. Furin Cleavage Site Is Key to SARS-CoV-2 Pathogenesis. bioRxiv. 2020 doi: 10.1101/2020.08.26.268854. [DOI] [PMC free article] [PubMed] [Google Scholar]
- Ke Z., Oton J., Qu K., Cortese M., Zila V., McKeane L., Nakane T., Zivanov J., Neufeldt C.J., Cerikan B. Structures and distributions of SARS-CoV-2 spike proteins on intact virions. Nature. 2020;588:498–502. doi: 10.1038/s41586-020-2665-2. [DOI] [PMC free article] [PubMed] [Google Scholar]
- Korber B., Fischer W.M., Gnanakaran S., Yoon H., Theiler J., Abfalterer W., Hengartner N., Giorgi E.E., Bhattacharya T., Foley B., Sheffield COVID-19 Genomics Group Tracking Changes in SARS-CoV-2 Spike: Evidence that D614G Increases Infectivity of the COVID-19 Virus. Cell. 2020;182:812–827.e19. doi: 10.1016/j.cell.2020.06.043. [DOI] [PMC free article] [PubMed] [Google Scholar]
- Krarup A., Truan D., Furmanova-Hollenstein P., Bogaert L., Bouchier P., Bisschop I.J.M., Widjojoatmodjo M.N., Zahn R., Schuitemaker H., McLellan J.S., Langedijk J.P.M. A highly stable prefusion RSV F vaccine derived from structural analysis of the fusion mechanism. Nat. Commun. 2015;6:8143. doi: 10.1038/ncomms9143. [DOI] [PMC free article] [PubMed] [Google Scholar]
- Li Q., Wu J., Nie J., Zhang L., Hao H., Liu S., Zhao C., Zhang Q., Liu H., Nie L. The Impact of Mutations in SARS-CoV-2 Spike on Viral Infectivity and Antigenicity. Cell. 2020;182:1284–1294.e9. doi: 10.1016/j.cell.2020.07.012. [DOI] [PMC free article] [PubMed] [Google Scholar]
- Liebschner D., Afonine P.V., Baker M.L., Bunkóczi G., Chen V.B., Croll T.I., Hintze B., Hung L.-W., Jain S., McCoy A.J. Macromolecular structure determination using X-rays, neutrons and electrons: recent developments in Phenix. Acta Crystallogr. D Struct. Biol. 2019;75:861–877. doi: 10.1107/S2059798319011471. [DOI] [PMC free article] [PubMed] [Google Scholar]
- Matsuyama S., Nao N., Shirato K., Kawase M., Saito S., Takayama I., Nagata N., Sekizuka T., Katoh H., Kato F. Enhanced isolation of SARS-CoV-2 by TMPRSS2-expressing cells. Proc. Natl. Acad. Sci. USA. 2020;117:7001–7003. doi: 10.1073/pnas.2002589117. [DOI] [PMC free article] [PubMed] [Google Scholar]
- Pallesen J., Wang N., Corbett K.S., Wrapp D., Kirchdoerfer R.N., Turner H.L., Cottrell C.A., Becker M.M., Wang L., Shi W. Immunogenicity and structures of a rationally designed prefusion MERS-CoV spike antigen. Proc. Natl. Acad. Sci. USA. 2017;114:E7348–E7357. doi: 10.1073/pnas.1707304114. [DOI] [PMC free article] [PubMed] [Google Scholar]
- Pancera M., Majeed S., Ban Y.E., Chen L., Huang C.C., Kong L., Kwon Y.D., Stuckey J., Zhou T., Robinson J.E. Structure of HIV-1 gp120 with gp41-interactive region reveals layered envelope architecture and basis of conformational mobility. Proc. Natl. Acad. Sci. USA. 2010;107:1166–1171. doi: 10.1073/pnas.0911004107. [DOI] [PMC free article] [PubMed] [Google Scholar]
- Papa G., Mallery D.L., Albecka A., Welch L., Cattin-Ortolá J., Luptak J., Paul D., McMahon H.T., Goodfellow I.G., Carter A. Furin cleavage of SARS-CoV-2 Spike promotes but is not essential for infection and cell-cell fusion. bioRxiv. 2020 doi: 10.1101/2020.08.13.243303. [DOI] [PMC free article] [PubMed] [Google Scholar]
- Pettersen E.F., Goddard T.D., Huang C.C., Couch G.S., Greenblatt D.M., Meng E.C., Ferrin T.E. UCSF Chimera—a visualization system for exploratory research and analysis. J. Comput. Chem. 2004;25:1605–1612. doi: 10.1002/jcc.20084. [DOI] [PubMed] [Google Scholar]
- Punjani A., Rubinstein J.L., Fleet D.J., Brubaker M.A. cryoSPARC: algorithms for rapid unsupervised cryo-EM structure determination. Nat. Methods. 2017;14:290–296. doi: 10.1038/nmeth.4169. [DOI] [PubMed] [Google Scholar]
- Qiao H., Pelletier S.L., Hoffman L., Hacker J., Armstrong R.T., White J.M. Specific single or double proline substitutions in the “spring-loaded” coiled-coil region of the influenza hemagglutinin impair or abolish membrane fusion activity. J. Cell Biol. 1998;141:1335–1347. doi: 10.1083/jcb.141.6.1335. [DOI] [PMC free article] [PubMed] [Google Scholar]
- Richards F.M., Kundrot C.E. Identification of structural motifs from protein coordinate data: secondary structure and first-level supersecondary structure. Proteins. 1988;3:71–84. doi: 10.1002/prot.340030202. [DOI] [PubMed] [Google Scholar]
- Rutten L., Gilman M.S.A., Blokland S., Juraszek J., McLellan J.S., Langedijk J.P.M. Structure-Based Design of Prefusion-Stabilized Filovirus Glycoprotein Trimers. Cell Rep. 2020;30:4540–4550.e3. doi: 10.1016/j.celrep.2020.03.025. [DOI] [PMC free article] [PubMed] [Google Scholar]
- Sanders R.W., Vesanen M., Schuelke N., Master A., Schiffner L., Kalyanaraman R., Paluch M., Berkhout B., Maddon P.J., Olson W.C. Stabilization of the soluble, cleaved, trimeric form of the envelope glycoprotein complex of human immunodeficiency virus type 1. J. Virol. 2002;76:8875–8889. doi: 10.1128/JVI.76.17.8875-8889.2002. [DOI] [PMC free article] [PubMed] [Google Scholar]
- Scheres S.H.W. A Bayesian view on cryo-EM structure determination. J. Mol. Biol. 2012;415:406–418. doi: 10.1016/j.jmb.2011.11.010. [DOI] [PMC free article] [PubMed] [Google Scholar]
- Scheres S.H.W. Processing of structurally heterogeneous cryo-EM data in RELION. In: Crowther R.A., editor. The Resolution Revolution: Recent Advances in CryoEM. Academic Press; 2016. pp. 125–157. [DOI] [PubMed] [Google Scholar]
- Schneider C.A., Rasband W.S., Eliceiri K.W. NIH Image to ImageJ: 25 years of image analysis. Nat. Methods. 2012;9:671–675. doi: 10.1038/nmeth.2089. [DOI] [PMC free article] [PubMed] [Google Scholar]
- Sempowski G.D., Saunders K.O., Acharya P., Wiehe K.J., Haynes B.F. Pandemic Preparedness: Developing Vaccines and Therapeutic Antibodies For COVID-19. Cell. 2020;181:1458–1463. doi: 10.1016/j.cell.2020.05.041. [DOI] [PMC free article] [PubMed] [Google Scholar]
- Shang J., Wan Y., Luo C., Ye G., Geng Q., Auerbach A., Li F. Cell entry mechanisms of SARS-CoV-2. Proc. Natl. Acad. Sci. USA. 2020;117:11727–11734. doi: 10.1073/pnas.2003138117. [DOI] [PMC free article] [PubMed] [Google Scholar]
- Turoňová B., Sikora M., Schürmann C., Hagen W.J.H., Welsch S., Blanc F.E.C., von Bülow S., Gecht M., Bagola K., Hörner C. In situ structural analysis of SARS-CoV-2 spike reveals flexibility mediated by three hinges. Science. 2020;370:203–208. doi: 10.1126/science.abd5223. [DOI] [PMC free article] [PubMed] [Google Scholar]
- Walls A.C., Park Y.J., Tortorici M.A., Wall A., McGuire A.T., Veesler D. Structure, Function, and Antigenicity of the SARS-CoV-2 Spike Glycoprotein. Cell. 2020;181:281–292.e6. doi: 10.1016/j.cell.2020.02.058. [DOI] [PMC free article] [PubMed] [Google Scholar]
- Weissman D., Alameh M., de Silva T., Collini P., Hornsby H., Brown R., LaBranche C., Edwards R., Sutherland L., Santra S. D614G Spike Mutation Increases SARS CoV-2 Susceptibility to Neutralization. Cell Host & Microbe. 2020 doi: 10.1016/j.chom.2020.11.012. In press. [DOI] [PMC free article] [PubMed] [Google Scholar]
- Wrapp D., Wang N., Corbett K.S., Goldsmith J.A., Hsieh C.L., Abiona O., Graham B.S., McLellan J.S. Cryo-EM structure of the 2019-nCoV spike in the prefusion conformation. Science. 2020;367:1260–1263. doi: 10.1126/science.abb2507. [DOI] [PMC free article] [PubMed] [Google Scholar]
- Yuan Y., Cao D., Zhang Y., Ma J., Qi J., Wang Q., Lu G., Wu Y., Yan J., Shi Y. Cryo-EM structures of MERS-CoV and SARS-CoV spike glycoproteins reveal the dynamic receptor binding domains. Nat. Commun. 2017;8:15092. doi: 10.1038/ncomms15092. [DOI] [PMC free article] [PubMed] [Google Scholar]
- Yurkovetskiy L., Wang X., Pascal K.E., Tomkins-Tinch C., Nyalile T.P., Wang Y., Baum A., Diehl W.E., Dauphin A., Carbone C. Structural and Functional Analysis of the D614G SARS-CoV-2 Spike Protein Variant. Cell. 2020;183:739–751.e8. doi: 10.1016/j.cell.2020.09.032. [DOI] [PMC free article] [PubMed] [Google Scholar]
- Zhou T., Tsybovsky Y., Gorman J., Rapp M.A., Cerutti G., Chuang G.-Y., Katsamba P.S., Sampson J.M., Schön A., Bimela J. Cryo-EM Structures of SARS-CoV-2 Spike without and with ACE2 Reveal a pH-Dependent Switch to Mediate Endosomal Positioning of Receptor-Binding Domains. Cell Host & Microbe. 2020;28:867–879.e5. doi: 10.1016/j.chom.2020.11.004. [DOI] [PMC free article] [PubMed] [Google Scholar]
- Zumla A., Chan J.F., Azhar E.I., Hui D.S., Yuen K.Y. Coronaviruses—drug discovery and therapeutic options. Nat. Rev. Drug Discov. 2016;15:327–347. doi: 10.1038/nrd.2015.37. [DOI] [PMC free article] [PubMed] [Google Scholar]
Associated Data
This section collects any data citations, data availability statements, or supplementary materials included in this article.
Supplementary Materials
Data Availability Statement
Cryo-EM reconstructions and atomic models generated during this study are available at wwPDB and EMBD (https://www.rcsb.org; http://emsearch.rutgers.edu) under the accession codes PDB: 7KDG, 7KDH, 7KDK, 7KDL, 7KDI, 7KDJ, 7KE4, 7KE6, 7KE7, 7KE8, 7KE9, 7KEA, 7KEB, 7KEC and EMDB: 22821, 22822, 22825, 22826, 22823, 22824, 22831, 22832, 22833, 22834, 22835, 22835, 22837, 22838.