

Abstract
Objectives
Plantar fasciitis (PF) is the most common cause of heel pain. Though PF is self‐limited, it can develop into chronic pain and thus treatment is needed. Early and accurate prognostic assessment of patients with PF is critically important for selecting the optimal treatment pathway. Nevertheless, there is no scoring system to determine the severity of PF and no prognostic model in choosing between conservative or surgical treatment. The study aimed to develop a novel scoring system to evaluate the severity of plantar fasciitis and predict the prognosis of conservative treatment.
Methods
Data of consecutive patients treated from 2014 to 2018 were retrospectively collected. One hundred and eighty patients were eligible for the study. The demographics and clinical characteristics served as independent variables. The least follow‐up time was 6 months. A minimal reduction of 60% in the visual analog scale (VAS) score from baseline was considered as minimal clinically important difference (MCID). Those factors significantly associated with achieving MCID in univariate analyses were further analyzed by multivariate logistic regression. A novel scoring system was developed using the best available literature and expert‐opinion consensus. Inter‐observer reliability and intra‐observer reproducibility were evaluated. The appropriate cut‐off points for the novel score system were obtained using receiver operating characteristic (ROC) curves.
Results
The system score = VAS (0–3 point = 1; 3.1–7 point = 3; 7.1–10 point = 5) + duration of symptoms (<6 months = 1; ≥1 6 months = 2) + ability to walk without pain (>1 h = 1; ≤1 h = 4) + heel spur in X‐ray (No = 0; Yes = 2) + high intensity zone (HIZ) in MRI (No = 0; Yes = 2). The total score was divided in four categories of severity: mild (2–4 points), moderate (5–8 points), severe (9–12 points), and critical (13–15 points). Inter‐observer agreement with a value of 0.84 was considered as perfect reliability. Intra‐observer reproducibility with a value of 0.92 was considered as perfect reproducibility. The optimum cut‐off value was 10 points. The sensitivity of predictive factors was 86.37%, 84.21%, 91.22%, 84.12%, and 89.32%, respectively; the specificity was 64.21%, 53.27%, 67.76%, 62.37%, and 79.58%, respectively; the area under curve was 0.75, 0.71, 0.72, 0.87, and 0.77, respectively. The Hosmer–Lemeshow test showed a good fitting of the score system with an overall accuracy of 90.6%.
Conclusions
Based on prognostic factors, the present study establishes a novel scoring system which is highly comprehensible, reliable, and reproducible. This score system can be used to identify the severity of plantar fasciitis and predict the prognosis of conservative treatment accurately. The application of this scoring system in clinical settings can significantly improve the decision‐making process.
Keywords: Development and validation, Heel pain, Novel scoring system, Plantar fasciitis, Predictive model
Introduction
Plantar fasciitis (PF), occurring in 11% to 15% of adults, is the most common cause of heal pain and manifests as the pain originating from the insertion of the plantar fascia near the medial tubercle of the calcaneus 1 , 2 , 3 . PF is caused by the slight damage to foot fascia due to overloading, which can result in aseptic inflammation of the fascia or tendon 4 , 5 , 6 . Women, obese people, and athletes participating in frequent running activities have a higher risk of developing plantar fasciitis. One or both feet can be affected. The etiology of plantar fasciitis is poorly understood and likely multifactorial. And this condition is thought to be caused by biomechanical overstress of the calcaneal tuberosity. Discussion of its biomechanical etiology usually involves the windlass mechanism and tension of the plantar fascia in both stance and gait. Plantar fasciitis is more likely to inflict people who frequently run or perform high‐impact activities like jumping, dancing, or athletic running. Though PF is self‐limited, it can develop into chronic pain and thus treatment is needed. The surgical method is applicable for intractable PF cases on which the effect of conservative treatment is not desirable 7 , 8 , 9 , 10 , 11 .
Early and accurate prognostic assessment of patients with PF is critically important for selecting the optimal treatment pathway. The diagnosis of PF is based on the patient's history and results of physical examination. Patients usually present with plantar heel pain on initiation of weight bearing, particularly in the morning on rising from sleep and after periods of rest. The pain tends to decrease after a few minutes and returns as the day proceeds and the amount of time the patient spends on their feet increases. Another important characteristic is the location of the pain, usually occurring at the origin of the plantar fascia from the medial tubercle of the calcaneus. Mechanical overload, irrespective of whether it is the result of biomechanical faults, obesity, or work habits of prolonged standing and running, may contribute to the symptoms.
Diagnostic imaging is rarely needed for the initial diagnosis of PF because it may not be helpful; although, it should be considered to rule out other causes of heel pain when doubts arise. Plain radiographs often reveal a heel spur on the inferior surface of the calcaneus. The presence or absence of heel spurs is not useful in diagnosing plantar fasciitis. Heel spurs are common in asymptomatic individuals and may be an incidental finding. The formation of heel spur is a continuous biological process. The plantar fascia is a critical structure arising from the medial process of the calcaneal tuberosity and inserting into the digits of the foot. Heel spur consists of mature lamellar bone and demonstrates degeneration and fibro‐cartilaginous proliferation, even ossification in the condition of PF. At present, the relationship between the plantar calcaneal spurs and the plantar fasciitis pain stills remains elusive. The results of several studies comparing patients with and without plantar fasciitis showed that patients with thicker heel aponeurosis are associated with plantar fasciitis identified by magnetic resonance imaging (MRI).
Conservative treatments help alleviate the disabling pain, including rest, shoe inserts, activity modification, oral analgesics, night splints, stretching, corticosteroid injections, and extracorporeal shockwave therapy. Extracorporeal shockwave therapy is an alternative to surgery and ineffective conservative treatment for recalcitrant heel pain syndrome, approved in 2000 by the Food and Drug Administration. The rationale of extracorporeal shockwave therapy is to stimulate soft tissue growth by local hyperemia, neovascularization, reduction of calcification, inhibition of pain receptors, and denervation to achieve pain relief and persistent healing of chronic processes. If conservative treatment is ineffective, surgery can be considered. Currently, considerable controversy has emerged regarding the clinical efficacy of treatment for PF. The relationship between individual patient's characteristics and its potential predictive value on outcomes has not been studied. In addition, there is no scoring system to determine the severity of PF and no prognostic model in choosing between conservative or surgical treatment. So, we are unable to predict which patients are better suited for conservative treatment or surgery. Therefore, it is important to determine how patient's individual demographic characteristics, physical examination signs, duration and severity of symptoms, or imaging findings influence the likelihood of meaningful response to treatment. Furthermore, an effective scoring system will help physicians considerably in evaluating the severity of PF to improve the selection of patients 12 , 13 .
In this study, we aimed to: (i) retrospectively analyzed the independent predictors of achievement in successful conservative treatment and combined these predictors that were useful in grading severity and predicting effects; (ii) to develop a new scoring system based on common clinical indices regarding the disease severity. Thus, the results of the analysis were validated using the internal validation cohort to accurately identify the severity of PF and predict the treatment outcomes; (iii) the novel scoring system can be used to guide treatment selection for PF patients and can also serve as a supplement to the international clinical scale to assess feet function.
Materials and Methods
Subjects
This study was conducted in accordance with the principles of the Declaration of Helsinki 14 . Data of consecutive patients treated from 2014 to 2018 were retrospectively collected. Written informed consent was obtained from all patients.
Inclusion and Exclusion Criteria
Inclusion criteria was as follows: (i) age >18 years; having local pain in the area where the fascia attaches to the heel; having a symptomatic duration of >7 days; (ii) conservative treatment; (iii) age, sex, visual analog scale (VAS) score grade, duration of symptoms, edema, heel spur, MRI imaging, and other items; (iv) achieve minimal clinically important difference; (v) retrospective comparative study.
The exclusion criteria were: (i) having physical dysfunction in feet or ankles (walking difficulty caused by serious pain); (ii) having infection or tumor at the heel.
All eligible patients completed a demographic pertaining record. All conservative treatments were recorded. The least follow‐up time was 6 months. A minimal reduction of 60% in the VAS score from baseline was considered as minimal clinically important difference (MCID) 15 . Failure to achieve the MCID was deemed as ineffective conservative treatment. Then, surgery would be considered.
Development of the Novel Scoring System
The factors significantly associated with MCID achievement in univariate analyses were subsequently analyzed in a multivariate manner with the Cox proportional hazards model. A group of academic professionals, consisting of 10 ankle specialists and rehabilitation physicians with more than 5 years of experience, were asked to participate in the development of the scoring system. An evidence‐based process using the best available literature and expert opinion consensus was used to develop the novel scoring system.
Reliability, Reproducibility, and Validation Evaluation of the Novel Scoring System
Inter‐observer reliability was determined by comparing the initial responses of five evaluators. Intra‐observer reproducibility was evaluated by comparing one evaluator's responses to the same case, with an 8‐week interval to limit the recall bias to a minimum. To evaluate the validation of the novel scoring system, patients in study cohort were also randomly allocated: 75% were selected as the total training sample and 25% were selected as the validation sample. The Hosmer–Lemeshow test was used to test the goodness of fit. The appropriate cut‐off points for the novel score system were obtained using receiver operating characteristic (ROC) curves corresponding to the point on the curve nearest to the upper left corner of the ROC graph.
Statistical Analysis
SPSS 20.0 was used for statistical analysis. Mean, standard deviation, median, quartiles and inter quartiles for continuous variables, and frequency for categorical variables were calculated for the patients’ demographic and clinical characteristics. Univariate analysis and multivariate Cox regression analysis with stepwise selection were performed to detect independent predictors. The regression coefficients of the multivariate Cox regression model were divided by the median of the included factors and rounded to the nearest unit to obtain simple point numbers to facilitate bedside calculation of the novel scoring system 16 . Statistical significance was set at P < 0.05. The intra‐class correlation coefficient (ICC) and kappa coefficient (κ) were used to assess the agreement (two‐way mixed‐effect model, in which people effects are random, and measures effects are fixed). The values were expressed with a 95% CI 15 , 16 , 17 , 18 . Levels of agreement were graded according to the recommendations of Landis and Koch 19 .
Results
Patient Characteristics and Clinical Findings
Among the 192 patients diagnosed with PF from January 2014 to December 2018 at Longhua Hospital, 180 were eligible to form the training cohort. The remaining 12 were excluded due to incomplete data or history of other treatments. The recruited patients (98 men and 82 women) had a mean age of 52.4 ± 11.3 years. The mean duration of symptoms was 5.4 ± 1.3 months. Of these patients, 58 (32.5%) had a body mass index <26 kg/m2, 96 (53.3%) had a body mass index range between 26 and 30 kg/m2, and 26 (14.4%) had a body mass index >30 kg/m2. The baseline scores at presentation were a mean of 6.5 ± 1.1 points for the VAS and a mean of 2.5 ± 0.3 points for the Roles and Maudsley (RM) score. There were 69 (38.3%) patients who had a history of alcohol and tobacco use, 32 (17.7%) who had history of diabetes, 55 (30.6%) who had bilateral PF, and 62 (34.4%) who were unable to walk for >1h without pain. In imaging, there were 113 (62.7%) patients with heel spur as shown in X‐ray and 48 (26.7%) with high intensity zone (HIZ) as shown in MRI (all evaluators agreed as to the presence of a spur or high intensity zone on MRI). All patients received the shoe inserts and oral non‐steroidal anti‐inflammatory drugs (NSAIDs). The flow chart for these patients is shown in Fig. 1.
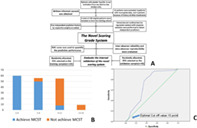
Fig. 1.

The flow chart of the study.
Development of the Novel Scoring System
Among the 180 eligible patients, 118 (65.6%) achieved the minimal clinically important difference (MCID). According to the univariate analysis, significant inter‐group differences correlated to the success rate of achieving MCID were found in terms of BMI, VAS score grade, duration of symptoms, ability or inability to walk for >1 h without pain, presence of edema, presence of heel spur, and HIZ on T2‐weighted MRI imaging (P < 0.05). Table 1 demonstrates the demographic characteristics and the univariate analysis of all the factors. In the Cox analysis, the BMI and presence of edema was no longer significant for achieving MCID. The results of the entire Cox proportional hazards analysis including risk ratios, 95% confidence intervals, and P values are given in Table 2.
TABLE 1.
Demographic characteristics and the univariate analysis
| Variables | Achieved MCID (n = 118) | Not achieved MCID (n = 62) |
|---|---|---|
| Age (years) | 53.1 ± 12.1 | 51.9 ± 10.5 |
| Gender (male, cases) | 66 | 32 |
| BMI (kg/m2, mean ± SD)* | 25.5 ± 4.5 | 28.8 ± 4.3 |
| <26 | 48 | 10 |
| 26–30 | 67 | 29 |
| ≥30 | 3 | 23 |
| Alcohol and tobacco use (cases) | 44 | 25 |
| History of diabetes (cases) | 20 | 12 |
| Affected bilateral side (cases) | 37 | 18 |
| Duration of symptoms (months, mean ± SD)* | 3.4 ± 1.3 | 8.5 ± 1.3 |
| ≥6 months (cases) | 13 | 55 |
| <6 months (cases) | 105 | 7 |
| Roles and Maudsley score (mean ± SD) | 2.49 ± 0.27 | 2.52 ± 0.23 |
| VAS (mean ± SD)* | 4.2 ± 1.7 | 5.9 ± 1.7 |
| 0–3 | 41 | 3 |
| 4–7 | 66 | 54 |
| 8–10 | 11 | 5 |
| Inability to walk for >1 h without pain (cases)* | 16 | 46 |
| Presence of oedema (cases)* | 8 | 10 |
| Presence of heel spur in X‐ray (cases)* | 61 | 52 |
| Presence of HIZ in MRI (cases)* | 10 | 38 |
Variables compared with two groups (P < 0.05); MCID, minimal clinically important difference.
TABLE 2.
Multivariate analysis of the characteristic
| Variables | Risk ratio | 95% CI | P value |
|---|---|---|---|
| BMI | 3.3 | 0.21–12.4 | 0.31 |
| Duration of symptoms* | 2.11 | 1.01–4.29 | 0.02 |
| VAS* | 8.12 | 4.14–16.23 | <0.001 |
| Inability to walk* | 6.32 | 5.67–7.11 | 0.01 |
| Presence of oedema | 20.1 | 1.92–15.4 | 0.88 |
| Presence of heel spur in X‐ray* | 1.92 | 0.98–3.54 | 0.03 |
| Presence of HIZ in MRI* | 2.18 | 5.24–9.11 | <0.001 |
variables, P value <0.05.
Five variables with significant predictive value in multivariate analyses (VAS score grade, duration of symptoms, ability of walking, presence of heel spur on plain radiographs, and HIZ on T2‐weighted MRI imaging) were included in the scoring instrument. Each of these risk factors was graded from none (i.e. not present) to severe and given a score from 0 to 5 depending on the severity. The score for one patient was calculated using the following equation: System score = VAS (0–3 points = 1; 3.1–7 points = 3; 7.1–10 points = 5) + duration of symptoms (<6 months = 1; ≥1 6 months = 2) + ability to walk without pain (>1 h = 1; ≤1 h = 4) + heel spur in X‐ray (No = 0; Yes = 2) + HIZ in MRI (No = 0; Yes = 2). Furthermore, the total score was divided into four categories of severity: mild (2–4 points), moderate (5–8 points), severe (9–12 points), and critical (13–15 points).
Evaluating Reliability and Reproducibility of the Novel Scoring System
We observed full inter‐observer agreement when scoring the severity grade (mild, moderate, severe, or critical), with a κ value of 0.84 as perfect reliability. The κ values were 0.86 for mild, 0.78 for moderate, 0.82 for severe, and 0.91 for critical. These values for mild, severe, and critical grades implied perfect agreement, and the value for moderate grade indicated substantial agreement (Table 3). In the repeated evaluation 8 weeks after the first assessment, we observed perfect reproducibility, with a κ value of 0.92. The k values for each evaluator were 0.95, 0.91, 0.89, 0.90, and 0.94, respectively. These values all implied as perfect agreement (Table 4).
TABLE 3.
Inter‐observer reliability of the novel scoring system
| Item | κ value | 95% CI |
|---|---|---|
| Mild | 0.86 | 0.37–0.64 |
| Moderate | 0.78 | 0.39–0.66 |
| Severe | 0.82 | 0.62–0.89 |
| Critical | 0.91 | 0.49–0.73 |
| Overall | 0.84 | 0.47–0.67 |
TABLE 4.
Intra‐observer reproducibility of the novel scoring system
| Evaluator | κ value | 95% CI |
|---|---|---|
| A | 0.95 | 0.41–0.64 |
| B | 0.91 | 0.26–0.52 |
| C | 0.89 | 0.18–0.47 |
| D | 0.90 | 0.56–0.77 |
| E | 0.94 | 0.42–0.88 |
| Overall | 0.92 | 0.33–0.61 |
Accuracy of Predicting Conservative Treatment Outcomes in PF Patients
Of the 180 patients, 60 (33.3%) fell into the mild category, 56 (31.1%) into the moderate category, 55 (30.6%) into the severe category, and nine (5%) into the critical category. A histogram distribution of the score values is shown in Fig. 2. Remarkably, the patients in achieved MCID group showed a remarkably lower score (median points = 4.8) than patients in not‐achieved MCID group (median points = 10.9). The optimum cut‐off value was 10 points, indicating that patients with a score ≤10 had significantly better prognosis than those with a score >10.
Fig. 2.

A histogram distribution of the score value of patients. It showed that 60 (33.3%) patients were divided into the mild category, 56 (31.1%) patients were divided into the moderate category, 55 (30.6%) patients were divided into the severe category and 9 (5%) patients were divided into the critical category.
The MCID‐dependent‐ROC curve area analysis was used to determine whether thesystem was good at predicting outcomes of conservative treatment. The area values for five characteristics were 0.75, 0.71, 0.72, 0.87, and 0.77, respectively, which demonstrated good discrimination. The diagnosis sensitivity of the five characteristics was 86.37%, 84.21%, 91.22%, 84.12%, and 89.32%, respectively, which demonstrated high accuracy. The diagnosis specificity of the five characteristics was 64.21%, 53.27%, 67.76%, 62.37%, and 79.58%, respectively, also demonstrating high accuracy (Table 5). The model had a good fitting with an overall accuracy of 90.6% (Fig. 3). Based on this cut‐off value, the sensitivity and specificity for the accurate diagnosis of achieved MCID were 89.5% and 88.6%, respectively. Therefore, it could provide proper guidance in selecting the appropriate therapeutic strategy.
TABLE 5.
Diagnosis capability of five characteristics
| Characteristics | Sensitivity (%) | Specificity (%) | Area under ROC curve (95% CI) |
|---|---|---|---|
| VAS score | 86.37 | 64.21 | 0.75 (0.63–0.84) |
| Duration of symptoms | 84.21 | 53.27 | 0.71 (0.49–0.75) |
| Ability of walking | 91.22 | 67.76 | 0.72 (0.65–0.84) |
| Presence of heel spur | 84.12 | 62.37 | 0.86 (0.75–0.81) |
| Presence of HIZ | 89.32 | 79.58 | 0.77 (0.69–0.89) |
Fig. 3.

The optimum cut‐off value was 10 points, indicating that patients with a score ≤10 had significantly better prognosis than those with a score >10 and the model had a good fitting with a ROC value of the accuracy of 90.6%.
Discussion
Clinical Value of the Novel Scoring System
Predicting the severity and prognosis of PF is of vital importance because the patients might develop chronic, intractable, and refractory heel pain if the current therapeutic treatment produces poor outcomes and some patients may even need surgery.
To the best of our knowledge, there is no such scoring system or prognostic model to evaluate the severity of PF and aid in clinical decision‐making. In clinical studies, VAS, AOFAS, and RM score are widely used to evaluate pain in relation to daily activities for PF patients. Though well‐accepted, VAS is only a pain assessment tool and cannot reflect the foot function of PF patients. The RM score, which can make up for the deficiency and shortcoming of VAS, includes three items: ability to walk, symptoms improved after treatment, and the patient being satisfied with the treatment outcome. However, the RM score range is too wide in severity evaluation and cannot evaluate the positive and negative predictive values separately. Both VAS and RM are subjective indexes and objective quantitative indexes are needed. AOFAS, one of the mostly used clinical rating systems in foot surgery, has a questionnaire including nine items that are divided into three subscales (pain, function, and alignment). The limitation of AOFAS is that the questions in it have a limited number of answers, and some answers can be interpreted differently. In addition, AOFAS is too complicated to be used in daily clinical practice 3 , 20 , 21 .
Since the temporary loss of function caused by PF can decrease the patient's quality of life, questionnaires regarding functional outcomes are increasingly used in clinical practice and research to monitor the patients’ recovery after treatment. Currently, the choice of clinical treatment methods mostly depends on the doctors’ subjective and empirical judgments. There lacks evidence for the classification and treatment scheme selection of PF. Besides, we found most of the indicators in RM and AOFAS scales were evaluated subjectively, without considering the disease course and imaging examination. These currently used scales serve to evaluate the therapeutic effect, rather than guide treatment programs. So, our novel rating system combines the subjective outcome reported by the patient and the objective outcome based on the image examination. We hope that this scoring system enables detailed evaluation of functional outcome and quality of life, which is not provided by other PROM (Patient‐Reported Outcome Measure) questionnaires 22 , 23 , 24 .
Unfortunately, most previous studies fail to establish a system that can evaluate the severities and analyze prognostic factors in PF patients before decision‐making of the therapeutic approaches 25 , 26 . Therefore, the aim of this study is to establish a novel scoring system called Longhua Scoring System that can comprehensively evaluate clinical features and prognostic risk factors. Individualized treatment approaches are often based on the feet's function as estimated by significant prognostic factors and scoring systems. To the best of our knowledge, this is the first study based on a large database to establish a scoring standard combining objective examination, imaging examination and functional limitations for objective evaluation, treatment, and prognosis of PF.
Comparison Between Other Scales and Novel Scoring System
An ideal and effective classification system must be comprehensive, simple, reliable, reproducible, and applicable in clinical treatment and prognosis, and communicable for peer review and spreading. Some studies also evaluated the validity, reliability, and responsiveness of the AOFAS: in terms of test–retest reliability, the Cronbach's α ranged from 0.439 to 0.753; in terms of internal reliability, the Cronbach's α ranged 0.511 to 0.693 27 , 28 , 29 , 30 , 31 , 32 . Compared with the previous scale, the Longhua scoring system demonstrates higher acceptance and reproducibility among PF patients, and therefore could be applied widely. Unlike other scales, our scoring system is specifically designed for PF patients.
Previous studies have shown that the PF has complicated pathogenic mechanism and the etiology is also complex and multifactorial 33 , 34 . Pain status was a robust predictor of treatment outcome in PF patients according to our previous and other relevant studies 21 , 35 , 36 , 37 . In our study, patients with higher VAS had a poorer prognosis than we thought. In particular, duration of symptom which is seldom used as a variable in other scales is also included in our scoring system. In the present study, we determined that a symptomatic duration of <6 months (score = 1) was significantly and independently associated with a good prognosis.
The clinical diagnosis of PF is challenging owing to the complex regional anatomy of the lesion. Whether the imaging findings (plain radiography and MRI) have a real association with PF has been debated for a lot time. Imaging features that are seldom included as variables in other systems are also considered in our scoring system. Osborne et al. believed the key radiologic features that differentiated heel pain included changes in the soft tissues, but not spurs 38 . Chimutengwende‐Gordon et al. reported that a significant relationship was observed between the occurrence of night pain and calcaneal marrow edema on MRI 39 . Our study confirmed that a lateral radiograph should still be the first choice to evaluate heel pain. Several findings suggested PF could be detected on conventional radiographs. Despite this, plain radiography should not be used to diagnose PF without knowledge of clinical history or physical examination. Mahowald et al. demonstrated a high correlation between plantar fascia thickness and symptoms of PF 40 . Plantar calcaneal spurs and calcifications are uncommon occurrences in patients with PF in some studies. The percentage of asymptomatic individuals in whom heel spurs are present on routine radiographs is about 20%. So, currently their importance in terms of the diagnosis and prognosis of PF is still controversial 41 , 42 . The result of our study showed that the presence of calcaneal spurs is common on lateral plain radiographs of individuals and represents a reliable sign of PF. Zhou et al. identified two types of calcaneal spurs on the preoperative radiographs and that the grade of PF is dependent on the classification of the calcaneal spurs 43 . Thus, the significance of plain radiography should receive more considerable attention. Maybe, the combination of thickened PF and presence of calcaneal spurs on lateral plain radiography can provide a higher sensitivity and specificity for evaluating heel pain. Is there a role for MRI in plantar heel pain? MRI is sensitive and helpful in excluding other causes of heel pain. MRI is very sensitive and most helpful in excluding other causes of heel pain 44 . Our study demonstrated that presence of signal intensity within the plantar fascia has a significant relationship with the symptoms. Image characteristics were mainly shown in terms of the plain radiography and MRI image indices described in our novel scoring system. Thus, the plain radiography and MRI image indices are useful characteristics and significant prognostic factors not only for diagnosis but for evaluation of PF.
Strengths and Limitations
Our study should be considered in the context of several notable strengths. First, this study is the first, to our knowledge, to provide a grade score system analyzing the severity of PF, and also provide a predictive model analyzing the factors associated with achievement of meaningful improvement in pain and disability of patients with PF. Thereby, physicians can promoting value‐based care and increase the effectiveness of treatment in selected patients. Second, an evidence‐based process using the best available literature and expert‐opinion consensus was used to develop the novel scoring system.
Limitations exist in this study. First, this was a retrospective study with uncontrolled clinical observation and selection for treatment procedures. Second, the sample size of patients is small and may be insufficient as a basis for proposing a scoring system. Third, using our scoring system, it remained unclear whether surgical intervention or conservative therapy should be selected, and the lack of wide evaluation for the grading score system in clinical practice can be also considered as a flaw of this study.
Conclusion
The novel score system shows a high comprehensibility. Use of the novel score in clinical settings may significantly improve decision‐making processes. It means that it is crucial for clinicians to select the individual treatment for patients with PF to avoid inappropriate treatments. If patients have a score of ≤10, surgery may be avoided, conservative treatment would be an alternative option and have a good prognosis. Surgical treatment is recommended for patients with a score >10.
Grant Sources: This work was sponsored by research grants from National Nature Science Foundation of China (81603635); Research project of Shanghai Health and Family Planning Commission (20164Y0081, ZYKC201701003 and 201840010); Research project of Shanghai Pudong New Area Health and Family Planning Commission (PW2018D‐07); Research project of Shanghai Science and Technology Commission (16401930600, 17401934400, 19YF1449600, and 18401903200); Research project of Shanghai Shenkang Hospital Development Center (16CR3074B and 16CR4011A); Research project of National TCM clinical research base of Longhua Hospital (LYTD‐60); Clinical dominant diseases of TCM (ZY(2018‐2020)‐ZYBZ‐11); TCM Appropriate technology Upgrading Project (YW.005.007).
Disclosure: All authors read and approved the final manuscript and declare that they have no competing interests.
Contributor Information
Jie Ye, Email: yejie1977@126.com.
Wen Mo, Email: mw2218@126.com.
References
- 1. Thomas JL, Christensen JC, Kravitz SR, et al The diagnosis and treatment of heel pain: a clinical practice guideline‐revision 2010. J Foot Ankle Surg, 2010, 49: S1–S19. [DOI] [PubMed] [Google Scholar]
- 2. Tu P, Bytomski JR. Diagnosis of heel pain. Am Fam Physician, 2011, 84: 909–916. [PubMed] [Google Scholar]
- 3. Ling Y, Wang S. Effects of platelet‐rich plasma in the treatment of plantar fasciitis: a meta‐analysis of randomized controlled trials. Medicine, 2018, 97: e12110. [DOI] [PMC free article] [PubMed] [Google Scholar]
- 4. Goecker RM, Banks AS. Analysis of release of the first branch of the lateral plantar nerve. J Am Podiatr Med Assoc, 2000, 90: 281–286. [DOI] [PubMed] [Google Scholar]
- 5. Kamel M, Kotob H. High frequency ultrasonographic findings in plantar fasciitis and assessment of local steroid injection. J Rheumatol, 2000, 27: 2139–2141. [PubMed] [Google Scholar]
- 6. Lemont H, Ammirati KM, Usen N. Plantar fasciitis: a degenerative process (fasciosis) without inflammation. J Am Podiatr Med Assoc, 2003, 93: 234–237. [DOI] [PubMed] [Google Scholar]
- 7. Wearing SC, Smeathers JE, Urry SR, et al The pathomechanics of plantar fasciitis. Sports Med, 2006, 36: 585–611. [DOI] [PubMed] [Google Scholar]
- 8. Cole C, Seto C, Gazewood J. Plantar fasciitis: evidence‐based review of diagnosis and therapy. Am Fam Physician, 2005, 72: 2237–2242. [PubMed] [Google Scholar]
- 9. Maier M, Steinborn M, Schmitz C, et al Extracorporeal shock wave application for chronic plantar fasciitis associated with heel spurs: prediction of outcome by magnetic resonance imaging. J Rheumatol, 2000, 27: 2455–2462. [PubMed] [Google Scholar]
- 10. Bolgla LA, Malone TR. Plantar fasciitis and the windlass mechanism: a biomechanical link to clinical practice. J Athl Train, 2004, 39: 77–82. [PMC free article] [PubMed] [Google Scholar]
- 11. Kwong PK, Kay D, Voner RT, et al Plantar fasciitis. Mechanics and pathomechanics of treatment. Clin Sports Med, 1988, 7: 119–126. [PubMed] [Google Scholar]
- 12. Huang R, Sun Z, Zheng H, et al Identifying the prognosis factors and predicting the survival probability in patients with non‐metastatic chondrosarcoma from the SEER database. Orthop Surg, 2019, 11: 801–810. [DOI] [PMC free article] [PubMed] [Google Scholar]
- 13. Chen Y, Yu XC. Efficacy of a modified scoring system to facilitate surgical decision‐making for Diaphyseal malignancies: when is devitalized tumor‐bearing autograft of value?. Orthop Surg, 2019, 11: 586–594. [DOI] [PMC free article] [PubMed] [Google Scholar]
- 14. Fuson RL, Sherman M, Van Vleet J, et al The conduct of orthopaedic clinical trials. J Bone Joint Surg Am, 1997, 79: 1089–1098. [DOI] [PubMed] [Google Scholar]
- 15. Ibrahim MI, Donatelli RA, Schmitz C, et al Chronic plantar fasciitis treated with two sessions of radial extracorporeal shock wave therapy. Foot Ankle Int, 2010, 31: 391–397. [DOI] [PubMed] [Google Scholar]
- 16. Ganz P, Heidecker B, Hveem K, et al Development and validation of a protein‐based risk score for cardiovascular outcomes among patients with stable coronary heart disease. JAMA, 2016, 315: 2532–2541. [DOI] [PubMed] [Google Scholar]
- 17. Fleiss J. Measuring nominal scale agreement among many raters. Psychol Bull, 1971, 76: 378–381. [Google Scholar]
- 18. Cohen J. A coefficient of agreement for nominal scales. Educ Psychol Meas, 1960, 20: 37–46. [Google Scholar]
- 19. Landis JR, Koch GG. The measurement of observer agreement for categorical data. Biometrics, 1977, 33: 159–174. [PubMed] [Google Scholar]
- 20. Kostuj T, Stief F, Hartmann KA, et al Using the Oxford foot model to determine the association between objective measures of foot function and results of the AOFAS ankle‐Hindfoot scale and the foot function index: a prospective gait analysis study in Germany. BMJ Open, 2018, 8: e019872. [DOI] [PMC free article] [PubMed] [Google Scholar]
- 21. Jimenez‐Perez AE, Gonzalez‐Arabio D, Diaz AS, et al Clinical and imaging effects of corticosteroids and platelet‐rich plasma for the treatment of chronic plantar fasciitis: a comparative non randomized prospective study. Foot Ankle Surg, 2019, 25: 354–630. [DOI] [PubMed] [Google Scholar]
- 22. Rotenstein LS, Huckman RS, Wagle NW. Making patients and doctors happier ‐ the potential of patient‐reported outcomes. N Engl J Med, 2017, 377: 1309–1312. [DOI] [PubMed] [Google Scholar]
- 23. Kirsch M, Klaassen RJ, De Geest S, et al Understanding the importance of using patient‐reported outcome measures in patients with immune thrombocytopenia. Semin Hematol, 2013, 50: S39–S42. [DOI] [PubMed] [Google Scholar]
- 24. Ousey K, Cook L. Understanding patient reported outcome measures (PROMs). Br J Community Nurs, 2011, 16: 80–82. [DOI] [PubMed] [Google Scholar]
- 25. McClinton S, Weber CF, Heiderscheit B. Low back pain and disability in individuals with plantar heel pain. Foot (Edinb), 2018, 34: 18–22. [DOI] [PubMed] [Google Scholar]
- 26. Maki M, Ikoma K, Kido M, et al Magnetic resonance imaging findings of chronic plantar fasciitis before and after extracorporeal shock wave therapy. Foot, 2017, 33: 25–28. [DOI] [PubMed] [Google Scholar]
- 27. Niki H, Aoki H, Inokuchi S, et al Development and reliability of a standard rating system for outcome measurement of foot and ankle disorders II: interclinician and intraclinician reliability and validity of the newly established standard rating scales and Japanese Orthopaedic association rating scale. J Orthop Sci, 2005, 10: 466–474. [DOI] [PMC free article] [PubMed] [Google Scholar]
- 28. Baumhauer JF, Nawoczenski DA, DiGiovanni BF, et al Reliability and validity of the American Orthopaedic Foot and Ankle Society clinical rating scale: a pilot study for the hallux and lesser toes. Foot Ankle Int, 2006, 27: 1014–1019. [DOI] [PubMed] [Google Scholar]
- 29. Ibrahim T, Beiri A, Azzabi M, et al Reliability and validity of the subjective component of the American Orthopaedic Foot and Ankle Society clinical rating scales. J Foot Ankle Surg, 2007, 46: 65–74. [DOI] [PubMed] [Google Scholar]
- 30. Mani SB, Do H, Vulcano E, et al Evaluation of the foot and ankle outcome score in patients with osteoarthritis of the ankle. Bone Joint J, 2015, 97: 662–667. [DOI] [PubMed] [Google Scholar]
- 31. Stuber J, Zech S, Bay R, et al Normative data of the visual analogue scale foot and ankle (VAS FA) for pathological conditions. Foot Ankle Surg, 2011, 17: 166–172. [DOI] [PubMed] [Google Scholar]
- 32. Saarinen AJ, Uimonen MM, Sandelin H, Toom A, Richter M, Repo JP. Minimal important change for the visual analogue scale foot and ankle (VAS‐FA). Foot Ankle Surg, 2020, S1268‐7731: 30070–30079. [DOI] [PubMed] [Google Scholar]
- 33. Fabrikant JM, Park TS. Plantar fasciitis (fasciosis) treatment outcome study: plantar fascia thickness measured by ultrasound and correlated with patient self‐reported improvement. Foot, 2011, 21: 79–83. [DOI] [PubMed] [Google Scholar]
- 34. Ribeiro AP, Trombini‐Souza F, Tessutti VD, Lima FR, João SM, Sacco IC. The effects of plantar fasciitis and pain on plantar pressure distribution of recreational runners. Clin Biomech, 2011, 26: 194–199. [DOI] [PubMed] [Google Scholar]
- 35. Yin M, Chen N, Huang Q, et al New and accurate predictive model for the efficacy of extracorporeal shock wave therapy in managing patients with chronic plantar fasciitis. Arch Phys Med Rehabil, 2017, 98: 2371–2377. [DOI] [PubMed] [Google Scholar]
- 36. Yin M, Ma J, Xu J, et al Use of artificial neural networks to identify the predictive factors of extracorporeal shock wave therapy treating patients with chronic plantar fasciitis. Sci Rep, 2019, 9: 4207. [DOI] [PMC free article] [PubMed] [Google Scholar]
- 37. Molund M, Husebye EE, Hellesnes J, et al Proximal medial gastrocnemius recession and stretching versus stretching as treatment of chronic plantar heel pain. Foot Ankle Int, 2018, 39: 1423–1431. [DOI] [PubMed] [Google Scholar]
- 38. Osborne HR, Breidahl WH, Allison GT. Critical differences in lateral X‐rays with and without a diagnosis of plantar fasciitis. J Sci Med Sport, 2006, 9: 231–237. [DOI] [PubMed] [Google Scholar]
- 39. Chimutengwende‐Gordon M, O'Donnell P, Singh D. Magnetic resonance imaging in plantar heel pain. Foot Ankle Int, 2010, 31: 865–870. [DOI] [PubMed] [Google Scholar]
- 40. Mahowald S, Legge BS, Grady JF. The correlation between plantar fascia thickness and symptoms of plantar fasciitis. J Am Podiatr Med Assoc, 2011, 101: 385–389. [DOI] [PubMed] [Google Scholar]
- 41. Draghi F, Gitto S, Bortolotto C, Draghi AG, Ori BG. Imaging of plantar fascia disorders: findings on plain radiography, ultrasound and magnetic resonance imaging. Insights Imaging, 2017, 8: 69–78. [DOI] [PMC free article] [PubMed] [Google Scholar]
- 42. Buchbinder R. Clinical practice. Plantar Fasciitis. N Engl J Med, 2004, 350: 2159–2166. [DOI] [PubMed] [Google Scholar]
- 43. Zhou B, Zhou Y, Tao X, Yuan C, Tang K. Classification of calcaneal spurs and their relationship with plantar fasciitis. J Foot Ankle Surg, 2015, 54: 594–600. [DOI] [PubMed] [Google Scholar]
- 44. Fazal MA, Tsekes D, Baloch I. Is there a role for MRI in plantar heel pain. Foot Ankle Spec, 2018, 11: 242–245. [DOI] [PubMed] [Google Scholar]