Abstract
Pharmacological studies implicate toll-like receptor 3 (TLR3) signaling in alcohol drinking. We examined the role of TLR3 in behavioral responses to alcohol and GABAergic drugs by studying Tlr3 −/− mice. Because of opposing signaling between TLR3 and MyD88 pathways, we also evaluated Myd88 −/− mice. Ethanol consumption and preference decreased in male but not female Tlr3 −/− mice during two-bottle choice every-other-day (2BC-EOD) drinking. There were no genotype differences in either sex during continuous or limited-access drinking. Null mutations in Tlr3 or Myd88 did not alter conditioned taste aversion to alcohol and had small or no effects on conditioned place preference. The Tlr3 null mutation did not alter acute alcohol withdrawal. Male, but not female, Tlr3 −/− mice took longer than wild-type littermates to recover from ataxia by ethanol or diazepam and longer to recover from sedative-hypnotic effects of ethanol or gaboxadol, indicating regulation of GABAergic signaling by TLR3. Acute functional tolerance (AFT) to alcohol-induced ataxia was decreased in Tlr3 −/− mice but was increased in Myd88 −/− mice. Thus, MyD88 and TLR3 pathways coordinately regulate alcohol consumption and tolerance to intoxicating doses of alcohol and GABAergic drugs. Despite similar alcohol metabolism and similar amounts of total alcohol consumed during 2BC and 2BC-EOD procedures in C57BL/6J mice, only 2BC-EOD drinking induced tolerance to alcohol-induced ataxia. Ataxia recovery was inversely correlated with level of drinking in wild-type and Tlr3 −/− littermates. Thus, deleting Tlr3 reduces alcohol consumption by reducing AFT to alcohol and not by altering tolerance induced by 2BC-EOD drinking.
Keywords: Acute tolerance, Ethanol consumption, Knockout mice, MyD88, Rotarod ataxia, TLR3
Introduction
Findings from transcriptomic, genetic, and behavioral studies support an important role for neuroimmune, proinflammatory mechanisms in alcohol dependence.1 Toll-like receptors (TLR) are critical for innate immune signaling and mediate some effects of alcohol in the brain.1,2 TLR signaling occurs via two different pathways–MyD88 (myeloid differentiation primary response 88)-dependent and TRIF (TIR-domain-containing adaptor inducing interferon-β)-dependent [for a review and schematic diagram of the pathways, see3]. All TLRs, except TLR3, are able to signal through the MyD88 adaptor protein to activate downstream signaling and NF-κB-induced transcription. In contrast, TLR3 responses are thought to depend on the TRIF adaptor protein. TLR3 is activated intracellularly by bacterial- and viral-derived nucleic acids, such as dsRNA and small interfering RNAs.3 The TLR3/TRIF-dependent pathway leads to activation of NF-κB and IRF3 (interferon regulatory factor 3), which translocate to the nucleus, where NF-κB promotes transcription of proinflammatory cytokines and IRF3 promotes transcription of type 1 interferon (IFN).
Recent studies have linked the MyD88- and TRIF-dependent branches with alcohol responses. Cytokines associated with TLR4/MyD88 and TLR4/TRIF (but not TLR3/TRIF) responses were inhibited in human monocytes following binge alcohol drinking.4 MyD88 signaling also modulates the sedative and intoxicating effects of alcohol5 and Myd88 null mutant mice show increased alcohol consumption and preference.6 The TLR3/TRIF-dependent pathway also regulates alcohol drinking, but in a manner opposite to MyD88. TRIF-dependent signaling is increased in the frontal cortex of male mice after chronic voluntary alcohol consumption and in humans with alcohol use disorder.7,8 In humans, TLR3 expression correlates with lifetime alcohol consumption.7 Chronic ethanol exposure, combined with poly(I:C)-mediated stimulation of TLR3, increases expression of proinflammatory cytokines in mouse frontal cortex.9 Inhibition of the downstream TRIF pathway components IKKε and TBK1 reduces alcohol consumption in male mice,8 whereas chronic activation of TLR3 by administration of the agonist poly(I:C) leads to stable increases in alcohol consumption in C57BL/6J male mice.10
Opposing effects of TLR3/TRIF and MyD88 signaling on alcohol consumption suggest that these different pathways co-regulate drinking behavior. These pathways also work in a co-regulatory manner to influence neuroimmune signaling. For example,TLR3-mediated IFN-β gene induction is negatively regulated by MyD88,11 while Myd88 −/− mice show enhanced TLR3-dependent phosphorylation of IRF3 and increased IFN-β production.12 Development of tolerance to endotoxin is characterized by downregulation of MyD88-dependent proinflammatory cytokines and upregulation of the TRIF-dependent cytokine IFN-β.13 Antiviral activity induced by poly(I:C) in Japanese flounder is also negatively regulated by MyD88,14 providing evidence for opposing effects of these immune pathways across species.
In this study, we sought to directly evaluate the role of TLR3 in behavioral responses to alcohol by using mice that carry a null mutation in the Tlr3 gene. We compared different voluntary drinking procedures (intermittent, continuous, and limited-access) in male and female mice. We also studied behavioral responses to ethanol that can influence voluntary drinking. For some of these responses, we compared the effects of deletion of Tlr3 with effects of deletion of Myd88 to determine if there are opposing effects of TLR3 and MyD88 signaling on alcohol-related behaviors. We found decreased drinking in Tlr3 −/− male mice during chronic intermittent access to ethanol in association with decreased acute tolerance to ethanol-induced rotarod ataxia, and these changes were opposite to those produced by deletion of Myd88. We also show that mice develop acute tolerance to ataxia following chronic intermittent drinking and that levels of alcohol consumption are inversely related to recovery time from ataxia, providing further support that the decreased drinking in Tlr3 −/− male mice during this procedure is associated with decreased behavioral tolerance.
Materials and Methods
Animals
Generation of Tlr3 (B6N.129S1-Tlr3tm1Flv/J, stock #0096725) and Myd88 (B6.129P2(SJL)-Myd88tm1.1Defr/J, stock #009088) null mutant mice were described previously.15,16 The Myd88 mutant strain (on a C57BL/6J genetic background) was purchased from The Jackson Laboratory (Bar Harbor, ME) and maintained by homozygous breeding. The Tlr3 mutant strain (on a C57BL/6N genetic background) was purchased from The Jackson Laboratory and was backcrossed 3 generations onto a C57BL/6J background and maintained by heterozygous breeding. Wild-type and homozygous null littermates were used for experiments. C57BL/6J mice were taken from a colony maintained at The University of Texas at Austin (original breeders were purchased from The Jackson Laboratory). Mice were initially group-housed 4 to 5 per cage based on genotype and sex. Food and water were available ad libitum. Behavioral testing began when the mice were at least 2 months old in isolated testing rooms in the Animal Resource Center at UT Austin. Mice were moved to testing rooms 1-2 weeks before beginning experiments. Mice were weighed once a week and housed individually for each behavioral study. The humidity and temperature of the rooms were kept constant and mice were maintained on a 12-hour light/dark cycle with lights on at 7 AM for all studies except for the limited-access drinking procedure when mice were housed under a reversed light cycle. All experiments were approved by the Institutional Animal Care and Use Committee at UT Austin and were carried out in accordance with the NIH Guide for the Care and Use of Laboratory Animals. Separate groups of mice were used for each behavioral test with the exception of the last study depicted in Figure 11, where the same groups of mice were used to measure rotarod ataxia then blood ethanol clearance before and after chronic intermittent ethanol drinking. Animals underwent only one type of procedure in a given day.
Ethanol Drinking
Ethanol (100% stock, Aaper Alcohol and Chemical, Shelbyville, KY) solutions were prepared fresh daily in tap water, and bottles were weighed before placement and after removal from the cages. In all procedures, the location of the ethanol bottle was alternated daily to control for side preferences.
In the two-bottle choice (2BC) procedure, mice had access to one bottle of ethanol and one bottle of water at all times.17 Tlr3 −/− and Tlr3 +/+ male and female mice were offered a series of increasing concentrations of ethanol (3%, 6%, 9%, 12%, and 15% v/v), with each concentration available for 4 days. Ethanol consumption (g/kg body weight/24h) was calculated for each mouse and values were averaged over 4 days with alternating bottle positions for each concentration of ethanol. For chronic 2BC studies in C57BL/6J male mice, 15% ethanol was offered for 22 days.
In the two-bottle choice, every-other-day (2BC-EOD) procedure, Tlr3 −/− and Tlr3 +/+ male and female mice were given EOD access to ethanol (15% v/v for 12 drinking days then 20% v/v for 10 more drinking days) and water for 24-hour sessions, and water only was offered on off-days.18 For chronic 2BC-EOD studies in C57BL/6J male mice, access to 15% ethanol was offered for 16 drinking days (31 total experimental days). To compare 2BC-EOD with 2BC drinking in C57BL/6J male mice, the number of drinking days was adjusted so that the total amount of ethanol (15% v/v) consumed was similar for both groups by the end of testing. For 2BC-EOD studies in Tlr3 −/− and Tlr3 +/+ male mice depicted in Figure 11, access to 15% (v/v) ethanol was offered for 14 drinking days (27 total experimental days). The quantity of ethanol consumed was calculated as g/kg body weight/24h. Each data point represents the average of two drinking days (measured with two different bottle positions).
In a limited-access drinking procedure, two bottles containing either 15% v/v ethanol or water were provided beginning 3 hours after lights were turned off. The bottles remained in place for 3 hours after which time the mice had unlimited access to a bottle of water. Bottle positions were changed daily. The quantity of ethanol consumed was calculated as g/kg body weight/3h. Each data point represents the average of two drinking days (measured with two different bottle positions).
Preference for Saccharin
Mice were tested for saccharin consumption using a 24-hour 2BC protocol in which 1 bottle contained water and the other contained a solution of saccharin. Mice were offered a series of increasing concentrations of saccharin (0.00165%, 0.0033%, 0.0099%, 0.0165%, and 0.033%). Each concentration was offered for 4 days, and bottle positions were alternated daily.
Drug Injections
Injectable ethanol (100% stock, Aaper Alcohol and Chemical) solutions (20%, v/v) were prepared in 0.9% saline and injected i.p. for the behavioral tests described below. Gaboxadol (Sigma-Aldrich, St. Louis, MO; 55 mg/kg) was dissolved in 0.9% saline, and diazepam (Sigma-Aldrich; 5 mg/kg) was prepared as a suspension in 0.9% saline with a few drops of Tween-80. Both drugs were injected i.p. at 0.01 ml/g of body weight.
Conditioned Place Preference (CPP)
For the CPP test, we used a two-chamber apparatus. Prior to training, naïve mice were habituated to both chambers with covered floors, and the next day were given saline i.p. followed by 30-minute access to both chambers. On conditioning day 1, half of the mice from each genotype were given ethanol (2 g/kg, i.p.) and the other half were given an equivalent volume of saline, and all were placed in a chamber containing a bar floor [Bar+] for 5 minutes. On conditioning day 2, the treatment was reversed so that mice that received ethanol on day 1 received saline and vice versa, and all mice were placed in a chamber containing a floor with round holes [Bar-] for 5 minutes. This pattern was repeated for a total of 8 conditioning days. Thus one group received ethanol paired with the Bar+ chamber on conditioning days 1, 3, 5, and 7 and saline paired with the Bar- chamber on conditioning days 2, 4, 6, and 8, while the second group received saline paired with Bar+ on days 1, 3, 5, and 7 and ethanol paired with Bar- on days 2, 4, 6, and 8. Twenty-four hours after the last conditioning session, mice were given saline i.p. and had access to both chambers for 30 minutes. We compared the time spent on the bar floor when it was paired with ethanol [Bar+] with the time spent on the bar floor when it was paired with saline [Bar-].
Conditioned Taste Aversion (CTA)
Mice were adapted to a water-restriction schedule (2 hours of water per day) over a 7-day period. At 48-hour intervals, all mice received 1-hour access to a solution of saccharin (0.15% w/v sodium saccharin in tap water). Immediately after, mice received injections of saline or 2.5 g/kg ethanol. Mice also received 30-minute access to water 5 hours after each saccharin-access period to prevent dehydration. On intervening days, mice had 2-hour continuous access to water at standard times in the morning. Reduced consumption of the saccharin solution was used as the measure of CTA.
Acute Ethanol Withdrawal
Mice were scored for HIC severity 30 minutes before and immediately before ethanol injection, and these pre-drug baseline scores were averaged.19 After injecting a single dose of ethanol in saline (4 g/kg, i.p.), the HIC score was measured every hour until the HIC level returned to baseline. Acute withdrawal was measured as the area under the curve, above the pre-drug level.20
Loss of the Righting Reflex (LORR)
Responses to sedative-hypnotic doses of ethanol (3.6 g/kg, i.p.) or gaboxadol (55 mg/kg, i.p.) were determined using the LORR assay. When mice became ataxic, they were placed in the supine position in V-shaped plastic troughs until they were able to right themselves 3 times within 30 seconds. The duration of the LORR was defined as the time elapsed between being placed in the supine position until recovering the righting reflex.
Rotarod Ataxia
Mice were trained on a fixed speed rotarod (Economex; Columbus Instruments, Columbus, OH) at 10 rpm, and training was considered complete when mice were able to remain on the rotarod for 60 seconds. Every 15 minutes after injection of ethanol (2 g/kg, i.p.) or diazepam (5 mg/kg, i.p.), mice were placed back on the rotarod and latency to fall was measured until mice were able to remain on the rotarod for 60 seconds.
Acute Functional Tolerance
Acute functional tolerance (AFT) to the ataxic effects of ethanol was determined using a two-dose procedure.21 Ethanol-naïve mice were trained to balance on the rotarod (10 rpm) for 60 seconds. After training, mice were given ethanol (1.75 g/kg, i.p.) and placed on the rotarod until they fell off. They were tested in 5-minute intervals until they could balance on the rotarod for 60 seconds. At this time (t1), a retro-orbital blood sample was collected to measure blood ethanol concentration (BEC1). BECs were measured as described previously.19 Mice then received a second ethanol injection (2 g/kg, i.p.) and were tested in 5-minute intervals until they regained the ability to balance on the rotarod for 60 seconds (t2). Then a second blood sample was collected for BEC determination (BEC2). AFT was defined as the difference in BEC at t2 minus t1 (BEC2 - BEC1).
Development of AFT to the ethanol-induced LORR was also determined. Mice received an initial hypnotic dose of ethanol (3.5 g/kg, i.p.). Once the mice lost their righting reflex, they were placed on their backs in a V-shaped trough. The duration of time until the animal could turn over (right itself) 3 times in a 30-second period was recorded (t1) and a blood sample taken for BEC1 measurement. Mice were then given a second ethanol injection (1 g/kg, i.p.) and placed back in the V-shaped troughs. The duration of the second LORR period was recorded and when the mice regained the ability to right themselves (t2), another blood sample was taken for BEC2 measurement. AFT was calculated as the difference in BEC at t2 minus t1 (BEC2 - BEC1).
Blood Ethanol Clearance
We collected retro-orbital blood samples 30, 60, 120, 180, and 240 minutes after i.p. injection of 2 g/kg or 4 g/kg ethanol and measured BECs as described previously.19
Statistical Analysis
Data are reported as mean ± S.E.M values. The number of animals used in each test are reported in the figure legends. Data were first analyzed using the D’Agostino and Pearson normality test in Prism 8.0 (GraphPad Software, Inc., La Jolla, CA). Normally distributed data were then analyzed by ANOVA with post-hoc Tukey, Sidak or Bonferroni tests, or by Student’s t-tests, as appropriate.
Results
Ethanol consumption and preference
Because female C57BL/6J mice drink more ethanol with higher preference than males and because ethanol concentration also influences consumption, we analyzed the drinking data separately by sex and by ethanol concentration. In male Tlr3 −/− mice, 2BC-EOD ethanol intake and preference were reduced at both ethanol concentrations (15% and 20%) compared with Tlr3 +/+ littermates. There was a slight increase in total fluid intake in Tlr3 −/− mice that could have contributed to the significant decrease in preference for ethanol (Figure 1A-C; Table S1). However, in female mice, there were no effects of genotype on ethanol intake, preference, or total fluid intake at either concentration of ethanol (Figure 1D-F; Table S1). To investigate a specific genotype x sex interaction, we performed a three-way ANOVA of data across all drinking sessions (Table S2) and found significant genotype x sex effects for preference [F(1,35) = 4.97, p = 0.0324] and total fluid intake [F(1,35) = 6.79, p = 0.0134], but not for ethanol intake [F(1,35) = 1.49, p = 0.2301].
Figure 1.
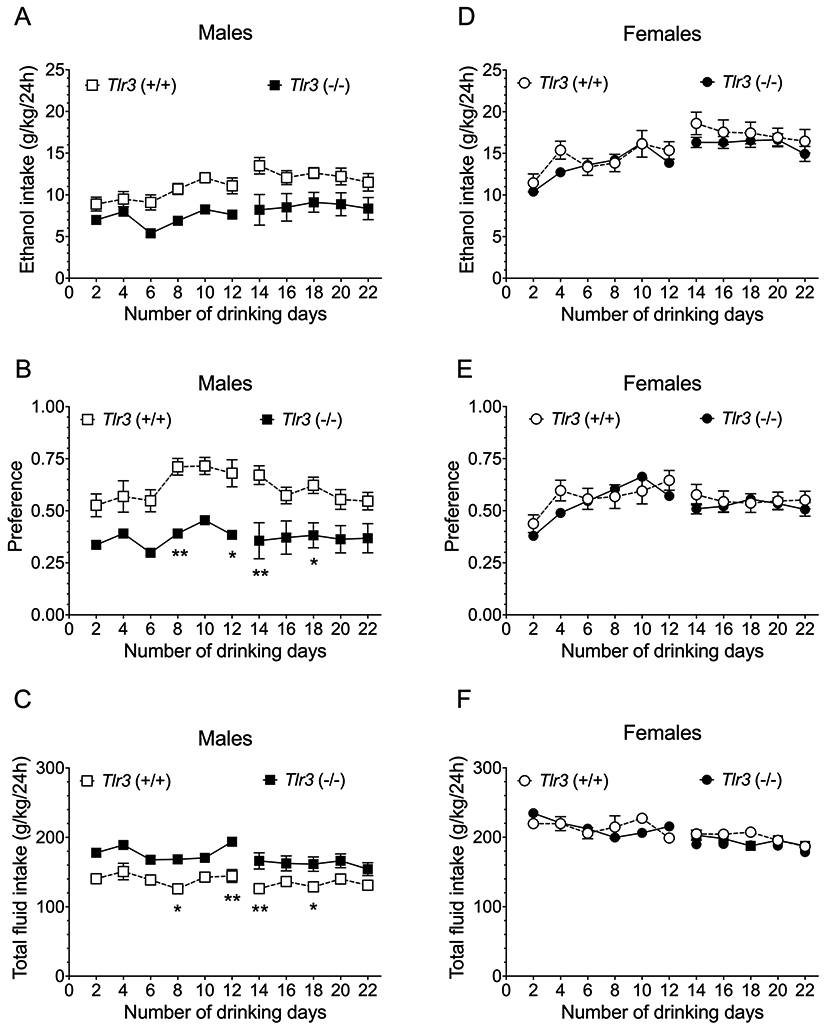
Tlr3 −/− mice show lower ethanol intake than Tlr3 +/+ mice in males but not females in the two-bottle choice-every-other-day (2BC-EOD) procedure. (A,D) Ethanol (15 and 20% v/v) consumption (g/kg/24 hours), (B,E) Preference for ethanol (15 and 20% v/v), and (C,F) Total fluid intake (g/kg/24 hours) in male (n = 10 per genotype) and female (n = 9-10 per genotype) mice. Each data point represents the average of two drinking days (measured with two different bottle positions). Drinking days 2-12 show data collected with 15% ethanol, and drinking days 14-22 show 20% ethanol data (*p < 0.05 and **p < 0.01 compared with corresponding Tlr3 +/+ mice).
In the continuous 2BC procedure, male and female Tlr3 −/− mice did not differ from Tlr3 +/+ mice in ethanol intake or preference, or in total fluid intake (Figure 2; Table S3), and three-way ANOVA of data from males and females did not show significant genotype x sex interactions for any drinking parameter (Table S4). Likewise, in the 2BC limited-access procedure, male Tlr3 −/− and Tlr3 +/+ mice did not differ in ethanol (15% v/v) consumption or preference for ethanol (Figure 3A and B; Table S5), although Tlr3 −/− male mice showed slightly decreased total fluid intake compared with Tlr3 +/+ mice (Figure 3C; Table S5). No genotype differences were found in female mice for any drinking parameter in the 2BC limited-access procedure (Figure 3D-F; Table S5). There was a genotype x sex effect for total intake [F(1,36) = 4.69, p = 0.0370], but not for ethanol intake or preference (Table S6). Therefore, the Tlr3 null mutation only reduced ethanol consumption in males and only in the 2BC-EOD procedure.
Figure 2.
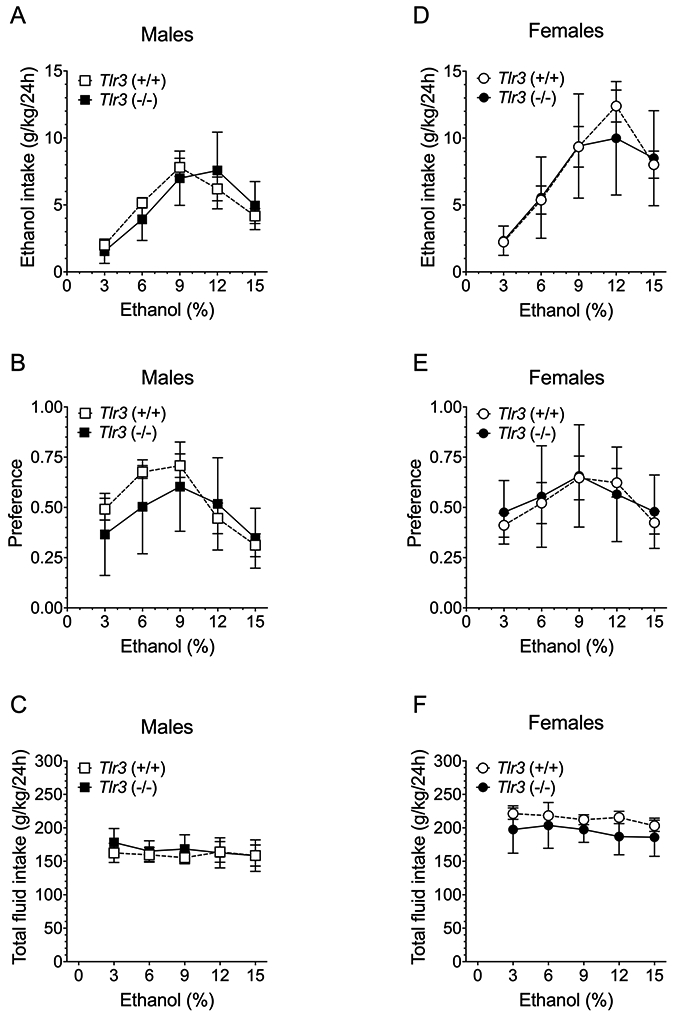
Tlr3 −/− and Tlr3 +/+ mice show similar ethanol intake in the continuous access 2BC procedure. (A,D) Ethanol consumption (g/kg/24 hours), (B,E) Preference for ethanol, and (C,F) Total fluid intake (g/kg/24 hours) in male (n = 9 per genotype) and female (n = 9-10 per genotype) mice. Each data point represents the average of four drinking days.
Figure 3.
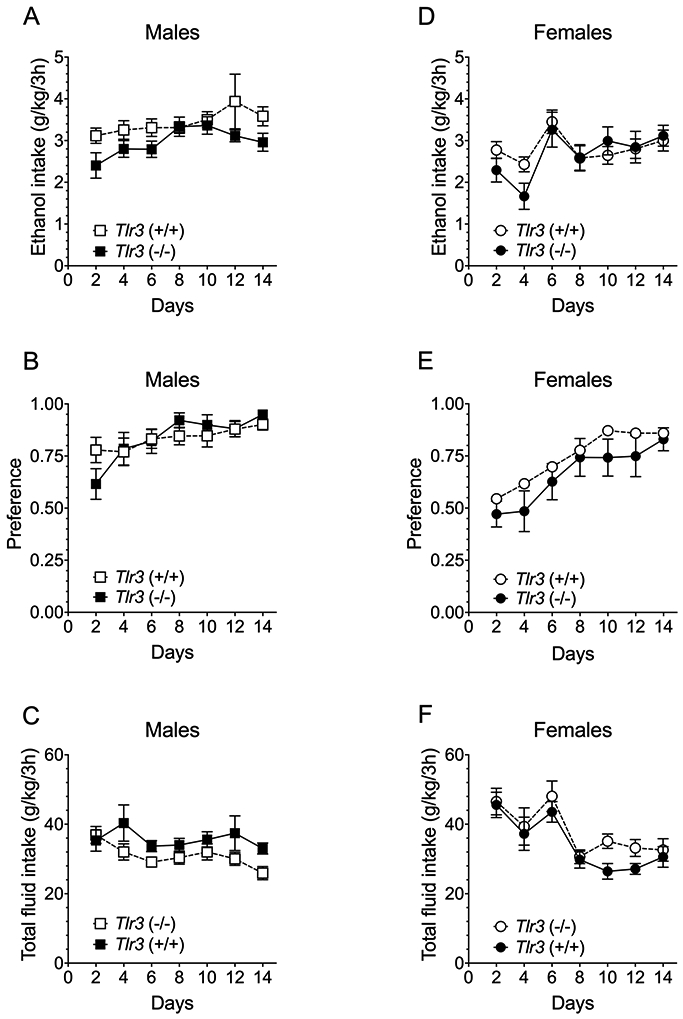
Tlr3 −/− and Tlr3 +/+ mice show similar ethanol intake in the 2BC limited-access procedure. (A,D) Ethanol (15% v/v) consumption (g/kg/3 hours), (B,E) Preference for ethanol, and (C,F) Total fluid intake (g/kg/3 hours) in male (n = 10 per genotype) and female (n = 10 per genotype) mice. Each data point represents the average of two drinking days (measured with two different bottle positions).
Saccharin preference
To examine whether reduced ethanol consumption in Tlr3 −/− male mice was due to a general decrease in consumption of rewarding substances, we measured saccharin preference. Male and female mice showed concentration-dependent increases in saccharin preference [Males: F(4,72) = 15.3, p < 0.0001; Females: F(4,72) = 17.9, p < 0.0001] and total fluid intake [Males: F(4,720 = 92.8, p < 0.0001; Females: F(4,72) = 43.1, p < 0.0001] (Figure S1). There was no significant main effect of genotype or a significant concentration x genotype interaction in preference for saccharin or total fluid intake in either sex.
Conditioned place preference (CPP) for ethanol
We examined CPP as a measure of the rewarding properties of ethanol. In males, only Tlr3 −/− mice developed CPP for 2 g/kg ethanol [F ethanol pairing x genotype (1,35) = 9.74, p = 0.0036; Figure 4A]. In contrast, both Tlr3 +/+ and Tlr3 −/− females developed CPP [F ethanol pairing (1,31) = 61.5, p < 0.0001; F genotype (1,31) = 1.43, p = 0.2415; F ethanol pairing x genotype (1,31) = 0.363, p = 0.5512; Figure 4A]. To examine sex x genotype interactions, we performed a 3-way ANOVA and found a significant effect of ethanol floor pairing x genotype x sex [F(1,66) = 6.91, p = 0.0107; Figure 4A]. Because Myd88 −/− mice show increased consumption of ethanol,6 we also examined ethanol CPP in these mice. Both Myd88 +/+ and Myd88 −/− male mice developed ethanol CPP [F ethanol pairing (1,30) = 9.36, p = 0.0046; F genotype (1,30) = 0.149, p = 0.7022; F ethanol pairing x genotype (1,30) = 0.428, p = 0.5181; Figure 4B]. Female Myd88 +/+ and Myd88 −/− mice also developed CPP for ethanol [F ethanol pairing (1,38) = 14.05, p = 0.0006; F genotype (1,38) = 11.45, p = 0.0017; F ethanol pairing x genotype (1,38) = 0.002497, p = 0.9604; Figure 4B]. Three-way ANOVA did not show a significant interaction of genotype x sex [F(1,68) = 0.1339, p = 0.7165] or of genotype x ethanol floor pairing x sex [F(1,68) = 0.193, p = 0.6618; Figure 4B]. Overall, null mutations in Tlr3 or Myd88 appear to have little or no effect on ethanol CPP.
Figure 4.
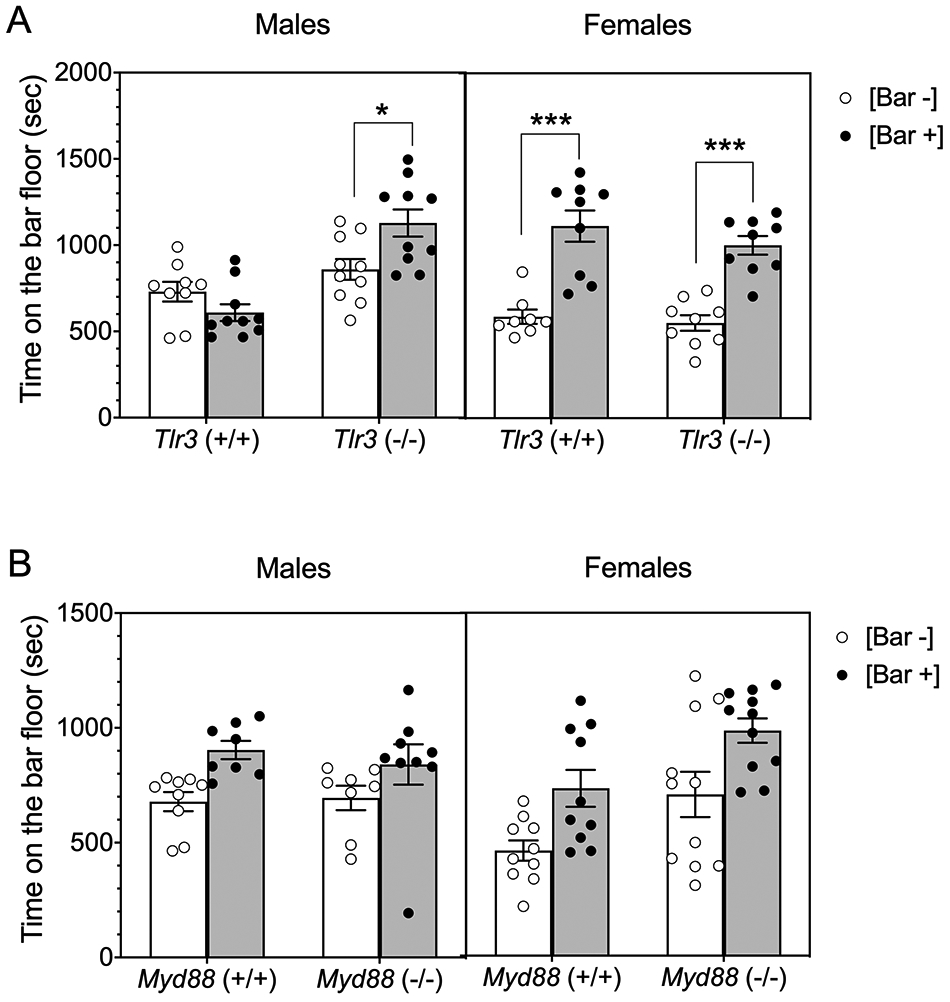
Male Tlr3 −/− mice show more and male Myd88 −/− mice show similar conditioned place preference (CPP) for ethanol (2 g/kg) than corresponding wild-type mice. (A) Time spent on the bar floor when paired with ethanol [Bar +] and when paired with saline [Bar −] in Tlr3 −/− and Tlr3 +/+ male (n = 9-10 per genotype) and female (n = 8-9 per genotype) mice (*p < 0.05, ***p < 0.001). (B) Time spent on the bar floor when paired with ethanol [Bar +] and when paired with saline [Bar −] in Myd88 −/− and Myd88 +/+ male (n = 8-9 per genotype) and female (n = 10-11 per genotype) mice.
Ethanol conditioned taste aversion (CTA)
CTA is used as an index of aversion to ethanol, and performance on this test is negatively correlated with voluntary ethanol intake.22 We investigated whether decreased ethanol consumption in Tlr3 −/− mice could be related to increased ethanol CTA by measuring consumption of saccharin paired with injections of ethanol or saline. To account for initial fluctuations in saccharin intake and potential sex differences, we normalized intake for each subject by dividing the amount of saccharin solution consumed on conditioning trials by the amount consumed during the first trial before conditioning.
In male mice (Figure 5A), ethanol (2.5 g/kg)-saccharin pairings reduced saccharin (0.15% w/v) intake across trials compared with saline-saccharin pairings, indicating the development of CTA to ethanol [F trial x ethanol pairing (4, 136) = 8.22, p < 0.0001] with no difference between genotypes [F genotype (1,34) = 0.229, p = 0.6356; F genotype x ethanol pairing (1,34) = 1.07, p = 0.3077; F genotype x trial x ethanol pairing (4,136) = 0.744, p = 0.5639]. Female mice (Figure 5B) also developed CTA to ethanol [F trial x ethanol pairing (4, 144) = 2.65, p = 0.0359] with no difference between genotypes [F genotype (1,36) = 1.00, p = 0.3233; F genotype x ethanol pairing (1,36) = 0.0088, p = 0.9259; F genotype x trial x ethanol pairing (4,144) = 1.91, p = 0.1122].
Figure 5.
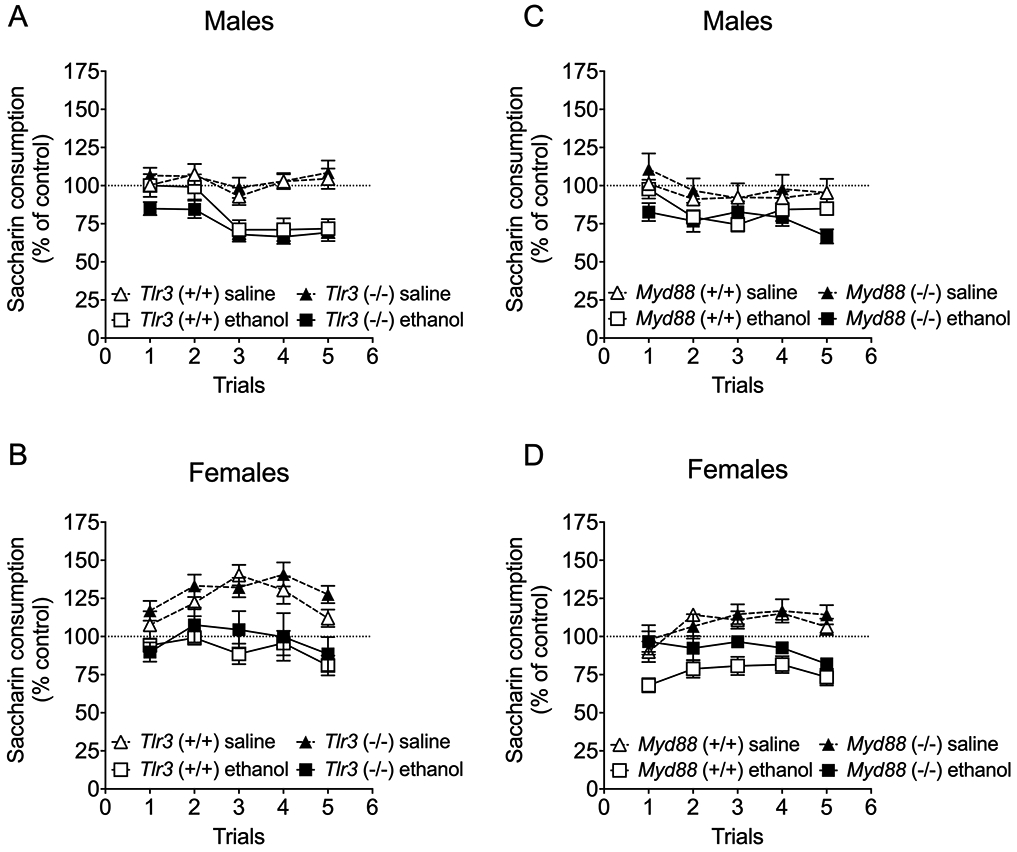
Acquisition of ethanol-induced conditioned taste aversion is not altered in Tlr3 −/− and Myd88 −/− mice. Changes in saccharin consumption produced by injection of saline or ethanol (2.5 g/kg) expressed as a percent of the control preconditioning trial in (A) male Tlr3 +/+ and Tlr3 −/− mice (n = 8-10 per group per genotype), (B) female) Tlr3 +/+ and Tlr3 −/− mice (n = 10 per group per genotype, (C) male Myd88 +/+ and Myd88 −/− mice (n = 6-9 per group per genotype), and (D) female Myd88 +/+ and Myd88 −/− mice (n = 5-10 per group per genotype).
We also examined CTA to ethanol in Myd88 +/+ and Myd88 −/− mice and found that males (Figure 5C) developed CTA to ethanol [F ethanol pairing (1,25) = 10.89, p = 0.0029] with no difference between genotypes [F genotype (1,25) = 0.0654, p = 0.8002; F genotype x ethanol pairing (1,25) = 1.26, p = 0.2732; F genotype x trial x ethanol pairing (4,100) = 2.26, p = 0.06878]. Females (Figure 5D) also developed CTA to ethanol [F trial x ethanol pairing (4, 116) = 4.82, p = 0.0012] with no difference between genotypes [F genotype (1,29) = 2.78, p = 0.1065; F genotype x ethanol pairing (1,29) = 1.38, p = 0.2504; F genotype x trial x ethanol pairing (4,116) = 1.40, p = 0.2377].
Acute ethanol withdrawal
The severity of handling-induced convulsions (HIC) is negatively correlated with ethanol intake in the continuous 2BC procedure.23 Because we did not detect differences in 2BC drinking, we did not expect to find differences in HIC scores between Tlr3 +/+ and Tlr3 −/− mice of either sex. A single ethanol dose (4 g/kg) initially suppressed basal HICs in all groups of mice for ~5h followed by increased HIC scores above baseline (Figure S2 A and B). When comparing the area of above basal levels (i.e., severity of withdrawal) in males and females, there was sex-dependent effect [F(1,34) = 11.47, p = 0.0018], but no genotype [F(1,34) = 2.25, p = 0.1433] or sex x genotype [F(1,34) = 0.0006, p = 0.9802] effects. (Figure S2 C). There were no significant effects of sex, genotype, or sex x genotype in basal levels of HICs in male and female mice (Figure S2 D).
Drug-induced loss of righting reflex
In humans, heightened perception of unpleasant sedative effects of alcohol has been associated with reduced risk of heavy alcohol consumption.24 To examine whether ethanol intoxication is enhanced in male Tlr3 −/− mice, we first measured their response to a sedative-hypnotic dose of ethanol using the LORR assay. For some mutant mice, the duration of the LORR is negatively correlated with voluntary ethanol consumption.25 Compared with Tlr3 +/+ littermates, Tlr3 −/− male, but not female mice, demonstrated longer duration of the LORR after administration of 3.6 g/kg of ethanol [F genotype x sex (1,19) = 64.03, p < 0.0001; Figure 6A] or 55 mg/kg of gaboxadol [F genotype x sex (1,19) = 23.62, p = 0.0001; Figure 6B].
Figure 6.
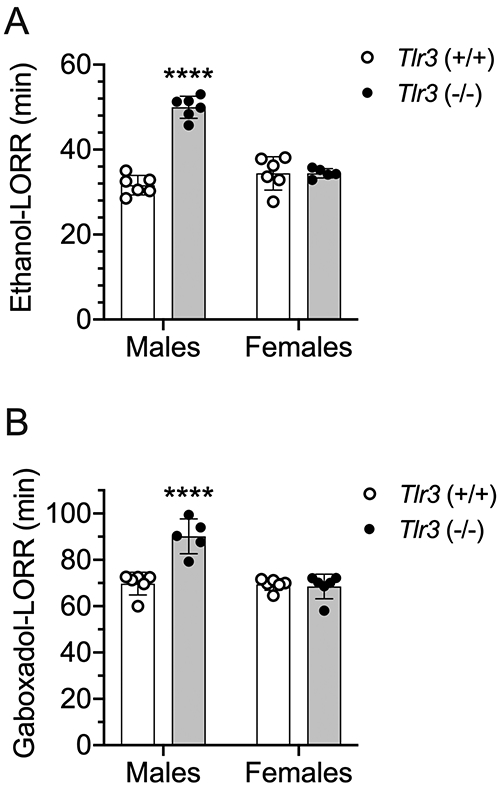
Male but not female Tlr3 −/− mice show prolonged duration of loss of the righting reflex (LORR) induced by ethanol and gaboxadol. (A) Duration of ethanol (3.6 g/kg)-induced LORR (min) in male (n = 6 per genotype) and female (n = 5-6 per genotype) Tlr3 +/+ and Tlr3 −/− mice. (B) Duration of gaboxadol (55 mg/kg)-induced LORR (min) in male (n = 5-6 per genotype) and female (n = 6 per genotype) Tlr3 +/+ and Tlr3 −/− mice (****p < 0.0001 compared with corresponding Tlr3 +/+ mice).
Recovery from drug-induced rotarod ataxia
We next measured the response of these mice to a lower ataxic dose of ethanol. Tlr3 −/− male, but not female, mice showed prolonged recovery from ethanol (2 g/kg)-induced rotarod ataxia compared with wild-type littermates [F genotype x sex (1,16) = 12.36, p = 0.0029; Figure 7A and B]. Tlr3 −/− male, but not female, mice also showed prolonged recovery from diazepam (6 mg/kg)-induced ataxia compared with wild-type littermates [F genotype x sex (1,20) = 11.03, p = 0.0034; Figure 7C and D] (Figure 7D).
Figure 7.
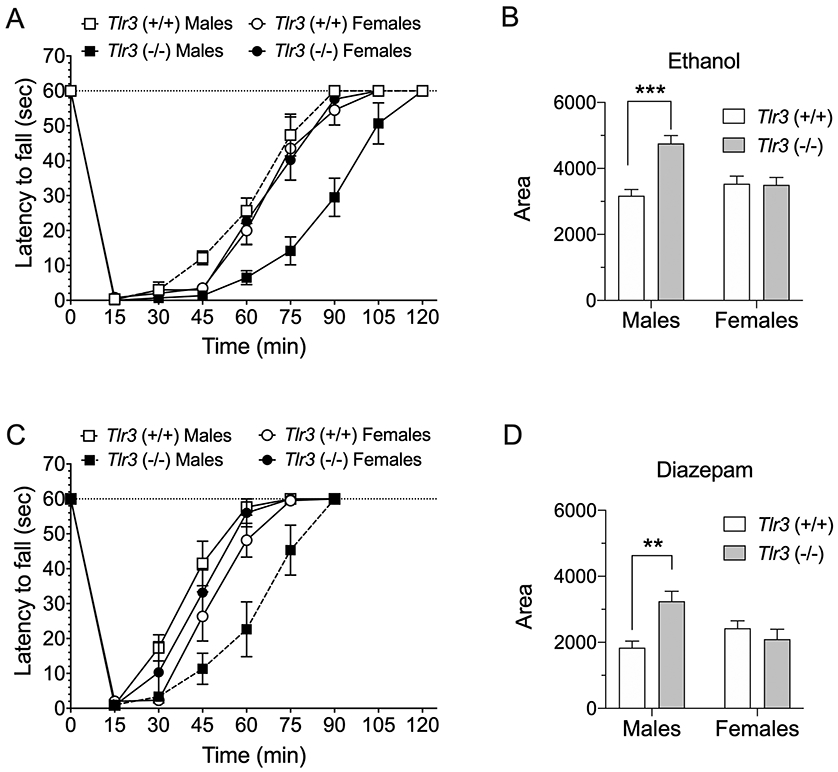
Male but not female Tlr3 −/− mice show prolonged motor impairment induced by ethanol or diazepam. Tlr3 −/− male mice took longer to recover than Tlr3 +/+ littermates from rotarod ataxia induced by (A) ethanol (2 g/kg, i.p.) or (C) diazepam (6 mg/kg, i.p.) (n = 6 per genotype). There were no genotype differences in recovery from rotarod ataxia induced by (A) ethanol (n = 4-5 per genotype) or (C) diazepam in female mice (n = 6 per genotype). (B,D) The area below basal level and above the recovery curve was greater in male, but not female, Tlr3 −/− mice compared with their wild-type littermates (***p < 0.001 for ethanol and **p < 0.01 for diazepam).
Acute functional tolerance to ethanol-induced ataxia
Differences in time to recover from drug-induced ataxia suggest that male Tlr3 +/+ and Tlr3 −/− differ in their development of acute functional tolerance. To test this possibility, we used the rotarod test to measure acute tolerance to the ataxic effects of ethanol. The times to recover from motor impairment after the first (1.75 g/kg) and second ethanol (2 g/kg) injections were longer in Tlr3 −/− than in Tlr3 +/+ mice, particularly after the second injection [F genotype x injection (1,14) = 318, p < 0.0001; Figure 8A]. BECs at the time of recovery were lower in Tlr3 −/− males upon recovery from the second ethanol injection [F genotype x injection (1,14) = 4.84, p = 0.0451; Figure 8B]. AFT (defined as BEC2 - BEC1) to the ataxic effects of ethanol was lower in Tlr3 −/− than in Tlr3 +/+ males [t(14) = 2.2, p = 0.0451; Figure 8C].
Figure 8.
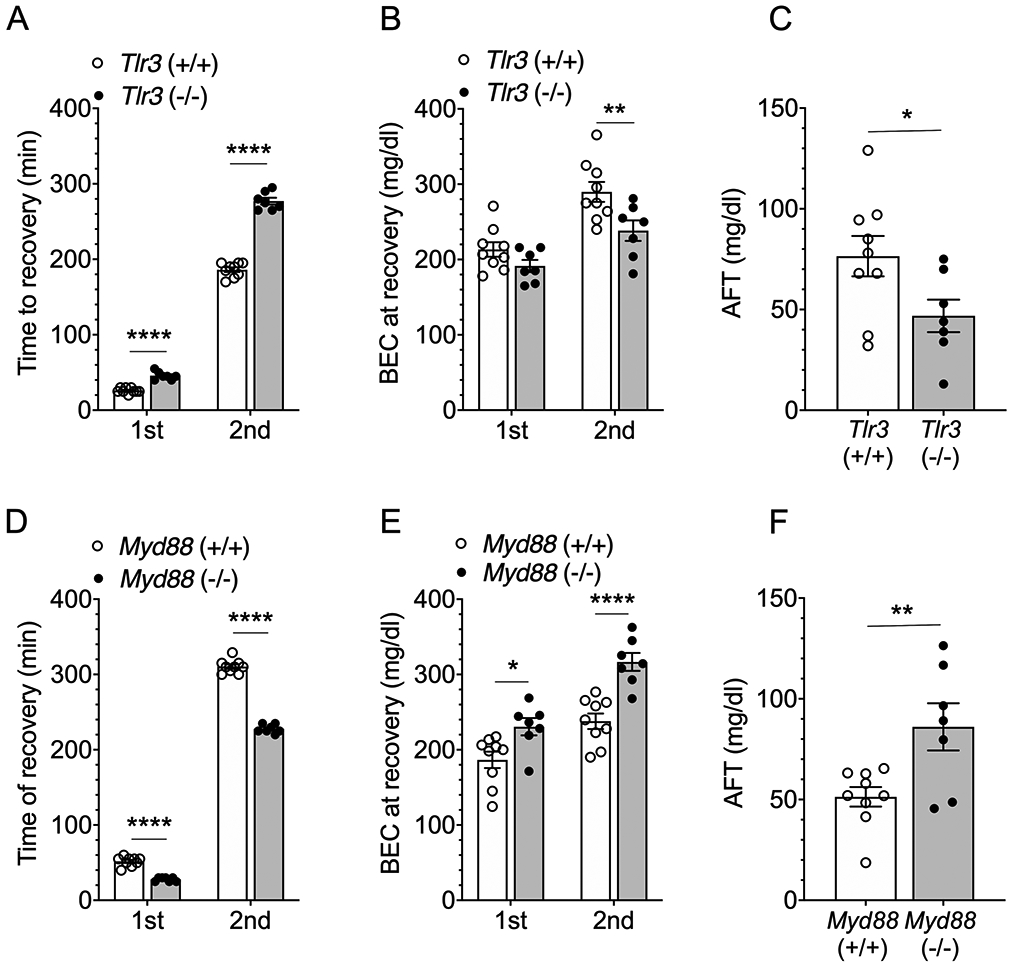
Acute functional tolerance (AFT) to ethanol-induced rotarod ataxia is reduced in male Tlr3 −/− mice and increased in male Myd88 −/− mice compared with their corresponding wild-type littermates. (A) Time to regain the ability to remain on the rotarod for 60 seconds after the first (1.75 g/kg) and second (2 g/kg) ethanol injections in Tlr3 +/+ and Tlr3 −/− male mice (n = 7-9 per genotype). (B) Blood ethanol concentrations (BECs) measured at the time of regaining motor function after the first and second ethanol injections. (C) AFT measured as the difference in BEC after the two ethanol injections (BEC2 - BEC1). (D) Time to regain the ability to remain on the rotarod for 60 seconds after the first (1.75 g/kg) and second (2 g/kg) ethanol injections in Myd88 +/+ and Myd88 −/− male mice (n = 7-9 per genotype). (E) BECs measured at the time of regaining motor function after the first and second ethanol injections. (F) AFT measured as BEC2 - BEC1. *p < 0.05, **p < 0.01, and ****p < 0.0001 compared with corresponding wild-type mice by Bonferroni post-hoc (A,B,D,E) or two-tailed t-tests (C,F).
Because Myd88 −/− mice drink more ethanol than their wild-type littermates,6 we predicted that in contrast to Tlr3 −/− mice, Myd88 −/− mice would show increased AFT to ethanol. Indeed, recovery from motor impairment after the first and second ethanol injections was shorter in Myd88 −/− than in Myd88 +/+ male mice [F genotype x injection (1,14) = 336, p < 0.0001; Figure 8D]. Myd88 −/− males recovered at higher BECs than Myd88 +/+ littermates [F genotype x injection (1,14) = 8.95, p < 0.0097; Figure 8E]. AFT to the ataxic effects of ethanol was greater in Myd88 −/− male mice than in Myd88 +/+ mice [t(14) = 2.99, p = 0.0097; Figure 8F].
Acute functional tolerance to ethanol-induced LORR
To determine if acute tolerance to a higher concentration of ethanol was altered in the null mutant mice, we measured AFT to the sedative-hypnotic effects of ethanol. The duration of the LORR after the first (3.5 g/kg) and second (1 g/kg) ethanol injections was longer in Tlr3 −/− than in Tlr3 +/+ male mice [F genotype x injection (1,15) = 8.88, p = 0.0093; Figure 9A]. BECs were modestly higher after recovery from the second ethanol injection compared with recovery after the first injection [F injection (1,13) = 9.02, p = 0.0102; Figure 9B], but this result was not different between genotypes [F genotype (1,13) = 3.89, p = 0.0703; F genotype x injection (1,13) = 0.504, p = 0.4902]. AFT to the sedative-hypnotic effects of ethanol did not differ between Tlr3 +/+ and Tlr3 −/− male mice [t (13) = 0.71, p = 0.4902; Figure 9C].
Figure 9.
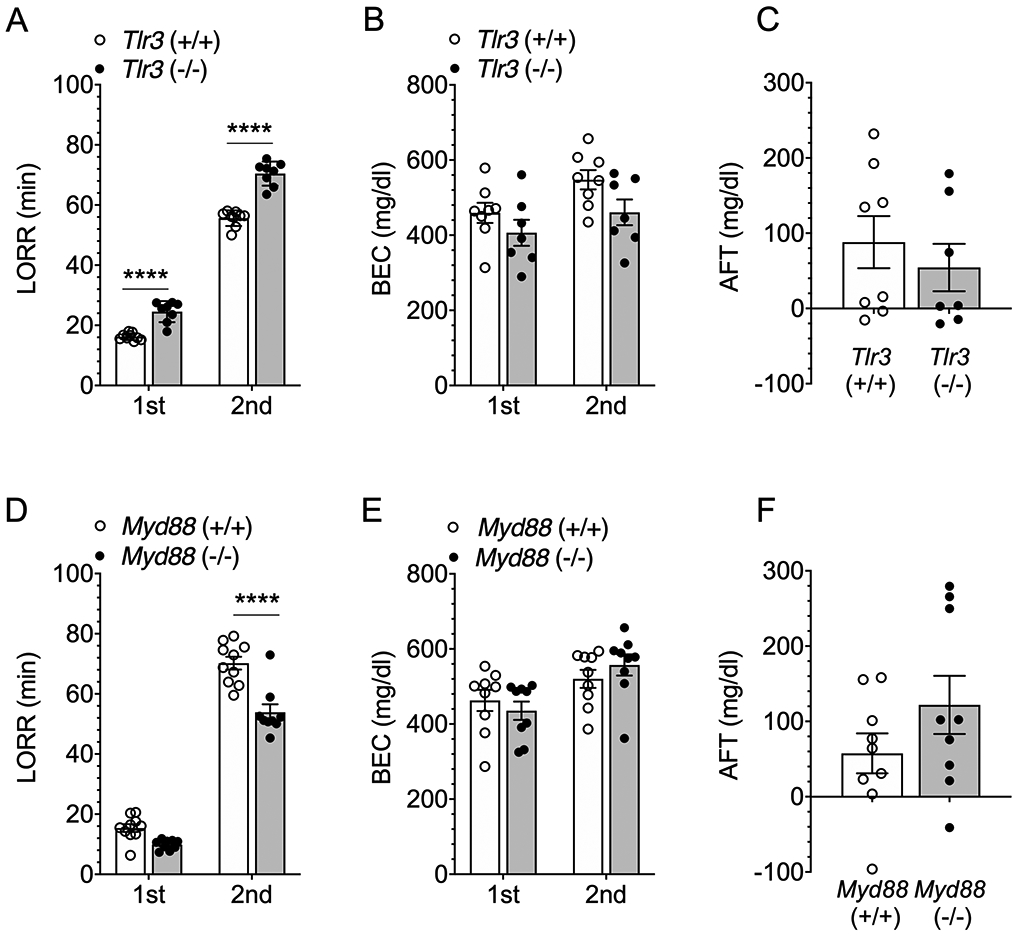
Acute functional tolerance (AFT) to ethanol-induced loss of the righting reflex (LORR) is not altered in male Tlr3 −/− or Myd88 −/− mice compared with their corresponding wild-type littermates. (A) Duration of the loss of righting reflex (LORR) after the first (3.5 g/kg) and second (1 g/kg) ethanol injections in Tlr3 +/+ and Tlr3 −/− male mice (n = 8-9 per genotype). (B) Blood ethanol concentrations (BEC) measured at the time of regaining function after the first and second ethanol injections (n = 7-8 per genotype). (C) AFT measured as BEC2 - BEC1 (n = 7-8 per genotype). (D) Duration of the LORR after the first (3.5 g/kg) and second (1 g/kg) ethanol injections in Myd88 +/+ and Myd88 −/− male mice (n = 9-10 per genotype). (E) BECs measured at the time of regaining function after the first and second ethanol injections (n = 9 per genotype). (F) AFT measured as BEC2 - BEC1 (n = 9 per genotype). ****p < 0.0001 compared with corresponding wild-type mice by Bonferroni post-hoc (A, D) tests.
In contrast to Tlr3 −/− mice, the recovery from the ethanol-induced LORR was faster in Myd88 −/− than in Myd88 +/+ male mice [F genotype x injection (1,17) = 8.71, p = 0.0089; Figure 9D]. This result agrees with our previous study in which we found decreased duration of the ethanol-induced LORR in Myd88 −/− mice.6 BECs were slightly higher after recovery from the second ethanol injection compared with recovery from the first [F injection (1,16) = 14.6, p = 0.0015], but this did not differ by genotype [F genotype (1,16) = 0.032, p = 0.8614; F genotype x injection (1,16) = 1.89, p = 0.1887; Figure 9E]. AFT to the sedative/hypnotic effects of ethanol also did not differ between Myd88 +/+ and Myd88 −/− male mice [t(16) = 1.37, p = 0.1887; Figure 9F].
Blood ethanol clearance
To examine potential effects of TLR3 on ethanol metabolism that may explain the genotype differences found in this study, we measured the clearance of ethanol (4 g/kg) from blood in Tlr3 +/+ and Tlr3 −/− mice. Comparison of the slopes of the regression lines showed no genotype differences in male [−78.7 ± 6.7 (n = 4) for Tlr3 +/+ and −83.6 ± 10.4 (n = 5) for Tlr3 −/−] or in female mice [−71.6 ± 5.5 for Tlr3 +/+ (n = 5) and −83.4 ± 11.1 (n = 5) for Tlr3 −/−]. We previously compared blood ethanol clearance in Myd88 +/+ and Myd88 −/− female mice and also found no genotype differences 5.
Relationship between acute tolerance and ethanol drinking procedure
Our results indicate that male Tlr3 −/− mice consume less alcohol in the 2BC-EOD procedure, but not in the continuous 2BC or limited-access procedure, and also show reduced AFT to alcohol compared with Tlr3 +/+ male littermates. These findings led us to hypothesize that 2BC-EOD leads to periods of alcohol intake high enough to induce alcohol tolerance. To investigate whether 2BC-EOD triggers the development of acute tolerance, we compared ethanol-induced rotarod ataxia and blood ethanol clearance after chronic alcohol consumption in the 2BC-EOD versus 2BC procedures in C57BL/6J male mice. The time periods were adjusted so that mice consumed a similar total amount of ethanol (15% v/v) in both groups by the end of testing. The 2BC group had access to 22 continuous days of ethanol, and the 2BC-EOD group had access for 16 drinking days over 31 total experimental days, resulting in similar cumulative (total) amounts of ethanol consumed by both groups at the end of the study. Average total consumption of ethanol (15% v/v) was 156.4 ± 9.1 g/kg (n = 10) for the 2BC group and 157.5 ± 6.3 g/kg (n = 10) for the 2BC-EOD procedure (Figure S3). Ethanol consumption and preference increased over time in the 2BC-EOD group (Figure S3). After 2BC-EOD, C57BL/6J male mice recovered more quickly from ethanol-induced ataxia than mice that underwent 2BC drinking or control mice that were ethanol-naïve at the time of rotarod testing (Figure 10A). Comparison of the areas below the basal level and above the recovery curves showed a shorter period of ataxia for mice that underwent 2BC-EOD drinking, but no difference between control mice and mice that underwent the 2BC procedure [F(2,27) = 21.23, p < 0.0001; Figure 10B].
Figure 10.
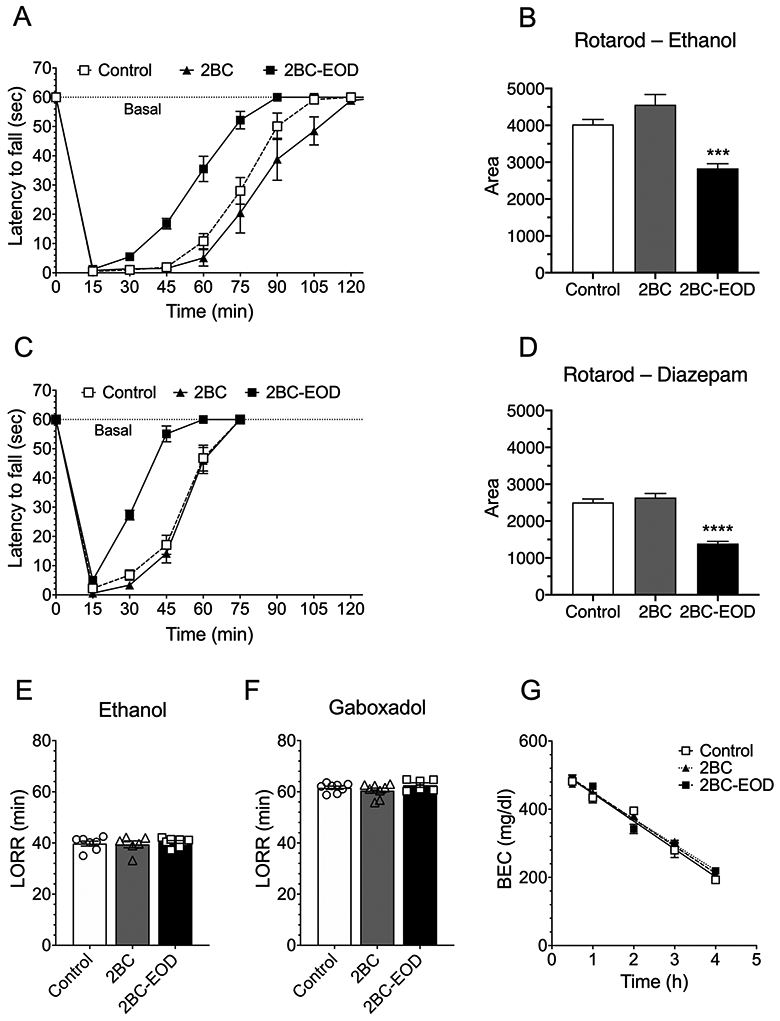
Faster recovery from ethanol- and diazepam-induced motor impairment in C57BL/6J male mice after two-bottle choice-every-other-day (2BC-EOD) drinking. Drug-induced ataxia on the rotarod was compared in three groups of mice: ethanol-naïve controls, mice that underwent a continuous 2BC ethanol (15% v/v) procedure for 22 days, and mice that underwent a 2BC-EOD (15% v/v) procedure for 16 drinking days (the two chronic ethanol-treated groups consumed similar total amounts of ethanol by the end of testing). (A) Time on the rotarod after ethanol (2 g/kg, i.p.) in control and chronic ethanol-exposed mice (n = 10 per group). (B) Area below the basal level and above the recovery curves after injection of ethanol (***p < 0.001 compared with control). (C) Time on the rotarod after diazepam (6 mg/kg, i.p.) in control and chronic ethanol exposed mice (n = 9-12 per group). (D) Area below the basal level and above the recovery curves after injection of diazepam (****p < 0.0001 compared with control). (E) Duration of ethanol (3.6 g/kg)-induced LORR in control and chronic ethanol exposed mice (n = 6-9 per group. (F) Duration of gaboxadol (55 mg/kg)-induced LORR (min) in control and chronic ethanol exposed mice (n = 6-8 per group). (G) Blood ethanol concentrations (BEC) measured over 4 hours in control and chronic-ethanol exposed mice after injection of ethanol (4 g/kg, i.p.; n = 6-7 per group).
The 2BC-EOD group also showed faster recovery from diazepam-induced motor impairment compared with control mice (Figure 10C). Comparison of the areas below the basal level and above the recovery curves showed a shorter period of diazepam-induced ataxia for mice that underwent 2BC-EOD drinking, but no difference between control mice and mice that underwent the 2BC procedure [F(2,28) = 53.82, p < 0.0001; Figure 10D]. In contrast to its effect on acute drug-induced ataxia in C57BL/6J male mice, 2BC-EOD drinking did not alter the duration of the LORR after administration of 3.6 g/kg of ethanol (Figure 10E) or 55 mg/kg of gaboxadol (Figure 10F) compared with 2BC or ethanol-naïve control groups. The faster recovery from ethanol-induced ataxia in 2BC-EOD exposed mice was not due to differences in the clearance of ethanol (4 g/kg) from blood, since we found no difference between control mice and mice that underwent the 2BC or the 2BC-EOD drinking procedure (Figure 10G). The slopes of the regression lines were −81.6 ± 5.2 (control, n = 6), −79.2 ± 4.4 (2BC-EOD, n = 7), and −75.3 ± 3.3 (2BC, n = 6). As reported earlier in this study, similar slopes were measured in Tlr3 mutant mice. Thus, despite similar total amounts of alcohol consumption and similar metabolism of alcohol in the 2BC and 2BC-EOD groups, changes in acute tolerance to the intoxicating effects of alcohol occurred only after 2BC-EOD drinking.
Inverse relationship between levels of 2BC-EOD ethanol drinking and recovery time from ethanol-induced ataxia
To understand how differences in AFT may be related to ethanol consumption in the 2BC-EOD drinking procedure, we examined ataxia and then blood ethanol clearance (on consecutive days) in wild-type versus Tlr3 −/− male mice before and beginning 24 hours after these mice underwent 2BC-EOD drinking (Figure 11). Compared with wild-type, Tlr3 −/− male mice consumed less ethanol (15%) [(F genotype (1,10) = 4.97, p = 0.0500] but did not differ in ethanol preference [(F genotype (1,10) = 3.97, p = 0.0744] or in total fluid consumption [(F genotype (1,10) = 1.19, p = 0.2999] (Figures 11A-C), similar to the decreased ethanol drinking shown in Figure 1. Before and after 2BC-EOD, Tlr3 −/− mice showed prolonged recovery from ethanol (2 g/kg)-induced ataxia [F genotype (1,10) = 49.31, p < 0.0001; F genotype x time (8,80) = 18.35, p < 0.0001; Figure 11D], in agreement with our results shown in Figure 7A in naïve mice. Areas below basal levels and above the recovery curves are shown in Figure 11E [F genotype (1,10) = 69.52, p < 0.0001; F genotype x time (1,10) = 2.58, p = 0.1396]. Both wild-type and mutant mice showed similar faster recovery from ethanol-induced ataxia after 2BC-EOD drinking. Figure 11F (left panel) shows the correlation between the initial area below basal (Figure 11E) for every individual ethanol-naïve mouse with their initial level of ethanol intake on drinking days 1 and 2 (Figure 11A). Longer recovery from initial ethanol ataxia negatively correlated with initial level of drinking (r = −0.5837, p = 0.0463). Figure 11F (right panel) shows the correlation between the final area below basal for every individual mouse with their final level of ethanol intake at the end of the study on drinking days 13 and 14. Longer recovery from ethanol ataxia after 2BC-EOD drinking also negatively correlated with the final levels of drinking (r = −0.5946, p = 0.0414). We measured blood ethanol clearance after injection of 2 g/kg ethanol (the same dose used for rotarod ataxia) and compared slopes of the regression lines but found no genotype differences before or after the 2BC-EOD procedure (Figures 11G-I). After 2BC-EOD drinking, both mutant and wild-type mice developed modest tolerance that was not due to changes in ethanol clearance. These results are similar to what we found in C57BL/6J male mice after 2BC-EOD (but not 2BC) alcohol drinking (Figure 10).
Figure 11.
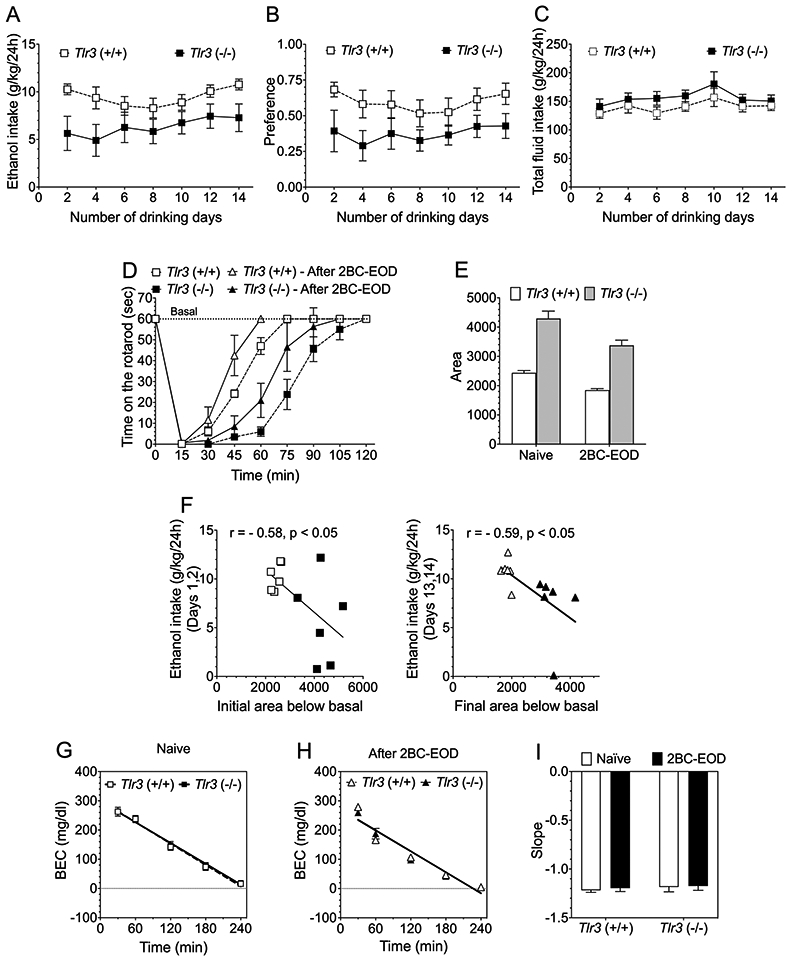
Inverse relationship between levels of two-bottle choice-every-other-day (2BC-EOD) ethanol consumption and recovery time from ataxia in Tlr3 −/− and Tlr3 +/+ male mice. Ethanol-induced rotarod ataxia and then blood ethanol clearance were measured on consecutive days before and beginning 24 hours after the 2BC-EOD drinking procedure. (A) Ethanol (15% v/v) consumption (g/kg/24 hours), (B) ethanol preference, and (C) total fluid intake (g/kg/24 hours) in wild-type and Tlr3 −/− male mice (n = 6 per genotype). Each data point represents the average of two drinking days (measured with two different bottle positions). (D) Time on the rotarod after ethanol (2 g/kg, i.p.) in wild-type and Tlr3 −/− ethanol-naïve and 2BC-EOD exposed male mice (n = 6 per group). (E) Areas below the basal level and above the recovery curves after ethanol injection. (F, left panel) Correlation between initial ethanol intake (g/kg/24h) on drinking days 1 and 2 (A) and initial area below basal (E) from individual mice from both genotypes (open symbols represent Tlr3 +/+ and filled symbols represent Tlr3 −/− male mice; n = 6 per genotype). (F, right panel) Correlation between final levels of ethanol intake (g/kg/24h) on drinking days 13 and 14 (A) and final area below basal (E) from individual mice from both genotypes (open symbols represent Tlr3 +/+ and filled symbols represent Tlr3 −/− male mice; n = 6 per genotype). Blood ethanol concentrations (BEC) after 2 g/kg ethanol (i.p.) in (G) ethanol-naïve (n = 4 per genotype) and (H) 2BC-EOD exposed (n = 6 per genotype) mice. (I) Slopes of the regression curves in these mice (n = 4-6 per genotype).
Discussion
In this study we found that male, but not female, Tlr3 −/− mice show reduced ethanol preference drinking in the 2BC-EOD procedure. This is consistent with our previous findings that inhibiting downstream TRIF-signaling components reduces 2BC-EOD drinking in C57BL/6J male mice.8 Our current findings are also consistent with increased 2BC-EOD ethanol consumption in wild-type male, but not female, C57BL/6J mice after chronic activation of TLR3 with poly(I:C).10,26 We observed changes in ethanol consumption only during 2BC-EOD drinking, and we have reported that different ethanol drinking procedures produce distinct effects on brain gene expression, with the 2BC-EOD procedure evoking the strongest neuroimmune-related response in mice.27 Higher levels of ethanol intake were also observed during this test, consistent with previous work showing that intermittent access to ethanol increases voluntary consumption in mice.28,29 Our comprehensive approach also shows the importance of comparing sexes and different alcohol drinking procedures.
The two major differences that we found between wild-type and knockout mice, recovery from acute ethanol intoxication and recovery from sedative-hypnotic effects of ethanol, were changed in opposite directions in Tlr3 and Myd88 knockout males (Table 1). Myd88 −/− male mice recovered faster from ethanol-induced ataxia and showed increased AFT, which may account for the increased voluntary ethanol consumption found in these mice.5,6 In contrast, Tlr3 −/− male mice recovered more slowly from ethanol-induced ataxia and had decreased AFT, which may have a role in their decreased drinking.
Table 1.
Summary of responses to ethanol and GABAergic drugs in Tlr3 or Myd88 knockout male and female mice compared with their corresponding wild-type littermates.
| Procedure | Tlr3 −/− mice | Myd88 −/− mice | |||
|---|---|---|---|---|---|
| Males | Females | Males | Females | ||
| 2BC |
Ethanol intake | = | = | = a | = a |
| Preference | = | = | = a | = a | |
| Total fluid intake | = | = | = a | = a | |
| 2BC-EOD | Ethanol intake | ↓, ↓ * | = | ↑ a | = a |
| Preference | ↓, = * | = | ↑ a | = a | |
| Total fluid intake | ↑, = * | = | = a | = a | |
| 2BC-Limited Access | Ethanol intake | = | = | ↑ a | = a |
| Preference | = | = | = a | = a | |
| Total fluid intake | = | = | = a | = a | |
| 2BC-Saccharin | Preference | = | = | ↓ a | = a |
| Acute Withdrawal (HIC) | Ethanol | = | = | ||
| CTA | Ethanol | = | = | = | = |
| CPP (Acquisition) | Ethanol | ↑ | = | = | = |
| Rotarod Ataxia | Ethanol | → | = | ← a | ← a |
| Diazepam | → | = | ← a | ← a | |
| LORR | Ethanol | ↑ | = | ↓ b | ↓ b |
| Gaboxadol | ↑ | = | ↓ b | ↓ b | |
| AFT (Rotarod) | Ethanol | ↓ | ↑ | ||
| Clearance | Ethanol (4 g/kg) | = | = | = b | |
| Clearance (before and after 2BC-EOD) | Ethanol (2 g/kg) | = | |||
=, no change; ↑ (increased) versus ↓ (decreased) response; → (longer) versus ← (shorter) recovery from motor impairing effects of ethanol or diazepam.
From Blednov et al. (2017)6 and
from Blednov et al. (2017).5
2BC, two-bottle choice; 2BC-EOD, two-bottle choice every-other-day; AFT, acute functional tolerance; CPP, conditioned place preference; CTA, conditioned taste aversion; HIC, handling-induced convulsion; LORR, loss of the righting reflex.
To investigate whether the drinking procedure may influence within-session tolerance, we tested C57BL/6J mice from 2BC and 2BC-EOD groups that consumed similar total amounts of ethanol and examined blood ethanol clearance and ethanol’s acute sedative and motor impairing effects. We did not find differences in ethanol clearance between mice that underwent either drinking procedure and ethanol-naïve control mice. However, recovery from the acute motor impairing effects of ethanol was faster after 2BC-EOD, but not after 2BC continuous access. Because neither drinking procedure altered blood ethanol clearance, we attribute faster recovery on the rotarod to increased tolerance induced by the 2BC-EOD procedure. Although tolerance might also develop after longer periods of ethanol consumption the 2BC test, our results suggest that intermittent drinking induces faster development of acute, within-session tolerance to intoxication. These findings suggest that development of tolerance to alcohol intoxication allows for higher levels of alcohol consumption in the 2BC-EOD compared with the 2BC procedure.
Given these findings, we investigated the relationship between acute tolerance and drinking in wild-type and Tlr3 −/− mice to understand why only 2BC-EOD drinking was reduced in Tlr3 −/− male mice. Similar to our results in C57BL/6J male mice, wild-type and Tlr3 −/− male mice showed a modest increase in the rate of recovery from ethanol-induced ataxia after 2BC-EOD drinking. However, strong genotype differences in recovery from ataxia were still present at the end of the 2BC-EOD procedure. These differences were not due to changes in ethanol clearance, since the BECs and slopes of the regression lines were similar for C57BL/6J, Tlr3 +/+, and Tlr3 −/− male mice, and were not altered by 2BC-EOD alcohol exposure. In both genotypes of Tlr3 mice there was an inverse relationship between recovery from ataxia and the level of 2BC-EOD drinking. However, compared with wild-type mice, there was decreased drinking and increased ataxia in Tlr3 −/− mice. Thus, impaired acute tolerance to alcohol-induced ataxia in Tlr3 −/− mice may account for their decreased drinking phenotype, whereas alcohol-induced increases in tolerance evoked by the 2BC-EOD procedure itself are apparently not involved. Further investigations into why the EOD procedure produces high levels of alcohol consumption may reveal clues about other mechanisms by which TLR3 selectively regulates 2BC-EOD drinking.
Responses to diazepam and gaboxadol were also altered in Tlr3 −/− male mice, indicating regulation of GABAergic signaling by TLR3. Tlr3 −/− male mice showed prolonged recovery from acute sedative-hypnotic effects of gaboxadol and took longer to recover from motor impairment induced by diazepam. GABAA receptors regulate ethanol intoxication and tolerance,30-33 and these actions may be involved in the similar responses to ethanol and GABAergic drugs. Although there is evidence for an interaction between GABAA receptors and immune signaling in brain,34,35 it is not yet clear how deletion of Tlr3 or Myd88 alters GABAergic function to change behavioral responses to sedative drugs.
Also striking was the influence of sex on the effects of these mutations. Except for LORR in Myd88 −/− mice, alterations in ethanol-induced behaviors in Tlr3 −/− and Myd88 −/− males were not present in Tlr3 −/− and Myd88 −/− females (Table 1). Although there are examples of sex-specific effects on ethanol behaviors in other knockout mouse models,25,26,36 the current findings are notable because the acute behavioral responses to ethanol in Tlr3 −/− male mice are consistent with the reduction in voluntary ethanol consumption observed only in males. We note that males and females differ in their TLR3-dependent neuroimmune responses when TLR3 is activated by poly(I:C). Our previous work showed that poly(I:C) produces a rapid proinflammatory response in male mice and increases alcohol intake over time in a 2BC-EOD model.26 In female mice, however, poly(I:C) produced a delayed immune response and no increases in alcohol consumption.10 Considering the sex-dependent differences in TLR3 signaling associated with 2BC-EOD drinking in C57BL/6J control mice, it is possible that altered neuroimmune signaling evoked by intermittent drinking is involved in the decreased alcohol consumption in male mutant mice. TLR3 is a key sensor of viral dsRNA and induction of antiviral molecules, and the alcohol exposure model may have exacerbating and sex-dependent effects on these responses. Further work is needed to determine whether different immune responses in Tlr3 −/− male and female mice underlie differences in their behavioral responses to ethanol.
We examined other behaviors correlated with voluntary consumption that might show corresponding sex differences and opposing effects of deletion of Tlr3 versus Myd88. Acquisition of CPP to ethanol, for example, can be associated with voluntary ethanol consumption.22 We found that CPP to ethanol was slightly greater in Tlr3 −/− compared with Tlr3 +/+ male mice, while CPP was similar in Myd88 −/− and Myd88 +/+ male mice. The overall effects of Tlr3 and Myd88 null mutations on CPP were small and limited by the poor development of CPP typically observed in C57BL/6J mice.37 Other behavioral effects that could have potentially modified drinking, such as CTA to ethanol38 or acute withdrawal,23 were not significantly affected by these mutations. Thus, these phenotypes do not appear to be involved in the altered ethanol consumption.
Studies of recombinant inbred LS x SS mouse strains found a correlation between rapid tolerance to high ethanol doses and ethanol consumption in a limited-access test.39 Our results link within-session alcohol tolerance to increased consumption in the 2BC-EOD (but not 2BC) test by three different approaches. We found that 2BC-EOD alcohol consumption produced tolerance to the motor impairing effects of alcohol in different groups of male mice (e.g., C57BL/6J, Tlr3 +/+, and Tlr3 −/−) without changing blood ethanol clearance and that disruption of TLR3 or MyD88 signaling produced opposite effects on both tolerance and alcohol consumption in the 2BC-EOD test. Because alcohol consumption can increase over time during the 2BC-EOD (but not the 2BC) test,28,29 it is tempting to speculate that escalation in 2BC-EOD drinking is related to development of acute tolerance. However, our studies in Tlr3 wild-type and mutant mice (which had relatively stable levels of drinking during the 2BC-EOD procedure) suggest that development of tolerance to ethanol-induced ataxia does not necessarily produce escalation in 2BC-EOD drinking. However, we did find that levels of 2BC-EOD alcohol drinking are negatively correlated with recovery from ataxia before and after chronic intermittent drinking. This inverse relationship indicates that the decreased drinking in Tlr3 −/− mice is associated with decreased within-session tolerance to alcohol’s intoxicating effects and remains correlated after chronic intermittent access drinking.
How individuals respond to an acute alcohol challenge contributes to their risk of developing AUD.40 In persons with normal alcohol metabolism, differences in level of response to an acute intoxicating dose of alcohol result mainly from differences in acute behavioral tolerance, which develops within a drinking session.41 Tolerance has a major influence on alcohol consumption, with tolerance to alcohol’s aversive properties reducing a disincentive to drink. Our findings show the importance of the MyD88 and TLR3 pathways in coordinate regulation of alcohol consumption and acute tolerance to intoxicating doses of alcohol and other GABAergic sedative drugs. These signaling pathways may influence the extent to which individuals will voluntarily consume alcohol.
Supplementary Material
Acknowledgements
The authors declare no conflicts of interest. This work was supported by the National Institute on Alcohol Abuse and Alcoholism grants U01 AA013520 to YAB and ROM and U24 AA025479 to RAH.
References
- 1.Erickson EK, Grantham EK, Warden AS, Harris RA. Neuroimmune signaling in alcohol use disorder. Pharmacol Biochem Behav. 2019;177:34–60. [DOI] [PMC free article] [PubMed] [Google Scholar]
- 2.Crews FT, Vetreno RP. Mechanisms of neuroimmune gene induction in alcoholism. Psychopharmacology (Berl). 2016;233(9):1543–1557. [DOI] [PMC free article] [PubMed] [Google Scholar]
- 3.Kawasaki T, Kawai T. Toll-like receptor signaling pathways. Front Immunol. 2014;5:461. [DOI] [PMC free article] [PubMed] [Google Scholar]
- 4.Muralidharan S, Lim A, Catalano D, Mandrekar P. Human binge alcohol intake inhibits TLR4-MyD88 and TLR4-TRIF responses but not the TLR3-TRIF pathway: HspA1A and PP1 play selective regulatory roles. J Immunol. 2018;200(7):2291–2303. [DOI] [PMC free article] [PubMed] [Google Scholar]
- 5.Blednov YA, Black M, Benavidez JM, Da Costa A, Mayfield J, Harris RA. Sedative and motor incoordination effects of ethanol in mice lacking CD14, TLR2, TLR4, or MyD88. Alcohol Clin Exp Res. 2017;41(3):531–540. [DOI] [PMC free article] [PubMed] [Google Scholar]
- 6.Blednov YA, Black M, Chernis J, Da Costa A, Mayfield J, Harris RA. Ethanol consumption in mice lacking CD14, TLR2, TLR4, or MyD88. Alcohol Clin Exp Res. 2017;41(3):516–530. [DOI] [PMC free article] [PubMed] [Google Scholar]
- 7.Crews FT, Qin L, Sheedy D, Vetreno RP, Zou J. High mobility group box 1/Toll-like receptor danger signaling increases brain neuroimmune activation in alcohol dependence. Biological psychiatry. 2013;73(7):602–612. [DOI] [PMC free article] [PubMed] [Google Scholar]
- 8.McCarthy GM, Warden AS, Bridges CR, Blednov YA, Harris RA. Chronic ethanol consumption: role of TLR3/TRIF-dependent signaling. Addict Biol. 2018;23(3):889–903. [DOI] [PMC free article] [PubMed] [Google Scholar]
- 9.Qin L, Crews FT. Chronic ethanol increases systemic TLR3 agonist-induced neuroinflammation and neurodegeneration. Journal of neuroinflammation. 2012;9:130. [DOI] [PMC free article] [PubMed] [Google Scholar]
- 10.Warden AS, Azzam M, DaCosta A, et al. Toll-like receptor 3 activation increases voluntary alcohol intake in C57BL/6J male mice. Brain Behav Immun. 2019;77:55–65. [DOI] [PMC free article] [PubMed] [Google Scholar]
- 11.Siednienko J, Halle A, Nagpal K, Golenbock DT, Miggin SM. TLR3-mediated IFN-beta gene induction is negatively regulated by the TLR adaptor MyD88 adaptor-like. Eur J Immunol. 2010;40(11):3150–3160. [DOI] [PubMed] [Google Scholar]
- 12.Siednienko J, Gajanayake T, Fitzgerald KA, Moynagh P, Miggin SM. Absence of MyD88 results in enhanced TLR3-dependent phosphorylation of IRF3 and increased IFN-beta and RANTES production. J Immunol. 2011;186(4):2514–2522. [DOI] [PubMed] [Google Scholar]
- 13.Biswas SK, Bist P, Dhillon MK, et al. Role for MyD88-independent, TRIF pathway in lipid A/TLR4-induced endotoxin tolerance. J Immunol. 2007;179(6):4083–4092. [DOI] [PubMed] [Google Scholar]
- 14.Zhou ZX, Zhang BC, Sun L. Poly(I:C) induces antiviral immune responses in Japanese flounder (Paralichthys olivaceus) that require TLR3 and MDA5 and is negatively regulated by Myd88. PLoS One. 2014;9(11):e112918. [DOI] [PMC free article] [PubMed] [Google Scholar]
- 15.Alexopoulou L, Holt AC, Medzhitov R, Flavell RA. Recognition of double-stranded RNA and activation of NF-kappaB by Toll-like receptor 3. Nature. 2001;413(6857):732–738. [DOI] [PubMed] [Google Scholar]
- 16.Hou B, Reizis B, DeFranco AL. Toll-like receptors activate innate and adaptive immunity by using dendritic cell-intrinsic and -extrinsic mechanisms. Immunity. 2008;29(2):272–282. [DOI] [PMC free article] [PubMed] [Google Scholar]
- 17.Blednov YA, Stoffel M, Chang SR, Harris RA. Potassium channels as targets for ethanol: studies of G-protein-coupled inwardly rectifying potassium channel 2 (GIRK2) null mutant mice. J Pharmacol Exp Ther. 2001;298(2):521–530. [PubMed] [Google Scholar]
- 18.Blednov YA, Da Costa AJ, Tarbox T, Ponomareva O, Messing RO, Harris RA. Apremilast Alters Behavioral Responses to Ethanol in Mice: I. Reduced Consumption and Preference. Alcohol Clin Exp Res. 2018;42(5):926–938. [DOI] [PMC free article] [PubMed] [Google Scholar]
- 19.Blednov YA, Da Costa AJ, Harris RA, Messing RO. Apremilast Alters Behavioral Responses to Ethanol in Mice: II. Increased Sedation, Intoxication, and Reduced Acute Functional Tolerance. Alcohol Clin Exp Res. 2018;42(5):939–951. [DOI] [PMC free article] [PubMed] [Google Scholar]
- 20.Crabbe JC, Merrill CD, Belknap JK. Effects of convulsants on handling-induced convulsions in mice selected for ethanol withdrawal severity. Brain Research. 1991;550:1–6. [DOI] [PubMed] [Google Scholar]
- 21.Erwin VG, Deitrich RA. Genetic selection and characterization of mouse lines for acute functional tolerance to ethanol. J Pharmacol Exp Ther. 1996;279(3):1310–1317. [PubMed] [Google Scholar]
- 22.Green AS, Grahame NJ. Ethanol drinking in rodents: is free-choice drinking related to the reinforcing effects of ethanol? Alcohol. 2008;42(1):1–11. [DOI] [PMC free article] [PubMed] [Google Scholar]
- 23.Metten P, Phillips TJ, Crabbe JC, et al. High genetic susceptibility to ethanol withdrawal predicts low ethanol consumption. Mamm Genome. 1998;9(12):983–990. [DOI] [PubMed] [Google Scholar]
- 24.Ray LA, Bujarski S, Roche DJO. Subjective Response to Alcohol as a Research Domain Criterion. Alcoholism: Clinical and Experimental Research. 2016;40(1):6–17. [DOI] [PubMed] [Google Scholar]
- 25.Crabbe JC, Phillips TJ, Harris RA, Arends MA, Koob GF. Alcohol-related genes: contributions from studies with genetically engineered mice. Addict Biol. 2006;11(3–4):195–269. [DOI] [PubMed] [Google Scholar]
- 26.Warden AS, Azzam M, DaCosta A, et al. Toll-like receptor 3 dynamics in female C57BL/6J mice: Regulation of alcohol intake. Brain Behav Immun. 2019;77:66–76. [DOI] [PMC free article] [PubMed] [Google Scholar]
- 27.Osterndorff-Kahanek E, Ponomarev I, Blednov YA, Harris RA. Gene expression in brain and liver produced by three different regimens of alcohol consumption in mice: comparison with immune activation. PLoS One. 2013;8(3):e59870. [DOI] [PMC free article] [PubMed] [Google Scholar]
- 28.Melendez RI. Intermittent (every-other-day) drinking induces rapid escalation of ethanol intake and preference in adolescent and adult C57BL/6J mice. Alcohol Clin Exp Res. 2011;35(4):652–658. [DOI] [PMC free article] [PubMed] [Google Scholar]
- 29.Rosenwasser AM, Fixaris MC, Crabbe JC, Brooks PC, Ascheid S. Escalation of intake under intermittent ethanol access in diverse mouse genotypes. Addict Biol. 2013;18(3):496–507. [DOI] [PMC free article] [PubMed] [Google Scholar]
- 30.Blednov YA, Benavidez JM, Black M, et al. Linking GABA(A) receptor subunits to alcohol-induced conditioned taste aversion and recovery from acute alcohol intoxication. Neuropharmacology. 2013;67:46–56. [DOI] [PMC free article] [PubMed] [Google Scholar]
- 31.Blednov YA, Benavidez JM, Black M, et al. GABAA receptors containing rho1 subunits contribute to in vivo effects of ethanol in mice. PLoS One. 2014;9(1):e85525. [DOI] [PMC free article] [PubMed] [Google Scholar]
- 32.Sanchis-Segura C, Cline B, Jurd R, Rudolph U, Spanagel R. Etomidate and propofol-hyposensitive GABAA receptor beta3(N265M) mice show little changes in acute alcohol sensitivity but enhanced tolerance and withdrawal. Neurosci Lett. 2007;416(3):275–278. [DOI] [PubMed] [Google Scholar]
- 33.Werner DF, Swihart AR, Ferguson C, Lariviere WR, Harrison NL, Homanics GE. Alcohol-induced tolerance and physical dependence in mice with ethanol insensitive alpha1 GABA A receptors. Alcohol Clin Exp Res. 2009;33(2):289–299. [DOI] [PMC free article] [PubMed] [Google Scholar]
- 34.Bajo M, Herman MA, Varodayan FP, et al. Role of the IL-1 receptor antagonist in ethanol-induced regulation of GABAergic transmission in the central amygdala. Brain Behav Immun. 2015;45:189–197. [DOI] [PMC free article] [PubMed] [Google Scholar]
- 35.Blednov YA, Benavidez JM, Black M, Mayfield J, Harris RA. Role of interleukin-1 receptor signaling in the behavioral effects of ethanol and benzodiazepines. Neuropharmacology. 2015;95:309–320. [DOI] [PMC free article] [PubMed] [Google Scholar]
- 36.Mayfield J, Arends MA, Harris RA, Blednov YA. Genes and Alcohol Consumption: Studies with Mutant Mice. Int Rev Neurobiol. 2016;126:293–355. [DOI] [PMC free article] [PubMed] [Google Scholar]
- 37.Cunningham CL, Noble D. Conditioned activation induced by ethanol: role in sensitization and conditioned place preference. Pharmacol Biochem Behav. 1992;43(1):307–313. [DOI] [PubMed] [Google Scholar]
- 38.Risinger FO, Cunningham CL. Ethanol-induced conditioned taste aversion in BXD recombinant inbred mice. Alcohol Clin Exp Res. 1998;22(6):1234–1244. [PubMed] [Google Scholar]
- 39.Radcliffe RA, Larson C, Bennett B. Genetic studies of acute tolerance, rapid tolerance, and drinking in the dark in the LXS recombinant inbred strains. Alcohol Clin Exp Res. 2013;37(12):2019–2028. [DOI] [PMC free article] [PubMed] [Google Scholar]
- 40.Schuckit MA. A Critical Review of Methods and Results in the Search for Genetic Contributors to Alcohol Sensitivity. Alcohol Clin Exp Res. 2018;42(5):822–835. [DOI] [PMC free article] [PubMed] [Google Scholar]
- 41.Newlin DB, Thomson JB. Alcohol challenge with sons of alcoholics: a critical review and analysis. Psychol Bull. 1990;108(3):383–402. [DOI] [PubMed] [Google Scholar]
Associated Data
This section collects any data citations, data availability statements, or supplementary materials included in this article.


