Abstract
The activity of the proton-activated chloride channel (PAC) is widespread and is involved in acid-induced cell death and tissue injury1,2,3. Its molecular identity has recently been identified as a novel and evolutionarily conserved protein family4,5. We present two cryo-EM structures of human PAC in a high-pH resting closed state and a low-pH proton-bound non-conducting state. PAC is a trimer; each subunit consists of a transmembrane domain (TMD) formed by two helices, TM1–2, and an extracellular domain (ECD). We observed striking conformational changes in the ECD–TMD interface and the TMD when the pH drops from 8 to 4. The rearrangement of the ECD–TMD interface is characterized by the movement of histidine-98, which is, upon acidification, decoupled from the resting position and inserted into an acidic pocket that is about 5-Å away. Within the TMD, TM1 undergoes a rotational movement, switching its interaction partner from the cognate to the adjacent TM2. The anion selectivity of PAC is determined by the positively charged lysine-319 on TM2. Replacement of lysine-319 by a glutamate converts PAC to a cation-selective channel. Our data provide the first glimpse of the molecular assembly of PAC, and a basis for understanding the mechanism of proton-dependent activation.
Keywords: PAC, PACC1, PAORAC, ASOR, TMEM206
Introduction
Acidic pH is crucial for the function of intracellular organelles in the secretory and endocytic pathways. It is also one of the pathological hallmarks of many diseases, including cerebral and cardiac ischaemia, cancer, infection, and inflammation. Stimulated by the lowering of extracellular pH, the activity of the proton-activated chloride channel has been recorded in a wide range of mammalian cells1. By mediating Cl– influx and subsequent cell swelling, PAC is implicated in acid-induced cell death2,3. The molecular identity of PAC has remained a mystery until recently. We and others have identified a novel gene encoding the PAC channel as PACC1 (also known as TMEM206) through unbiased RNA interference screens4,5. Loss of function studies revealed an important role of PAC in acid-induced neuronal cell death in vitro and ischaemic brain injury in mice4,6.
With no obvious sequence homology to other membrane proteins, PAC represents a completely new ion channel family4,5. Highly conserved across vertebrates, PAC is predicted to have two transmembrane (TM) helices4,5, similar to the acid-sensing ion channel (ASIC) and the epithelial sodium channel (ENaC)7,8. While the structure and function of ASIC has been extensively studied7,9–12, the architecture of PAC and the mechanisms underlying its pH sensing and anion selectivity are unknown. To address these questions, we determined human PAC structures using single-particle electron cryo-microscopy (cryo-EM) combined with patch-clamp electrophysiological studies.
Structural determination
Activated at pH below 5.5 at room temperature, PAC is maximally stimulated by protons at pH ~4.6–4 (Ref 1). We determined cryo-EM structures of PAC reconstituted in lipid nanodiscs at pH 8 (pH8–PAC) and pH 4 (pH4–PAC) with estimated resolutions of 3.60 and 3.73 Å, respectively (Extended Data Figs. 1a-c, 2 and 3). The maps were of sufficient quality to carry out de novo model building of the protein (Fig. 1; Extended Data Fig. 4a-d). The cytoplasmic N- and C-termini (residues 1–60 and 339–350 in pH8–PAC, and 1–52 and 340–350 in pH4–PAC) are disordered in our cryo-EM maps.
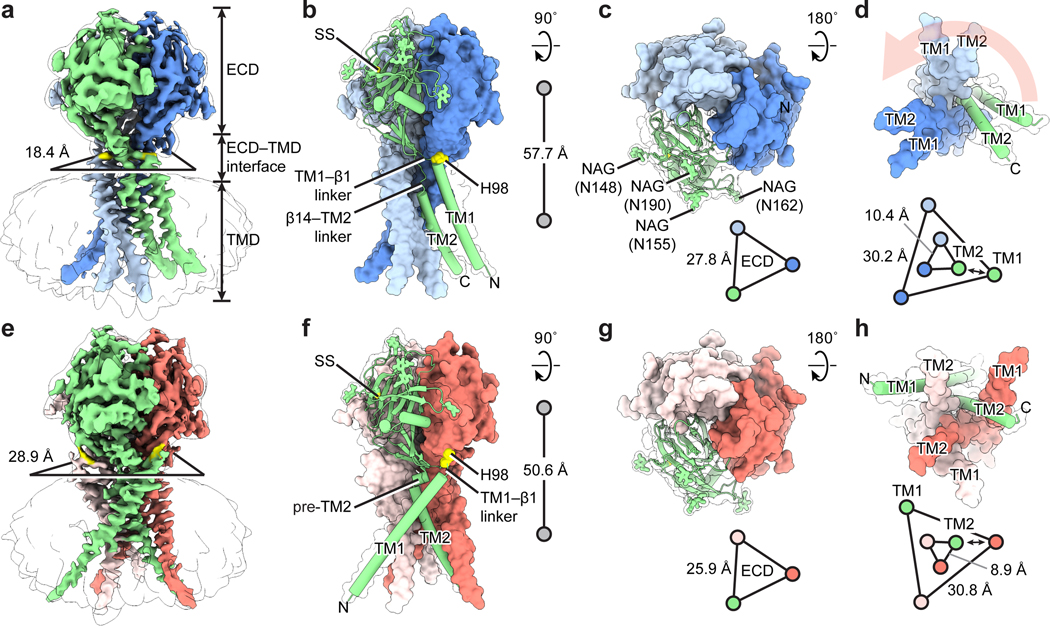
Figure 1: The overall architecture.
a and e, Cryo-EM maps of pH8–PAC and pH4–PAC viewed parallel to the membrane. The map refined without using a mask is shown as a transparent envelope. The horizontal dimension of the ECD–TMD interface is represented by the distance between the Cα atoms of adjacent H98. The density for H98 is colored in yellow in both maps. b and f, The atomic models for pH8–PAC and pH4–PAC. The green subunit is shown as a cartoon and the other two subunits are shown in surface representation. The center-of-mass distances between the ECD and the TMD are shown on the right. c and g, The TMDs of pH8–PAC and pH4–PAC viewed from the intracellular side. A light salmon arrow (panel c) indicates the rotation of TM1 of PAC after acidification to pH 4. The relative position and distance of TM1 and TM2, which are represented by the Cα atoms of I73 and K319, respectively, are shown at the bottom. The double-headed arrow indicates the interaction between TM1 and TM2. d and h, The ECDs of pH8–PAC and pH4–PAC viewed from the extracellular side. Four putative glycosylation sites (N148, N155, N162, and N190) are labeled in (d). The center-of-mass distance between the ECDs of each subunit is shown by the triangles.
Overall architecture
The PAC is a trimer. It has a small ball-shaped extracellular domain (ECD) sitting on the top of a slim and elongated transmembrane domain (TMD) that consists of two transmembrane helices (TM1 and TM2) in each subunit (Fig. 1a, b, e, f). Such a trimeric 2-TM architecture is reminiscent of the proton-activated cation channel ASIC (Extended Data Fig. 5a-e) and ENaC7,8. The ECD of PAC is heavily glycosylated, having four N-glycosylation sites in each subunit (Fig. 1c, g), consistent with a previous report5 and a deglycosylation assay (Extended Data Fig. 1d).
The alkaline and acidic pHs yielded two PAC structures having distinct shapes—pH4–PAC is shorter and bulkier than pH8–PAC, and they differ mainly at the TMD and the ECD–TMD interface. At pH 8, the TM1 helix runs nearly parallel to and forms interactions only with its cognate TM2 (Fig. 1b, d). When pH drops to 4, the TM1 switches its interaction from its cognate TM2 to the adjacent TM2 (Fig. 1f, h). Such a domain-swapped movement of TM1 has not been observed in any other 2-TM channels12,13, implying a novel gating mechanism.
The ECD–TMD interface consists of part of the TM1 helix in the extracellular side and two linkers connecting the TMD and ECD, namely the TM1-β1 linker and the β14–TM2 linker. This interface differs substantially between the two PAC structures (Fig. 1b, f). At pH 8, TM1 and the short TM1-β1 linker hold the adjacent ECD through an “anchor” residue, H98, while the β14-TM2 linker is extended as a loop close to the pore axis (Fig. 1b). At pH 4, the β14–TM2 linker is remodeled into a short pre–TM2 helix, and the TM1–β1 linker moves outward, causing a vertical compression and an expansion of the ECD–TMD interface (Fig. 1a, b, e, f; Supplementary Video 1). Accompanying the rearrangement of the ECD–TMD interface, the ECD at pH 4 shows a vertical movement towards the TMD and a contraction towards the pore axis, resulting in a shorter overall structure and a more compact ECD in comparison to pH 8 (Fig. 1b, f, c, g).
Single Subunit
At pH 8, each PAC protomer adopts an arm-like structure, with the ECD as the hand, the ECD–TMD interface as the wrist, and the TMD as the forearm (Extended Data Fig. 4e). The hand-like ECD is composed of a palm, a finger, a thumb and a β-ball domain, all of which consist of β strands except for the thumb domain that contains two short α helices (Extended Data Fig. 4e-g). The finger and the β-ball domains are connected by a disulfide bond (C128–C149), forming a rigid structure occupying the peripheral region of the ECD. The connection between ECD and TMD are achieved by two linkers (TM1–β1 linker and β14–TM2 linker) that together form the wrist domain.
The TMD consists of two transmembrane helices TM1 and TM2 at the N- and C-termini of the protein, respectively. TM1 contains mostly hydrophobic residues and contacts directly with the lipid bilayer. TM2 contains both hydrophilic and hydrophobic residues and lines the ion conducting pore. While the ECD at both pHs mostly maintains its conformation, their ECD–TMD interface and TMD differ substantially, characterized by the distinct conformations of H98 and TM1 (Extended Data Fig. 4e, f). At pH 8, TM1 is approximately parallel to TM2, whereas at pH 4, the two TMs form an angle of 64°.
The TM2 of PAC is a continuous α-helix and differs from the TM2 of ASIC, which has a characteristic two-segment structure and a Gly-Ala-Ser belt (Extended Data Fig. 5b, e)10. The ECD of PAC shows striking similarities to the β-sheet core of the ECD in ASIC, despite sharing limited protein sequence similarity (Extended Data Fig. 5e and 6). Notably, the PAC ECD lacks the large exterior helical structures of ASIC that is involved in the pH sensing of ASIC14 (Extended Data Figs. 5a-d, 6), so PAC must possess a different pH sensing mechanism.
Channel Assembly
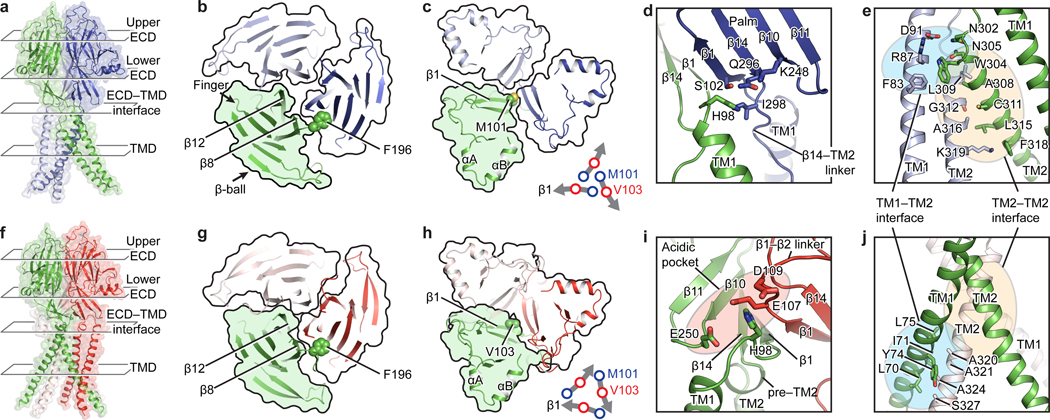
The major interactions between PAC subunits are at the ECD, ECD–TMD interface and upper part of the TMD. The lower part of the TMD lacks extensive interactions and is thus flexible. Inspection of the conformational changes at the ECD revealed a rigid-body contraction of the entire ECD and an iris-like rotation of the lower ECD (Supplementary Video 1). We thus looked at both the upper (the finger and β-ball domains) and lower ECD (the palm and thumb domains) to study their intersubunit interfaces (Fig. 2a, f).
Figure 2: Intersubunit interfaces.
Each column represents the same view of pH8–PAC (upper) and pH4–PAC (lower). a and f, The overall structure of PAC shown in cartoon and surface representation. The extracellular domain (ECD) is divided into the upper ECD and lower ECD for discussion. b and g, The upper ECD viewed from the extracellular side. F196, which mediates the intersubunit interaction in the upper ECD, is shown as spheres. c and h, The lower ECD viewed from the extracellular side. At pH 8, M101 at the beginning of the β1 strand is in the center of lower ECD (lower right of panel c). At pH 4, the lower ECD undergoes a clockwise inward rotation so that V103 in the middle of the β1 strand moves to the center of the lower ECD (lower right of panel h). d and i, The ECD–TMD interface viewed parallel to the membrane. e and j, The interaction interfaces at the TMD.
At pH 8, both upper and lower ECD have loose intersubunit interfaces with an obvious gap between subunits (Fig. 2b, c). The upper ECD has two major intersubunit interactions. The first is formed between the adjacent β8 and β12 strands that run approximately parallel to each other. The second is formed between the β6–β7 linker and the adjacent finger domain, where the F196 on the β6–β7 linker is inserted into the finger domain, forming both hydrophobic and cation-π interactions (Fig. 2b, g; Extended Data Fig. 1e). The alanine substitution (F196A) yielded a misassembled mutant that showed a markedly decreased channel activity compared to the wild type (WT) (Extended Data Fig. 1f, g). This suggests an important role of the upper ECD in channel assembly. The lower ECD has a single major interface at the center where the three M101 residues on the N-terminus of β1 strand tightly interact with each other. This interface disconnects the central pore from ECD to TMD (Fig. 2c). At pH 4, the gaps in both upper and lower ECDs are mostly filled, creating extensive interactions between subunits (Fig. 2g, h). Moreover, in the center of the lower ECD, due to the iris-like rotation from pH 8 to 4, V103 in the middle of β1 now mediates the contact (Fig. 2h).
The intersubunit contact at the ECD–TMD interface is mediated through H98 at the TM1–β1 linker. At pH 8, H98 is surrounded by hydrophilic and hydrophobic residues of the β1 and β14 of the adjacent ECD, constituting a resting ECD–TMD interface (Fig. 2d). This interface is remodeled at pH 4, where H98 interacts with a pocket formed by residues in the β10–β11 linker of its cognate ECD and in the β1–β2 linker of the adjacent ECD (Fig. 2i). Because this pocket is solely constructed by negatively charged residues, we call it an “acidic pocket”.
At the TMD, PAC has two major intersubunit interfaces (Fig. 2e, j): the TM1–TM2 interface and the TM2–TM2 interface. At pH 8, both interfaces are near the extracellular part of the TMD. At pH 4, the TM2–TM2 interface stays mostly unchanged, but the TM1–TM2 interface slips toward the intracellular side as a result of the domain-swapped movement of TM1.
Ion-conducting pathway and selectivity
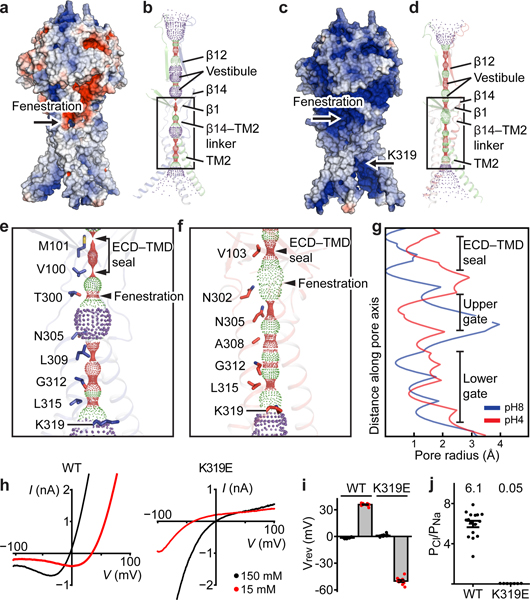
The PAC channel has a central pore along the symmetry axis with wide openings at the extracellular and intracellular ends in both pH states (Fig. 3a-d). Within the TMD, the ion-conducting pore is lined by TM2 and the β14–TM2 linker (Fig. 3b, d). At pH 8, the ion-conducting pore is occluded at multiple positions (Fig. 3e, g), thus representing a high-pH resting closed state. At pH 4 (Fig. 3f, g), the intracellular part of the pore has an enlarged radius of 0.82 Å, but is still not wide enough to permeate Cl– ions, representing a low-pH protonated non-conducting state. PAC exhibited a strong outward rectification such that either the open probability or the single channel conductance is low at 0 mV where the cryo-EM structures were determined (Fig. 3h). Moreover, PAC showed a marked desensitization upon prolonged pH-4 treatment (Extended Data Fig. 7a-f). Therefore, we suggest that a closed pore in the pH4–PAC structure represents either a pre-open state or a desensitized state.
Figure 3: Ion-conducting pathways and anion selectivity.
a and c, pH8–PAC and pH4–PAC in surface representation colored according to the electrostatic surface potential from –3 to 3 kT/e (red to blue). Titratable residues are assigned to their predominant protonation state at pH 8 (a) or 4 (c) based on propka. b and d, The pore profiles of pH8–PAC and pH4–PAC model along the symmetry axis. Pore-lining residues are shown. e and f, Enlargements of the boxed areas in panels (b) and (d), respectively. The positions of ECD-TMD seal and fenestration site are labeled. g, Pore radius plots of the profiles in (e) and (f). h, The representative current-voltage relationship of PAC WT and K319E. The pipette solution contains 150 mM NaCl; the bath solution contains 150 mM (black) or 15 mM NaCl (red). i, The reversal potential of PAC WT and K319E from recordings in (h). The bar graph represents the mean and standard error (WT[n=16] and K319E[n=7). Individual data points are shown as dots. j, The relative Cl-/Na+ permeability for PAC WT[n=15] and K319E[n=11] calculated from pH 5 -induced current at 100 mV. The center and error bar represent the mean and standard error of the permeability ratio. Individual data points are shown as solid dots. The average PCl/PNa permeability values are indicated at the top for each construct.
To reveal the molecular determinants responsible for the anion selectivity of PAC, we inspected the positively charged residues within the ion-conducting pore, all of which are located in the intracellular half of the TM2 helix. The K319 appears to be an ideal candidate, because it is immediately below the intracellular restriction site (L315) and forms a positively charged “triad” around the intracellular entry (Fig 3e, f). Indeed, a charge-reversing mutation, K319E, converted PAC from an anion-selective to a cation-selective channel with pronounced inwardly rectifying current (Fig. 3h-j, Extended Data Fig. 8a, b). By contrast, the mutants of two other lysines, K325E and K329E, behaved similarly to WT (Extended Data Fig. 8a-e). The crucial role of K319 is further supported by its conservation across species (Extended Data Fig. 6), and by the fact that K319C is not functional5. Together, our data support K319 as the determinant of anion selectivity for PAC.
In the ECD, the pore along the symmetry axis has a large vestibule in the middle (Fig. 3b, d). This vestibule is constricted at the ECD–TMD interface by an ECD–TMD seal in both pH8–PAC and pH4–PAC structures (Fig. 3e-g, Extended Data Fig. 8f, i). This leads to the question of how ions might enter the ion-conducting pore from the extracellular side. Just below the seal, we observed three lateral fenestrations connecting to the central pore. Fenestrations at similar locations have been defined as an ion entry point in both the ASIC and P2X channels9,13,15. At pH 8, the fenestration in PAC is formed by the extracellular portion of the TM1 helix and the β14–TM2 linker of the adjacent subunit (Extended Data Fig. 8f). The entrance is surrounded by several negatively charged residues, making it unfavorable for conducting anions (Extended Data Fig. 8g). At pH 4, a different fenestration is established by the β1 strand and the pre–TM2 helix in the adjacent subunit (Extended Data Fig. 8i). The fenestration at pH 4 is wider than at pH 8, and has several positively charged residues lining the entryway, making it favorable for anions (Extended Data Fig. 8i, j). To provide evidence that these fenestrations could be extracellular ion entry points in PAC, we performed molecular dynamic simulations and found that the fenestrations in the pH4–PAC structure are hydrated, while the fenestrations in the pH8–PAC structure are less accessible to solvent (Extended Data Fig. 8h, k). Our data suggest the lateral fenestrations may be an extracellular ion entry point common to 2-TM channels9,13,15. This agrees with a previous report in which treatment of a thiol-reactive reagent MTSES considerably inhibited the PAC channel activity when T306—part of the fenestration—is replaced by a cysteine5.
Mechanisms of pH sensing and channel activation
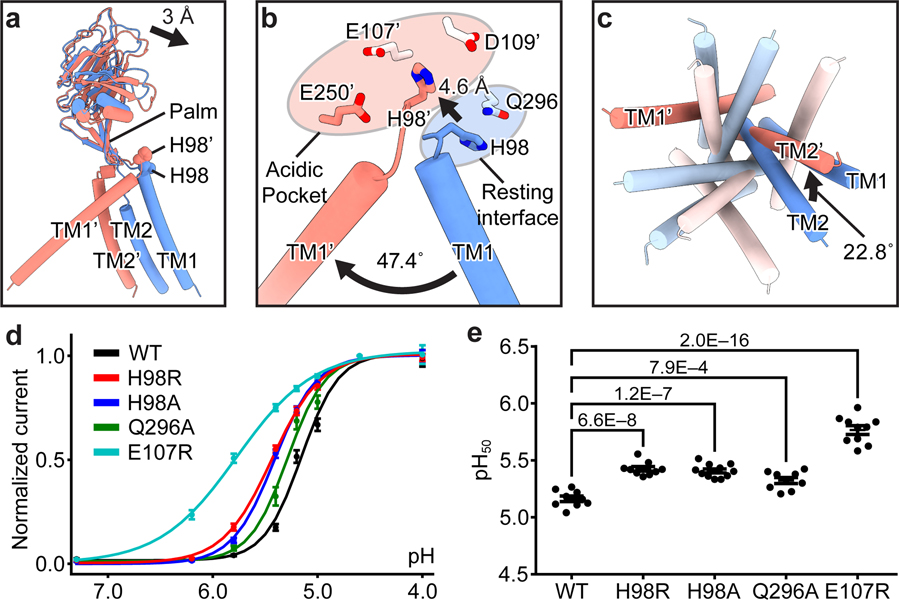
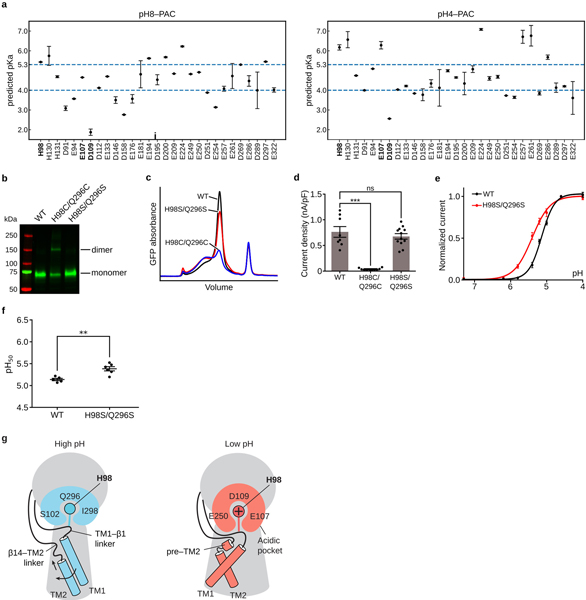
To understand the pH sensing mechanism, we compared the structures of pH8–PAC and pH4–PAC. We focused on the ECD and ECD–TMD interface, because PAC is activated by extracellular acid. Superimposing a single subunit revealed that, upon protonation, the major motion of the extracellular region occurred at the ECD–TMD interface, while the ECD showed minor rigid-body movement (Fig. 4a). This suggests that the ECD–TMD interface likely participates in the pH sensing. We hypothesize that H98 in the TM1–β1 linker is one of the key pH sensors because it showed a large movement from the high pH resting state to the low pH proton-bound state and its sidechain pKa is close to the pH50 of PAC (Extended Data Fig. 9a)16.
Figure 4: Mechanisms of pH sensing and channel activation.
a, A superposition of a single subunit of pH8–PAC (blue) and pH4–PAC (red) aligned using the ECD palm domain. The 3 Å center-of-mass distance indicates the rigid-body movement of the ECD. b, A close-up view of the conformational change in the ECD–TMD interface of (a). Structural elements and residues in the pH4–PAC structure are labeled with a prime symbol. Residues from adjacent subunits are colored in bright and light colors, respectively. At pH 8, H98 interacts with Q296. At pH 4, the side chain of H98 has interactions with an acidic pocket. c, Comparison of the TMD viewed from the intracellular side. The structures of pH8–PAC (blue) and pH4–PAC (red) are aligned using the ECD. d, The pH dose-response curve of PAC WT and mutants. The center and bar represent the mean and standard error of the current at 100 mV normalized to pH 4.6-induced current (WT[n=10], H98R[n=10], H98A[n=9], Q296A[n=11], E107R[n=10]). The Hill coefficient for WT and E107R is 2.44±0.18 and 1.18±0.19 [mean±SEM.], respectively. e, The pH50 estimated from the pH dose-response curve. The center and error bar represent the estimated pH50 and standard error from the non-linear fitting in (d). One-way analysis of variance (ANOVA) with Bonferroni post hoc test was used to determine the significance (p-values are indicated).
At pH 8, H98 is in close contact with Q296, I298, and S102 of the adjacent ECD. We speculate that the side chain of H98 forms a hydrogen bond with the side chain amine group of Q296, which locks the TM1 helix in a conformation parallel to its cognate TM2 helix (Fig. 4a, b). To investigate whether the interaction between H98 and Q296 is critical for stabilizing the channel in a resting closed state, we engineered a disulfide bond connecting these two residues. Indeed, the double cysteine replacement of H98 and Q296 (H98C/Q296C) fixed H98 in the resting position and thus rendered PAC insensitive to pH, while the control serine mutant (H98S/Q296S) showed increased pH sensitivity (Extended Data Fig. 9b-g). At pH 4, the protonated H98 is decoupled from Q296 and flipped into the acidic pocket, which is 4.6 Å away (Fig. 4b). The acidic pocket is formed by E107, D109, and E250, and interacts favorably with the protonated H98 because D109 is predicted to remain unprotonated at pH 4 (Extended Data Fig. 9a). The flipping of H98 pulls TM1 away from its cognate TM2 and creates a new interface with the TM2 of the adjacent subunit (Fig. 4b). Concurrent with a 47.4° swing of TM1, the pore-lining TM2 undergoes a counterclockwise rotation of 22.8° when viewed from the intracellular side (Fig. 4b, c).
We hypothesize that the flipping of H98 from the resting position to the acidic pocket is a critical element for the proton-induced PAC channel activation. To test this hypothesis, we first generated mutants of H98 and its interacting partner in the pH8–PAC structure, Q296, and examined their pH sensitivity (Fig. 4d, e). The H98R/A and Q296A mutants all resulted in an increased pH sensitivity by disengaging the hydrogen bond between H98 and Q296, which supports the idea that the decoupling of protonated H98 from the resting interface plays a role in the channel activation. However, the H98A and H98R showed similar pH50, which is unexpected because an alanine would be less attracted by the acidic pocket than an arginine. Perhaps an arginine at position-98 caused additional conformational changes rather than a simple side chain substitution. Next, we studied E107 which is close to H98 in the pH4–PAC structure. The E107R mutation not only markedly increased the pH sensitivity but also decreased the Hill coefficient of the pH dose-response curve (Fig. 4d, e). Since E107 has a predicted pKa around 6 in the pH4–PAC structure (Extended Data Fig. 9a), it likely also participates in PAC pH sensing. E107R may cause a rearrangement of the acidic pocket, which leads to an altered interaction with H98. Consequently, the channel activation may require fewer protons, resulting in an increased pH sensitivity.
Discussion
Our work on PAC provides the first glimpse of the molecular structures and pH-sensing mechanism of a proton-activated chloride channel (Extended Data Fig. 9h). Similar to ASICs12,14,17–19, the pH sensing of PAC is almost certainly determined by multiple residues because several tested mutations altered but none of them abolished the pH sensitivity, and because titratable residues are distributed throughout the ECD (Extended Data Fig. 9a). Our structural and functional data support that the pH4–PAC structure represents a proton-bound pre-open state or a proton-bound desensitized state. We acknowledge the limits of using a proton-bound non-conducting conformation to discuss the activation mechanism because the TMD may differ from that in an open state. Indeed, cysteine mutants of multiple pore lining residues in TM2, including A316, L315, G312, can still be accessed by a thiol-reactive reagent MTSES from the extracellular side5, indicating the ion conducting pore and lateral fenestrations in an open state are likely substantially larger than in either of the present structures. Further studies are required to develop a thorough understanding of this novel proton sensitive ion channel family.
Methods
Constructs and Mutagenesis
For protein expression and purification, the human PAC gene (UniprotID: Q9H813) from our previous study4 was subcloned into pEG BacMam vector21 with a thrombin cutting site, enhanced green fluorescence protein (eGFP), and 8x His tag in the C-terminus. The pIRES2-EGFP vector containing the human PAC gene was used for whole-cell patch clamp recordings4. Site-directed mutagenesis was performed by using QuikChange site directed mutagenesis protocol (Agilent) and confirmed by Sanger sequencing.
Mammalian cell culture, protein expression, purification, and nanodisc reconstitution
For small-scale protein expression, adherent tsA201 cells were maintained in Dulbecco’s Modified Eagle Medium (DMEM) media supplemented with 10% fetal bovine serum (FBS) at 37 °C. When cell density reached approximately 80% confluence, transient transfection was performed by incubating the plasmid DNA and Lipofectamine-2000 reagent (ThermoFisher Scientific) in Opti-MEM media (ThermoFisher Scientific) using manufacturer-provided protocols. Sodium butyrate (10 mM) was added to the adherent cells 24 h post-transfection. The cells were then maintained at 30 °C to boost protein expression. The next day, the adherent cells were washed with 20 mM Tris, 150 mM NaCl, pH8.0 (TBS) buffer, collected, and stored at –80 °C.
For large-scale protein expression, we employed the Bac-to-Bac Baculovirus Expression System22. Specifically, full-length PAC plasmid was transfected into DH10α cells to produce the bacmid. Purified bacmid was transfected into adherent Sf9 cells using Cellfectin II reagent (ThermoFisher Scientific) to produce P1 virus. P2 virus was then generated by infecting suspension Sf9 cells with the P1 virus at a 1:5000 (v/v) ratio. The expression of PAC protein was induced by infecting tsA201 suspension cells in FreeStyle 293 media (Gibco) with 7.5% P2 virus. After 8–12 h, sodium butyrate (5 mM) was added to the infected suspension cells and the temperature was adjusted to 30 °C. Suspension tsA201 cells were harvested 70 h post-infection and stored at –80 °C.
Mammalian cells infected with PAC were suspended in TBS buffer (150 mM NaCl, 20 mM Tris HCl, pH 8.0) supplemented with a protease inhibitor cocktail (1 mM phenylmethylsulfonyl fluoride, 2 mM pepstatin, 0.8 μM aprotinin and 2 μg mL–1 leupeptin) and lysed by sonication. Cell debris was removed by centrifugation at 3000 × g for 10 min. Membrane fraction was pooled by ultracentrifugation of the supernatant for 1 h at 186,000 × g. Membrane was then dounce homogenized and solubilized in TBS buffer with 1% glyco-diosgenin (GDN) and the protease inhibitor cocktail. After 1 h, the sample was ultraceltrifiged for 1 h at 186,000 × g. The supernatant was applied to 2 mL of talon resin preequilibrated with TBS buffer with 0.02% GDN. The resin was washed with 20 mL of TBS buffer with 0.02% GDN and 20 mM imidazole. The protein was eluted with 8 mL of TBS buffer with 0.02% GDN and 250 mM imidazole. The eluent was concentrated to 500 μL using a 100-kDa concentrator (MilliporeSigma). MSP3D1 protein and soybean lipid extract were mixed with PAC protein sample using a molar ratio of 3:400:1. Three rounds of biobeads incubation were carried out to facilitate nanodisc reconstitution. The volume of the mixture was then expanded to 12.5 mL so that the imidazole concentration was 10 mM. Empty nanodiscs were removed by passing the mixture through talon resin a few times. MSP3D1-PAC was eluted using TBS buffer containing 250 mM imidazole and concentrated to 500 μL. Thrombin (0.01 mg mL–1) was then added to the eluent to cleave eGFP at 4 °C overnight. The mixture was further purified by size-exclusion chromatography (SEC) using TBS as the running buffer. Peak fractions were combined and concentrated to 4 mg mL–1 before grid freezing.
Cryo-grid preparation
The purified PAC nanodisc protein is in TBS buffer at pH 8. The pH 4 condition was made by adding 1 M acetic acid, pH 3.5, buffer to the purified PAC nanodisc sample at a 1:20 v/v ratio. Fluorinated octyl maltoside (0.5 mM) was added to the sample to help reduce air-water interface associated protein unfolding. Quantifoil grids (Au 1.2/1.3 or Au 2/1, 300 mesh) were glow-discharged for 30 s. Cryo-grid was made using the VitrobotMark III kept at 18 °C and 100% humidity. A volume of 2.5 μL of PAC nanodisc protein sample was loaded to the grid, blotted for 1.5 s, plunge-frozen into liquid ethane, and transferred into liquid nitrogen for storage.
Cryo-EM data collection
Cryo-EM data was collected using a FEI Titan Krios transmission electron microscope equipped with a Gatan K2 Summit direct electron detector. Automated data acquisition was facilitated by SerialEM software in super-resolution counting mode23. Each raw movie stack consists of 40 frames with a total dose of 49.6 e–/Å2 for 8 s. Nominal defocus values were set to range from –1.2 to –1.9 μm.
Single-particle data analysis
For both PAC pH 8 and PAC pH 4 data set, raw movies were first motion-corrected using motioncor 1.2.1 (Ref 24). The contrast transfer function (CTF) of each micrograph was estimated using gctf v1.06 (Ref 25) or ctffind26. Template-based particle picking was conducted using gautomatch v0.56 (Ref https://www.mrc-lmb.cam.ac.uk/kzhang/Gautomatch/). Junk particles were sorted by two rounds of 2D classification in relion 3.0 (Ref 27).
For PAC pH 8 data set, particles belonging to the 2D class averages with features were selected for ab initio 3D reconstruction in cryosparc v0.6.5 (Ref 28). The resulting map was then used as the template for 3D classification using relion 3.0 with C1 symmetry. Class averages with high-resolution features were combined and refined by imposing C3 symmetry. A solvent mask was generated and was used for all subsequent refinement steps. Bayesian polishing was conducted to refine the beam-induced motion of the particle set, resulting in a map at 4.0 Å resolution29.
We noticed that the size of the nanodiscs was not homogeneous, which could lead to inaccuracy of particle alignment. Additionally, the cytosolic side of the transmembrane domain (TMD) is flexible, which could also influence particle alignment. To address these potential problems, we subtracted the nanodisc signal and further classify the particles without image alignment. A subsequent 3D refinement allowed us to obtain a map at 3.60 Å for PAC. Likewise, we also attempted to only include signals from the extracellular domain (ECD) and part of the TMD close to ECD. This strategy allowed us to obtain a reconstruction at 3.36 Å. The pH 8 data processing workflow is summarized in Extended Data Fig. 2a.
For PAC pH 4 data set, the initial 3D classification was performed by using PAC pH 8 map (low pass filter to 50 Å) as the reference. Particles belonging to 3D classes with high-resolution features were pooled and refined using C3 symmetry. This yielded a reconstruction at 5.8 Å. We then reclassified the particles using this map (low pass filter it to 50 Å) and imposed C3 symmetry. Subsequent refinement on reasonable 3D classes allowed us to obtain a reconstruction at 4.6 Å resolution. Finally, a third 3D classification was initiated by only low pass filter the reference to 7 Å and with C3 symmetry. This classification helped obtain a homogeneous particle set that gave a reconstruction at 4.2 Å after refinement. We then performed signal subtraction, and 3D classification without image alignment by focusing on the ECD and part of the TMD proximal to ECD. This step allowed us to further push the overall map resolution to 3.73 Å for PAC at pH 4. We also attempted to only refine the ECD and part of the TMD for the pH 4 data, which resulted in a map at 3.66 Å resolution. The pH 4 data processing workflow is summarized in Extended Data Fig. 3a.
Model building
The PAC pH8 model was built de novo using Coot30. Registers were identified by secondary structure prediction from JPred web server and bulky residues in the density31. Both the full map and the ECD focused map were used during model building. We are able to model residue 61–338 into the map. Extra density observed on N148, N155, N162, and N190 in the ECD was modeled as N-acetyl-D-glucosamine (NAG) to represent N-linked glycosylation. Real space refinement was performed in phenix to produce the final model32.
The PAC pH 4 model was first generated by the RosettaEM flexible fitting tools, with the PAC pH 8 map as the starting point33. The model was then manually adjusted in Coot and subjected to Phenix real space refinement32. The final model contains residues 53–339 of PAC. Models and maps are visualized using UCSF Chimera, UCSF ChimeraX and PyMOL34–36.
Deglycosylation assay
Adherent tsA201 cells transiently transfected with WT-PAC-eGFP were solubilized using TBS buffer with 1% GDN for 1 hour at 4 °C. The sample was centrifuged at 20,000 × g for 30 min. Deglycosylation was facilitated by mixing the PNGase F with the supernatant and incubating at room temperature overnight. For the control reaction, the same amount of water was added instead of PNGase F enzyme. The next day, the sample was mixed with 2x SDS Sample loading buffer (Sigma) and resolved by SDS-PAGE electrophoresis. The gel was image in the ChemiDoc system by probing the far red and GFP signal (mUV 680 and 488 nm).
Molecular dynamics (MD) simulation
The structure of PAC in the pH 8 or pH 4 state was used as the starting model. Missing side chain atoms were fixed using the PDB2PQR utility37. Titratable residues were assigned as the predominant protonation state based on the predicted pKa value from PROPKA3 at pH 8 or pH 4 (Ref38). The membrane orientation of the protein was calculated using the OPM server39. Subsequent system preparation was conducted in CHARMM-GUI40. POPC lipids were selected to construct the lipid bilayer. The rest of the protein was solvated/neutralized in 150 mM NaCl. The resulting simulation box had a dimension of approximately 87 × 87 × 163 Å.
All-atom MD simulation was carried out using GROMACS 2019.2 version41. CHARMM36m force field was used to parameterize the MD system42. The steepest-descent algorithm was used to minimize the energy of the system so that the Fmax was below 1000 kJ mol–1 nm–1. The NVT ensemble was then started to keep the temperature of the system at 310 K. Subsequently, the NPT ensemble was enabled by maintaining the system pressure at 1 bar. Protein non-hydrogen atoms and phosphorus groups of POPC were restrained during NVT and NPT equilibration. Production simulation continued from the NPT equilibrated system with the restraints disabled. A Nosé–Hoover thermostat and a Parrinello–Rahman barostat were used to keep system temperature and pressure, respectively. Hydrogen atoms were constrained using the LINCS algorithms43. For efficient GPU acceleration, a Verlet cutoff scheme (12 Å) was enabled to maintain the particle neighbor list. We performed 100-ns simulation for both PAC pH 8 and pH 4 conditions using a timestep of 2 fs. Analysis of the MD trajectory was conducted using the utilities inside GROMACS. Specifically, the slice of water molecules in each snapshot was extracted using the gmx select command. The corresponding atom coordinates could then be projected to the x/y plan for visualization.
pKa prediction
We noticed that the pKa prediction is very sensitive to the side-chain orientations of the input structure model. To partially account for this issue, we generated an ensemble of PAC models based on the pH 8 and pH 4 structures using Rosetta. Specifically, the fixed backbone design protocol was used to sample the side-chain rotamers44. A total of 1000 pdb models were built and subjected to pKa prediction using propka38. The mean and standard deviation of the pKa for histidine, glutamate, and aspartate residues were reported in Extended Data Fig. 9a.
Electrophysiology
PAC knockout HEK293 cells were seeded on coverslips and transfected with WT or mutant PAC plasmids using Lipofectamine 2000 (Thermo Fisher). The cells were recorded ~1 d after transfection. Whole-cell patch clamp recordings were performed as described previously4. The extracellular recording solution contained (in mM): 145 NaCl, 2 KCl, 2 MgCl2, 1.5 CaCl2, 10 HEPES, 10 glucose (300–310 mOsm/kg; pH 7.3, titrated with NaOH). Acidic extracellular solutions were made of the same ionic composition with 5 mM sodium citrate as the buffer instead of HEPES, and pH was adjusted using citric acid. Solutions were applied locally using a gravity perfusion system with a small tip 100–200 μm away from the recording cell. The intracellular recording solution contained (in mM): 135 CsCl, 1 MgCl2, 2 CaCl2, 10 HEPES, 5 EGTA, 4 MgATP (280–290 mOsm/kg; pH 7.2, titrated with CsOH). Pipette solution used to observe PAC current at 0 mV contained (in mM): 50 NaCl, 100 Na-gluconate, 10 HEPES (280–290 mOsm/kg; pH 7.2, adjusted with NaOH). Patch pipettes (2–4 MΩ) were pulled with a Model P-1000 multi-step puller (Sutter Instruments).
For selectivity experiments, extracellular solution used contained (in mM): 15 or 150 NaCl, 10 MES, 10 glucose (osmolality adjusted with mannitol to 300–310 mOsm/kg; pH adjusted with methanesulfonic acid to 5.0). The pipette solution contained (in mM) 150 NaCl, 10 HEPES (280–290 mOsm/kg; pH 7.2, adjusted with NaOH). Voltage ramp pulses were applied every 3 s from –100 to +100 mV at a speed of 1 mV/ms, and a holding potential of 0 mV. The recorded currents were used to generate I-V curves for reversal potential determination. The permeability ratios were calculated from shifts in the reversal potential using the Goldman–Hodgkin–Katz equation45. For the measurement of pH sensitivity, currents were normalized to the maximal current at pH 4.6. The normalized data was then fitted to a pH dose-response curve (equation: Y=Bottom + (Top-Bottom)/(1+10^((Log pH50-X)*HillSlope))) to estimate the pH50 and Hill’s slope (Hill coefficient). Recordings were done at room temperature with MultiClamp 700B amplifier and 1550B digitizer (Molecular Devices). Current signals were filtered at 2 kHz and digitized at 10 kHz. Series resistance was compensated for at least 80%. Clampfit 10.6 and GraphPad Prism 6 or 7 were used for data analyses.
Data availability
The cryo-EM density maps and coordinates of pH8–PAC and pH4–PAC have been deposited in the Electron Microscopy Data Bank (EMDB) under accession numbers EMD-22403 and EMD-22404 and in the Research Collaboratory for Structural Bioinformatics Protein Data Bank under accession codes 7JNA and 7JNC.
Extended Data
Extended Data Figure 1: Purification of PAC, and biochemical and biophysical analysis.
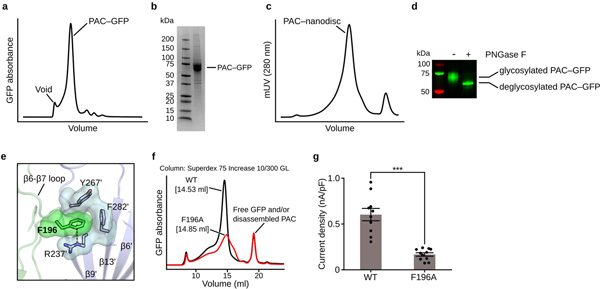
a, Fluorescence size exclusion chromatography (FSEC) of PAC–GFP solubilized in GDN detergent. b, SDS-PAGE gel of purified PAC–GFP protein after metal affinity chromatography. The uncropped source gel of the image can be found in Supplementary Fig. 1a. The gel was repeated three times from different batches of purification and similar results were obtained. c, Size-exclusion chromatography profile of PAC in MSP3D1 nanodiscs. d, A deglycosylation assay of PAC–GFP with or without PNGase F treatment. The GFP and far red signal (Alexa 488 and Alexa 680) of the gel was detected and merged using ChemiDoc imaging system (BioRad). The uncropped source gel of the image can be found in Supplementary Fig. 1b. The deglycosylation assay was repeated twice with similar results. e, F196 mediates intersubunit interactions by forming a cation-π interaction with R237ʹ and hydrophobic interactions with Y267ʹ and F282ʹ from the adjacent subunit. The two subunits are in green and blue. f, FSEC traces of GFP-tagged PAC WT and the F196 mutant solubilized using glycol-diosgenin (GDN) detergent. The peak position of F196A is shifted and is broader compared to WT, suggesting that F196A interferes with the proper assembly of PAC. g, The whole-cell current density of PAC WT and F196A recorded at pH 4.6 with a holding potential of 100 mV. The center error bar represents mean and standard error. Two-tail unpaired t-test was used to determine the difference in current density between F196A and WT (p-value=3.09E-6). D’Agostino & Pearson omnibus test was performed to check the normality of the data (p-value is 0.846 and 0.349 for WT[n=10] and F196A[n=11], respectively). *** denotes a p-value<0.001.
Extended Data Figure 2: The workflow of cryo-EM data processing of pH8–PAC and data statistics.
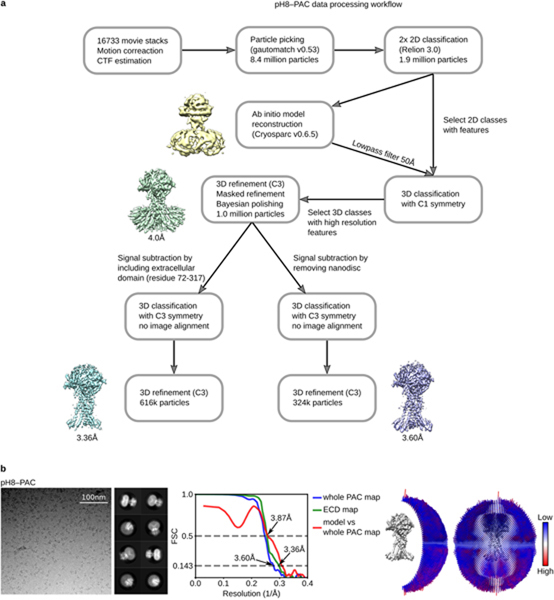
a, A total of 16733 raw movies stacks were collected and processed with motion correction, CTF estimation, and particle picking. Particles were subjected to two rounds of 2D classification and a 3D classification run to obtain a homogeneous particle set. To further sort out conformational heterogeneity, we attempted to subtract and classify 1) particles without nanodiscs and 2) the extracellular domain (ECD) of PAC (residues 72–317) by using a mask. Subsequent refinement allowed us to obtain a map at 3.60 Å resolution for the entire PAC protein and 3.36 Å resolution for the ECD. b, Representative micrograph, 2D class averages, Fourier shell correlation (FSC) curves, and angular distribution of particles used for 3D reconstruction for pH8–PAC dataset. The gold-standard 0.143 threshold was used to determine map resolution based on the FSC curve. The threshold for model versus map correlation was 0.5 to determine the resolution.
Extended Data Figure 3: The workflow of cryo-EM data processing of pH4–PAC and data statistics.
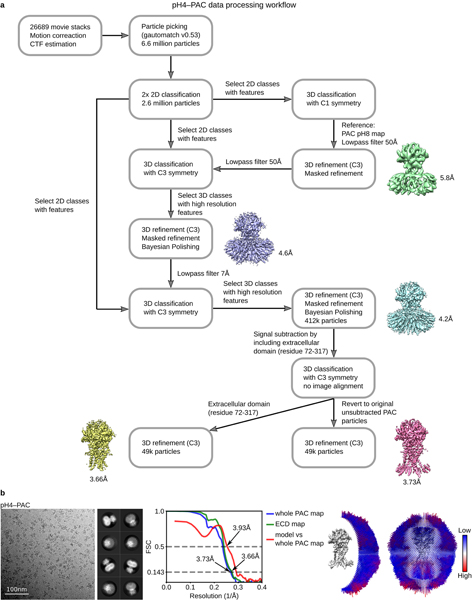
a, A total of 26689 raw movie stacks were collected and processed with motion correction, CTF estimation, and particle picking. Two rounds of 2D classification were performed to clean up junk particles. Subsequently, particles belonging to the 2D class averages with clear features were subjected to three rounds of 3D classification. The initial 3D classification was conducted by using the pH8–PAC map low-pass filter to 50 Å as the reference. No symmetry operator was imposed in this step. After refinement with C3, a 5.8-Å-resolution map for pH4–PAC was obtained. Subsequently, the second 3D classification job was conducted by using the 5.8-Å map as the reference and the low-pass filter to 50 Å. We imposed C3 symmetry at this step to increase the classification efficiency. This allowed us to obtain a map at 4.6 Å after refinement. Finally, a third 3D classification job was launched by using the 4.6-Å pH4–PAC map as the reference and the low-pass filter to 7 Å. The C3 symmetry was also imposed. This classification pushed the resolution of pH4–PAC map to 4.2 Å. In an effort to obtain a more homogeneous particle set, we subtracted the extracellular domain (ECD) of pH4–PAC map (residue 72–317) and classified the refined particles without image alignment. In the end, we obtained a reconstruction of the pH4–PAC map at 3.73 Å resolution and a pH4–PAC ECD map at 3.66 Å resolution. b, Representative micrograph, 2D class averages, Fourier shell correlation (FSC) curves, and angular distribution of particles used for 3D reconstruction for pH4–PAC dataset. The gold-standard 0.143 threshold was used to determine map resolution based on the FSC curve. The threshold for model versus map correlation was 0.5 to determine the resolution.
Extended Data Figure 4: Local resolution/densities of cryo-EM maps and domain organization of human PAC.
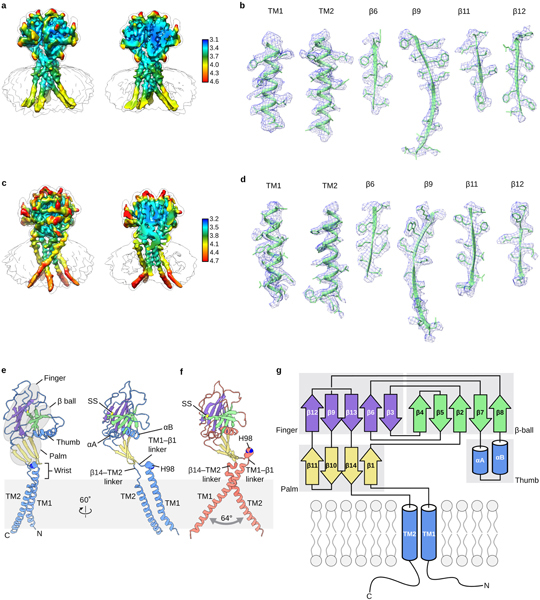
a, The local resolution of the pH8–PAC map. A non-sliced (left) and a sliced (right) view of the map viewed parallel to the membrane are shown. The unit for the color key is Å. b, Representative densities of several secondary structural elements of pH8–PAC. The atomic model is overlaid with the density to show the side chain information. c, The local resolution of the pH4–PAC map. A non-sliced (left) and a sliced (right) view of the map viewed parallel to the membrane are shown. The unit for the color key is Å. d, Representative densities of several secondary structural elements of pH4–PAC. The atomic model is overlaid with the density to show the side chain information. e, The pH8–PAC single subunit viewed parallel to the membrane. The wrist, palm, thumb, finger and β-ball domains are highlighted. f, The pH4–PAC single subunit viewed in the same orientation as the right image of panel e. g, Domain organization of PAC. Clusters of secondary structure that form the palm, finger, thumb, and β-ball domains are labeled.
Extended Data Figure 5: Comparison of the structures of PAC and ASIC.
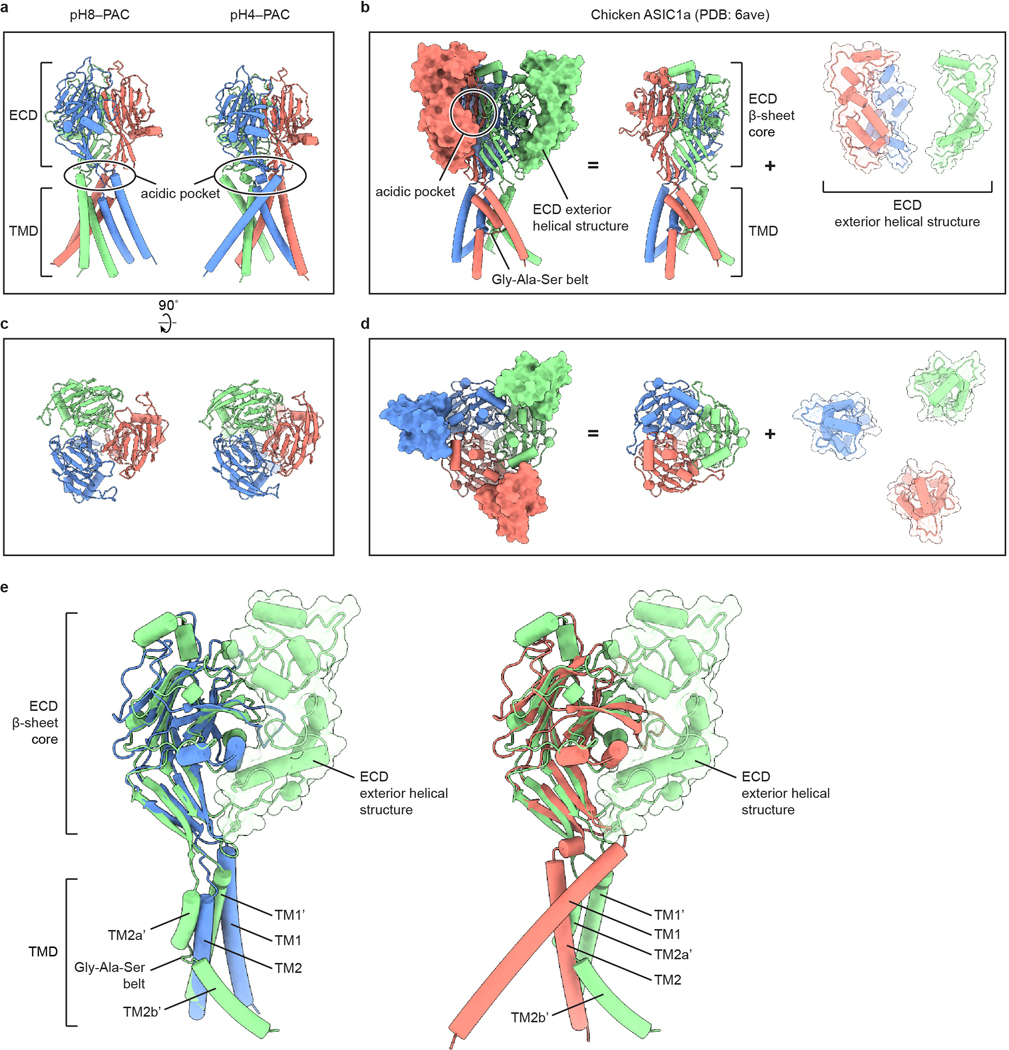
a-d, Structural comparison of human PAC (a, c) with chicken ASIC1a (b, d) viewed parallel to the membrane (a, b) and from the extracellular side (c, d). The acidic pocket of human PAC and chicken ASIC1a are in different locations. e, Overlay of the pH8–PAC (blue) and pH4–PAC (red) single subunit with the chicken ASIC1a (green) subunit. The ECD of ASICa is composed of a β-sheet core and the exterior helical structure. While the β-sheet core shares high similarity to human PAC structure, the chicken ASIC1a TMD is organized differently from that of the human PAC.
Extended Data Figure 6: Sequence alignment of PAC homologs and ASIC.
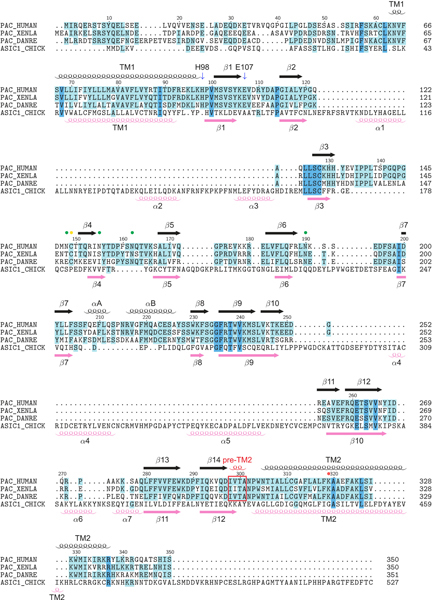
Sequence alignment of PAC homologs (from human, frog [XENTR], and zebrafish [DANRE]) and chicken ASIC1. The ASIC1 sequence is aligned with PAC based on the structural alignment using TMalign20. Secondary structural (SS) elements of PAC are labeled at the top, whereas the SS elements of ASIC1 are indicated at the bottom. Cysteine residues mediating disulfide bonds in the extracellular domain of PAC are marked with yellow dots. Putative N-linked glycosylation sites of PAC are highlighted with green dots. K319 of PAC is marked with red dots. The pre–TM2 helix observed in the pH4–PAC structure is indicated with a red frame. PAC lacks the α1, α2, α3, α4 and α5 helices which form the ECD exterior helical structure in chicken ASIC1a, whereas the αA and αB helices are unique to PAC.
Extended Data Figure 7: PAC channel desensitization.
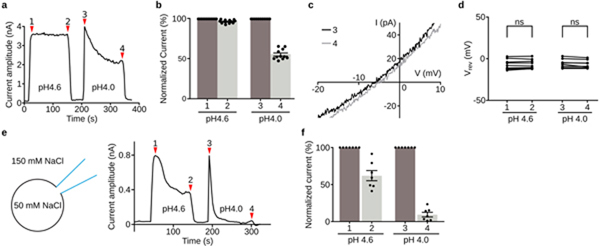
a, A representative whole-cell current trace of PAC in WT HEK293 cells upon extracellular acidification at pH 4.6 and pH 4.0 with a holding potential at 100 mV. Substantial desensitization was observed during the prolonged exposure to the pH 4.0 solution (position 4 versus position 3 in (a)), but not to the pH 4.6 solution (position 2 versus position 1 in (a)). b, The quantification of PAC desensitization (pH 4.6[n=12] and pH 4.0[n=11] as shown in (a). Activation and desensitization currents are normalized to the average current at the initial activation stage. The numbers in X-axis correspond to the red marker location in (a). Each data point is represented by a solid dot. The mean and standard error are represented by the bar graph. c, Representative whole-cell current-voltage traces of PAC at the beginning (position 3 in (a)) and the end (position 4 in (a)) of pH 4.0 treatment. d, The reversal potential of PAC at the beginning and the end of pH 4.6 and pH 4.0 treatment, respectively [n=9]. Two-tail paired t-test was used to determine significance (p-value is 0.361 and 0.077 for pH 4.6 and pH 4.0). D’Agostino & Pearson omnibus test was performed to check the normality of the data (p-value is 0.673 and 0.335 for pH 4.6 and pH 4.0 conditions, respectively). ns indicates a p-value>0.05. e, Whole-cell patch clamp recording configuration with 50 mM NaCl pipette solution and 145 mM bath solutions (scheme depicted on the left panel). This creates the concentration gradient necessary to observe any potential PAC current at 0 mV. Due to the small amplitude of endogenous PAC current at 0 mV, we transfected PAC cDNA in PAC KO HEK293 cells. The representative whole-cell current trace of PAC upon acidification at 0 mV is shown on the right panel. Location 1 and 3 represent initial activation of PAC immediately after acidic buffer treatment. Location 2 and 4 represents desensitized PAC after prolonged acidic buffer treatment. f, The desensitized currents (position 2 and 4 in (e)) are normalized to the initial PAC currents (position 1 and 3 in (e)). The desensitized data currents are represented by the normalized average +/− standard error.
Extended Data Figure 8: Lateral fenestration and ion selectivity of PAC.
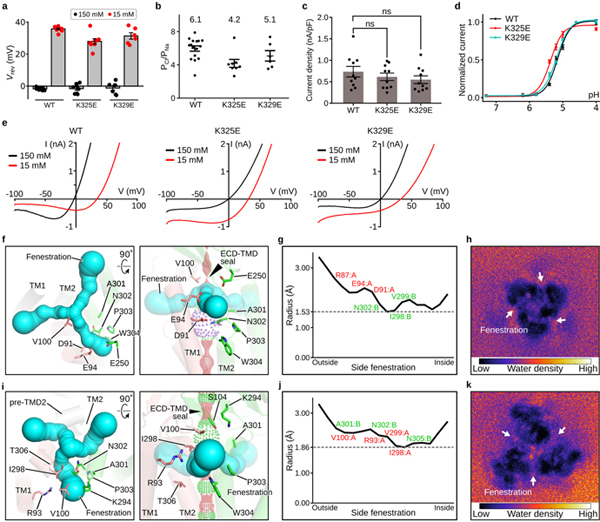
a, The reversal potential (Vrev) of PAC WT, K325E, and K329E at 150 mM NaCl (black) or 15 mM NaCl (red) in the bath solution (internal solution contains 150 mM NaCl). The bar graph represents the mean and standard error (WT[n=16], K325E[n=8], and K329E[n=6]). Individual data points are shown as dots (The same data points for WT were also used in Fig. 3i for comparison with K319E). b, The relative Cl-/Na+ permeability for PAC WT[n=16], K325E[n=8], and K329E[n=6] calculated from the pH 5-induced current at 100 mV. The center and error bar represent the mean and standard error of the permeability ratio. Individual data points are shown as solid dots (The same data points for WT were also used in Fig. 3j for comparison with K319E). The average PCl/PNa permeability values are indicated for each construct. c, The current density of PAC WT[n=10], K325E[n=10], and K329E[n=10] at pH 4.6 with a holding potential of 100 mV. The bar graph shows the average normalized current density +/− standard error. One-way analysis of variance (ANOVA) with Bonferroni post hoc test was used to determine the significance (p-value is 0.832 and 0.416 for K325E and K329E, respectively). D’Agostino & Pearson omnibus test was performed to check the normality of the data (p-value is 0.255, 0.153, and 0.293 for WT, K325E, and K329E, respectively). ns indicates a p-value>0.05. d, The pH dose-response curve of WT PAC, K325E, and K329E. The currents are normalized to those at pH 4.6 (n=8 for WT PAC; n=6 for K325E; n=7 for K329E). The currents at different pH are represented by the average normalized currents +/− standard error. A non-linear fitting to a sigmoidal dose-response curve is generated for each construct. e, The representative whole-cell patch clamp recording at pH 5.0 with 150 mM NaCl pipette solution and 150 mM (black) or 15 mM NaCl (red) bath solutions. The current-voltage relationship of WT (left), K325E (middle) and K329E (right) PAC in two different bath solutions are plotted. The same WT traces were also shown in the left panel of Fig. 3j for comparison with K319E. f and i, The pH8–PAC and pH4–PAC extracellular fenestration viewed from the extracellular side (left) and parallel to the membrane (right), respectively. Residues forming the fenestration are shown in sticks, including three negatively charged residues (D91, E94 and E250) for pH8–PAC and two positively charged residues (R93 and K294) for pH4–PAC. g and j, the radius of the fenestration tunnel estimated by CAVER 3.0 for pH8–PAC (g) and pH4–PAC (j). The horizontal line marks the smallest radius along the tunnel. The residues lining the fenestration tunnel are marked. h and k, The fenestration water density plot of pH8–PAC (h) and pH4–PAC (k) from a 100-ns molecular dynamics simulation. Water molecules in the Z range of the side fenestration site are projected to the X/Y plane and are shown as a 2D histogram.
Extended Data Figure 9: H98 is involved in PAC pH sensing.
a, The pKa prediction of titratable residues for the pH8 and pH4 structures of human PAC. The mean and error bar (standard deviation) are calculated based on 1000 fixed backbone rotamer ensembles generated from each structure (see Methods). b, A SDS-gel of GFP-tagged PAC WT, H98C/Q296C, and H98S/Q296S. A dimeric band is observed for H98C/Q296C mutant, but not for WT and H98S/Q296S. The unedited source gel of the image can be found in Supplementary Fig. 1c. The gel was independently repeated twice with similar results. c, The FSEC profile of GFP-tagged PAC WT, H98C/Q296C, and H98S/Q296S solubilized using GDN detergent. d, The whole-cell current density of PAC WT, H98C/Q296C, and H98S/Q296S recorded at pH 5.0 at 100 mV. The bar graph shows the average current density (nA/pF) +/− standard error. Each individual data point represents a cell (WT[n=8], H98C/Q296C[n=10], and H98S/Q296S[n=12]). Two-tail unpaired t-test was used to determine the difference in current density compared to WT (p-value is 1.08E-6 for H98C/Q296C and 0.321 for H98S/Q296S). D’Agostino & Pearson omnibus test was performed to check the normality of the data (p-value is 0.328, 0.154, and 0.727 for WT, H98C/Q296C, and H98S/Q296S, respectively). e, The pH dose-response curve of WT PAC and H98S/Q296S. The currents are normalized to those at pH 4.6 (n=5 for WT PAC; n=6 for H98S/Q296S). A non-linear fitting to a sigmoidal dose-response curve is generated for each construct. Bar plot shows the mean +/− standard error. f, The pH50 of PAC WT and H98S/Q296S estimated from the pH dose-response curve. The center and bar represent the estimated pH50 and standard error from the non-linear fitting in (e). Two-tail Mann-Whitney test was used to determine the significance (p-value is 0.0087). g, The proposed pH sensing mechanism for PAC. At high pH, the deprotonated H98 is surrounded by Q296, S102, and I298, and TM1 pairs with TM2 from the same subunit. At low pH, the protonated H98 undergoes a conformational change and moves into an acidic pocket. As a result, the TM1 dissociates from the resting interface and rotates to interact with TM2 of the adjacent subunit. For all panels, ns indicates a p-value>0.05.; ** denotes p-value between 0.01 and 0.0001; *** denotes a p-value<0.001; n represents measurement from biologically independent cells.
Extended Data Table 1:
Cryo-EM data collection, refinement and validation statistics.
| pH8-PAC | pH4-PAC | |
|---|---|---|
| Data collection and processing | ||
| Magnification | 130,000 | 130,000 |
| Voltage (kV) | 300 | 300 |
| Electron exposure (e−/Å2) | 49.6 | 49.6 |
| Defocus range (jun) | −1.2 to−1.9 | −1.2 to−1.9 |
| Pixel size (Å) | 1.026 | 1.026 |
| Symmetry imposed | C3 | C3 |
| Initial particle images (no.) | 4,515,826 | 6,647,983 |
| Final particle images (no.) | 323,766 | 48,551 |
| Map resolution (Å) | 3.60 | 3.73 |
| FSC threshold | 0.143 | 0.143 |
| Map resolution range (Å) | 3.60–246.2 | 3.73–246.2 |
| Refinement | ||
| Initial model used (PDB code) | De novo | De novo |
| Model resolution (Å) | ||
| FSC threshold | 3.87 | 3.93 |
| Map sharpening B factor (Å2) | −180.05 | −148.66 |
| Model composition | ||
| Non-hydrogen atoms | 6432 | 6573 |
| Protein residues | 834 | 861 |
| Ligands | 0 | 0 |
| R.m.s. deviations | ||
| Bond lengths (Å) | 0.004 | 0.004 |
| Bond angles (°) | 0.627 | 0.617 |
| Validation | ||
| MolProbity score | 1.87 | 2.07 |
| Clashscore | 11.12 | 16.75 |
| Poor rotamers (%) | 0.00 | 0.00 |
| Ramachandran plot | ||
| Favored (%) | 95.65 | 95.09 |
| Allowed (%) | 4.35 | 4.91 |
| Disallowed (%) | 0.00 | 0.00 |
Supplementary Material
Acknowledgements
We thank G. Zhao and X. Meng for the support with data collection at the David Van Andel Advanced Cryo-Electron Microscopy Suite. We appreciate the HPC team of VARI for computational support. We thank D. Nadziejka for technical editing. W.L. is supported by the National Institute of Health (NIH) (grant R56HL144929 and R01NS112363). Z.Q. is supported by a McKnight Scholar Award, a Klingenstein-Simon Scholar Award, a Sloan Research Fellowship in Neuroscience, and NIH (grant R35GM124824 and R01NS118014). Z.R. is supported by an American Heart Association (AHA) postdoctoral fellowship (grant 20POST35120556). J. O.-O. is supported by an AHA predoctoral fellowship (grant 18PRE34060025). J.D. is supported by a McKnight Scholar Award, a Klingenstein-Simon Scholar Award, a Sloan Research Fellowship in Neuroscience, a Pew Scholar in the Biomedical Sciences, and NIH (grant R01NS111031).
Footnotes
The authors declare no conflicts of interest.
References
- 1.Capurro V et al. Functional analysis of acid-activated Cl− channels: properties and mechanisms of regulation. Biochim. Biophys. Acta 1848, 105–114 (2015). [DOI] [PubMed] [Google Scholar]
- 2.Wang HY, Shimizu T, Numata T & Okada Y. Role of acid-sensitive outwardly rectifying anion channels in acidosis-induced cell death in human epithelial cells. Pflugers Arch. Eur. J. Physiol. 454, 223–233 (2007). [DOI] [PubMed] [Google Scholar]
- 3.Sato-Numata K, Numata T & Okada Y. Temperature sensitivity of acid-sensitive outwardly rectifying (ASOR) anion channels in cortical neurons is involved in hypothermic neuroprotection against acidotoxic necrosis. Channels (Austin). 8, 278–283 (2014). [DOI] [PMC free article] [PubMed] [Google Scholar]
- 4.Yang J et al. PAC, an evolutionarily conserved membrane protein, is a proton-activated chloride channel. Science 364, 395–399 (2019). [DOI] [PMC free article] [PubMed] [Google Scholar]
- 5.Ullrich F et al. Identification of TMEM206 proteins as pore of PAORAC/ASOR acid-sensitive chloride channels. Elife 8, (2019). [DOI] [PMC free article] [PubMed] [Google Scholar]
- 6.Osei-Owusu J, Yang J, Del Carmen Vitery M, Tian M & Qiu Z. PAC proton-activated chloride channel contributes to acid-induced cell death in primary rat cortical neurons. Channels (Austin). 14, 53–58 (2020). [DOI] [PMC free article] [PubMed] [Google Scholar]
- 7.Jasti J, Furukawa H, Gonzales EB & Gouaux E. Structure of acid-sensing ion channel 1 at 1.9 A resolution and low pH. Nature 449, 316–23 (2007). [DOI] [PubMed] [Google Scholar]
- 8.Noreng S, Bharadwaj A, Posert R, Yoshioka C & Baconguis I. Structure of the human epithelial sodium channel by cryo-electron microscopy. Elife 7, (2018). [DOI] [PMC free article] [PubMed] [Google Scholar]
- 9.Gonzales EB, Kawate T & Gouaux E. Pore architecture and ion sites in acid-sensing ion channels and P2X receptors. Nature 460, 599–604 (2009). [DOI] [PMC free article] [PubMed] [Google Scholar]
- 10.Baconguis I, Bohlen CJ, Goehring A, Julius D & Gouaux E. X-ray structure of acid-sensing ion channel 1-snake toxin complex reveals open state of a Na(+)-selective channel. Cell 156, 717–29 (2014). [DOI] [PMC free article] [PubMed] [Google Scholar]
- 11.Yoder N & Gouaux E. Divalent cation and chloride ion sites of chicken acid sensing ion channel 1a elucidated by x-ray crystallography. PLoS One 13, e0202134 (2018). [DOI] [PMC free article] [PubMed] [Google Scholar]
- 12.Yoder N, Yoshioka C & Gouaux E. Gating mechanisms of acid-sensing ion channels. Nature 555, 397–401 (2018). [DOI] [PMC free article] [PubMed] [Google Scholar]
- 13.Mansoor SE et al. X-ray structures define human P2X(3) receptor gating cycle and antagonist action. Nature 538, 66–71 (2016). [DOI] [PMC free article] [PubMed] [Google Scholar]
- 14.Vullo S et al. Conformational dynamics and role of the acidic pocket in ASIC pH-dependent gating. Proc. Natl. Acad. Sci. U. S. A. 114, 3768–3773 (2017). [DOI] [PMC free article] [PubMed] [Google Scholar]
- 15.Gao C et al. Roles of the lateral fenestration residues of the P2X₄ receptor that contribute to the channel function and the deactivation effect of ivermectin. Purinergic Signal. 11, 229–38 (2015). [DOI] [PMC free article] [PubMed] [Google Scholar]
- 16.Lambert S & Oberwinkler J. Characterization of a proton-activated, outwardly rectifying anion channel. J. Physiol. 567, 191–213 (2005). [DOI] [PMC free article] [PubMed] [Google Scholar]
- 17.Liechti LA et al. A combined computational and functional approach identifies new residues involved in pH-dependent gating of ASIC1a. J. Biol. Chem. 285, 16315–16329 (2010). [DOI] [PMC free article] [PubMed] [Google Scholar]
- 18.Smith ESJ, Zhang X, Cadiou H & McNaughton PA Proton binding sites involved in the activation of acid-sensing ion channel ASIC2a. Neurosci. Lett. 426, 12–17 (2007). [DOI] [PubMed] [Google Scholar]
- 19.Paukert M, Chen X, Polleichtner G, Schindelin H & Gründer S. Candidate amino acids involved in H+ gating of acid-sensing ion channel 1a. J. Biol. Chem. 283, 572–581 (2008). [DOI] [PubMed] [Google Scholar]
Additional References
- 20.Zhang Y & Skolnick J. TM-align: a protein structure alignment algorithm based on the TM-score. Nucleic Acids Res. 33, 2302–2309 (2005). [DOI] [PMC free article] [PubMed] [Google Scholar]
- 21.Goehring A et al. Screening and large-scale expression of membrane proteins in mammalian cells for structural studies. Nat. Protoc. 9, 2574–2585 (2014). [DOI] [PMC free article] [PubMed] [Google Scholar]
- 22.Haley E et al. Expression and Purification of the Human Lipid-sensitive Cation Channel TRPC3 for Structural Determination by Single-particle Cryo-electron Microscopy. J. Vis. Exp. (2019) doi: 10.3791/58754. [DOI] [PubMed] [Google Scholar]
- 23.Mastronarde DN Automated electron microscope tomography using robust prediction of specimen movements. J. Struct. Biol. 152, 36–51 (2005). [DOI] [PubMed] [Google Scholar]
- 24.Zheng SQ et al. MotionCor2: anisotropic correction of beam-induced motion for improved cryo-electron microscopy. Nat. Methods 14, 331–332 (2017). [DOI] [PMC free article] [PubMed] [Google Scholar]
- 25.Zhang K. Gctf: Real-time CTF determination and correction. J. Struct. Biol. 193, 1–12 (2016). [DOI] [PMC free article] [PubMed] [Google Scholar]
- 26.Rohou A & Grigorieff N. CTFFIND4: Fast and accurate defocus estimation from electron micrographs. J. Struct. Biol. 192, 216–221 (2015). [DOI] [PMC free article] [PubMed] [Google Scholar]
- 27.Scheres SHW RELION: implementation of a Bayesian approach to cryo-EM structure determination. J. Struct. Biol. 180, 519–530 (2012). [DOI] [PMC free article] [PubMed] [Google Scholar]
- 28.Punjani A, Rubinstein JL, Fleet DJ & Brubaker MA cryoSPARC: algorithms for rapid unsupervised cryo-EM structure determination. Nat. Methods 14, 290–296 (2017). [DOI] [PubMed] [Google Scholar]
- 29.Zivanov J, Nakane T & Scheres SHW A Bayesian approach to beam-induced motion correction in cryo-EM single-particle analysis. IUCrJ 6, 5–17 (2019). [DOI] [PMC free article] [PubMed] [Google Scholar]
- 30.Emsley P & Cowtan K. Coot: model-building tools for molecular graphics. Acta Crystallogr. D. Biol. Crystallogr. 60, 2126–2132 (2004). [DOI] [PubMed] [Google Scholar]
- 31.Drozdetskiy A, Cole C, Procter J & Barton GJ JPred4: a protein secondary structure prediction server. Nucleic Acids Res. 43, W389–94 (2015). [DOI] [PMC free article] [PubMed] [Google Scholar]
- 32.Afonine PV et al. New tools for the analysis and validation of cryo-EM maps and atomic models. Acta Crystallogr. Sect. D, Struct. Biol. 74, 814–840 (2018). [DOI] [PMC free article] [PubMed] [Google Scholar]
- 33.Wang RYR et al. Automated structure refinement of macromolecular assemblies from cryo-EM maps using Rosetta. Elife 5, (2016). [DOI] [PMC free article] [PubMed] [Google Scholar]
- 34.Pettersen EF et al. UCSF Chimera--a visualization system for exploratory research and analysis. J. Comput. Chem. 25, 1605–1612 (2004). [DOI] [PubMed] [Google Scholar]
- 35.Goddard TD et al. UCSF ChimeraX: Meeting modern challenges in visualization and analysis. Protein Sci. 27, 14–25 (2018). [DOI] [PMC free article] [PubMed] [Google Scholar]
- 36.Schrödinger LLC. The {PyMOL} Molecular Graphics System, Version~2.1. (2020). [Google Scholar]
- 37.Dolinsky TJ, Nielsen JE, McCammon JA & Baker NA PDB2PQR: an automated pipeline for the setup of Poisson-Boltzmann electrostatics calculations. Nucleic Acids Res. 32, W665–7 (2004). [DOI] [PMC free article] [PubMed] [Google Scholar]
- 38.Olsson MHM, SØndergaard CR, Rostkowski M & Jensen JH PROPKA3: Consistent treatment of internal and surface residues in empirical p K a predictions. J. Chem. Theory Comput. 7, 525–537 (2011). [DOI] [PubMed] [Google Scholar]
- 39.Lomize MA, Pogozheva ID, Joo H, Mosberg HI & Lomize AL OPM database and PPM web server: resources for positioning of proteins in membranes. Nucleic Acids Res. 40, D370–6 (2012). [DOI] [PMC free article] [PubMed] [Google Scholar]
- 40.Jo S, Kim T, Iyer VG & Im W. CHARMM-GUI: a web-based graphical user interface for CHARMM. Journal of computational chemistry vol. 29 1859–1865 (2008). [DOI] [PubMed] [Google Scholar]
- 41.Abraham MJ et al. Gromacs: High performance molecular simulations through multi-level parallelism from laptops to supercomputers. SoftwareX 1–2, 19–25 (2015). [Google Scholar]
- 42.Huang J et al. CHARMM36m: an improved force field for folded and intrinsically disordered proteins. Nat. Methods 14, 71–73 (2017). [DOI] [PMC free article] [PubMed] [Google Scholar]
- 43.Hess B. P-LINCS: A Parallel Linear Constraint Solver for Molecular Simulation. J. Chem. Theory Comput. 4, 116–122 (2008). [DOI] [PubMed] [Google Scholar]
- 44.Leaver-Fay A, Kuhlman B & Snoeyink J. An adaptive dynamic programming algorithm for the side chain placement problem. Pac. Symp. Biocomput. 16–27 (2005). [PubMed] [Google Scholar]
- 45.Yang H et al. TMEM16F forms a Ca2+-activated cation channel required for lipid scrambling in platelets during blood coagulation. Cell 151, 111–122 (2012). [DOI] [PMC free article] [PubMed] [Google Scholar]
Associated Data
This section collects any data citations, data availability statements, or supplementary materials included in this article.
Supplementary Materials
Data Availability Statement
The cryo-EM density maps and coordinates of pH8–PAC and pH4–PAC have been deposited in the Electron Microscopy Data Bank (EMDB) under accession numbers EMD-22403 and EMD-22404 and in the Research Collaboratory for Structural Bioinformatics Protein Data Bank under accession codes 7JNA and 7JNC.


