Abstract
Here we report a vertically integrated in vitro - in silico study that aims to elucidate the molecular initiating events involved in the induction of oxidative stress (OS) by seven diverse chemicals (cumene hydroperoxide, t-butyl hydroperoxide, hydroquinone, t-butyl hydroquinone, bisphenol A, Dinoseb, and perfluorooctanoic acid). To that end, we probe the relationship between chemical properties, cell viability, glutathione (GSH) depletion, and antioxidant gene expression. Concentration-dependent effects on cell viability were assessed by MTT assay in two Hepa-1 derived mouse liver cell lines: a control plasmid vector transfected cell line (Hepa-V), and a cell line with increased glutamate-cysteine ligase (GCL) activity and GSH content (CR17). Changes to intracellular GSH content and mRNA expression levels for the Nrf2-driven antioxidant genes Gclc, Gclm, heme oxygenase-1 (Hmox1), and NADPH quinone oxidoreductase-1 (Nqo1) were monitored after sublethal exposure to the chemicals. In silico models of covalent and redox reactivity were used to rationalize differences in activity of quinones and peroxides. Our findings show CR17 cells were generally more resistant to chemical toxicity and showed markedly attenuated induction of OS biomarkers; however, differences in viability effects between the two cell lines were not the same for all chemicals. The results highlight the vital role of GSH in protecting against oxidative stress-inducing chemicals as well as the importance of probing molecular initiating events in order to identify chemicals with lower potential to cause oxidative stress.
Graphical Abstract
INTRODUCTION
The fourth principle of green chemistry emphasizes the need to mitigate chemical toxicity through rational design.1–4 Computational methods, like property-activity models and design guidelines, provide the framework for a powerful approach for chemical assessment, design, and substitution.5–7 The fundamental principle that informs development of predictive structure-activity and property-activity relationships (SARs and PARs), as highlighted in the Organization for Economic Cooperation and Development (OECD) principles, calls for attributes used to describe chemical space to be directly relevant to toxicological mechanisms, or modes of action (MoA).6,8,9 To that end, it is necessary to explicitly identify key toxicodynamic interactions between a chemical and its potential biological targets prior to any model development. These interactions are termed molecular initiating events (MIE);10–12 they initiate a cascade of key events that instigate one or more adverse outcome pathways (AOP).10,13 Given that classical in vivo testing approaches do not readily provide insights into MoAs, additional in vitro, in silico, and/or in chimico data are required to identify potential AOPs and MIEs.14–16 Relating MIEs to specific chemical properties and reactivity indices, which are preserved across species, can alleviate interspecies’ variations in AOPs; for example, covalent interactions between exogenous Michael acceptors and biological nucleophiles can be related to in silico reactivity parameters that are broadly applicable.6,17,18
Canonically, exposure to electrophilic stressors can upset intracellular redox homeostasis, creating a state of oxidative stress (OS) and initiate apoptosis and/or necrosis in cell lines.19–30 On an organism level, OS contributes to a wide range of adverse outcomes, including liver disease,31–34 neurodegeneration,35–38 cancer,39–45 hypertension,46–48 atherosclerosis,49 ischemia,50 and reperfusion injuries.51 To counter OS, cells have evolved highly conserved defense mechanisms; for example, small antioxidant molecules, such as glutathione (GSH) and inducible antioxidant proteins, act as scavengers for electrophiles that give rise to OS. Both GSH and antioxidant protein induction sensors rely largely on sensory amino acids that are modified by electrophilic chemicals and ROS.30,52–56 In biological systems, GSH in conjugations with glutathione S-transferase (GST) and glutathione peroxidase (GPx) enzymes helps scavenge electrophiles, reduce oxidants, and is a critical contributor to electrophile defense systems.55,57 Diminished GSH levels are associated with decreased resistance to OS and potentially to the formation the oxidation product of GSH, glutathione disulfide (GSSG). GSSG can in turn be either exported from the cell or reduced back to GSH by the action of GSSG reductase. Inducible response to OS is controlled largely by the nuclear factor erythroid 2-like 2 transcription factor (NFE2L2, aka NRF2).52,58 Under oxidative conditions, electrophiles and reactive oxygen species (ROS) activate NRF2-dependent transcription by modifying cysteine residues on KEAP1 (Kelch-like ECH associated protein 1), which prevents the KEAP1-CULLIN-3-dependent ubiquination and subsequent degradation of NRF2.52,59–63 Chemicals that activate NRF2 are generally characterized as being able to (1) permeate through biological membranes; (2) either retain electrophilic activity despite metabolic transformations or become electrophilic via phase I/phase II metabolism; and (3) covalently modify residues on KEAP1 or oxidize KEAP1 thiols to disulfides. Once activated, NRF2 promotes transcription of multiple stress-response genes by recruiting small MAF proteins to associated antioxidant response elements (ARE).52,61,64 The upregulated mRNAs include NAD(P)H-quinone oxidoreductase (Nqo1), catalytic and modifier subunits of glutamate-cysteine ligase (Gclc and Gclm, respectively), and heme oxygenase-1 (Hmox1).65–67 The proteins encoded by the genes are essential for two-electron reduction of quinones, GSH syntheses, and resistance to radical damage (Figure 1).
Figure 1.
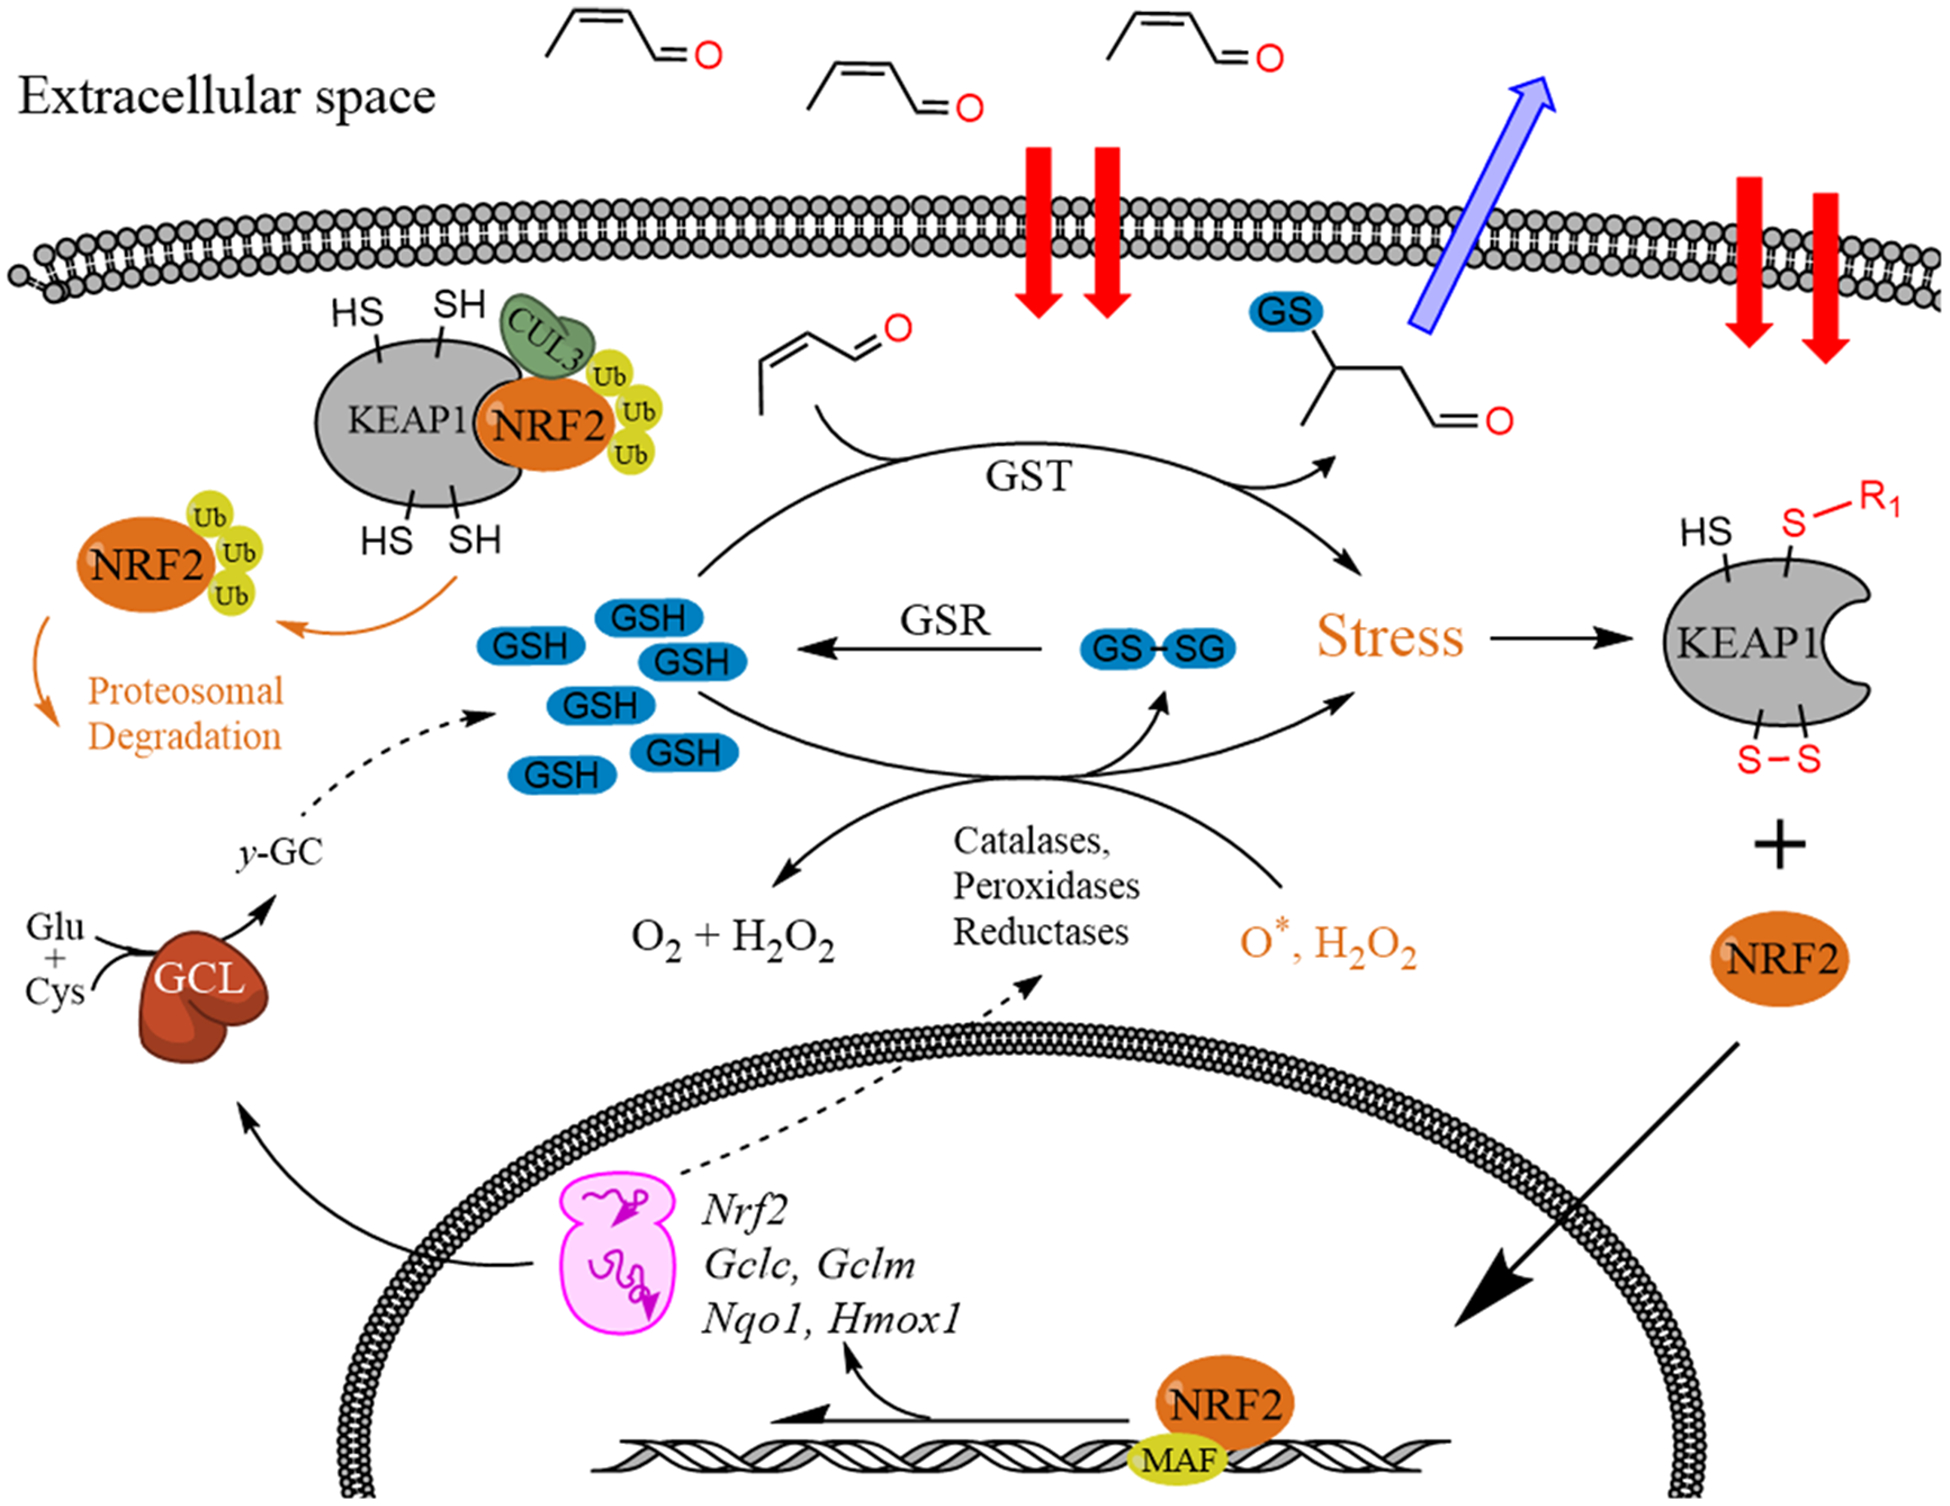
Mechanisms of GSH depletion and antioxidant response through KEAP1 oxidation and NRF2-induced transcriptional response.
While much research has been focused on understanding the biological cascades involved in OS response (Figure 1), mechanistic studies have yet to identify characteristic attributes of chemicals that can be related to their ability to participate in the aforementioned MIEs. Here we report a vertically integrated in vitro–in silico study of seven diverse chemicals suspected to cause OS (bisphenol A (BPA), t-butyl hydroperoxide, t-butyl hydroquinone (tBHQ), cumene hydroperoxide, Dinoseb, hydroquinone (HQ), and perfluorooctanoic acid (PFOA)) that elucidates and relates chemical toxicity to the effects of these chemicals on intracellular GSH, antioxidant gene expression, and in silico measures of reactivity.
METHODS
In these experiments, we assessed the effects of seven model compounds on cell viability, oxidative stress response gene expression, glutathione depletion, and in silico modeling of chemical reactivity. A flowchart of the experiments performed is given in Figure S1.
Experimental Chemicals.
Seven model electrophilic compounds (Figure 2) were selected based on their ability to elicit an OS response as demonstrated from previous animal in vitro and in vivo studies.68
Figure 2.
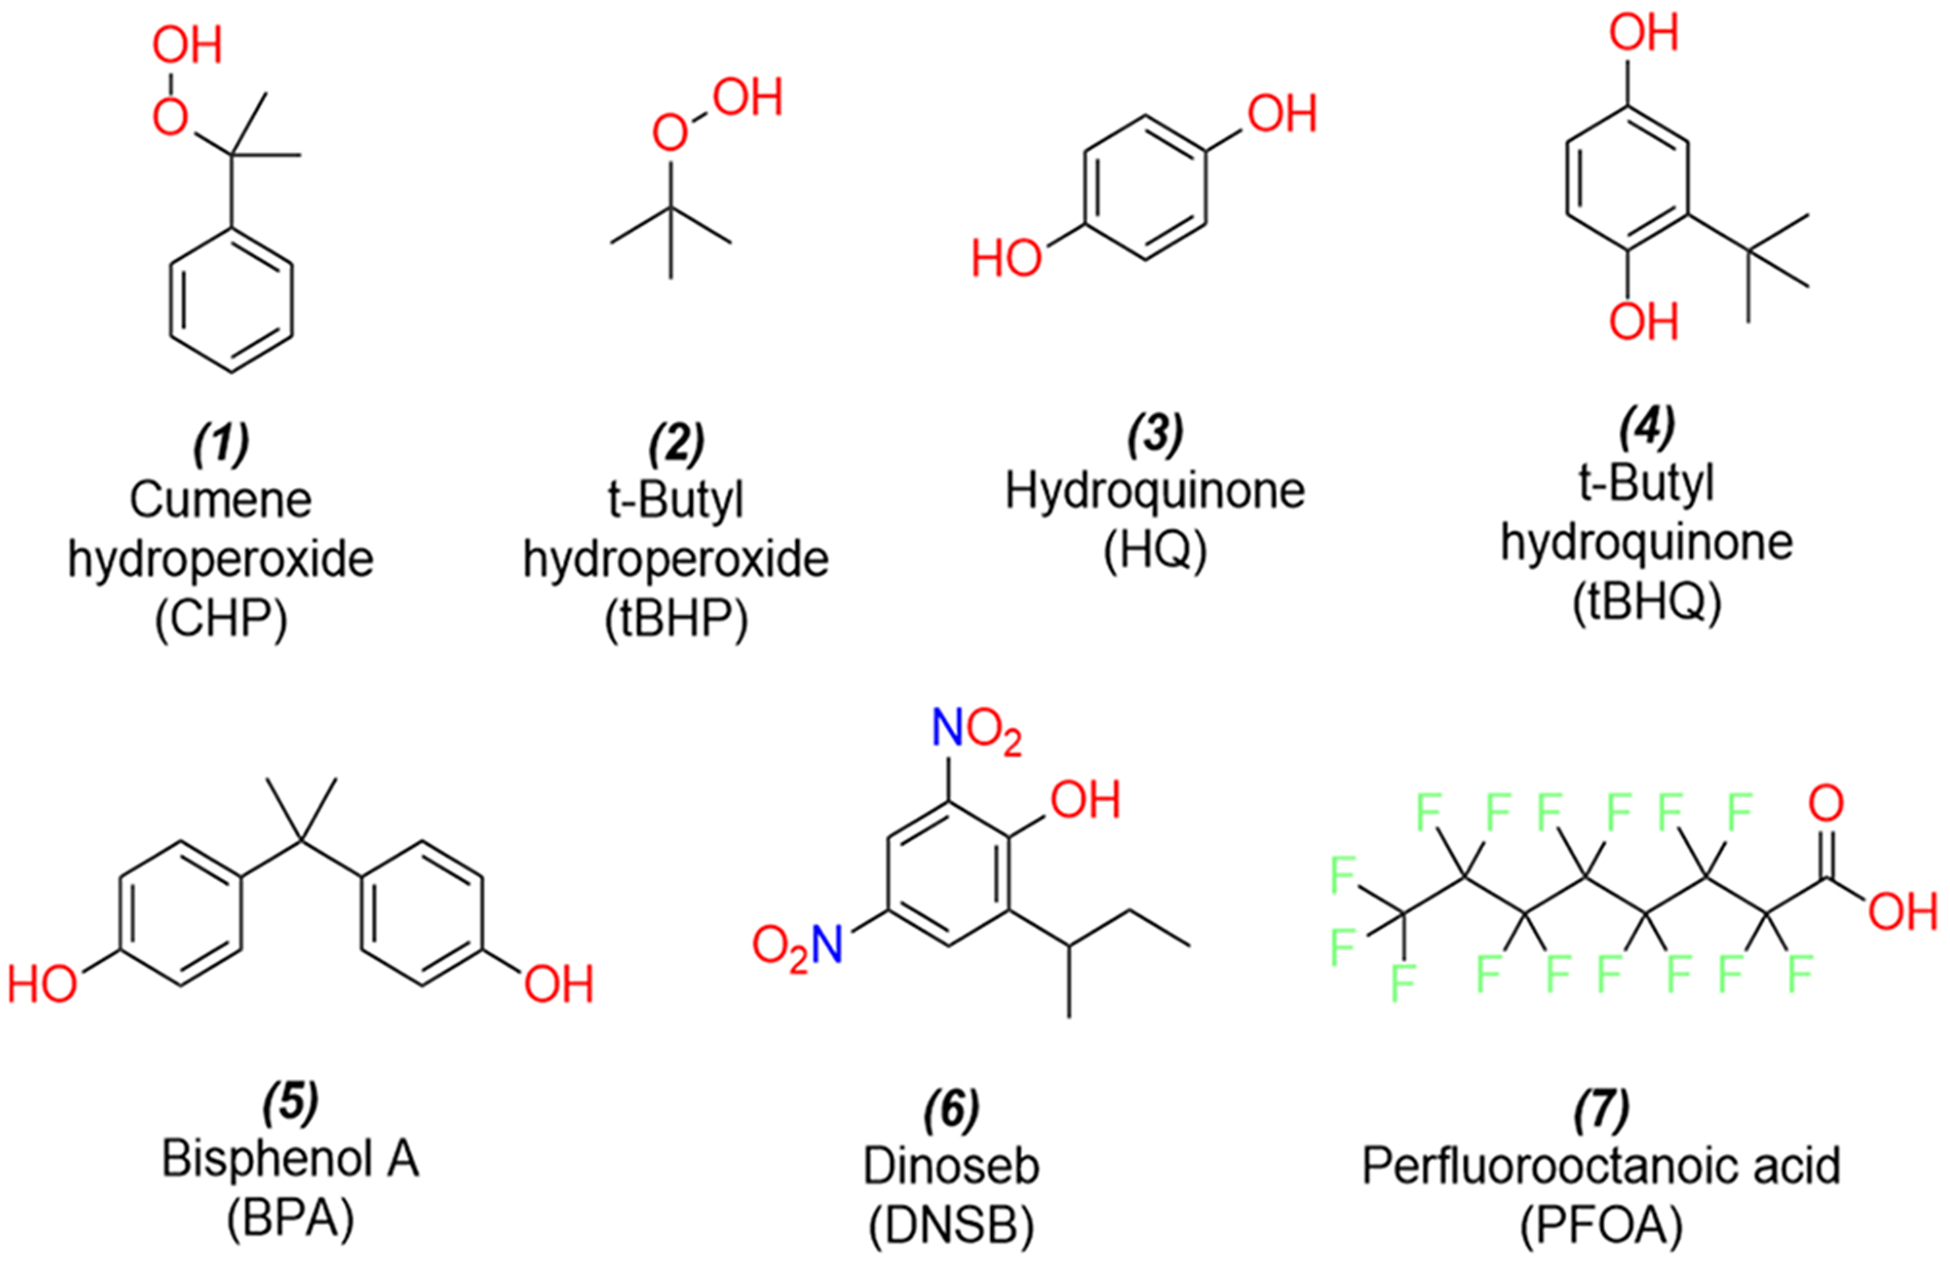
Structures of the seven chemicals that were analyzed in this study.
Cell Cultures.
The cell lines used in these experiments were derived from Hepa-1c1c7 (Hepa-1) cells as previously described.69 CR17 cells (hereafter referred to as CR) are Hepa-1 cells transfected with plasmids designed to enhance the expression of GCLC and GCLM and thus have increased glutamate-cysteine ligase (GCL) activity and GSH content. HepaV cells (hereafter referred to as HV) are Hepa-1 cells transfected with an empty plasmid vector alone and serve as a control with normal GCL expression and GSH levels. For MTT assays, cells were cultured in 96-well tissue culture plates in DMEM/F12 medium with 10% Nu-Serum IV (Corning, Corning NY) supplemented with penicillin (100 IU/mL) and streptomycin (100 μg/mL) at 37 °C in a 5% CO2/95% air humidified atmosphere. For GSH level assays, RT-qPCR analyses of gene expression, and Western immunoblotting, cells were cultured in 6-well tissue culture dishes. Chemical exposures were carried out when cells were at 70–80% confluency, at varying concentrations and for varying periods of time, depending on the experiment (see below).
Cell Viability Monitored by MTT Assay.
After treatments, medium was removed, cells were rinsed with PBS, and 3-(4,5-dimethylthiazol-2-yl)-2,5-diphenyltetrazolium bromide, 250 μg/mL, (MTT) was added to each well. Plates were incubated for 45 min at 37 °C, the solution was removed, and the accumulated formazan chromophore in cells was dissolved by adding 100 μL DMSO to each well. Absorbance was read at 570 nm on a spectrophotometric plate reader (Spectramax 190, Molecular Devices, San Jose, CA). Sublethal concentrations for mRNA and protein expression and GSH analyses were chosen based on the concentration-response curves from MTT assays.
Monitoring Stress-Response Gene Expression by RT-qPCR and Western Immunoblotting.
After chemical treatments, total RNA was extracted from cells using an RNeasy Kit (Qiagen, Valencia, CA). Reverse transcription was performed with Superscript III (Invitrogen, Carlsbad, CA), followed by mRNA expression analysis with TaqMan Real-Time PCR assays (Applied Biosystems, Foster City, CA) on an ABI 7900 analyzer (Applied Biosystems) using primers specific for Gclc, Gclm, Nqo1, and Hmox1 transcripts provided by ThermoFisher (Waltham, MA). Relative levels of mRNA expression were calculated using the ΔΔCt method relative to the expression of β-Actin mRNA. In order to confirm that CR cells have increased GCL expression relative to that of HV cells, Western immunoblots were done for GCLC and GCLM proteins using β-Actin protein to normalize loading. We also assessed the effects of HQ and PFOA treatment on GCLC and GCLM protein expression using slight modifications of standard methods as previously reported.69
Glutathione Depletion Assay.
After treatments, total glutathione levels in cells were analyzed using naphthalene dicarboxaldehyde (NDA) derivatization and spectrofluorometry as previously described.70 Briefly, cells were lysed and sonicated, a portion of the cellular lysate was transferred to microcentrifuge tubes, and proteins were precipitated by sulfosalicylic acid addition and centrifugation. Clarified supernatants were then transferred to black flat bottom 96-well microtiter plates. Triscarboxyethylphosphine (TCEP) was added to reduce any low molecular weight disulfides, and NDA solution was then added to derivatize GSH. The samples were adjusted to pH 12, and fluorescence was assessed (472 nm excitation/528 nm emission) using a fluorometric plate reader (SpectraMax Gemini, Molecular Devices) as previously described.70
Data Normalization and Statistical Analysis.
Gene expression measured by RT-qPCR and GSH concentrations was quantified with a standard curve and then normalized to the β-actin and total protein concentrations, respectively. To maintain approximately normal distributions for significance testing, the normalized values were log transformed, producing relative expression (ΔE) values, as is common in qPCR analysis methodologies. The change in relative expression for a treatment condition (ΔΔE) is calculated by normalizing each (ΔE) to the (ΔE) for control samples analyzed on the same day. ΔΔE estimates were used for all follow-up inference and significance testing. Statistical differences in mRNA expression and GSH levels between treatments were determined with Student’s t test. The p-values were corrected for false-discovery using family wise error rates. MTT readouts were normalized to corresponding negative control and media-only readouts. Concentration-response curves (CRCs) were fit and absolute concentrations predicting 50% loss of viability (half maximal activity, designated as AC50) were estimated from the CRCs.71 The relationship between end points was investigated with hierarchical clustering using correlation-based distances and Ward’s partitioning method. Cluster stability was evaluated with bootstrap. All analyses were performed in the R statistical environment.72 Multivariate differences in chemical-induced responses across time points or cell lines were assessed using multivariate analysis of variance (MANOVA) with Pillai’s trace statistic that is most appropriate for small samples.73 The MANOVA analysis was performed with base R functions.
Computational Methods.
The energetics of chemical mechanisms contributing to the biological effects of peroxides (chemicals 1 and 2) and hydroquinones (chemicals 3 and 4) were investigated computationally. For peroxides, the O–O bond cleavage is thought to represent the frequent MIE that yields the corresponding tertiary alcohol, which can either undergo β-scission to generate a reactive aromatic ketone in the case of cumene hydroperoxide or enzymatic dehydration to an alkene, which can be subsequently be oxidized by cytochrome P450s or other monooxygenases (e.g., flavin monooxygenases) to a reactive epoxide (Figure 3).74 In this study, O–O bond dissociation energies were computed at the M06-HF/6–31+G(d) level of theory. The M06-HF functional is a special case of hybrid meta GGA with full Hartree-Fock exchange term that is well-suited to handle systems where self-interaction is pathological, for example, delocalized systems with odd number of electrons. The kinetics of 1,1-dimethyl- vs 1-methyl,1-phenyl-substituted epoxides (9 and 8, Figure 3) with methyl thiolate as a model soft nucleophile were briefly considered using the PDDG/PM3 semiempirical method. This method has shown to yield reasonably accurate energetics for oxiranes-opening reactions at low computational cost.75 Free energy barriers were calculated using transition states optimized with the Berny algorithm; all transition structures were verified to have only one negative eigenvalue in their diagonalized force-constant matrices, and their associated eigenvectors were confirmed to correspond to motion along the reaction coordinate.
Figure 3.
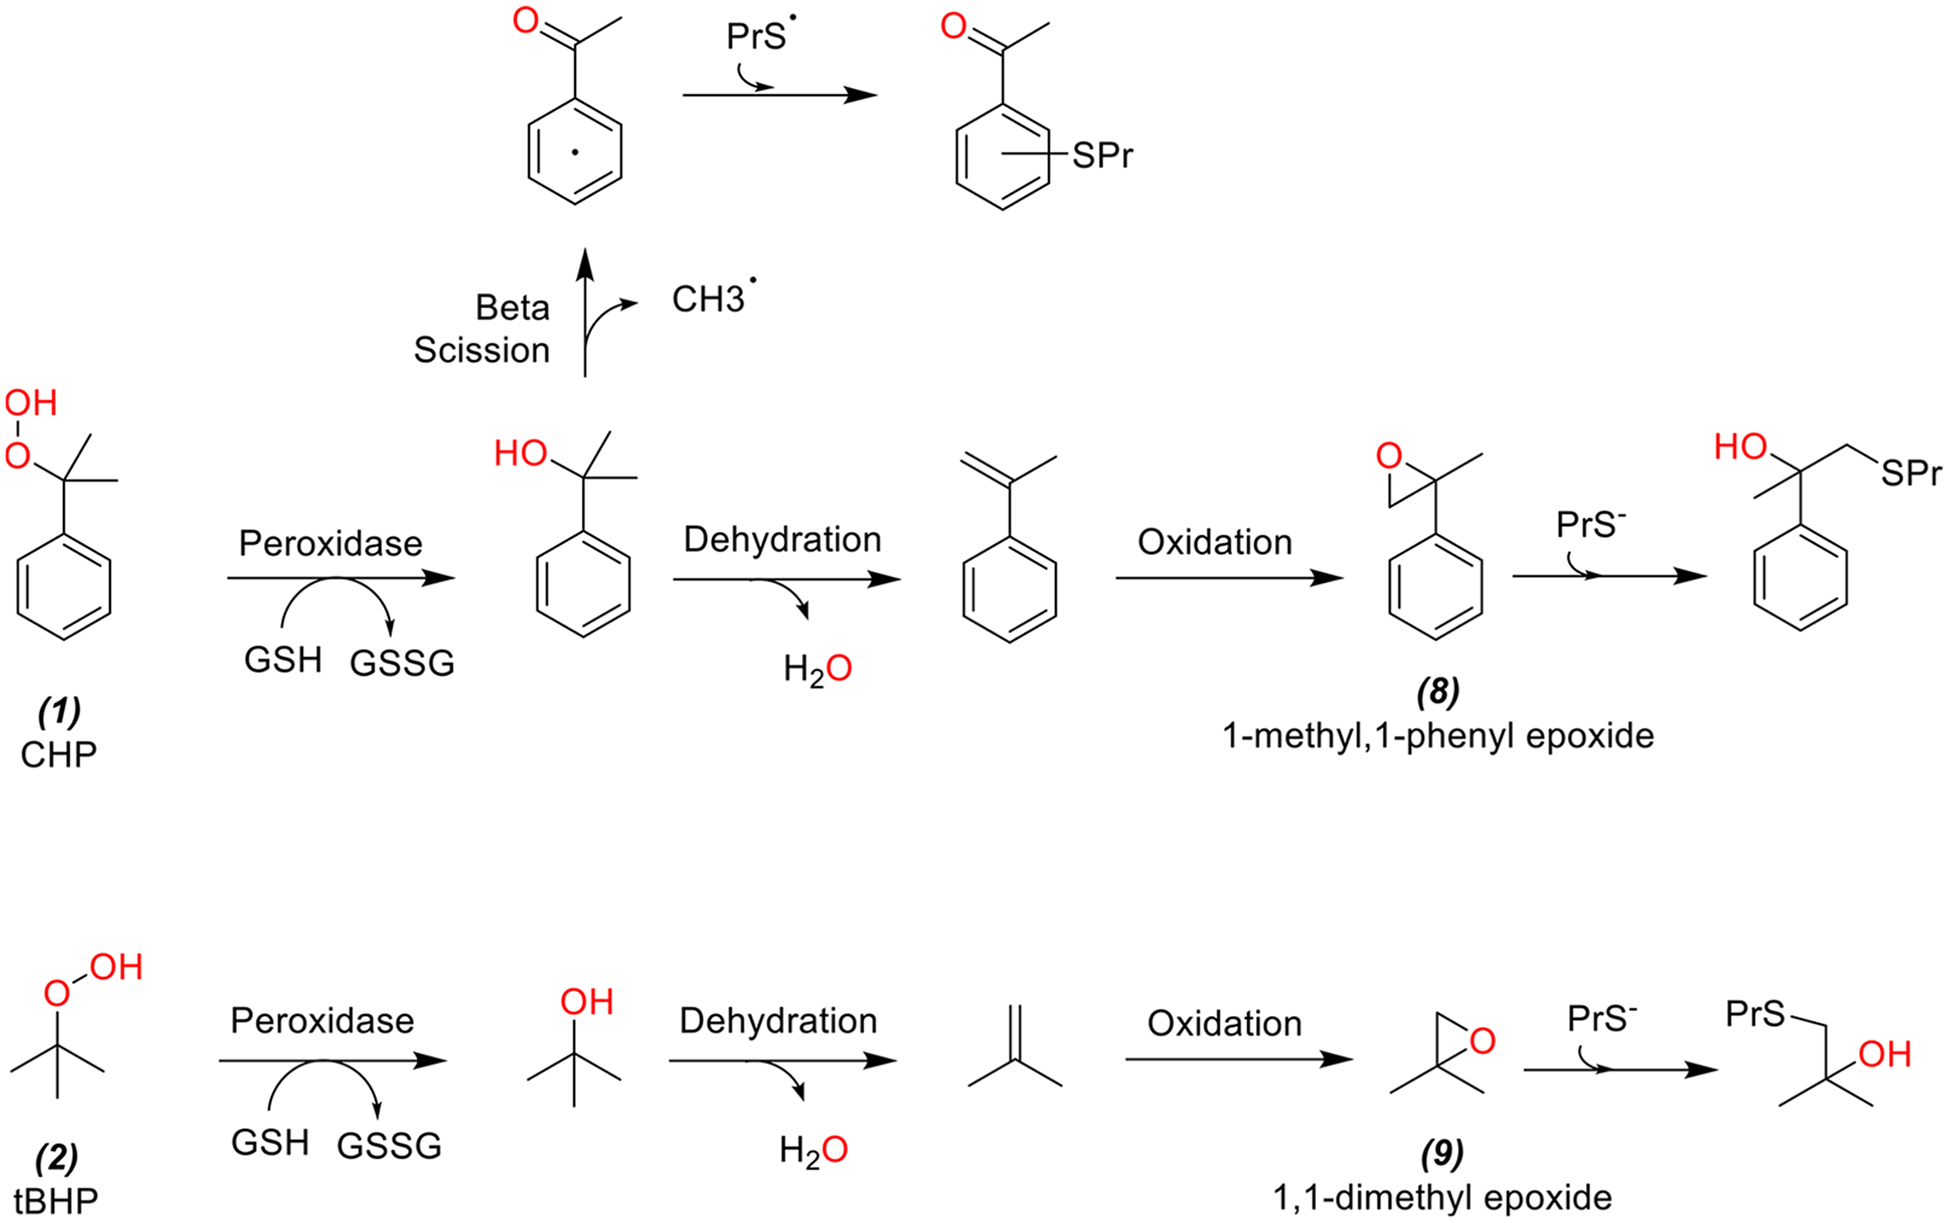
Peroxide cleavage yields the corresponding tertiary alcohol, which can either undergo enzymatic dehydration to an alkene and subsequently be oxidized by cytochrome P450 to reactive epoxides (8 and 9).
For hydroquinones, the molecular mechanisms considered were (1) reaction between GSH and semiquinone radicals and (2) enzymatic and nonenzymatic redox cycling (Figure 4). Free energies of conjugation between GSH and phenoxy radicals for HQ vs tBHQ were contrasted with M06-HF/6–31+G(d); supporting frontier molecular orbital energy calculations were carried out using the mPW1PW91 density functional with the MIDIX+ basis set. In order to gauge electrostatics of enzyme-ligand interactions in cytochrome P450 oxidoreductase (POR)-assisted redox cycling,76 the binding poses of tert-butylbenzoquinone (tBQ) and unsubstituted 1,4-benzoquinone (BQ) were evaluated using Autodock Vina.77 Binding affinities were computed using the AMBER force field based on the 5URD X-ray structure of POR.
Figure 4.
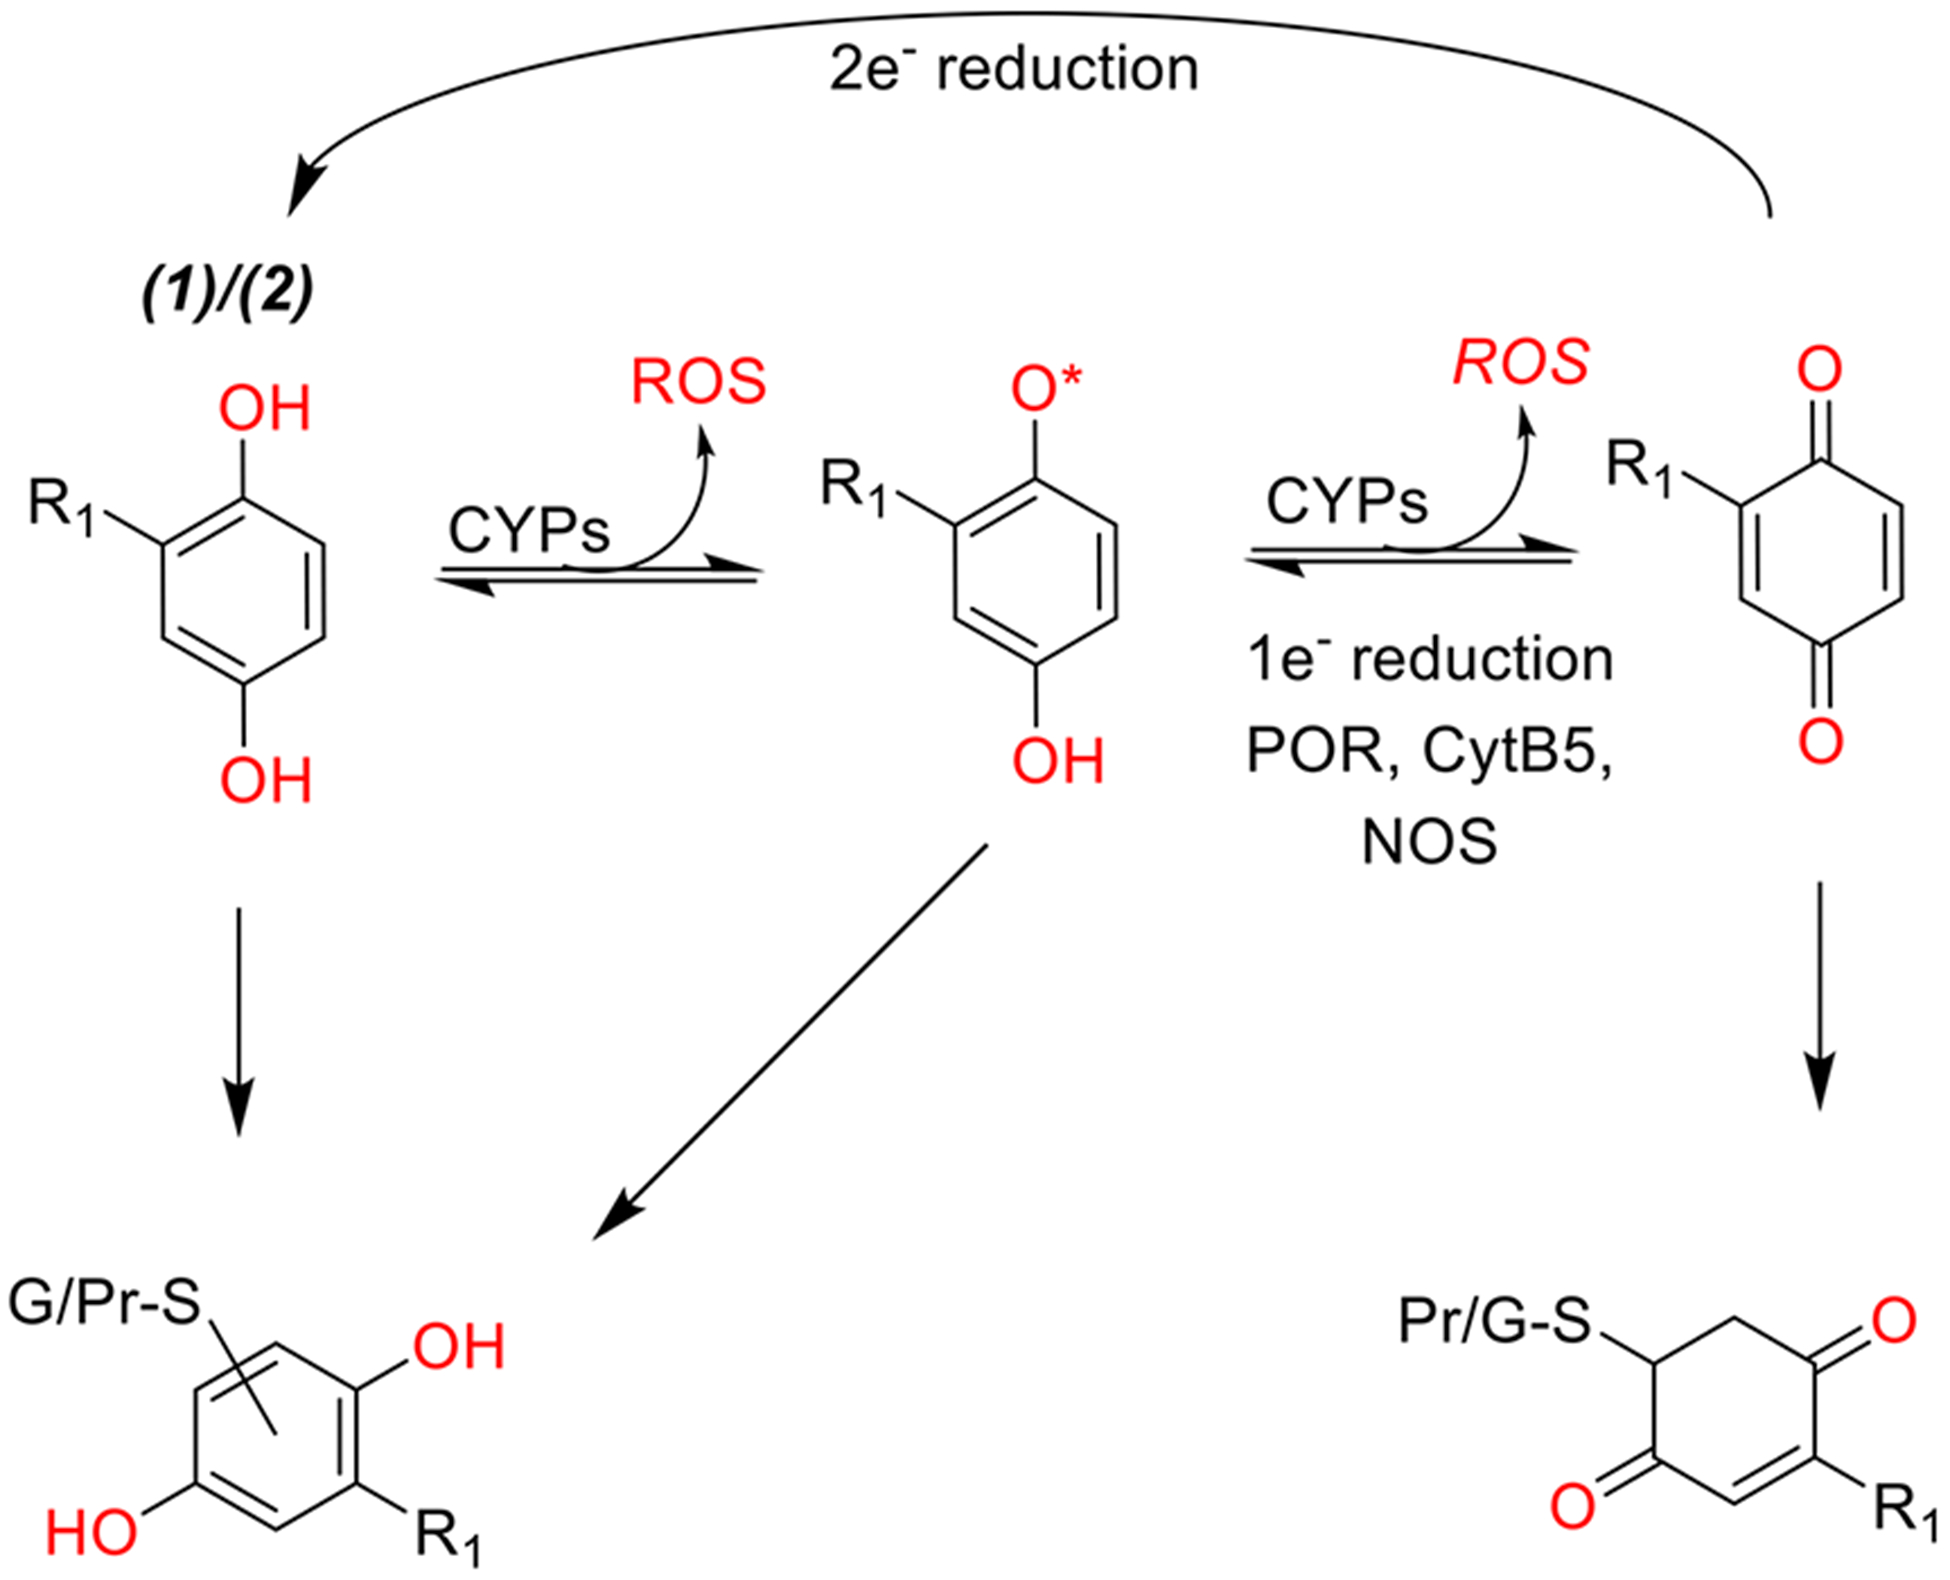
Schematic representational of hydroquinone mechanisms of toxicity and detoxification. R1 group represents a hydrogen or a tert-butyl group for HQ (3) and tBHQ (4), respectively. Hydroquinones can be oxidized to quinones by one electron processes producing reactive oxygen species. The process can continue indefinitely if quinones are reduced back to semiquinones or hydroquinones by cellular enzymes leading to redox cycling. Alternatively, hydroquinones and their metabolites can be conjugated with GSH and exported. However, the same electrophilic properties that allow hydroquinones to react with GSH can lead to formation of covalent protein adducts.
In all ground-state electronic structure calculations, geometries were fully optimized, and all minima were verified to have no imaginary vibrational frequencies. Enthalpies and free energies were evaluated in gas phase at 298 K, including changes in vibrational energy. Calculations were performed using Gaussian g09 software.78
RESULTS
The effects of the seven chemicals tested on cell viability, GSH levels, and changes in the expression of Gclc, Gclm, Hmox1, and Nqo1 mRNAs were evaluated in the two Hepa-1 derived liver cell lines. Gclm and Gclc transfected CR cells have increased glutamate-cysteine ligase (GCL) activity and thus enhanced GSH synthesis compared to the standard HV cells.69 We confirmed that CR cells have increased GCLC and GCLM mRNA (below) and protein expression relative to that of HV cells (Figure S2). The assays performed on the test chemical set (Figure 2) are summarized in Table 1. Antioxidant gene expression for Gclc, Glcm, Hmox1, and Nqo1 mRNAs was measured by RT-qPCR for all chemicals at 24 h. The mRNA-induction effects of peroxides and hydroquinones (chemicals 1–4) were also measured at 6 h. Similarly, GSH assays were performed for all chemicals at 24 h and for select chemicals at 6 h. The MTT cell viability assay (based on the activity of mitochondrial dehydrogenases) was performed for all chemicals.
Table 1.
Summary of assays on chemicals depicted in Figure 2
| assay | end point | time (h) | chemical screened |
|---|---|---|---|
| mRNA expression as measured by RT-qPCR | Gclc | 6 | 1–4 |
| Gclc | 24 | 1–7 | |
| Glcm | 6 | 1–4 | |
| Gclm | 24 | 1–7 | |
| Hmox | 6 | 1–4 | |
| Hmox | 24 | 1–7 | |
| Nqol | 6 | 1–4 | |
| Nqol | 24 | 1–7 | |
| GSH depletion assay | nmol GSH/mg protein | 6 | 1–6 |
| 24 | 1–7 | ||
| MTT cell viability assay | AC50 | 24 | 1–7 |
| slopea | 24 | 1–7 |
The slope of concentration-response curve derived from four parameter log-logistic model;132 higher values indicate rapid change in viability in response to concentration increase.
Cell Viability.
All seven chemicals showed dose-dependent changes in cell viability in both control HV cells and CR cells (Figure 5), with large concentration-response differences between the cell lines’ chemical viability thresholds (as defined by their AC50) summarized in Table 2. In order from lowest to highest AC50, the chemicals conformed to the following trend: 6 > 4 > 5 > 7 > 3 > 1 > 2 (Figure 6). The trend was identical in both cell lines (rank correlation = 1). Overall, CR cells were more resistant to adverse effects on viability, as indicated by higher AC50 values. If we define ΔAC50 as the difference of MTT AC50 between the HV cell line and the CR cell line, the ΔAC50 observed for each chemical from highest to lowest follows the trend: 2 > 3 > 1 = 4 > 5 > 7 > 6 (Figure 7). This trend is generally consistent with the more potent chemicals (smallest AC50) exhibiting larger differences in AC50 between the two cell lines.
Figure 5.
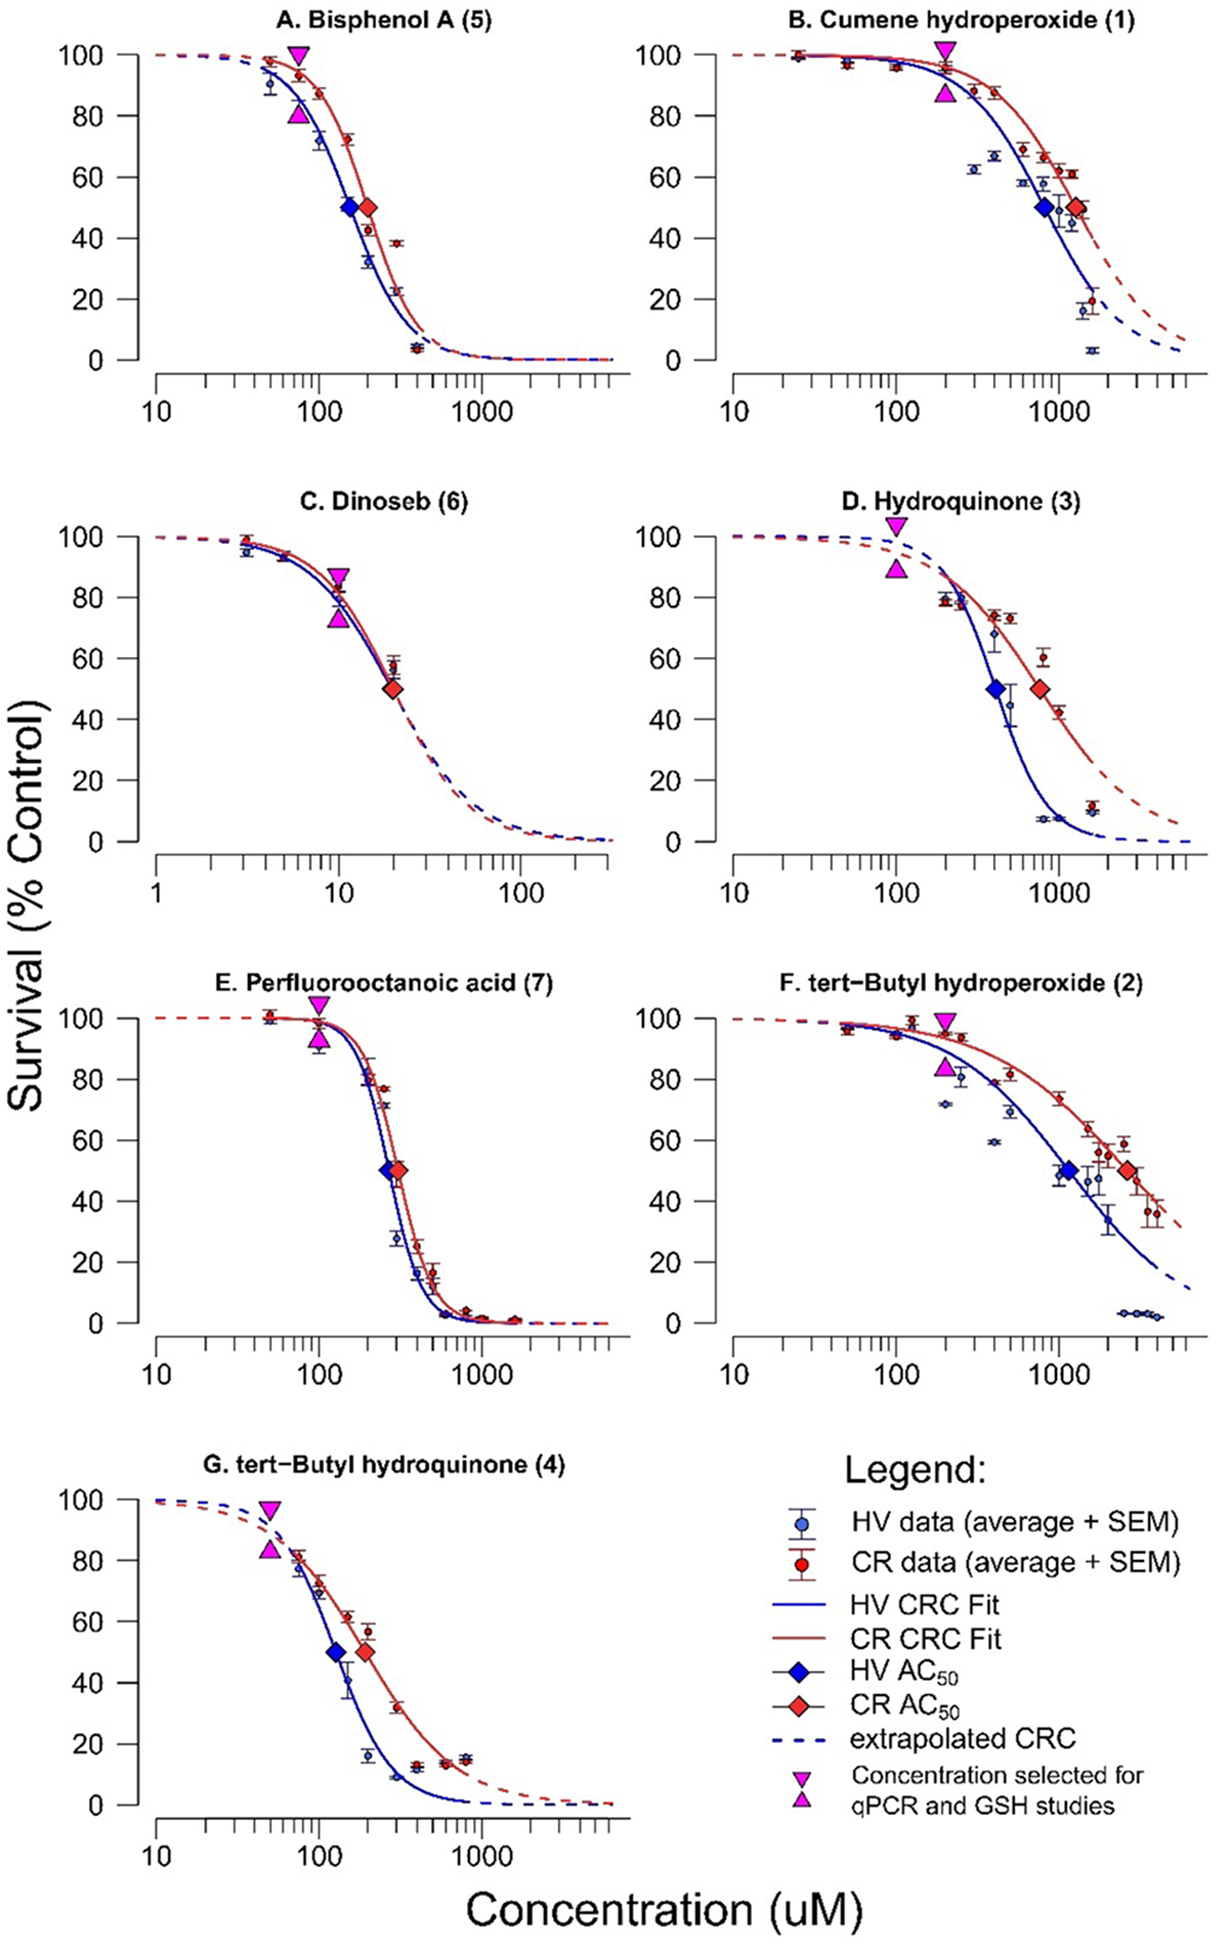
Concentration response curves for HV and CR cells exposed to (A) BPA, (B) CHP, (C) DNSB, (D) HQ, (E) PFOA, (F) tBHP, and (G) tBHQ. Note that the X-axis scale is consistent for all chemical except dinoseb (6) due to its high potency. Error bars indicate standard error of the mean.
Table 2.
Effects of Seven Chemical Exposures on Cell Viability in HV (Control) and CR (GCL Transgenic) Cell Lines (Dose-Response Curves in Figure 5)
| AC50 (μM) | |||
|---|---|---|---|
| chemical name (ID) | CR | HV | |
| dinoseb (6) | 20 | 19 | 0.95 |
| tert-butylhydroquinone (4) | 191 | 126 | 0.66 |
| bisphenol A (5) | 200 | 155 | 0.78 |
| perfluorooctanoic acid (7) | 309 | 269 | 0.87 |
| hydroquinone (3) | 759 | 407 | 0.54 |
| cumene hydroperoxide (1) | 1259 | 813 | 0.65 |
| tert-butyl hydroperoxide (2) | 2630 | 1148 | 0.44 |
Figure 6.

Seven chemicals and their structures in order of AC50 estimates from the MTT assay, from most to least potent.
Figure 7.

Seven analyzed chemicals and their structures in order of decreasing differences in AC50 between HV and CR cell lines. Largest AC50 differences correspond to smallest ΔAC50 ratio values (see Table 2 for details).
Antioxidant Gene mRNA Expression.
The mRNA expression for Nqo1, Hmox1, Gclc, and Gclm was assessed by RT-qPCR in response to sublethal chemical exposure (40% of LC50). Twenty-4 h after exposure to chemicals 1, 3, 4, and 6, significant upregulation was observed in Nqo1, Hmox1, and Gclm in both cell lines (Figure 8). In addition, Nqo1 expression was upregulated 24 h after exposure to BPA (5), but only for HV cells (Figure 8A). Chemicals 1, 3, and 4 induced Gclc expression in the HV cell line only. Dinoseb (6) was the only chemical to significantly upregulate Gclc in both cell lines (Figure 8C). GCLC and GCLM protein expression was greater in CR cells than HV cells when treated with vehicle only, and HQ treatment increased GCLM protein expression in HV cells (Figure S2). There was also a correlation between Gclc and Gclm mRNA expression and their respective protein levels among control, HQ, and PFOA treatments in both HV and CR cell lines (Figure S3). While there were also correlations between GSH content and GCLC and GCLM protein levels, especially in the case of HV cells and GCLC protein expression (R2 = 0.87; Figure S4A), there are many other factors that determine GSH content in addition to GCL expression and activity, including cysteine/cystine import, GSH synthetase levels, GSSG reductase activity, GSH and GSSG export pumps, and other factors associated with oxidative stress and GSH conjugation reactions.91
Figure 8.
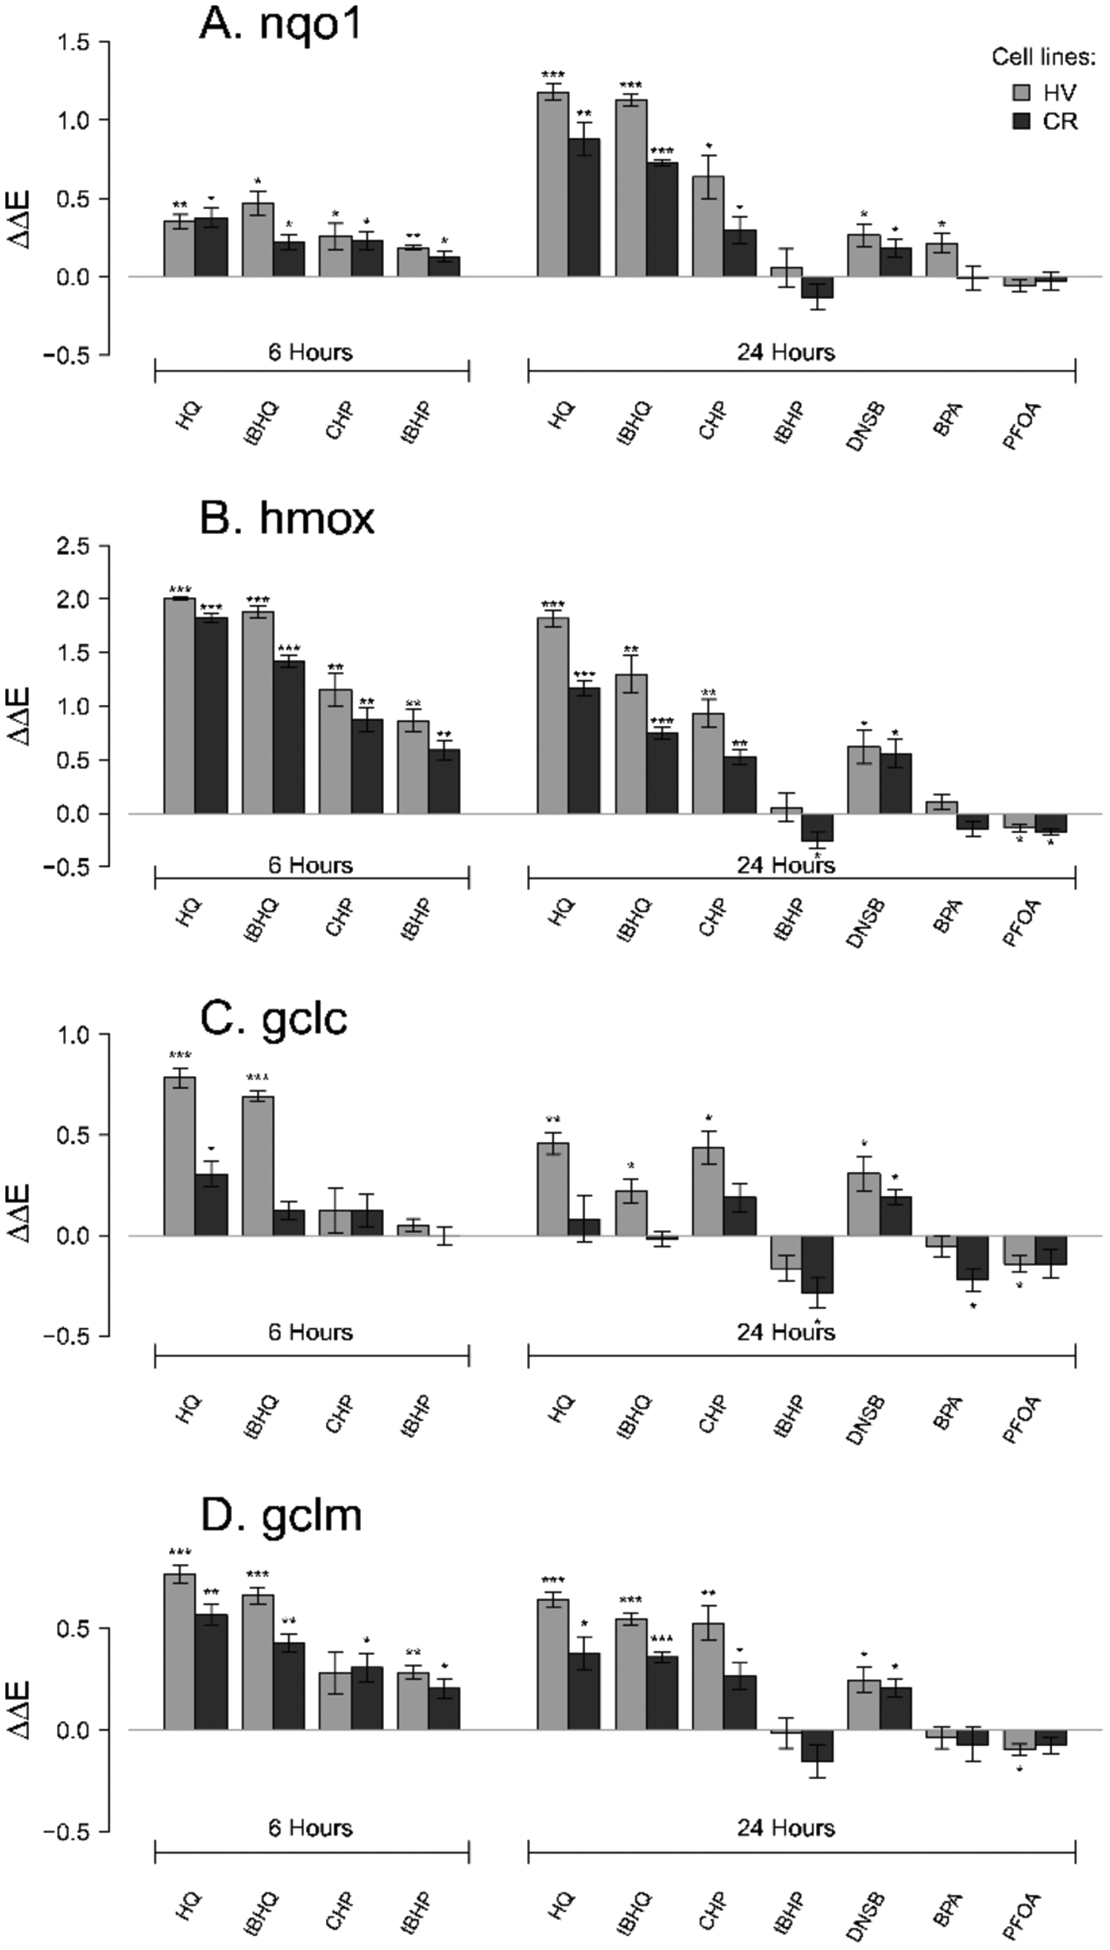
Antioxidant mRNA expression 6 or 24 h after HV or CR HeLa cell cultures were treated with 100 μM HQ, 50 μM tBHQ, 200 μM CHP, 200 μM tBHP, 10 μM DNSB 75 μM, BPA, or 100 μM PFOA. Asterisks denote significant difference from control at the following levels: * p < 0.05, ** p < 0.01, *** p < 0.001. Chemical effects on mRNA expression of four genes were measured for (A) Nqo1, (B) Hmox, (C) Gclc, (D) Gclm. ΔΔE is the log-scale fold change from negative control.
The four chemicals tested at 6 h (1–4) showed upregulation of Nqo1, Hmox1, and Gclm mRNA expression compared to vehicle-treated controls. With the exception of induction of Gclm in the CR line by CHP (1), the upregulation of genes by the test chemicals relative to controls was statistically significant (p < 0.05) (Figure 8A,B,D). In contrast, all chemicals except for the two hydroquinones (3 and 4) failed to significantly upregulate Gclc expression (Figure 8C).
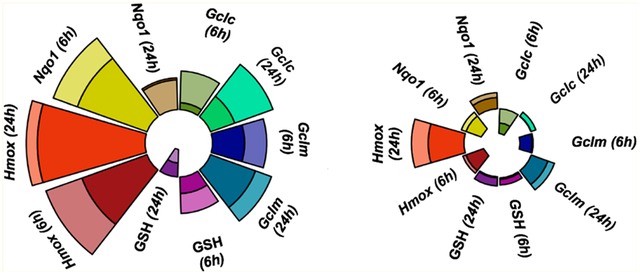
Modified ToxPi charts79 visually summarize the expression profiles for each chemical (Figure 9) and demonstrated that, in concordance with the statistical results, CHP (1) and hydroquinones (3 and 4) exhibited the most drastic effects, while PFOA (7) and BPA (5) had minor effects on antioxidant gene mRNA expression. MANOVA analysis was used to quantify the differences in chemical effects on the relative antioxidant gene mRNA expression between the HV and the CR cells and showed that mRNA expression profiles differed significantly for 3 (p = 0.0005), 4 (p = 0.023), and 5 (p = 0.028) (Table S1). Specifically, HQ-induced Gclc (6 h) and Hmox1 (6 and 24 h) mRNA levels were significantly higher in the HV cells, as were tBHQ-induced Gclc (6 h), Gclm and Hmox1 (6 and 24 h), and Nqo1 (24 h) mRNA levels (Table S2). In contrast, PFOA (7) and dinoseb (6) induced a similar mRNA expression in the two cell lines, with Pillai’s trace <0.3 (Table S2).
Figure 9.
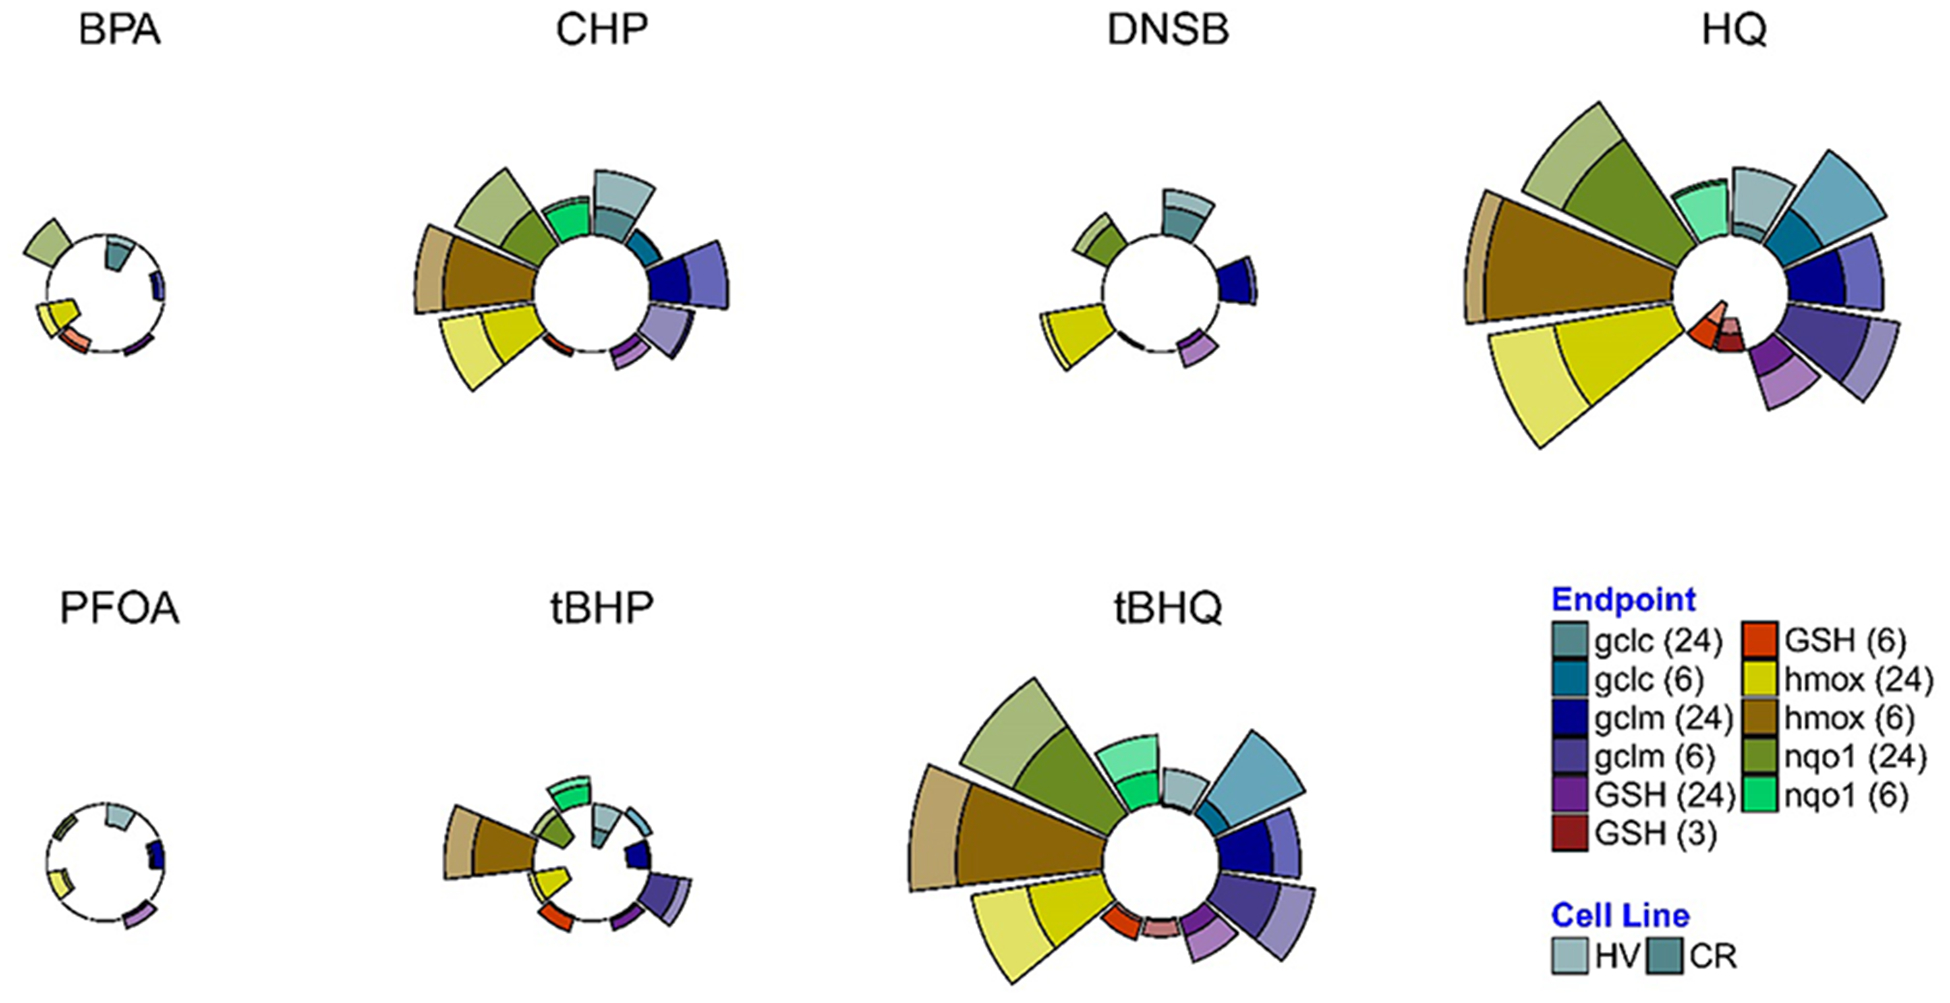
Antioxidant mRNA expression profiles expressed as radial plots. Radial plot end points show relative mRNA expression (normalized to highest ΔΔE) at 6 or 24 h in HV or CR HeLa cell cultures on the same plot.
Temporal Changes in Antioxidant Gene mRNA Expression.
We further investigated the changes in antioxidant gene mRNA expression over time for compounds 1–4 with MANOVA Pillai’s trace for significance. Gclc mRNA response to chemicals 1–4 in the HV cell line decreases significantly from 6 to 24 h (p = 0.036). Similarly, Gclm and Hmox1 mRNA induction decreased significantly from 6 to 24 h in the CR cell line (p = 0.046 and 0.006). In contrast, Nqo1 mRNA expression increased significantly (p = 0.002) from 6 to 24 h for both cell lines after exposure to all seven chemicals (Table S3). The pattern can be attributed to HQ and tBHQ, as these chemicals significantly increased Nqo1 induction from 6 to 24 h (based on two-sample t tests, Table S4).
Glutathione Levels.
HQ and tBHQ had significant effects on GSH levels at 6 h (Figure 10). At 40% of the LC50, HQ decreased GSH levels in both HV and CR cell lines (p = 0.068 and 0.040, respectively), while tBHQ upregulated GSH levels in the CR cell line at 6 h (p = 0.009). Twenty-4 h after HQ and tBHQ treatment, the intracellular GSH levels were increased in both CR and HV cell lines (Figure 10).
Figure 10.
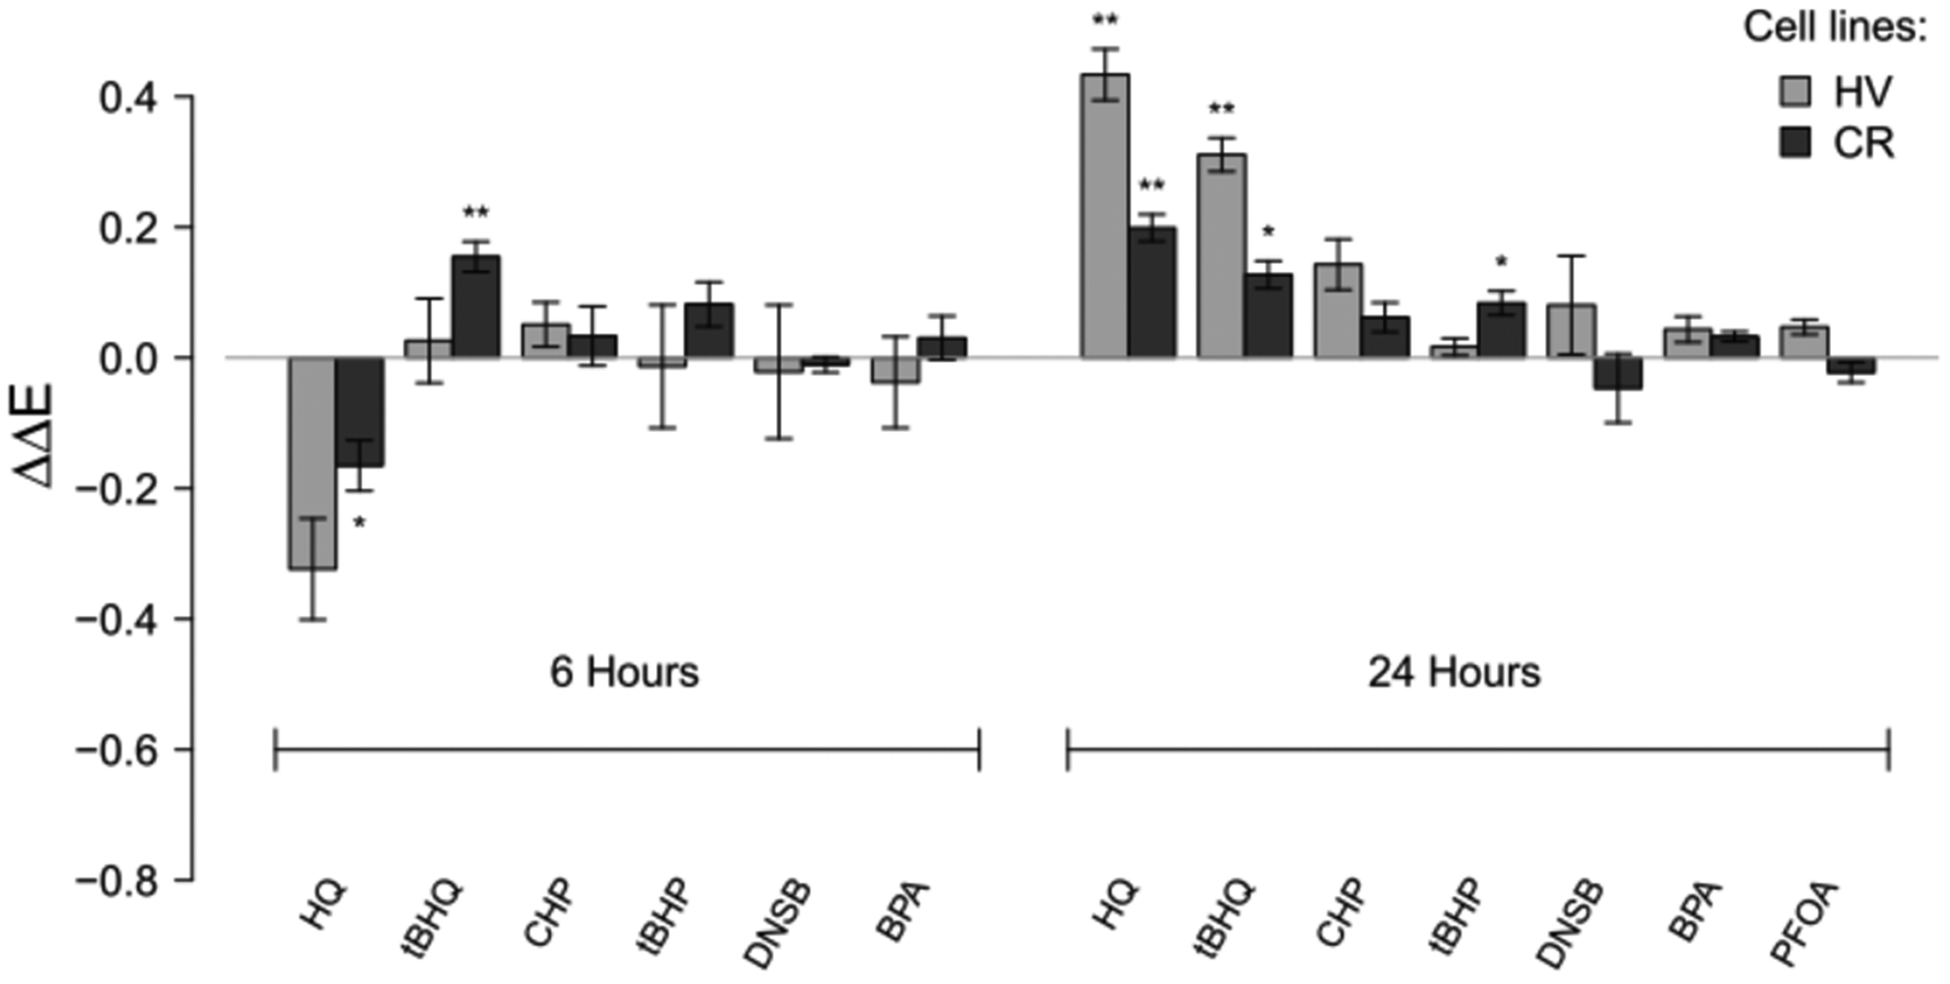
Relative changes in GSH levels at 6 or 24 h after HV or CR cell cultures were treated with 100 μM HQ, 50 μM tBHQ, 200 μM CHP, 200 μM tBHP, 10 μM DNSB 75 μM, BPA, or 100 μM PFOA. Asterisks denote significant difference from control at the following levels: * p < 0.05, ** p < 0.01, *** p < 0.001. ΔΔE is the log-scale fold change from control normalized to total protein content.
Given the observed dependence between GSH and antioxidant gene induction, we further investigated the effect of Gclm mRNA expression on the difference in intracellular GSH concentration from 6 to 24 h. Figure 11 shows the approximately quadratic relationship between Gclm mRNA induction at 6 h and differences in GSH expression over time. Chemicals that upregulated Gclm mRNA at 6 h above 3-fold also upregulated intracellular GSH at 24 h, regardless of the cell line. An induction GCLC and GCLM proteins in HV cells following treatment with PFOA and HQ (Figure S2) was associated with higher GSH levels in HV cells (R2 = 0.87 for GCLC; R2 = 0.28 for GCLM), but this association was weaker in CR cells (R2 = 0.24 for GCLC; R2 = 0.07 for GCLM).
Figure 11.
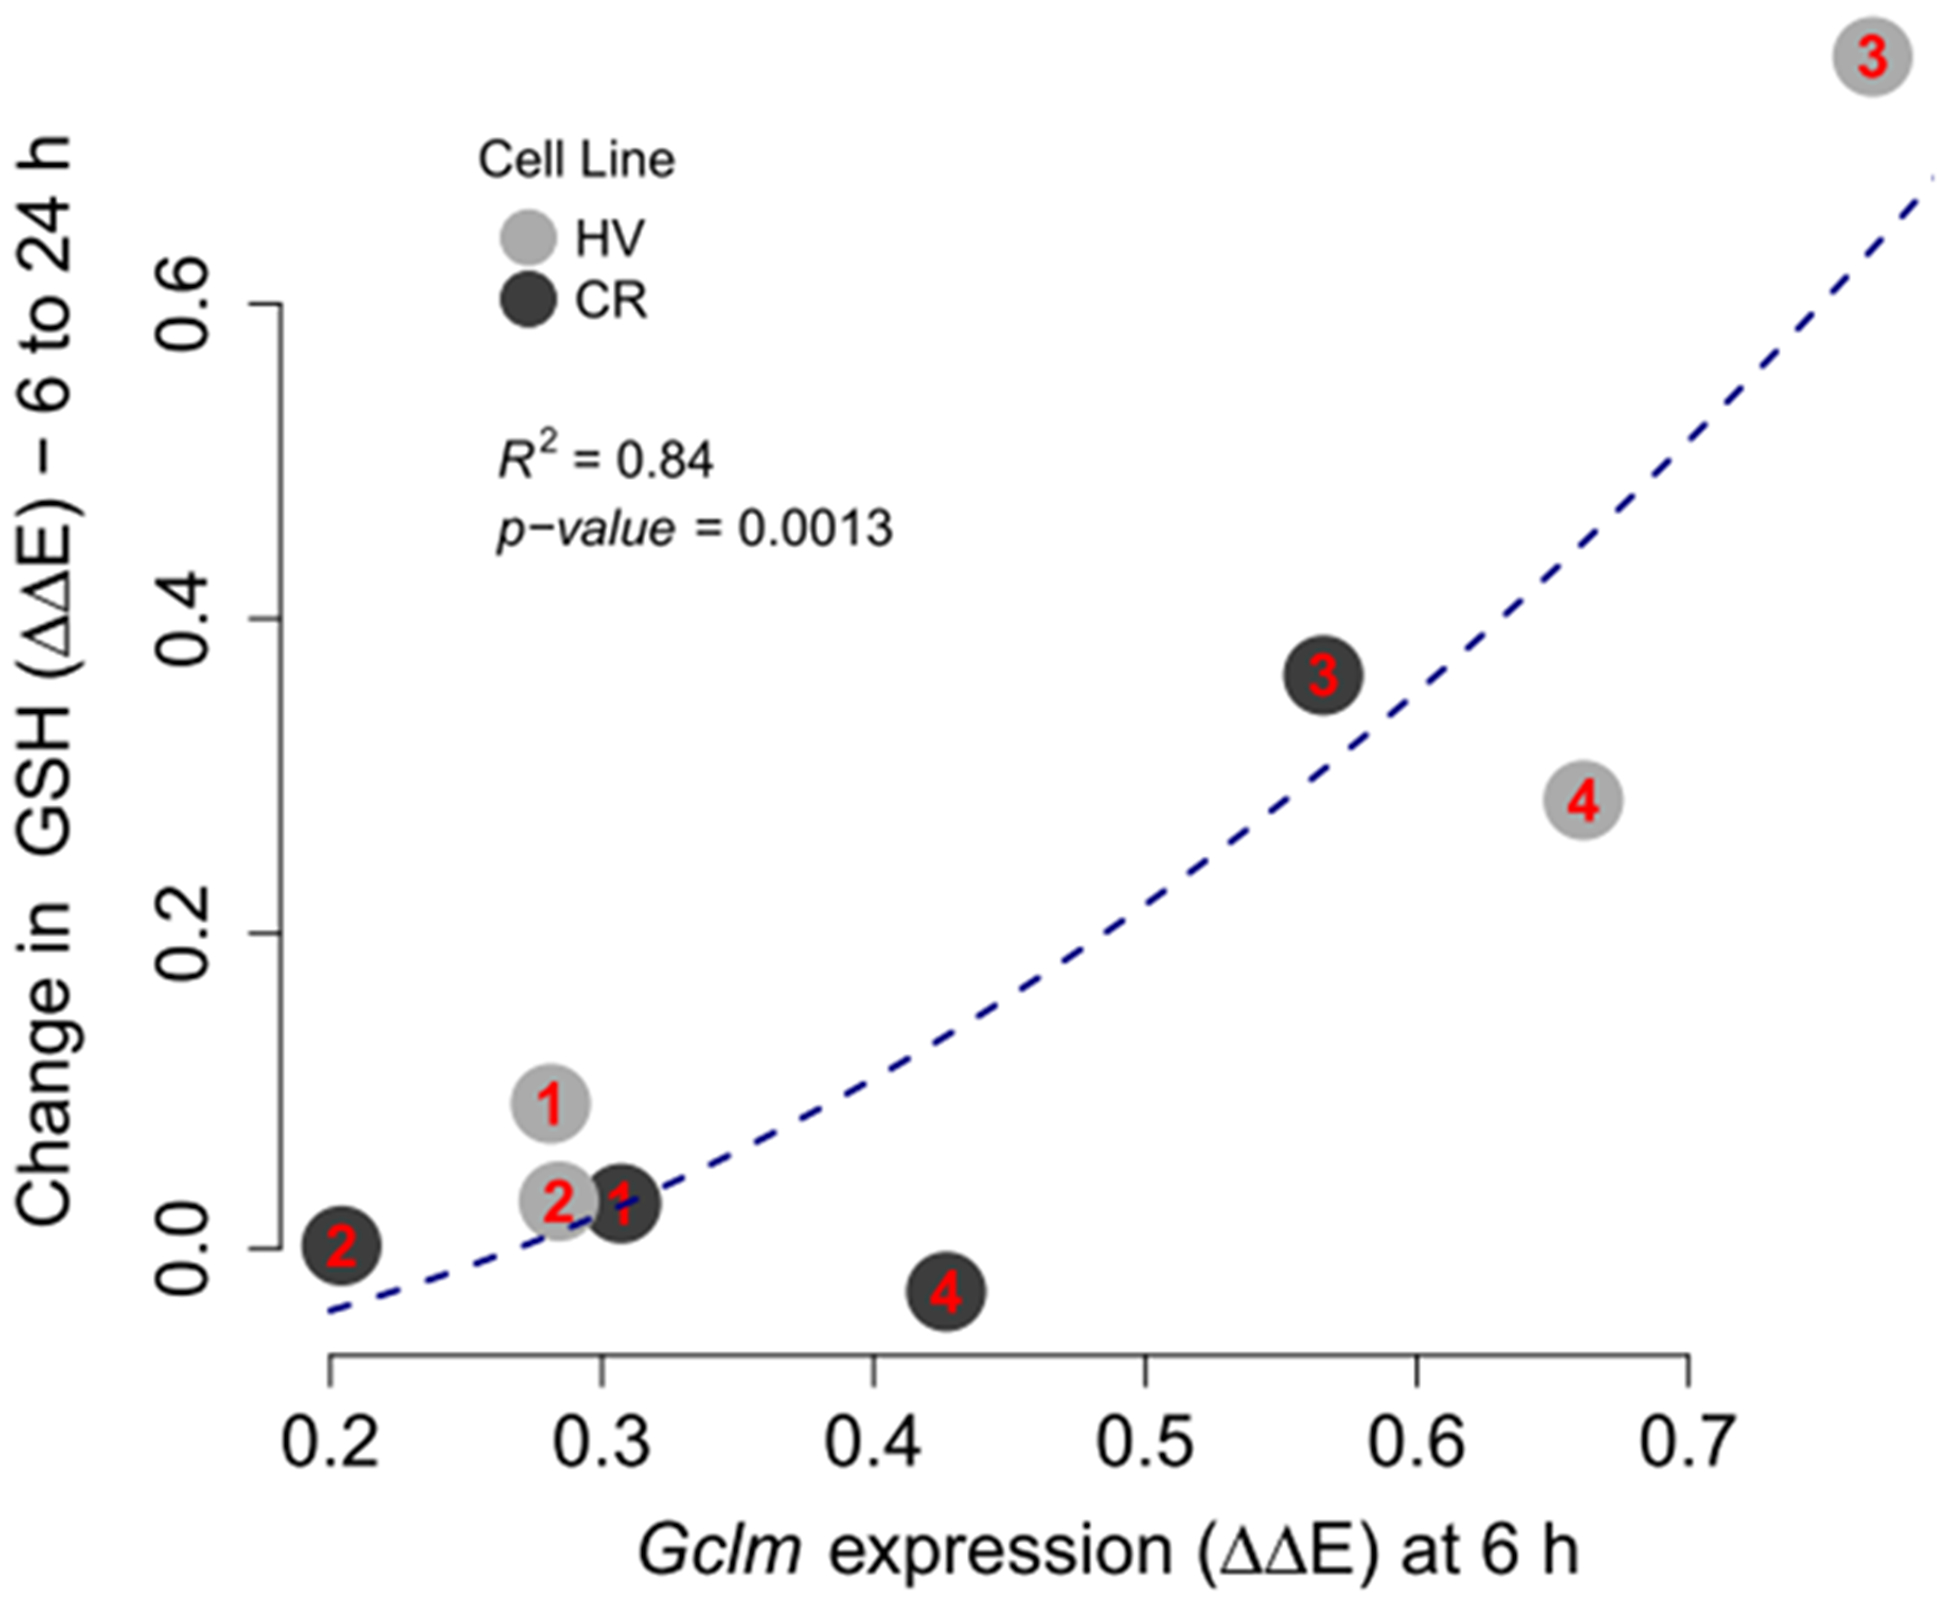
Change in chemically induced GSH levels from 6 to 24 h vs Gclm mRNA expression at 6 h for chemicals 1–4, labeled according to the plot, across HV and CR cell lines. Observations on the plot are presented as numbers that correspond to chemical IDs. ΔΔE is the log-scale fold change from control normalized negative controls. P-value for a single predictor model indicates that Gclm expression squared is a significant predictor of the change in GSH expression.
Intracellular Glutathione and viability.
Next, we investigated the relationship between the chemicals’ effects on intracellular GSH and the associated differences in cytotoxicity between HV and CR cell lines. Overall, the difference in cytotoxicity between cell lines is inversely correlated with GSH levels in the CR cell line at 24 h (Figure 12). Peroxides, particularly low-molecular weight tBHP (2) behave as an outlier, likely due to rapid metabolism80 and decreased antioxidant effects at 24 h (Table S4).
Figure 12.
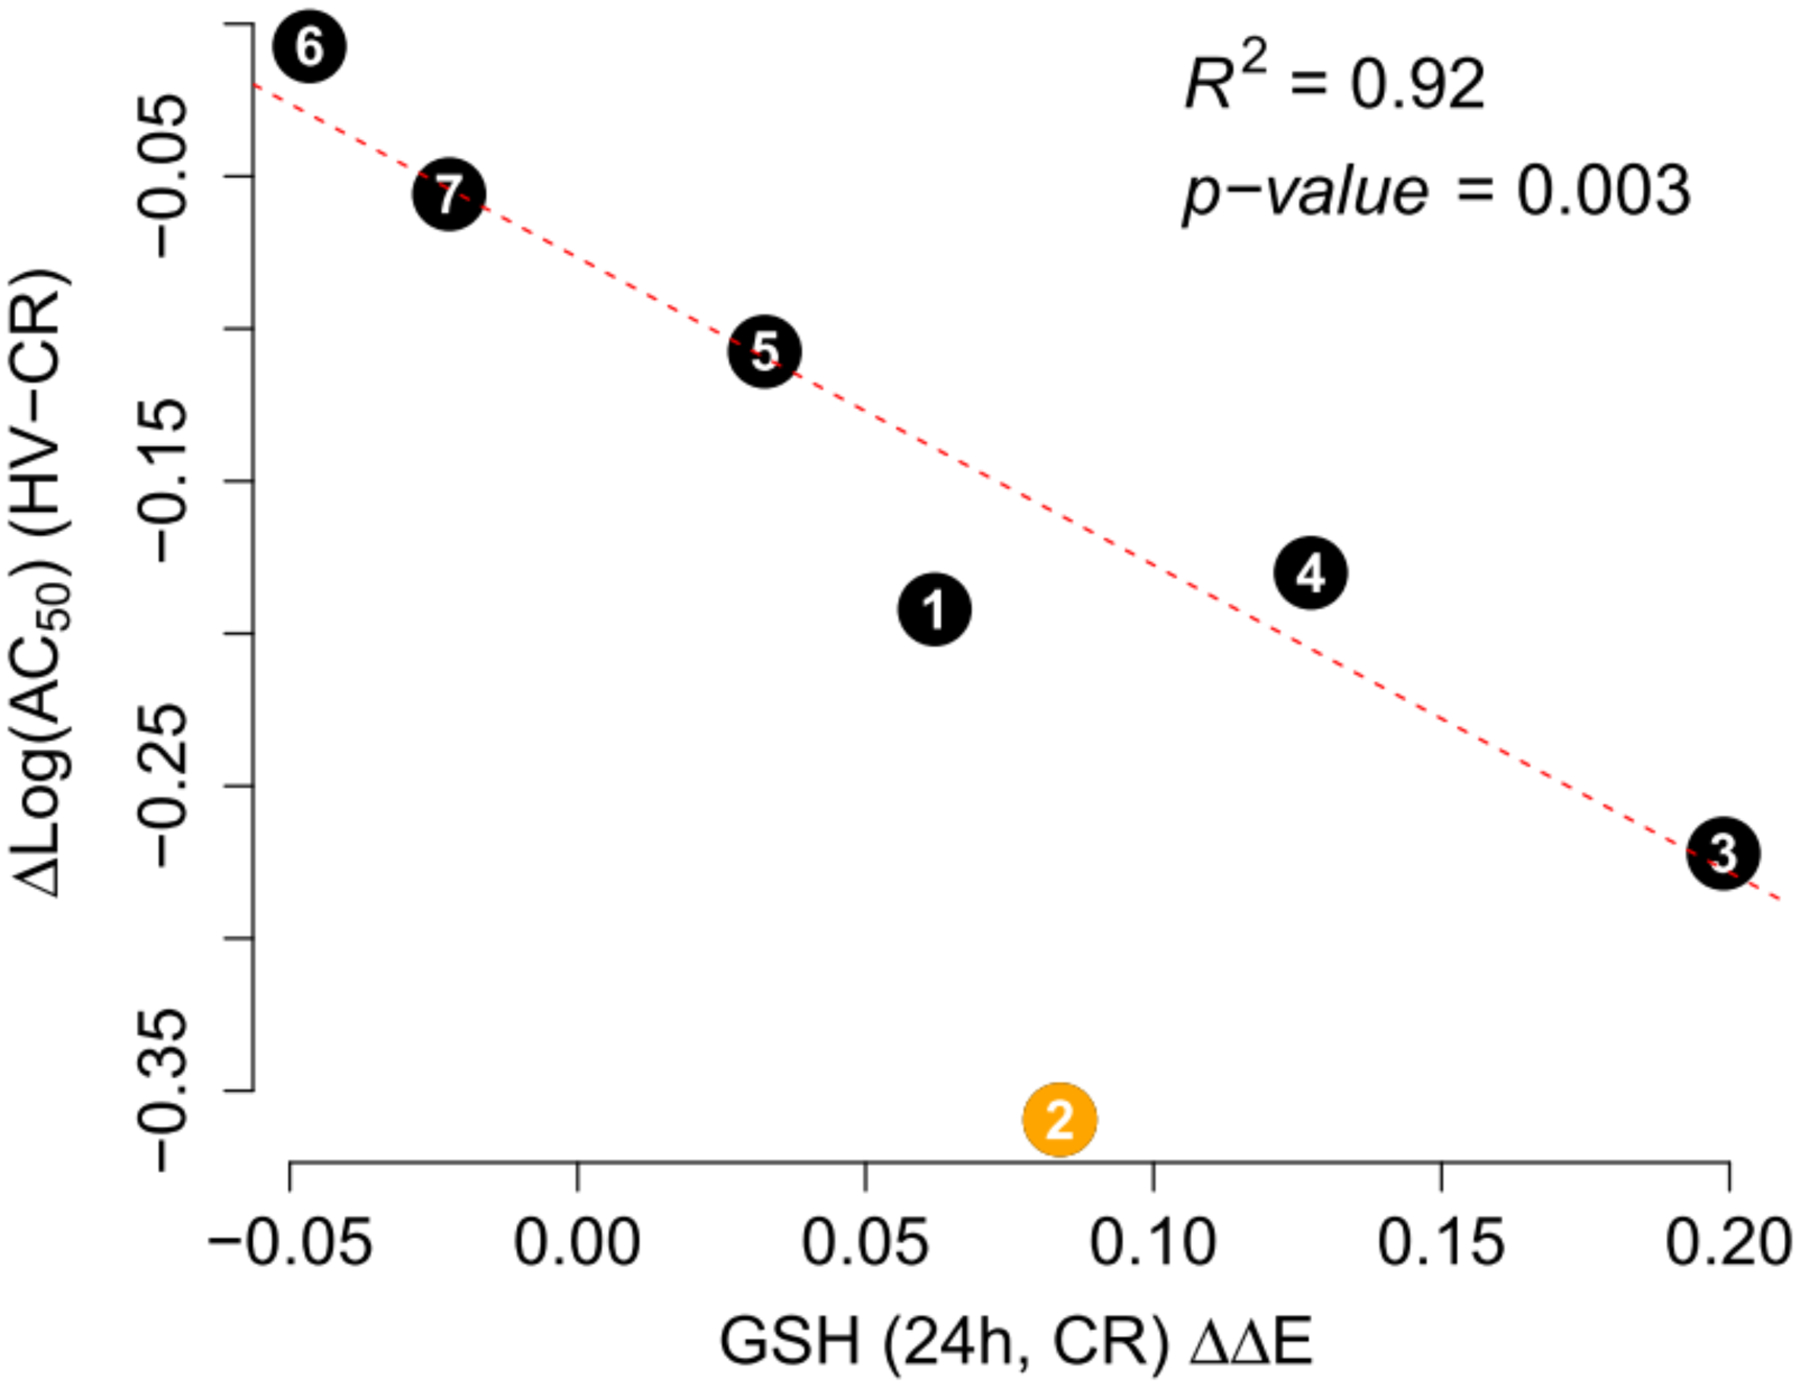
Difference in AC50 thresholds between HV and CR cell lines vs GSH induction in the CR cell line at 24 h. The chemical numbers indicate corresponding structures as described in Figure 2. Line fit and fit parameters are given for data without tBHP (chemical 2). ΔΔE is the log-scale fold change from control normalized to total protein content. Chemicals are labeled according to Figure 2.
Gene Co-expression.
Transcriptional responses 24 h after exposure to compounds 1–7 and 6 h after exposure to compounds 1–4 were highly correlated in both HV and CR cell lines (Figure 13A,C). Clustering analysis based on pairwise complete correlation showed that mRNA expression was significantly grouped by time in the HV cell line (Figure 13B). In the CR cell line, mRNA expression was correlated across time points. However, Nqo1 (6 h) formed a distinct sub cluster with Gclc (6 h) with a highly significant positive correlation (Figure 13C–D, R = 1, p < 0.001). MTT AC50 and the concentration-response slope (Slope) were highly correlated with mRNA expression at 6 h (R > 0.76) in the HV cell line (Figure 13A); a particularly strong association was seen with Nqo1 mRNA expression (R = −0.99, p < 0.01). MTT LC50 or Slope did not significantly correlate with the expression of any of these mRNAs in the CR cell line (Figure 13C). The difference in hydroquinone toxicity between HV and CR cells corresponds to the significantly lower level of induction of these mRNAs in the CR cell line (Table S1). It is also notable that GSH content at 24 h is significantly correlated with Gclc, Gclm, and Hmox1 mRNA levels at 6 h for chemicals 1–4 (R = 0.83–0.98, Figure 13A,C).
Figure 13.
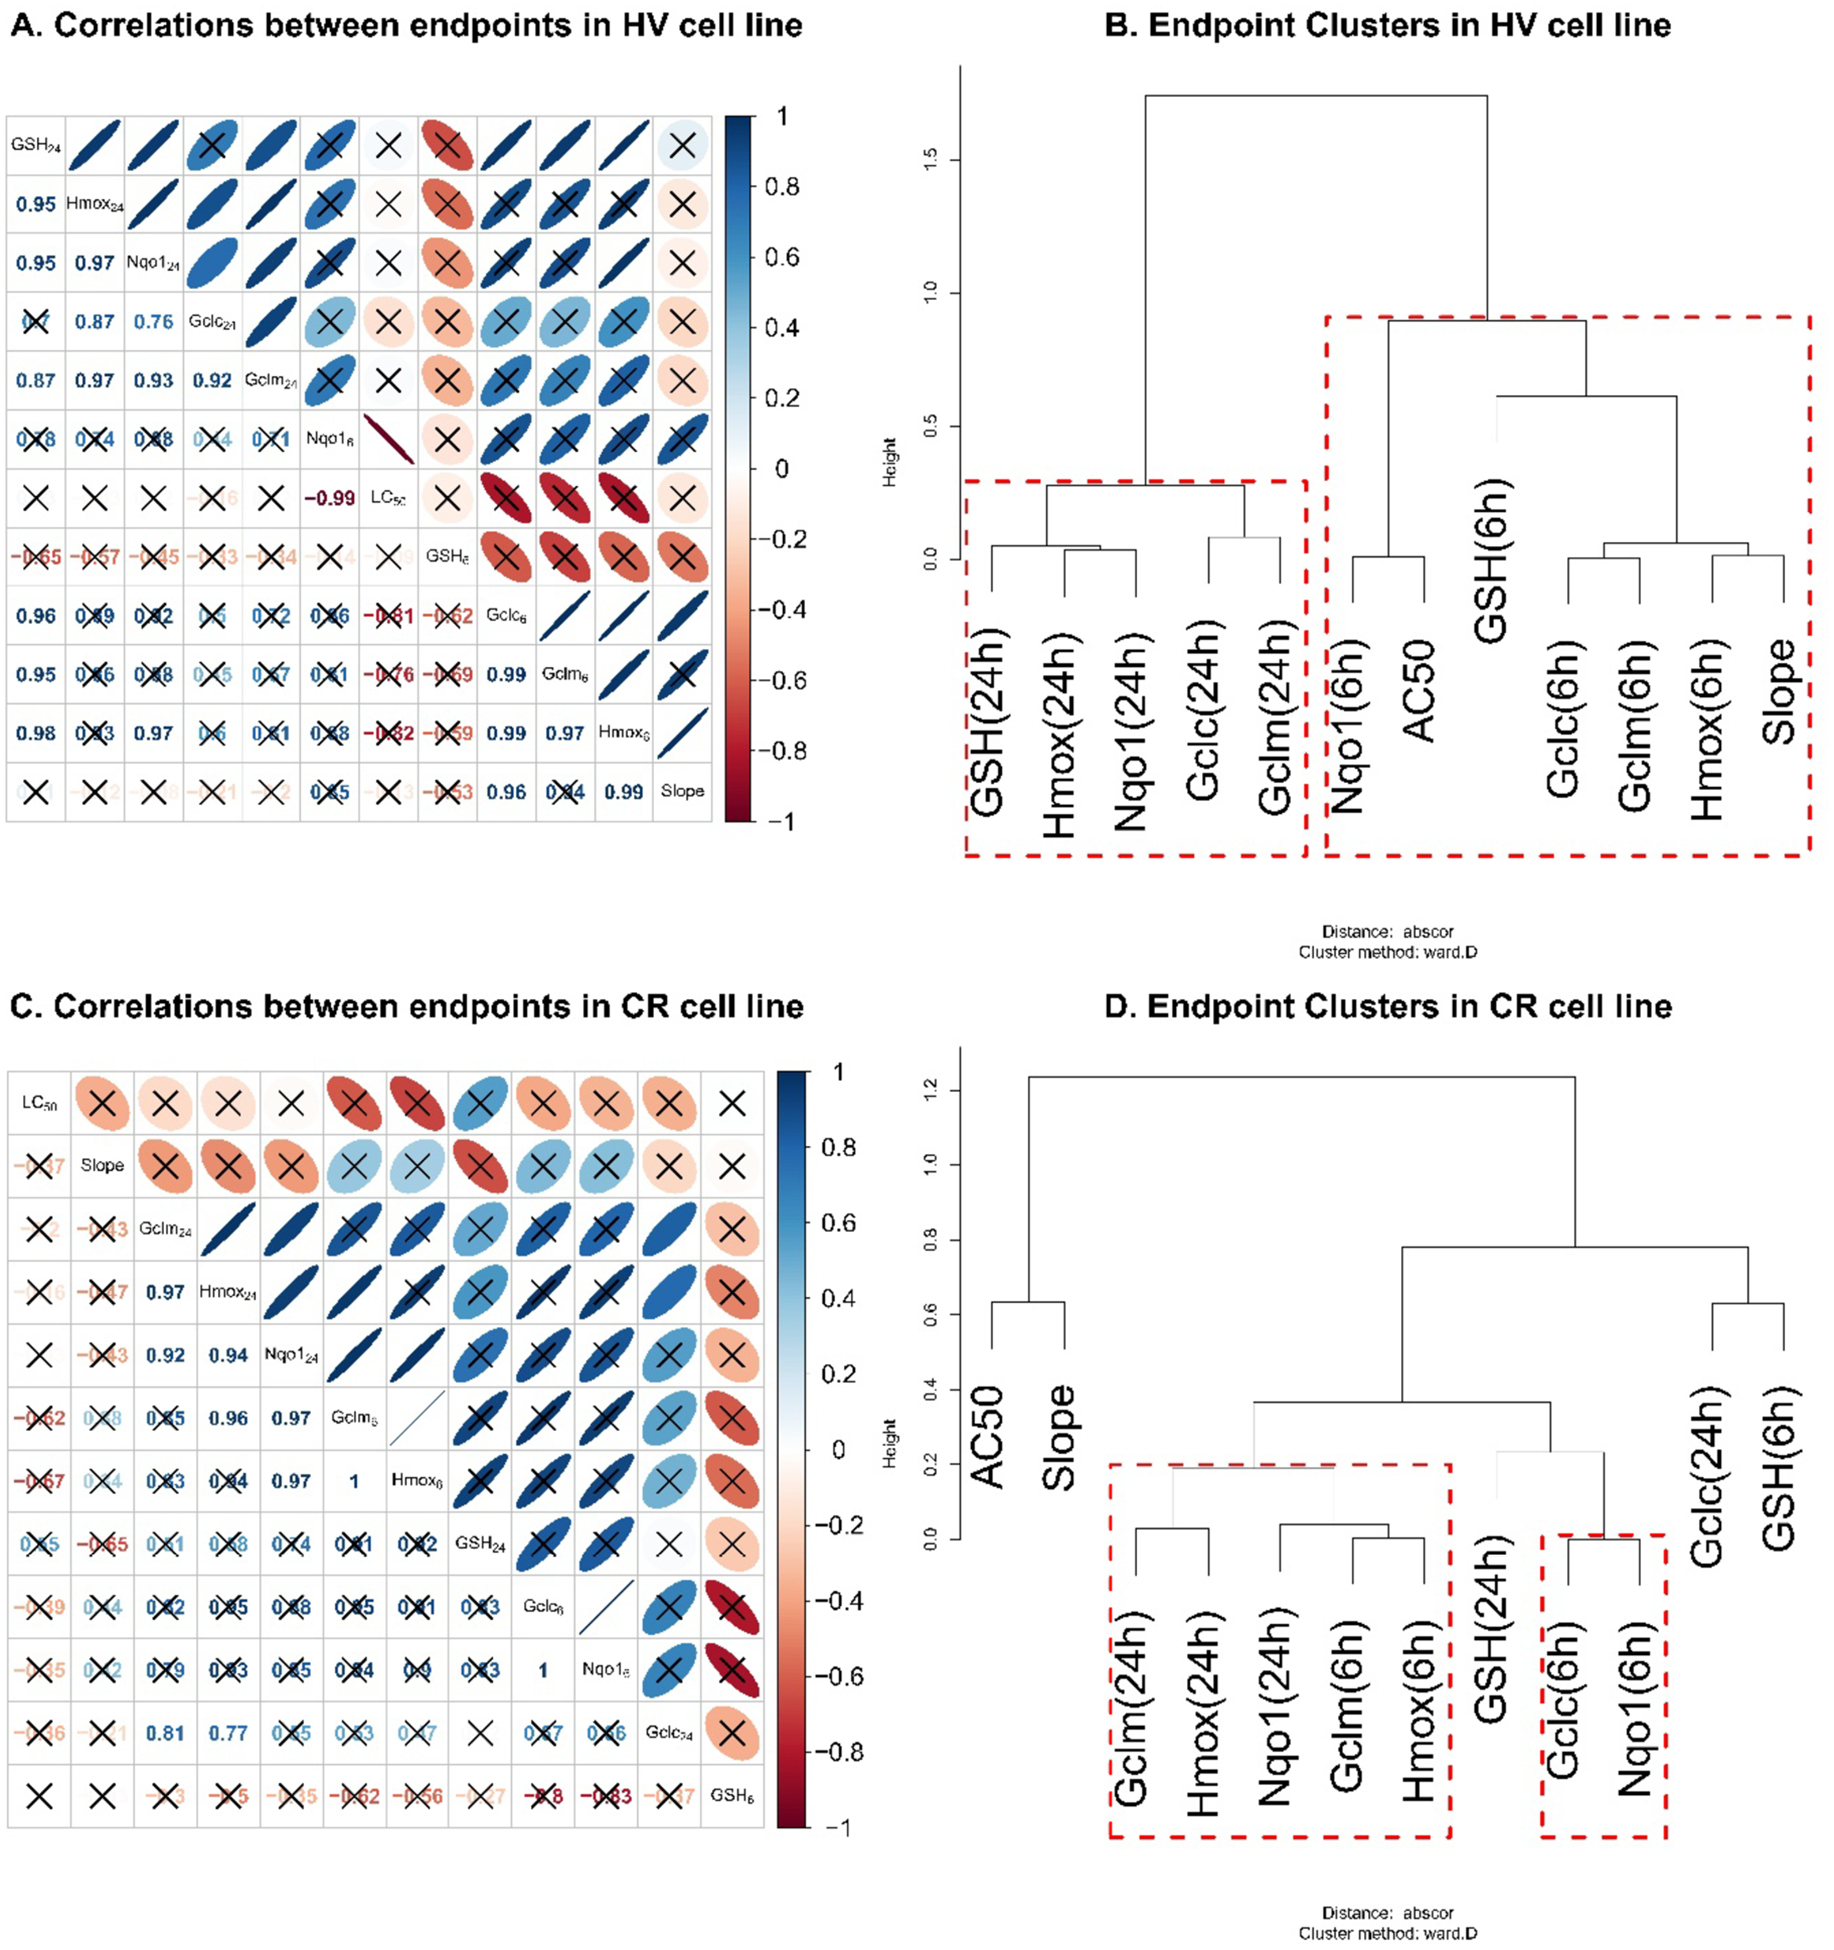
Correlation and cluster analyses for antioxidant mRNA expression, GSH levels, and cytotoxicity estimates in HV (A, B) and CR (C, D) cell lines. (A, C) Correlation between the chemicals’ effects on every end point studied at 24 or 6 h. The lower triangular portions of (A and C) give the Pearson correlation coefficients (R) for the pairwise relationship between end points. The upper-triangular portions of these figures provide intuitive visualizations for the correlations with blue and red colors indicating positive and negative correlations, respectively, while narrower ovals indicate higher absolute values of the correlation. For example, the first cell in the second row in (A) shows that, for the 7 chemicals analyzed, the effects on GSH levels at 24 h and on Hmox mRNA expression at 24 h have a R = 0.95. The R = 0.95 corresponds to a narrow blue oval in the second cell of the first row of the figure, indicating a high positive correlation. Correlations insignificant (p > 0.05) are crossed out. (B, D) End point cluster analysis using absolute correlation distance metric and Ward clustering method. The end points with branches connected lower on the cluster tree are affected more similarly by the seven chemicals studied. For example, in HV cells (panel B), the chemicals affect Gclc and Gclm mRNA expression at 6 h similarly, while the effects on Nqo1 and Gclm mRNA expression at 6 and 24 h, respectively, are not very similar. Cluster stability was assessed with 1000-fold bootstrap. Clusters stable at p < 0.01 level are highlighted in red. Thus, the end points grouped together by red boxes can be viewed as related or affected similarly by the seven studied chemicals.
Computational Studies.
In contrasting the toxicities of peroxides via computational determination of the O–O bond cleavage, we found the bond dissociation energy was lower for 1 over 2 by ca. 2.1 kcal/mol. Furthermore, computed free energy barriers for 8 and 9 (peroxide metabolites of 1 and 2, respectively, Figure 3) with model thiolate (methyl thiolate) indicated marginally faster rates for opening the 8 (from 1) based on ca. 0.3 kcal/mol lower free energy barrier.
In computing free energies of reaction between the resonance-stabilized semiquinone and GSH (modeled as methyl thiolate), HQ-GSH adduct was thermodynamically favored over corresponding tBHQ-GSH adduct by ca. 3.3 kcal/mol. The difference is attributed to the well-documented electron-donating effect of t-butyl group, which decreases the acidity of the substituted quinone,81 and the steric bulk of the substituent that adds a minor entropic penalty of R ln 2, that is, ca. 0.0014 kcal/mol. This result is consistent with our calculations of the band gap (ΔE) between semiquinone singly occupied molecular orbital (SOMO) and GSH SOMO as well as between the quinone lowest unoccupied orbital (LUMO) and highest occupied molecular orbital (HOMO) of glutathione anion (GS−), which indicated smaller gaps for HQ by 0.26 and 0.43 eV, respectively.
In considering redox cycling, hydroquinone oxidation to semiquinones and quinones by molecular oxygen and subsequent reduction of quinones to semiquinones by POR were evaluated computationally. Oxidation of tBHQ to semiquinone and quinone species was 2.5 and 2.7 kcal/mol lower in free energy than for HQ (Figure 14). When docking into the NADP+ active site of the reduced-form of POR (5URD), tBQ was found to have ca. 2 kcal/mol greater affinity for the POR than unsubstituted benzoquinone due to a hydrophobic interaction between the t-butyl group and nearby leucine residue in the enzyme’s active site (Figure 15). This result is consistent with our general understanding that methylation makes a molecule more hydrophobic and thus more prone to binding biomolecules; a single sp3 carbon on a ligand surface has been estimated to contribute ca. 0.7–0.8 kcal/mol to the free energy of protein-ligand binding.82
Figure 14.
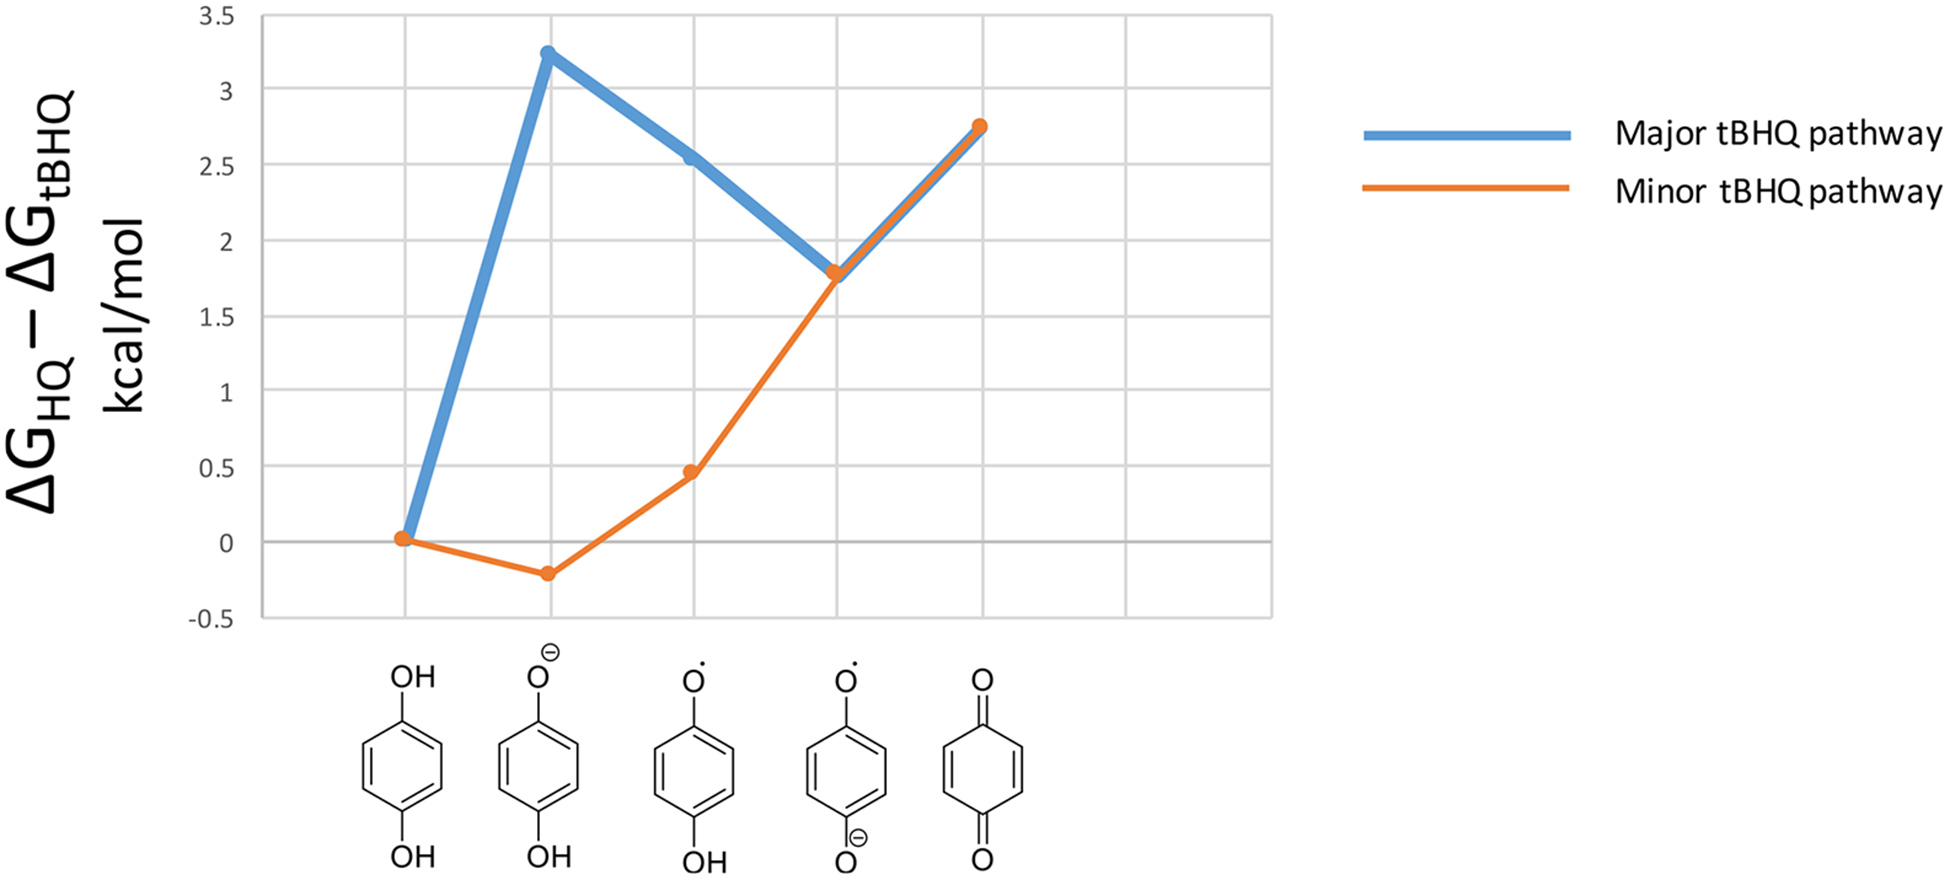
Relative stability of HQ vs tBHQ oxidation species. Differences in free energies of nonenzymatic oxidation are calculated as ΔΔG’s in kcal/mol at the M06-HF/6–31+G(d) level of theory. Both oxygens are considered for the asymmetric tBHQ as major and minor pathways.
Figure 15.
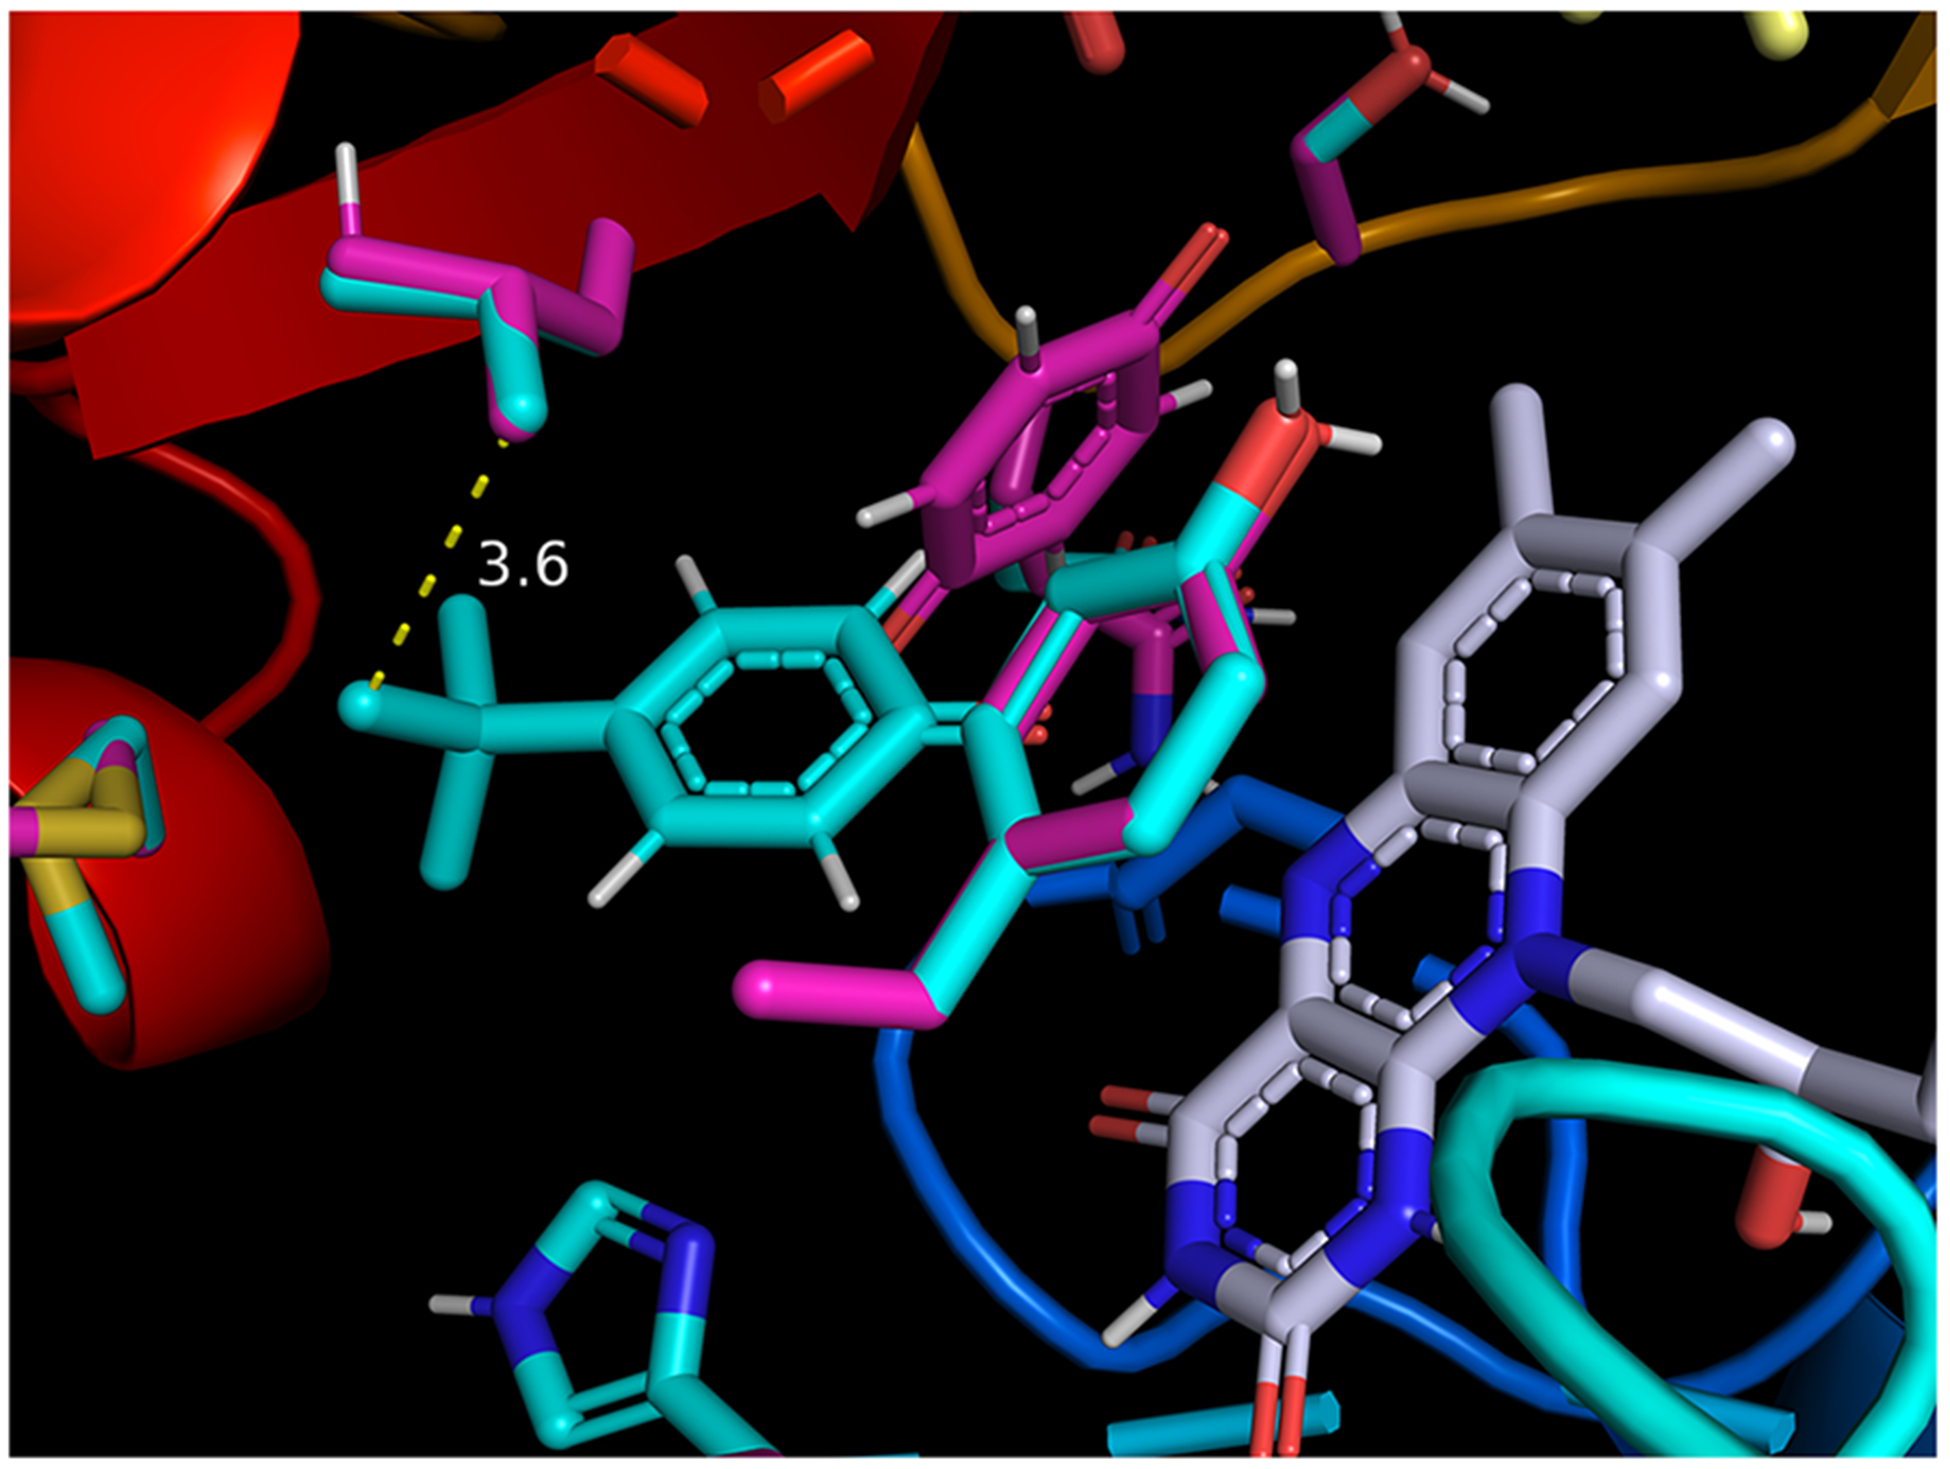
tert-Butyl benzoquinone (tBQ, cyan color) and benzoquinone (Q, magenta color) docked in their respective lowest-energy poses in the NADP+ active site of cytochrome P450 oxidoreductase (POR; 5URD). Favorable hydrophobic interaction between t-butyl group of tBQ and isobutyl group of proximal leucine residue (3.6 Å in closest C–C distance) is proposed to account for the ca. 2 kcal/mol higher binding affinity for tBQ. Side chains of active-site residues sampled during docking are identified in cyan (tBQ) and magenta (Q) colors, respectively; flavin mononucleotide (FMN) is shown in gray color.
DISCUSSION
The Protective Role of GSH.
Glutathione has long been recognized as an important endogenous antioxidant that is important for redox homeostasis and for being protective against a number of oxidative stress-inducing conditions, including chemical exposures. Here we report the effects of seven chemicals on cell survival, antioxidant gene mRNA expression, and GSH levels in two Hepa-1 mouse hepatocyte derived cell lines. Chemicals with direct electrophilic functionalities, reactive metabolites, or redox cycling capacity can deplete intracellular GSH reserves leading to loss of viability (Figure 1).5,18,83,84 The CR cell line was designed to have increased glutamate-cysteine ligase (GCL) activity and GSH content compared to the control HV cells.69 Thus, CR cells were expected to have higher electrophile clearance and exhibit higher resistance to chemical-induced toxicity, particularly for chemicals capable of reacting as electrophiles.85 Indeed, CR cells were more resistant to cytotoxic effects of all seven chemicals as indicated by higher AC50 values (Table 2), and right concentration-response shifts in CR cells compared to HV cells (Figure 5). The ΔAC50 (the ratio MTT AC50 in HV cell line to the AC50 in the CR cell line) was consistently <1 across all chemicals, suggesting a protective effect of increased intracellular GSH on cell viability (Table 2). Furthermore, the differences in MTT LC50 between HV and CR cell lines are inversely correlated with GSH levels in the CR cells (Figure 12). That is, the excess GSH produced by CR cells (relative to HV cells) appears to help metabolize xenobiotics and endow CR cells with increased resistance to chemical toxicity. This increased GSH level in CR cells is likely due to the increased levels of GCLC and GCLM mRNA and protein present in these cells (Figures S2 and S3). Together, these relationships underscore the importance of GSH and its synthesis in protecting against electrophile-induced toxicity.
In additional to the intrinsic scavenger-mediated defense, cells have developed a highly conserved system of inducible stress response, which is largely dependent on the activity of the Nrf2 transcription factor.58,83,86–89 When challenged, cells aim to restore homeostasis, in part, by increasing antioxidant gene transcription regulated by the ARE. Thus, exposure to electrophilic or pro-electrophilic substances induces antioxidant gene expression by reacting with or oxidizing Keap1 thiols and releasing Nrf2, which, in turn, binds to AREs and induces antioxidant gene transcription (Figure 1).58,89 As expected, several chemicals upregulated Gclc, Gclm, Nqo1, and Hmox1 mRNA expression (Figures 8–9) at 6 and 24 h after exposure. However, the higher GSH content in CR cells was expected to provide a more robust threshold for Keap1 oxidation and antioxidant mRNA induction when compared to HV cells. Accordingly, antioxidant mRNA induction in HV cells was consistently equal to or higher than the CR equivalent, further supporting the role of GCL activity and GSH content in oxidative homeostasis and antioxidant gene response (Figures 8–9; Table S2; Figures S3 and S4). A more intuitive comparison of chemicals’ effects on gene induction in the HV and CR cell lines is given by radial plots (Figure 16).
Figure 16.
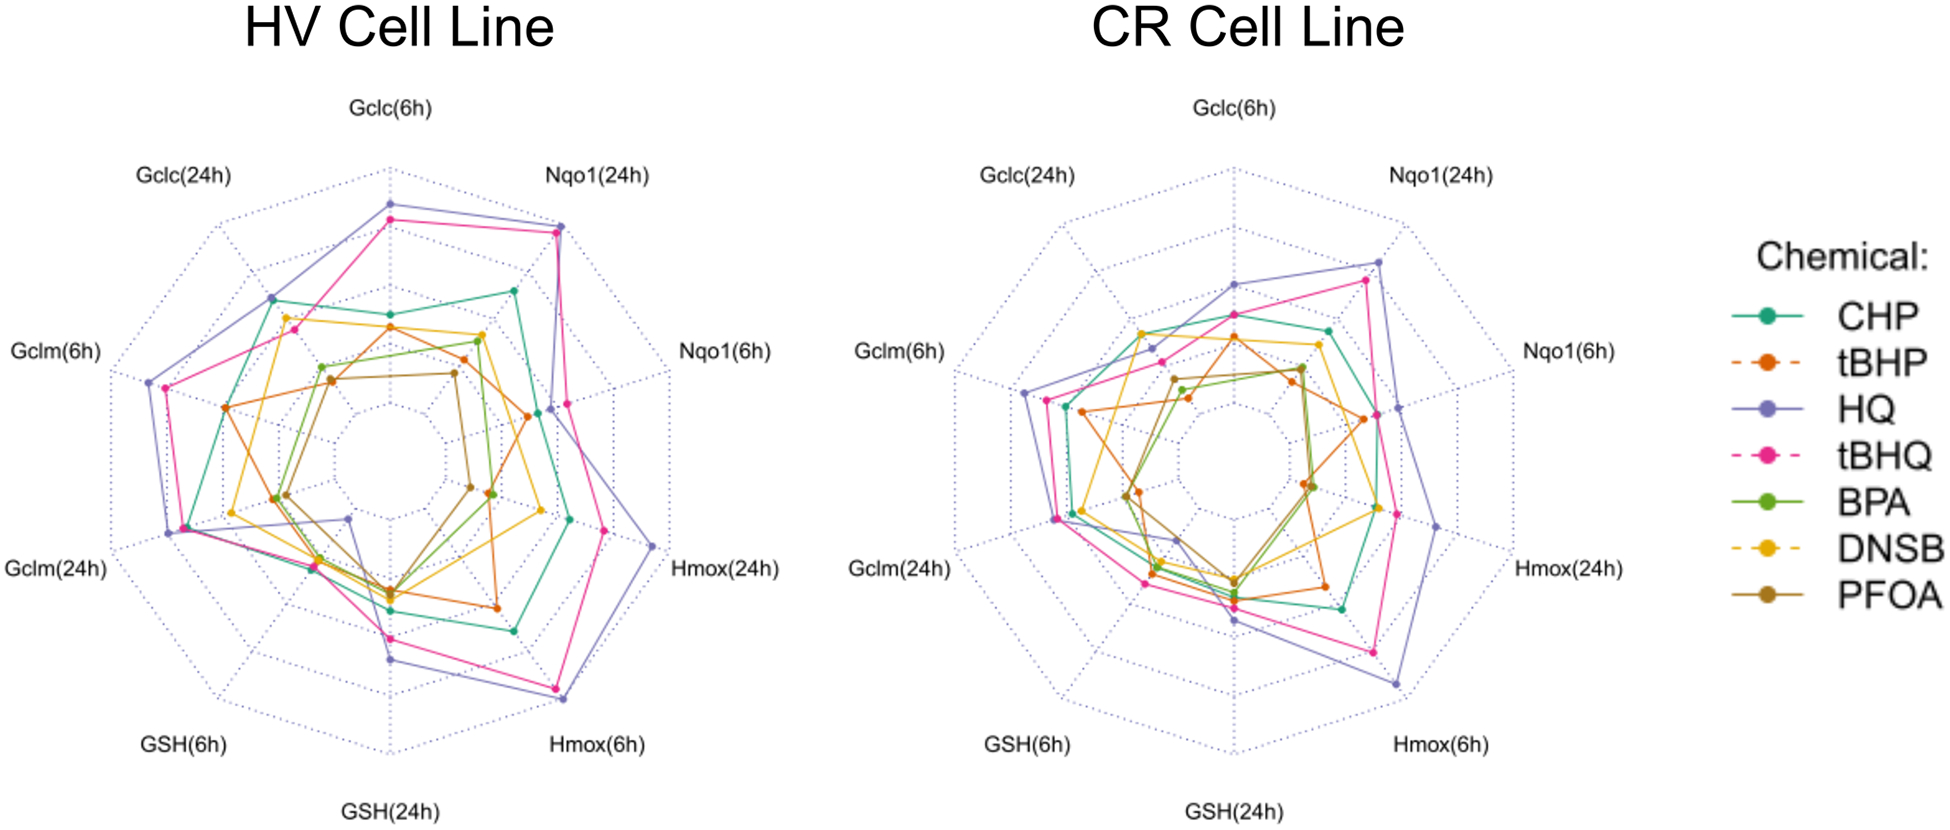
Antioxidant mRNA and GSH expression profiles by cell line expressed as radial plots. Radial plot end points show relative gene expression (normalized to highest ΔΔE) at 6 or 24 h in HV or CR HeLa cell cultures.
Multivariate Chemical Effects and Modes of Toxic Action.
The differences in chemicals’ effects on mRNA expression and intracellular GSH levels were hypothesized to relate to the modes of chemical toxicity. More specifically, chemicals thought to be detoxified in GSH-dependent manner exhibited larger differences in MTT potency (1–5), while chemicals with large contributions from other modes of action (6–7) showed the smallest differences in viability between the cell lines (Table 2). Furthermore, we expected GSH depletion and mRNA induction responses to chemicals capable of acting as direct electrophiles to be faster than for those working though secondary metabolites or redox cycling. Increased redox cycling was expected to produce a more graded antioxidant mRNA response, as the time needed for metabolic activation or ROS cycling may delay GSH depletion. In this section, we examine experimental and computational evidence for modes of toxicity in the context of existing literature.
As a class, peroxides (1 and 2) showed the largest differences in toxicity between HV and CR cell lines (Table 2). Previous work showed that peroxides can be rapidly metabolized by cellular peroxidases in vitro.80 Since many peroxidases function in a GSH-dependent manner,86,90,91 the increased GSH concentrations in CR cells should render them more resistant to peroxide toxicity. Specifically, tBHP showed 2.3-fold increase in AC50 values in CR vs HV cell lines, while CHP exhibited a more modest 1.5-fold increase (Table 2). However, neither CHP nor tBHP affected intracellular GSH levels at 6 or 24 h after exposure (Figure 10). The results could be explained by the rapid kinetics of peroxidase activity leading to GSH oxidation and peroxide reduction, followed by GSR-mediated reduction of GSSG back to GSH (Figure 1). Liddell et al. (2006) showed that sublethal exposure to CHP induces rapid GSH depletion and repletion within 3 h of exposure.80 The in vitro GSH effects were consistent with previous studies in zebrafish.68 Both peroxides induced Gclm, Hmox, and Nqo1 mRNA expression at 6 h (Figure 8), but the effects of tBHP (2) on Hmox and Nqo1 mRNA expression decreased significantly by 24 h (Table S4). Computational studies indicated that O–O bond in 1 is more reactive compared to 2 and that epoxide metabolites of 1 are more reactive toward GSH (Figure 3). Considered together, the data suggest that assuming O–O cleavage as the MIE for peroxide toxicity, the higher CHP reactivity accounts for increased toxicity in both cell lines and prolonged gene expression effects, compared to tBHP.
Hydroquinones, 3 and 4, and their quinone metabolites can arylate proteins by Michael addition or increase intracellular ROS through redox cycling.92 Arylating quinones and hydroquinones have been shown to form GSH adducts, deplete GSH, and reduce cell viability at high concentration but can act as antioxidants at lower concentrations in experimental and computational studies.92–98 Such antioxidant function was thought to be largely adduct- and Nrf2-dependent and was shown to induce transcription of ARE-dependent genes 1–24 h after exposure in different cell lines.94,99–101 Indeed, 3 and 4 were the most potent inducers of antioxidant gene expression (Figures 8 and 9) and were the only chemicals to significantly affect intracellular GSH at 6 and 24 h, with the effects approximately two times higher in the HV than CR cells (Figure 10). CR cells were substantially more resistant to 3 and 4 than HV cells (ΔAC50 = 0.54 and 0.66, respectively; Table 2). In distinguishing the two hydroquinones, 4 resulted in 4.0- and 3.2-times lower AC50 than 3 in HV and CR cells, respectively (Table 2). Furthermore, 3 and 4 exhibited markedly different kinetics on GSH levels; with 4 upregulating intracellular GSH at the earlier 6 h time point (Figure 10). Finally, qPCR data showed that tBHQ had the largest effect on Nqo1 expression in HV cell line, but the response was attenuated in the CR cells relative to other chemicals studied (Figure 8).
We hypothesized that the differences in GSH kinetics, cytotoxicity, and NQO1 effects in combination with computational approaches could further elucidate the contributions of MIEs to chemical toxicity. The computational analysis indicated that HQ is more reactive toward GSH, reactive protein residues, and other intracellular nucleophiles than tBHQ. However, tBHQ oxidation to semiquinones and quinones was found to be more favorable (Figure 14). If hydroquinones are fully oxidized by cytochrome P450s or cyclooxygenases to their quinone forms (t-butylbenzoquinone and 1,4-benzoquinone, respectively), one electron reduction by POR, cytochrome b5, or nitric oxide synthases may regenerate semiquinone intermediates, perpetuating redox cycling.102 To this end, tBQ was found to have ca. 2 kcal/mol greater affinity for POR (5URD) than BQ, consistent with increased redox cycling potential of tBHQ, which is thought to be associated with higher tBHQ toxicity in both cell lines and a more robust effect on Nqo1 induction in the HV cells. The rapid increase in GSH level following tBHQ exposure could be attributed to its ROS production or direct post-transcriptional GCL modification, irrespective of changes in mRNA expression.103 Finally, NQO1 is a key protein that carries out a two-electron reduction of quinones and is a major NRF2 target gene. The higher Nqo1 mRNA induction by tBHQ in HV cells further supports the role of tBHQ as a redox cycling compound. Increased GSH levels in the CR cell line attenuated tBHQ-mediated Nqo1 mRNA expression (Figure 8). This observation suggests that in these cells, the excess GSH likely favors tBHQ conjugation by gutathione S-transferases (GSTs) and thus diminishes the role of redox cycling in its toxicity. The differences in gene expression underscore the protective role of GSH against cell toxicity, as NQO1 is known to induce a mixture of cytoprotective and cytotoxic effects by either two-electron reduction/detoxification or by contributing to activation of certain quinone-based cancer chemotherapeutics.104,105 Thus, lower NQO1 levels may further reduce chemical toxicity, as indicated by the smaller difference between tBHQ and HQ toxicities in CR compared to HV cells (3.2 vs 4.0-fold difference). In previous in vitro studies, HQ and BQ were repeatedly shown to be less cytotoxic but more reactive toward GSH than more substituted quinones.95,106 The work suggested that excess nonspecific reactivity, such as that of HQ, does not always lead to increased toxicity as reactive chemicals do not reach the site of toxic action.94 And unlike BQ and HQ, substituted benzoquinones and hydroquinones, like tBHQ, may be more toxic due to their ability to reach target sites in the endoplasmic reticulum93–95,107 or mitochondria.108 This analysis did not assess internal chemical concentration and compartment-specific ROS effects. Future work in the area could help distinguish ROS-mediated toxicity from that associated with nonspecific reactivity or increased bioavail-ability at target sites.
BPA (5) is widely studied and reported to exhibit an array of biological effects including nuclear receptor- and oxidative stress-mediated toxicities.109 Scavenger conjugation and excretion is the major pathway of BPA detoxification.98,110 Like 3 and 4, BPA can be oxidized by P450 enzymes to catechol metabolites and o-quinones, with BPA-3,4-quinone (BPAQ) as the major reactive metabolite.98,110–112 Computational studies demonstrated that GSH conjugation of BPAQ is more favorable than DNA adduct formation.96 Thus, an increased level of GSH is expected to provide protection against BPA toxicity. The ΔAC50 for BPA was 0.78 (Table 2), suggesting a mild protective effect of GSH against BPA toxicity. Just like 3 and 4, excess GSH in CR cells line was associated with an overall decrease in mRNA expression in response to BPA exposure (Table S1). More specifically, BPA did not upregulate Gclc, Hmox, or Gclm mRNA at 24 h, but increased Nqo1 mRNA in the HV cell line only (Figure 8). As discussed in the context of HQ toxicity, upregulation of Nqo1 mRNA may indicate a mild increase in the BPAQ metabolite. But the effects of excess GSH in the CR cells on BPA toxicity are mild compared to 1–4, probably because the complex mixture of mechanisms involved in BPA toxicity. The 75 μM BPA exposure chosen for this study was likely on the verge of cytotoxic response previously reported in vitro. High micro-molar BPA exposure has been shown to deplete intracellular GSH and induced pro-oxidative conditions.109,113 However, the lower levels of exposure we used upregulated GSH synthesis which could have produced a reducing intracellular environment through Nrf2-mediated antioxidant gene induction.114–116
Excess GSH was not expected to substantially attenuate toxicity of 6 and 7 due to MIEs distinct from electrophilic protein heptanation. Accordingly, the ΔAC50 for BPA was 0.95 (Table 2). DNSB (6) is a known oxidative phosphorylation uncoupler.117 qPCR data indicated that DNSB slightly upregulated antioxidant gene expression in both cell lines studied here (Figure 8), likely due to its effect on redox homeostasis. PFOA (7) has been shown to induce toxicity through reversible electrostatic interactions with protein.118,119 While PFOA may induce apoptosis in a ROS-dependent manner,120 it is not expected to be readily metabolized through GSH conjugation or activate antioxidant gene transcription through covalent interactions with reactive protein thiols. Indeed, our data showed that the increased GSH content in the CR cell line had mild effects on PFOA toxicity (ΔAC50 = 0.87, Table 2) and PFOA did not affect antioxidant mRNA expression (Figure 8), GCLC or GCLM protein expression (Figure S2), and intracellular GSH levels (Figure 10).
Gene Co-Regulation.
The expression of antioxidant gene mRNAs was highly correlated (Figure 13), suggesting a common regulatory mechanism, typically associated with Nrf2 activation, and upregulation of transcription at AREs in these genes. In the HV cell line, the antioxidant mRNA and GSH levels at 24 h (chemicals 1–7) clustered together, while antioxidant mRNA and GSH at 6 h clustered together (chemicals 1–4) (Figure 13B). However, the pattern differed in the CR cells, indicating differences in antioxidant mRNA upregulation in the GSH-overexpressing line. The high association between Gclc and Nqo1 induction in the CR but not the HV cell line (Figure 13A, 13C) suggests co-induction of the mRNA at high GSH concentrations and additional regulatory mechanism at low GSH levels.
Across chemicals 1–4, Hmox, Gclc, and Gclm mRNA were upregulated most by 6 h, and in many cases their expression was significantly attenuated by 24 h after exposure (Figure 8, Table S3). However, the expression of Nqo1 significantly increased over time (Figure 8, Table S3). The differences in expression patterns suggested that Nqo1 regulation operated on a different time scale and was particularly sensitive to chemicals that may affect ROS homeostasis (6) or produce redox cycling metabolites (3–4). The delayed response may indicate an increase in intracellular benzoquinone over time after hydroquinone exposure.
Finally, we investigated the relationship between Gclm expression at 6 h and GSH levels at 24 h and found these effects to be highly correlated with quadratic dependence (Figure 11). Such correlations are consistent with the fact that Gclc and Gclm encode the catalytic and modifier subunits of GCL which is the rate-limiting enzyme in GSH synthesis.121 Thus, induction of these GSH-synthesis genes at 6 h is associated with an increased GCLC and GCLM protein and GSH level by 24 h.
CONCLUSION
The analysis of Gclm and Gclc transfected (CR) and control (HV) Hepa-1 cell line indicated that CR cells were more resistant to chemical toxicity and showed marked attenuation of OS biomarkers. The difference in antioxidant response can be largely attributed to the chemicals’ ability to act as biological electrophiles or produce redox cycling metabolites. As in previous work, exposure to electrophilic chemicals at low concentrations has been shown to deplete GSH initially and induce an antioxidant defense system over time. Hmox, Gclc, and Gclm mRNA exhibited common expression supporting of a common regulatory mechanism, while Nqo1 mRNA regulation in Hepa-1 cells may be more complex and respond specifically to redox cycling or oxidative phosphorylation-uncoupling substances. Computational results quantified the contribution of chemical mechanisms and reactivity models to toxicity and GSH depletion. Our analysis highlighted the power of computational tools in assessing chemical toxicity and the contribution of chemical reactivity and MIE models to understanding chemical modes of actions. Future in vitro studies can further elucidate the chemical functionalities important for biological effects and help enable safer chemical design by modeling chemical distributions inside the studied cells.
Finally, the translational implications of this work include a consideration of the role of GSH in human health and disease. Because of its importance in maintaining thiol redox status and antioxidant protection, there has been interest in delivering GSH as a therapy for a number of diseases including various lung diseases, cardiovascular disease, and in certain chronic neurological diseases. When given orally, GSH is not very bioavailable since it is metabolized to its constituent amino acids in the gut and the liver via the actions of γ-glutamyltransferase and dipeptidases. Nonetheless, there is recent evidence that sublingual GSH formulations may be able to bypass this effect to increase plasma GSH levels.122 GSH has been proposed as a potential therapeutic agent delivered intranasally in the context of Parkinson’s disease.123 Providing GSH to the brain via intravenous route may be somewhat difficult as the levels required may be quite high, given that in rats the Km for transport is approximately 5.8 mM.124 Alternatively, N-acetylcysteine is a well described precursor for GSH synthesis and has been used in a number of clinical situations including protecting against acetaminophen overdose, as an ancillary treatment for cystic fibrosis (where it is also a mucolytic), certain psychiatric illnesses, cardiovascular disease and diabetes, and in several other conditions.125–129 Future studies might be done to determine if any of these interventions are protective in vivo against these oxidative stress-inducing chemicals using genetically modified mice deficient in GSH synthesis, as we have previously shown that GCL expression is an important determinant of acetaminophen-induced liver injury.130,131
Supplementary Material
ACKNOWLEDGMENTS
This material is based on work supported by the NSF Division of Chemistry and the Environmental Protection Agency through a program of Networks for Sustainable Molecular Design and Synthesis Grant from the NSF Division of Chemistry (grant no. 1339637), US EPA grant R835738, and NIH grants P30ES007033 and T32AG000057. One of the authors, Fjodor Melnikov, would like to thank the U.S. EPA Science to Achieve Results (STAR) program for financial support (FP-91779301-0).
Footnotes
Supporting Information
The Supporting Information is available free of charge on the ACS Publications website at DOI: 10.1021/acs.chemrestox.8b00259.
Further details on concentration-response analysis, MANOVA analysis (Tables S1 and S3), and t test statistics (Tables S2 and S4) (PDF)
The authors declare no competing financial interest.
REFERENCES
- (1).Anastas PT, and Warner JC (1998) Green Chemistry: Theory and Practice, Oxford University Press, England, Oxford. [Google Scholar]
- (2).Voutchkova AM, Osimitz TG, and Anastas PT (2010) Toward a comprehensive molecular design framework for reduced hazard. Chem. Rev 110, 5845–82. [DOI] [PubMed] [Google Scholar]
- (3).DeVito SC (1996) In Designing Safer Chemicals, ACS Symposium Series, American Chemical Society, Washington, DC, pp 2–16. [Google Scholar]
- (4).Erythropel HC, Zimmerman JB, de Winter TM, Petitjean L, Melnikov F, Lam CH, Lounsbury AW, Mellor KE, Jankovic NZ, Tu Q, Pincus LN, Falinski MM, Shi W, Coish P, Plata DL, and Anastas PT (2018) The Green ChemisTREE: 20 years after taking root with the 12 principles. Green Chem. 20, 1929–1961. [Google Scholar]
- (5).Coish P, Brooks BW, Gallagher EP, Mills M, Kavanagh TJ, Simcox N, Lasker GA, Botta D, Schmuck SC, Voutchkova-Kostal A, Kostal J, Mullins ML, Nesmith SM, Mellor KE, Corrales J, Kristofco LA, Saari GN, Steele B, Shen LQ, Melnikov F, Zimmerman JB, and Anastas PT (2018) The Molecular Design Research Network. Toxicol. Sci 161, 241–248. [DOI] [PubMed] [Google Scholar]
- (6).Kostal J, and Voutchkova-Kostal A (2016) CADRE-SS, an in Silico Tool for Predicting Skin Sensitization Potential Based on Modeling of Molecular Interactions. Chem. Res. Toxicol 29, 58–64. [DOI] [PubMed] [Google Scholar]
- (7).Kostal J (2016) Chapter Four: Computational Chemistry in Predictive Toxicology: status quo et quo vadis? In Advances in Molecular Toxicology; Fishbein JC, Heilman JM, Eds.; Elsevier, Inc.: Cambridge, Vol. 10, pp 139–186. [Google Scholar]
- (8).Melnikov F, Kostal J, Voutchkova-Kostal A, Zimmerman JB, and Anastas PT (2016) Assessment of predictive models for estimating the acute aquatic toxicity of organic chemicals. Green Chem. 18, 4432–4445. [Google Scholar]
- (9).Gramatica P (2007) Principles of QSAR models validation: Internal and external. QSAR Comb. Sci 26, 694–701. [Google Scholar]
- (10).Tollefsen KE, Scholz S, Cronin MT, Edwards SW, de Knecht J, Crofton K, Garcia-Reyero N, Hartung T, Worth A, and Patlewicz G (2014) Applying Adverse Outcome Pathways (AOPs) to support Integrated Approaches to Testing and Assessment (IATA). Regul. Toxicol. Pharmacol 70, 629–640. [DOI] [PubMed] [Google Scholar]
- (11).Ellison CM, Enoch SJ, and Cronin MTD (2011) A review of the use of in silico methods to predict the chemistry of molecular initiating events related to drug toxicity. Expert Opin. Drug Metab. Toxicol 7, 1481–95. [DOI] [PubMed] [Google Scholar]
- (12).Allen TEH, Goodman JM, Gutsell S, and Russell PJ (2016) A History of the Molecular Initiating Event. Chem. Res. Toxicol 29, 2060–2070. [DOI] [PubMed] [Google Scholar]
- (13).Villeneuve DL, Crump D, Garcia-Reyero N, Hecker M, Hutchinson TH, LaLone CA, Landesmann B, Lettieri T, Munn S, Nepelska M, Ottinger MA, Vergauwen L, and Whelan M (2014) Adverse outcome pathway (AOP) development I: Strategies and principles. Toxicol. Sci 142, 312–320. [DOI] [PMC free article] [PubMed] [Google Scholar]
- (14).Andersen ME, and Krewski D (2009) Toxicity testing in the 21st century: Bringing the vision to life. Toxicol. Sci 107, 324–330. [DOI] [PubMed] [Google Scholar]
- (15).Ankley GT, Bennett RS, Erickson RJ, Hoff DJ, Hornung MW, Johnson RD, Mount DR, Nichols JW, Russom CL, Schmieder PK, Serrrano J. a., Tietge JE, and Villeneuve DL (2010) Adverse outcome pathways: A conceptual framework to support ecotoxicology research and risk assessment. Environ. Toxicol. Chem 29, 730–741. [DOI] [PubMed] [Google Scholar]
- (16).Sun H, Xia M, Austin CP, and Huang R (2012) Paradigm Shift in Toxicity Testing and Modeling. AAPS J. 14, 473–480. [DOI] [PMC free article] [PubMed] [Google Scholar]
- (17).Schwöbel JAH, Madden JC, and Cronin MTD (2010) Examination of Michael addition reactivity towards glutathione by transition-state calculations. SAR QSAR Environ. Res 21, 693–710. [DOI] [PubMed] [Google Scholar]
- (18).Schwöbel J. a H., Koleva YK, Enoch SJ, Bajot F, Hewitt M, Madden JC, Roberts DW, Schultz TW, and Cronin MTD (2011) Measurement and estimation of electrophilic reactivity for predictive toxicology. Chem. Rev 111, 2562–2596. [DOI] [PubMed] [Google Scholar]
- (19).Valavanidis A, Vlahogianni T, Dassenakis M, and Scoullos M (2006) Molecular biomarkers of oxidative stress in aquatic organisms in relation to toxic environmental pollutants. Ecotoxicol. Environ. Saf 64, 178–189. [DOI] [PubMed] [Google Scholar]
- (20).Lushchak VI (2016) Contaminant-induced oxidative stress in fish: a mechanistic approach. Fish Physiol. Biochem 42, 711–747. [DOI] [PubMed] [Google Scholar]
- (21).Giordano G, Kavanagh TJ, and Costa LG (2008) Neurotoxicity of a polybrominated diphenyl ether mixture (DE-71) in mouse neurons and astrocytes is modulated by intracellular glutathione levels. Toxicol. Appl. Pharmacol 232, 161–168. [DOI] [PMC free article] [PubMed] [Google Scholar]
- (22).Giordano G, White CC, McConnachie LA, Fernandez C, Kavanagh TJ, and Costa LG (2006) Neurotoxicity of domoic Acid in cerebellar granule neurons in a genetic model of glutathione deficiency. Mol. Pharmacol 70, 2116–2126. [DOI] [PubMed] [Google Scholar]
- (23).Espinoza HM, Williams CR, and Gallagher EP (2012) Effect of cadmium on glutathione S-transferase and metallothionein gene expression in coho salmon liver, gill and olfactory tissues. Aquat. Toxicol 110–111, 37–44. [DOI] [PMC free article] [PubMed] [Google Scholar]
- (24).Wang L, and Gallagher EP (2013) Role of Nrf2 antioxidant defense in mitigating cadmium-induced oxidative stress in the olfactory system of zebrafish. Toxicol. Appl. Pharmacol 266, 177–186. [DOI] [PubMed] [Google Scholar]
- (25).Kim HS, Kim YJ, and Seo YR (2015) An Overview of Carcinogenic Heavy Metal: Molecular Toxicity Mechanism and Prevention. J. cancer Prev 20, 232–240. [DOI] [PMC free article] [PubMed] [Google Scholar]
- (26).De Bont R, and van Larebeke N (2004) Endogenous DNA damage in humans: a review of quantitative data. Mutagenesis 19, 169–185. [DOI] [PubMed] [Google Scholar]
- (27).Altieri F, Grillo C, Maceroni M, and Chichiarelli S (2008) DNA damage and repair: from molecular mechanisms to health implications. Antioxid. Redox Signaling 10, 891–937. [DOI] [PubMed] [Google Scholar]
- (28).Limón-Pacheco J, and Gonsebatt ME (2009) The role of antioxidants and antioxidant-related enzymes in protective responses to environmentally induced oxidative stress. Mutat. Res., Genet. Toxicol. Environ. Mutagen 674, 137–147. [DOI] [PubMed] [Google Scholar]
- (29).Lushchak VI (2011) Environmentally induced oxidative stress in aquatic animals. Aquat. Toxicol 101, 13–30. [DOI] [PubMed] [Google Scholar]
- (30).Ma Q, and He X (2012) Molecular basis of electrophilic and oxidative defense: promises and perils of Nrf2. Pharmacol. Rev 64, 1055–1081. [DOI] [PMC free article] [PubMed] [Google Scholar]
- (31).Cichoz-Lach H, and Michalak A (2014) Oxidative stress as a crucial factor in liver diseases. World J. Gastroenterol 20, 8082–8091. [DOI] [PMC free article] [PubMed] [Google Scholar]
- (32).Ashraf NU, and Sheikh TA (2015) Endoplasmic reticulum stress and Oxidative stress in the pathogenesis of Non-alcoholic fatty liver disease. Free Radical Res. 49, 1405–1418. [DOI] [PubMed] [Google Scholar]
- (33).Masarone M, Rosato V, Dallio M, Gravina AG, Aglitti A, Loguercio C, Federico A, and Persico M (2018) Role of Oxidative Stress in Pathophysiology of Nonalcoholic Fatty Liver Disease. Oxid. Med. Cell. Longevity 2018, 9547613. [DOI] [PMC free article] [PubMed] [Google Scholar]
- (34).Zhao N, Guo F-F, Xie K-Q, and Zeng T (2018) Targeting Nrf-2 is a promising intervention approach for the prevention of ethanol-induced liver disease. Cell. Mol. Life Sci 75, 3143–3157. [DOI] [PMC free article] [PubMed] [Google Scholar]
- (35).Calabrese V, Cornelius C, Dinkova-Kostova AT, Calabrese EJ, and Mattson MP (2010) Cellular stress responses, the hormesis paradigm, and vitagenes: novel targets for therapeutic intervention in neurodegenerative disorders. Antioxid. Redox Signaling 13, 1763–1811. [DOI] [PMC free article] [PubMed] [Google Scholar]
- (36).Yan MH, Wang X, and Zhu X (2013) Mitochondrial defects and oxidative stress in Alzheimer disease and Parkinson disease. Free Radical Biol. Med 62, 90–101. [DOI] [PMC free article] [PubMed] [Google Scholar]
- (37).Johnson DA, and Johnson JA (2015) Nrf2–a therapeutic target for the treatment of neurodegenerative diseases. Free Radical Biol. Med 88, 253–267. [DOI] [PMC free article] [PubMed] [Google Scholar]
- (38).Tezel G (2006) Oxidative Stress in Glaucomatous Neurodegeneration: Mechanisms and Consequences. Prog. Retinal Eye Res 25, 490–513. [DOI] [PMC free article] [PubMed] [Google Scholar]
- (39).Gupta SC, Hevia D, Patchva S, Park B, Koh W, and Aggarwal BB (2012) Upsides and downsides of reactive oxygen species for cancer: the roles of reactive oxygen species in tumorigenesis, prevention, and therapy. Antioxid. Redox Signaling 16, 1295–1322. [DOI] [PMC free article] [PubMed] [Google Scholar]
- (40).Toyokuni S (2016) The origin and future of oxidative stress pathology: From the recognition of carcinogenesis as an iron addiction with ferroptosis-resistance to non-thermal plasma therapy. Pathol. Int 66, 245–259. [DOI] [PubMed] [Google Scholar]
- (41).Valko M, Rhodes CJ, Moncol J, Izakovic M, and Mazur M (2006) Free radicals, metals and antioxidants in oxidative stress-induced cancer. Chem.-Biol. Interact 160, 1–40. [DOI] [PubMed] [Google Scholar]
- (42).Valko M, Leibfritz D, Moncol J, Cronin MTD, Mazur M, and Telser J (2007) Free radicals and antioxidants in normal physiological functions and human disease. Int. J. Biochem. Cell Biol 39, 44–84. [DOI] [PubMed] [Google Scholar]
- (43).Pizzino G, Bitto A, Interdonato M, Galfo F, Irrera N, Mecchio A, Pallio G, Ramistella V, Luca F, Minutoli L, Squadrito F, and Altavilla D (2014) Oxidative stress and DNA repair and detoxification gene expression in adolescents exposed to heavy metals living in the Milazzo-Valle del Mela area (Sicily, Italy). Redox Biol. 2, 686–693. [DOI] [PMC free article] [PubMed] [Google Scholar]
- (44).Palmer M (2014) Biochemical Pharmacology. John Wiley & Sons, Hoboken, NJ. [Google Scholar]
- (45).Willcox JK, Ash SL, and Catignani GL (2004) Antioxidants and prevention of chronic disease. Crit. Rev. Food Sci. Nutr 44, 275–295. [DOI] [PubMed] [Google Scholar]
- (46).Montezano AC, Dulak-Lis M, Tsiropoulou S, Harvey A, Briones AM, and Touyz RM (2015) Oxidative stress and human hypertension: vascular mechanisms, biomarkers, and novel therapies. Can. J. Cardiol 31, 631–641. [DOI] [PubMed] [Google Scholar]
- (47).Korsager Larsen M, and Matchkov VV (2016) Hypertension and physical exercise: The role of oxidative stress. Medicina (Kaunas). 52, 19–27. [DOI] [PubMed] [Google Scholar]
- (48).Chatterjee M, Saluja R, Kanneganti S, Chinta S, and Dikshit M (2007) Biochemical and molecular evaluation of neutrophil NOS in spontaneously hypertensive rats. Cell. Mol. Biol. (Noisy-le-grand) 53, 84–93. [PubMed] [Google Scholar]
- (49).Mimura J, and Itoh K (2015) Role of Nrf2 in the pathogenesis of atherosclerosis. Free Radical Biol. Med 88, 221–232. [DOI] [PubMed] [Google Scholar]
- (50).Osborne NN, Casson RJ, Wood JPM, Chidlow G, Graham M, and Melena J (2004) Retinal ischemia: mechanisms of damage and potential therapeutic strategies. Prog. Retinal Eye Res 23, 91–147. [DOI] [PubMed] [Google Scholar]
- (51).Lagana AS, Sofo V, Salmeri FM, Palmara VI, Triolo O, Terzic MM, Patrelli TS, Lukanovic A, Bokal EV, and Santoro G (2016) Oxidative Stress during Ovarian Torsion in Pediatric and Adolescent Patients: Changing The Perspective of The Disease. Int. J. Fertil. Steril 9, 416–423. [DOI] [PMC free article] [PubMed] [Google Scholar]
- (52).Ma Q (2013) Role of nrf2 in oxidative stress and toxicity. Annu. Rev. Pharmacol. Toxicol 53, 401–26. [DOI] [PMC free article] [PubMed] [Google Scholar]
- (53).Dinkova-Kostova AT, and Talalay P (2008) Direct and indirect antioxidant properties of inducers of cytoprotective proteins. Mol. Nutr. Food Res 52, 128–138. [DOI] [PubMed] [Google Scholar]
- (54).He X, and Ma Q (2009) NRF2 cysteine residues are critical for oxidant/electrophile-sensing, Kelch-like ECH-associated protein-1-dependent ubiquitination-proteasomal degradation, and transcription activation. Mol. Pharmacol 76, 1265–1278. [DOI] [PMC free article] [PubMed] [Google Scholar]
- (55).López-Mirabal HR, and Winther JR (2008) Redox characteristics of the eukaryotic cytosol. Biochim. Biophys. Acta, Mol. Cell Res 1783, 629–640. [DOI] [PubMed] [Google Scholar]
- (56).Poole LB (2015) The basics of thiols and cysteines in redox biology and chemistry. Free Radical Biol. Med 80, 148–157. [DOI] [PMC free article] [PubMed] [Google Scholar]
- (57).Circu ML, and Aw TY (2012) Glutathione and modulation of cell apoptosis. Biochim. Biophys. Acta, Mol. Cell Res 1823, 1767–1777. [DOI] [PMC free article] [PubMed] [Google Scholar]
- (58).Nguyen T, Nioi P, and Pickett CB (2009) The Nrf2-Antioxidant Response Element Signaling Pathway and Its Activation by Oxidative Stress. J. Biol. Chem 284, 13291–13295. [DOI] [PMC free article] [PubMed] [Google Scholar]
- (59).Itoh K, Wakabayashi N, Katoh Y, Ishii T, Igarashi K, Engel JD, and Yamamoto M (1999) Keap1 represses nuclear activation of antioxidant responsive elements by Nrf2 through binding to the amino-terminal Neh2 domain. Genes Dev. 13, 76–86. [DOI] [PMC free article] [PubMed] [Google Scholar]
- (60).Canning P, Sorrell FJ, and Bullock AN (2015) Structural basis of Keap1 interactions with Nrf2. Free Radical Biol. Med 88, 101–107. [DOI] [PMC free article] [PubMed] [Google Scholar]
- (61).Itoh K, Wakabayashi N, Katoh Y, Ishii T, O’Connor T, and Yamamoto M (2003) Keap1 regulates both cytoplasmic-nuclear shuttling and degradation of Nrf2 in response to electrophiles. Genes Cells 8, 379–391. [DOI] [PubMed] [Google Scholar]
- (62).McMahon M, Itoh K, Yamamoto M, and Hayes JD (2003) Keap1-dependent proteasomal degradation of transcription factor Nrf2 contributes to the negative regulation of antioxidant response element-driven gene expression. J. Biol. Chem 278, 21592–21600. [DOI] [PubMed] [Google Scholar]
- (63).Gong P, Stewart D, Hu B, Vinson C, and Alam J (2002) Multiple basic-leucine zipper proteins regulate induction of the mouse heme oxygenase-1 gene by arsenite. Arch. Biochem. Biophys 405, 265–274. [DOI] [PubMed] [Google Scholar]
- (64).Ma Q (2010) Transcriptional responses to oxidative stress: Pathological and toxicological implications. Pharmacol. Ther 125, 376–393. [DOI] [PubMed] [Google Scholar]
- (65).Itoh K, Chiba T, Takahashi S, Ishii T, Igarashi K, Katoh Y, Oyake T, Hayashi N, Satoh K, Hatayama I, Yamamoto M, and Nabeshima Y (1997) An Nrf2/small Maf heterodimer mediates the induction of phase II detoxifying enzyme genes through antioxidant response elements. Biochem. Biophys. Res. Commun 236, 313–322. [DOI] [PubMed] [Google Scholar]
- (66).Motohashi H, and Yamamoto M (2004) Nrf2-Keap1 defines a physiologically important stress response mechanism. Trends Mol. Med 10, 549–557. [DOI] [PubMed] [Google Scholar]
- (67).Jaiswal AK (2004) Nrf2 signaling in coordinated activation of antioxidant gene expression. Free Radical Biol. Med 36, 1199–1207. [DOI] [PubMed] [Google Scholar]
- (68).Corrales J, Kristofco LA, Steele WB, Saari GN, Kostal J, Williams ES, Mills M, Gallagher EP, Kavanagh TJ, Simcox N, Shen LQ, Melnikov F, Zimmerman JB, Voutchkova-Kostal AM, Anastas PT, and Brooks BW (2017) Toward the Design of Less Hazardous Chemicals: Exploring Comparative Oxidative Stress in Two Common Animal Models. Chem. Res. Toxicol 30, 893–904. [DOI] [PubMed] [Google Scholar]
- (69).Botta D, Franklin CC, White CC, Krejsa CM, Dabrowski MJ, Pierce RH, Fausto N, and Kavanagh TJ (2004) Glutamate-cysteine ligase attenuates TNF-induced mitochondrial injury and apoptosis. Free Radical Biol. Med 37, 632–642. [DOI] [PubMed] [Google Scholar]
- (70).White CC, Viernes H, Krejsa CM, Botta D, and Kavanagh TJ (2003) Fluorescence-based microtiter plate assay for glutamate-cysteine ligase activity. Anal. Biochem 318, 175–180. [DOI] [PubMed] [Google Scholar]
- (71).Sebaugh JL (2011) Guidelines for accurate EC50/IC50 estimation. Pharm. Stat 10, 128–134. [DOI] [PubMed] [Google Scholar]
- (72).(2015) R: A language and environment for statistical computing. R Foundation for Statistical Computing, Vienna, Austria: http://www.r-project.org/. [Google Scholar]
- (73).Krzanowski WJ, Ed. (1988) Principles of Multivariate Analysis: A User’s Perspective; Oxford University Press, Inc., New York. [Google Scholar]
- (74).Kao D, Chaintreau A, Lepoittevin JP, and Giménez-Arnau E (2014) Mechanistic studies on the reactivity of sensitizing allylic hydroperoxides: Investigation of the covalent modification of amino acids by carbon-radical intermediates. Toxicol. Res. (Cambridge, U. K.) 3, 278–289. [Google Scholar]
- (75).Kostal J, and Jorgensen WL (2010) Thorpe-ingold acceleration of oxirane formation is mostly a solvent effect. J. Am. Chem. Soc 132, 8766–8773. [DOI] [PMC free article] [PubMed] [Google Scholar]
- (76).Meunier B, de Visser SP, and Shaik S (2004) Mechanism of oxidation reactions catalyzed by cytochrome P450 enzymes. Chem. Rev 104, 3947–3980. [DOI] [PubMed] [Google Scholar]
- (77).Trott O, and Olson A (2009) AutoDock Vina: improving the speed and accuracy of docking with a new scoring function, efficient optimization and multithreading. J. Comput. Chem 31, 455–461. [DOI] [PMC free article] [PubMed] [Google Scholar]
- (78).Frisch MJ, Trucks GW, Schlegel HB, Scuseria GE, Robb MA, Cheeseman JR, Scalmani G, Barone V, Mennucci B, Petersson GA, Nakatsuji H, Caricato M, Li X, Hratchian HP, Izmaylov AF, Bloino J, Zheng G, Sonnenberg JL, Hada M, Ehara M, Toyota K,R, Fukuda, Hasegawa J, Ishida M, Nakajima T, Honda Y, Kitao O, Nakai H, Vreven T, Montgomery JA Jr., Peralta JE, Ogliaro F, Bearpark M, Heyd JJ, Brothers E, Kudin KN, Staroverov VN, Kobayashi R, Normand J, Raghavachari K, Rendell A, Burant JC, Iyengar SS,J, Tomasi Cossi, M., Rega N, Millam JM, Klene M, Knox JE, Cross JB, Bakken V, Adamo C, Jaramillo J, Gomperts R, Stratmann RE, Yazyev O, Austin AJ, Cammi R, Pomelli C, Ochterski JW, Martin RL, Morokuma K, Zakrzewski VG, Voth GA, Salvador P, Dannenberg JJ, Daniels AD, Farkas O, Foresman JB, Ortiz JV, Cioslowski J, and Fox DJ (2009) Gaussian 09, Revision A.1; Gaussian, Inc.: Wallingford CT. [Google Scholar]
- (79).Marvel SW, To K, Grimm FA, Wright FA, Rusyn I, and Reif DM (2018) ToxPi Graphical User Interface 2.0: Dynamic exploration, visualization, and sharing of integrated data models. BMC Bioinf. 19, 80. [DOI] [PMC free article] [PubMed] [Google Scholar]
- (80).Liddell JR, Dringen R, Crack PJ, and Robinson SR (2006) Glutathione peroxidase 1 and a high cellular glutathione concentration are essential for effective organic hydroperoxide detoxification in astrocytes. Glia 54, 873–879. [DOI] [PubMed] [Google Scholar]
- (81).Sayyed FB, and Suresh CH (2009) Quantification of substituent effects using molecular electrostatic potentials: Additive nature and proximity effects. New J. Chem 33, 2465–2471. [Google Scholar]
- (82).Leung CS, Leung SSF, Tirado-Rives J, and Jorgensen WL (2012) Methyl Effects on Protein-Ligand Binding. J. Med. Chem 55, 4489–4500. [DOI] [PMC free article] [PubMed] [Google Scholar]
- (83).Ma Q, and He X (2012) Molecular Basis of Electrophilic and Oxidative Defense: Promises and Perils of Nrf2. Pharmacol. Rev 64, 1055–1081. [DOI] [PMC free article] [PubMed] [Google Scholar]
- (84).LoPachin RM, Gavin T, DeCaprio A, and Barber DS (2012) Application of the Hard and Soft, Acids and Bases (HSAB) theory to toxicant - Target interactions. Chem. Res. Toxicol 25, 239–251. [DOI] [PMC free article] [PubMed] [Google Scholar]
- (85).Higgins LG, and Hayes JD (2011) The cap’n’collar transcription factor Nrf2 mediates both intrinsic resistance to environmental stressors and an adaptive response elicited by chemopreventive agents that determines susceptibility to electrophilic xenobiotics. Chem.-Biol. Interact 192, 37–45. [DOI] [PubMed] [Google Scholar]
- (86).Kensler TW, Wakabayashi N, and Biswal S (2007) Cell survival responses to environmental stresses via the Keap1-Nrf2-ARE pathway. Annu. Rev. Pharmacol. Toxicol 47, 89–116. [DOI] [PubMed] [Google Scholar]
- (87).Mukaigasa K, Nguyen LTP, Li L, Nakajima H, Yamamoto M, and Kobayashi M (2012) Genetic Evidence of an Evolutionarily Conserved Role for Nrf2 in the Protection against Oxidative Stress. Mol. Cell. Biol 32, 4455–4461. [DOI] [PMC free article] [PubMed] [Google Scholar]
- (88).Maher JM, Dieter MZ, Aleksunes LM, Slitt AL, Guo G, Tanaka Y, Scheffer GL, Chan JY, Manautou JE, Chen Y, Dalton TP, Yamamoto M, and Klaassen CD (2007) Oxidative and electrophilic stress induces multidrug resistance-associated protein transporters via the nuclear factor-E2-related factor-2 transcriptional pathway. Hepatology 46, 1597–1610. [DOI] [PubMed] [Google Scholar]
- (89).Yamamoto M, Kensler TW, and Motohashi H (2018) The KEAP1-NRF2 System: a Thiol-Based Sensor-Effector Apparatus for Maintaining Redox Homeostasis. Physiol. Rev 98, 1169–1203. [DOI] [PMC free article] [PubMed] [Google Scholar]
- (90).Dannenmann B, Lehle S, Hildebrand DG, Kübler A, Grondona P, Schmid V, Holzer K, Fröschl M, Essmann F, Rothfuss O, and Schulze-Osthoff K (2015) High Glutathione and Glutathione Peroxidase-2 Levels Mediate Cell-Type-Specific DNA Damage Protection in Human Induced Pluripotent Stem Cells. Stem Cell Rep. 4, 886–898. [DOI] [PMC free article] [PubMed] [Google Scholar]
- (91).Forman HJ, Zhang H, and Rinna A (2009) Glutathione: Overview of its protective roles, measurement, and biosynthesis. Mol. Aspects Med 30, 1–12. [DOI] [PMC free article] [PubMed] [Google Scholar]
- (92).O’Brian PJ (1991) Molecular mechanisms of quinone cytotoxicity. Chem.-Biol. Interact 80, 1–41. [DOI] [PubMed] [Google Scholar]
- (93).Ogawa Y, Saito Y, Nishio K, Yoshida Y, Ashida H, and Niki E (2008) γ-Tocopheryl quinone, not α-tocopheryl quinone, induces adaptive response through up-regulation of cellular glutathione and cysteine availability via activation of ATF4. Free Radical Res. 42, 674–687. [DOI] [PubMed] [Google Scholar]
- (94).Wang X, Thomas B, Sachdeva R, Arterburn L, Frye L, Hatcher PG, Cornwell DG, and Ma J (2006) Mechanism of arylating quinone toxicity involving Michael adduct formation and induction of endoplasmic reticulum stress. Proc. Natl. Acad. Sci. U. S. A 103, 3604–3609. [DOI] [PMC free article] [PubMed] [Google Scholar]
- (95).Gant TW, Rao DN, Mason RP, and Cohen GM (1988) Redox cycling and sulphydryl arylation; their relative importance in the mechanism of quinone cytotoxicity to isolated hepatocytes. Chem.-Biol. Interact 65, 157–173. [DOI] [PubMed] [Google Scholar]
- (96).Kolšek K, Sollner Dolenc M, and Mavri J (2013) Computational study of the reactivity of bisphenol A-3,4-quinone with deoxyadenosine and glutathione. Chem. Res. Toxicol 26, 106–111. [DOI] [PubMed] [Google Scholar]
- (97).Kolšek K, Mavri J, and Sollner Dolenc M (2012) Reactivity of bisphenol A-3,4-quinone with DNA. A quantum chemical study. Toxicol. In Vitro 26, 102–106. [DOI] [PubMed] [Google Scholar]
- (98).Kovacic P (2010) How safe is bisphenol A? Fundamentals of toxicity: Metabolism, electron transfer and oxidative stress. Med. Hypotheses 75, 1–4. [DOI] [PubMed] [Google Scholar]
- (99).Arlt A, Sebens S, Krebs S, Geismann C, Grossmann M, Kruse ML, Schreiber S, and Schäfer H (2013) Inhibition of the Nrf2 transcription factor by the alkaloid trigonelline renders pancreatic cancer cells more susceptible to apoptosis through decreased proteasomal gene expression and proteasome activity. Oncogene 32, 4825–4835. [DOI] [PubMed] [Google Scholar]
- (100).Bahia PK, Pugh V, Hoyland K, Hensley V, Rattray M, and Williams RJ (2012) Neuroprotective effects of phenolic antioxidant tBHQ associate with inhibition of FoxO3a nuclear translocation and activity. J. Neurochem 123, 182–191. [DOI] [PMC free article] [PubMed] [Google Scholar]
- (101).Jin XL, Wang K, Liu L, Liu HY, Zhao F-Q, and Liu JX (2016) Nuclear factor-like factor 2-antioxidant response element signaling activation by tert-butylhydroquinone attenuates acute heat stress in bovine mammary epithelial cells. J. Dairy Sci 99, 9094–9103. [DOI] [PubMed] [Google Scholar]
- (102).Watanabe BN, Dickinson DA, Liu R, and Forman HJ (2004) Quinones and Glutathione Metabolism. Methods Enzymol. 378, 319–340. [DOI] [PubMed] [Google Scholar]
- (103).Krejsa CM, Franklin CC, White CC, Ledbetter JA, Schieven GL, and Kavanagh TJ (2010) Rapid activation of glutamate cysteine ligase following oxidative stress. J. Biol. Chem 285, 16116–16124. [DOI] [PMC free article] [PubMed] [Google Scholar]
- (104).Glorieux C, Sandoval JM, Dejeans N, Ameye G, Poirel HA, Verrax J, and Calderon PB (2016) Overexpression of NAD(P)H:quinone oxidoreductase 1 (NQO1) and genomic gain of the NQO1 locus modulates breast cancer cell sensitivity to quinones. Life Sci. 145, 57–65. [DOI] [PubMed] [Google Scholar]
- (105).Dinkova-Kostova AT, and Talalay P (2010) NAD(P)H:quinone acceptor oxidoreductase 1 (NQO1), a multifunctional antioxidant enzyme and exceptionally versatile cytoprotector. Arch. Biochem. Biophys 501, 116–123. [DOI] [PMC free article] [PubMed] [Google Scholar]
- (106).Siraki AG, Chan TS, and O’Brien PJ (2004) Application of quantitative structure-toxicity relationships for the comparison of the cytotoxicity of 14 p-benzoquinone congeners in primary cultured rat hepatocytes versus PC12 cells. Toxicol. Sci 81, 148–159. [DOI] [PubMed] [Google Scholar]
- (107).Imhoff BR, and Hansen JM (2010) Tert-butylhydroquinone induces mitochondrial oxidative stress causing Nrf2 activation. Cell Biol. Toxicol 26, 541–551. [DOI] [PubMed] [Google Scholar]
- (108).Stoycheva T, Pesheva M, and Venkov P (2016) Oxidative stress generated by Carcinogens in Saccharomyces Cerevisiae allows their detection with a short-tem test. Genet. Plant Physiol 6, 142–157. [Google Scholar]
- (109).Gassman NR (2017) Induction of oxidative stress by bisphenol A and its pleiotropic effects. Environ. Mol. Mutagen 58, 60–71. [DOI] [PMC free article] [PubMed] [Google Scholar]
- (110).Wu Q, Fang J, Li S, Wei J, Yang Z, Zhao H, Zhao C, and Cai Z (2017) Interaction of bisphenol A 3,4-quinone metabolite with glutathione and ribonucleosides/deoxyribonucleosides in vitro. J. Hazard. Mater 323, 195–202. [DOI] [PubMed] [Google Scholar]
- (111).Atkinson A, and Roy D (1995) In vivo DNA adduct formation by bisphenol A. Environ. Mol. Mutagen 26, 60–66. [DOI] [PubMed] [Google Scholar]
- (112).Jaeg JP, Perdu E, Dolo L, Debrauwer L, Cravedi JP, and Zalko D (2004) Characterization of new bisphenol A metabolites produced by CD1 mice liver microsomes and S9 fractions. J. Agric. Food Chem 52, 4935–4942. [DOI] [PubMed] [Google Scholar]
- (113).Guo J, Zhao MH, Shin KT, Niu YJ, Ahn YD, Kim NH, and Cui XS (2017) The possible molecular mechanisms of bisphenol A action on porcine early embryonic development. Sci. Rep 7, 8632. [DOI] [PMC free article] [PubMed] [Google Scholar]
- (114).Ge LC, Chen ZJ, Liu H, Zhang KS, Su Q, Ma XY, Huang HB, Zhao ZD, Wang YY, Giesy JP, Du J, and Wang HS (2014) Signaling related with biphasic effects of bisphenol A (BPA) on Sertoli cell proliferation: A comparative proteomic analysis. Biochim. Biophys. Acta, Gen. Subj 1840, 2663–2673. [DOI] [PubMed] [Google Scholar]
- (115).Gualtieri AF, Iwachow MA, Venara M, Rey RA, and Schteingart HF (2011) Bisphenol A effect on glutathione synthesis and recycling in testicular Sertoli cells. J. Endocrinol. Invest 34, 102–109. [DOI] [PubMed] [Google Scholar]
- (116).Chepelev NL, Enikanolaiye MI, Chepelev LL, Almohaisen A, Chen Q, Scoggan KA, Coughlan MC, Cao XL, Jin X, and Willmore WG (2013) Bisphenol A activates the Nrf1/2-antioxidant response element pathway in HEK 293 cells. Chem. Res. Toxicol 26, 498–506. [DOI] [PubMed] [Google Scholar]
- (117).Walker CH (2008) Organic Pollutants, 2nd ed, CRC Press, Boca Raton, FL. [Google Scholar]
- (118).Beesoon S, and Martin JW (2015) Isomer-specific binding affinity of perfluorooctanesulfonate (PFOS) and perfluorooctanoate (PFOA) to serum proteins. Environ. Sci. Technol 49, 5722–5731. [DOI] [PubMed] [Google Scholar]
- (119).U.S. EPA (2016) Drinking Water Health Advisory for Perfluorooctanoic Acid (PFOA) EPA Document Number: 822-R-16–005, EPA, Washington, DC. [Google Scholar]
- (120).Liu C, Yu K, Shi X, Wang J, Lam PKS, Wu RSS, and Zhou B (2007) Induction of oxidative stress and apoptosis by PFOS and PFOA in primary cultured hepatocytes of freshwater tilapia (Oreochromis niloticus). Aquat. Toxicol 82, 135–143. [DOI] [PubMed] [Google Scholar]
- (121).Franklin CC, Backos DS, Mohar I, White CC, Forman HJ, and Kavanagh TJ (2009) Structure, function, and post-translational regulation of the catalytic and modifier subunits of glutamate cysteine ligase. Mol. Aspects Med 30, 86–98. [DOI] [PMC free article] [PubMed] [Google Scholar]
- (122).Schmitt B, Vicenzi M, Garrel C, and Denis FM (2015) Effects of N-acetylcysteine, oral glutathione (GSH) and a novel sublingual form of GSH on oxidative stress markers: A comparative crossover study. Redox Biol. 6, 198–205. [DOI] [PMC free article] [PubMed] [Google Scholar]
- (123).Mischley LK, Conley KE, Shankland EG, Kavanagh TJ, Rosenfeld ME, Duda JE, White CC, Wilbur TK, De La Torre PU, and Padowski JM (2016) Central nervous system uptake of intranasal glutathione in Parkinson’s disease. NPJ. Park. Dis 2, 16002. [DOI] [PMC free article] [PubMed] [Google Scholar]
- (124).Kannan R, Kuhlenkamp JF, Jeandidier E, Trinh H, Ookhtens M, and Kaplowitz N (1990) Evidence for carrier-mediated transport of glutathione across the blood-brain barrier in the rat. J. Clin. Invest 85, 2009–2013. [DOI] [PMC free article] [PubMed] [Google Scholar]
- (125).Pei Y, Liu H, Yang Y, Yang Y, Jiao Y, Tay FR, and Chen J (2018) Biological Activities and Potential Oral Applications of N-Acetylcysteine: Progress and Prospects. Oxid. Med. Cell. Longevity 2018, 1–14. [DOI] [PMC free article] [PubMed] [Google Scholar]
- (126).Dludla PV, Dias SC, Obonye N, Johnson R, Louw J, and Nkambule BB (2018) A Systematic Review on the Protective Effect of N-Acetyl Cysteine Against Diabetes-Associated Cardiovascular Complications. Am. J. Cardiovasc. Drugs 18, 283–298. [DOI] [PubMed] [Google Scholar]
- (127).Hara Y, McKeehan N, Dacks PA, and Fillit HM (2017) Evaluation of the Neuroprotective Potential of N-Acetylcysteine for Prevention and Treatment of Cognitive Aging and Dementia. J. Prev. Alzheimers Dis 4, 201–206. [DOI] [PubMed] [Google Scholar]
- (128).Minarini A, Ferrari S, Galletti M, Giambalvo N, Perrone D, Rioli G, and Galeazzi GM (2017) N-acetylcysteine in the treatment of psychiatric disorders: current status and future prospects. Expert Opin. Drug Metab. Toxicol 13, 279–292. [DOI] [PubMed] [Google Scholar]
- (129).Bavarsad Shahripour R, Harrigan MR, and Alexandrov AV (2014) N-acetylcysteine (NAC) in neurological disorders: Mechanisms of action and therapeutic opportunities. Brain Behav. 4, 108–122. [DOI] [PMC free article] [PubMed] [Google Scholar]
- (130).McConnachie LA, Mohar I, Hudson FN, Ware CB, Ladiges WC, Fernandez C, Chatterton-Kirchmeier S, White CC, Pierce RH, and Kavanagh TJ (2007) Glutamate cysteine ligase modifier subunit deficiency and gender as determinants of acetaminophen-induced hepatotoxicity in mice. Toxicol. Sci 99, 628–636. [DOI] [PubMed] [Google Scholar]
- (131).Botta D, White CC, Vliet-Gregg P, Mohar I, Shi S, McGrath MB, McConnachie LA, and Kavanagh TJ (2008) Modulating GSH Synthesis Using Glutamate Cysteine Ligase Transgenic and Gene-Targeted Mice. Drug Metab. Rev 40, 465–477. [DOI] [PubMed] [Google Scholar]
- (132).Ritz C, Baty F, Streibig JC, and Gerhard D (2015) Dose-response analysis using R. PLoS One 10, e0146021. [DOI] [PMC free article] [PubMed] [Google Scholar]
Associated Data
This section collects any data citations, data availability statements, or supplementary materials included in this article.


