

Abstract
Mitochondrial dysfunction is a metabolic hallmark of cancer cells. In search of molecular factors involved in this dysregulation in hepatocellular carcinoma (HCC), we found that the nuclear-encoded long noncoding RNA (lncRNA) MALAT1 (metastasis-associated lung adenocarcinoma transcript 1) was aberrantly enriched in the mitochondria of hepatoma cells. Using RNA reverse transcription-associated trap sequencing (RAT-seq), we showed that MALAT1 interacted with multiple loci on mitochondrial DNA (mtDNA), including D-loop, COX2, ND3, and CYTB genes. MALAT1 knockdown induced alterations in the CpG methylation of mtDNA and in mitochondrial transcriptomes. This was associated with multiple abnormalities in mitochondrial function, including altered mitochondrial structure, low oxidative phosphorylation (OXPHOS), decreased ATP production, reduced mitophagy, decreased mtDNA copy number, and activation of mitochondrial apoptosis. These alterations in mitochondrial metabolism were associated with changes in tumor phenotype and in pathways involved in cell mitophagy, mitochondrial apoptosis, and epigenetic regulation. We further showed that the RNA-shuttling protein HuR and the mitochondria transmembrane protein MTCH2 mediated the transport of MALAT1 in this nuclear-mitochondrial crosstalk. This study provides the first evidence that the nuclear genome-encoded lncRNA MALAT1 functions as a critical epigenetic player in the regulation of mitochondrial metabolism of hepatoma cells, laying the foundation for further clarifying the roles of lncRNAs in tumor metabolic reprogramming.
Keywords: mitochondria, long noncoding RNA, MALAT1, metabolic reprogramming, apoptosis, mitophagy, hepatocellular carcinoma
Graphical Abstract
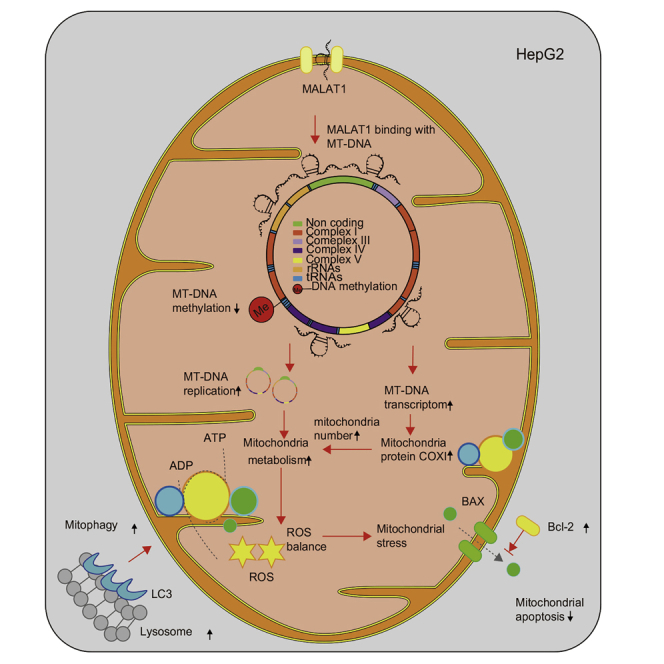
This study identified the nuclear genome-encoded lncRNA MALAT1 as a nucleus-to-mitochondria epigenetic messenger that controls metabolic reprogramming by regulating mitochondrial function in hepatocellular carcinoma cells.
Introduction
Dysregulation of cellular energetics has long been recognized as one of the hallmarks of malignancy, including hepatocellular carcinoma (HCC),1,2 as changes in mitochondrial bioenergetics, biosynthesis, and signaling are essential requirements for tumorigenesis.3 Cancer cells ferment glucose as the major metabolic pathway for proliferation even in the presence of oxygen, a paradoxical process known as aerobic glycolysis or the Warburg effect.4,5 The high level of reactive oxygen species (ROS) found in cancer cells induces genomic instability and ultimately tumorigenesis.6,7 Targeting this abnormal energy metabolism in cancer cells may become an important strategy in developing novel cancer therapeutics.
Long noncoding RNAs (lncRNAs) are critical regulators of cellular metabolism.8 Mitochondria-associated lncRNAs, including both the RNAs derived from mtDNA and from nuclear-encoded lncRNAs that are transported into the mitochondria, may work in concert with transcription factors and other epigenetic regulators to modulate mitochondrial gene expression and mitochondrial function. These mitochondria-associated lncRNAs are important components of several gene regulatory networks,9,10 potentially acting as epigenetic messengers to coordinate nuclear and mitochondrial functions.11,12 Abnormal regulation of mitochondria-associated lncRNAs may lead to cell aging and oncogenesis.10,13 Nuclear genome-encoded lncRNAs can function as “anterograde signals” to regulate mitochondrial function by hitching a ride with RNA transporters into mitochondria,12 while mitochondrial genome-transcribed lncRNAs may shuttle via RNA transporters to the nucleus, where they can regulate the function of the nuclear genome, acting as a “retrograde signal.” Using RNA fluorescence in situ hybridization (FISH) coupled with MitoTracker staining, we have recently shown that aberrant shuttling of lncRNAs, whether nuclear genome-encoded or mitochondrial genome-transcribed, may play a critical role in abnormal mitochondrial metabolism in cancer cells.14 For example, mitochondria genome-derived lncND6 and lncCytB were enriched in the nucleus, while the nuclear genome-transcribed lncRNA MALAT1 was found in the mitochondria of hepatocellular carcinoma cells. Therefore, lncRNAs may act as important messenger molecules linked to the regulation of both the nuclear and mitochondrial genomes.
In this study, we performed transcriptome sequencing to delineate the mitochondria-associated lncRNAs in HCC cells. We found that the nuclear genome-encoded lncRNA MALAT1 was highly enriched in the mitochondria of HepG2 cells, supporting the hypothesis that MALAT1 may act as an important factor in cancer metabolism reprogramming and mitochondrial function.14 Although MALAT1 is known to be involved in invasion and metastasis of numerous tumors,15,16 its role in the regulation of cancer cell mitochondria has not been appreciated. We propose that MALAT1 functions as a nuclear-mitochondrial epigenetic messenger to control metabolic reprogramming in HCC cells. Using the loss- and gain-of-function assays, we also explored the molecular mechanisms underlying the role of MALAT1 in mitochondria in HCC.
Results
Nuclear-Encoded lncRNA MALAT1 Is Aberrantly Enriched in the Mitochondria of Hepatoma Cells
To characterize regulatory components of metabolic reprogramming, we isolated mitochondria from hepatoma HepG2 cells (human hepatocellular carcinoma cell line) and normal hepatic HL7702 cells (human normal hepatocyte cell line). A modified protocol of the Mitochondria Isolation Kit was used to isolate mitochondria by avoiding contamination with nuclear RNAs. The isolated mitochondria were treated with RNase A prior to gradient purification. The quality of isolated mitochondria was assessed by quantitating the presence of small nuclear (snRNA) U6 control (Figure S1). We detected enrichment of MALAT1, but not U6, in isolated mitochondrial RNAs.
After validating the quality of isolated mitochondria, we performed RNA transcriptome sequencing (RNA-seq) to identify the RNAs residing in mitochondria (Figure 1A). Using the criteria of >2 fold-change, p < 0.05, and the threshold of fragments per kilobase of transcript per million (FPKM) mapped reads >50, we identified a total of 246 RNAs that were differentially expressed between HepG2 and HL7702 cells (Figure 1B). We assessed the quality of the mitochondrial RNA-seq data by examining IGV reads for nuclear snRNAs U6 and U2. As expected, we did not observe the presence of either U6 or U2 in the mitochondrial RNA-seq data (Figures S2B and S2C).
Figure 1.

Nuclear lncRNA MALAT1 Is Enriched in Mitochondria
(A) Identification of MALAT1 as a mitochondria-associated lncRNA by mitochondrial RNA-seq. HepG2: HCC cells; HL7702: normal hepatic cells. (B) Distribution of 247 mitochondria-associated RNAs. (C) Differential enrichment of MALAT1 in mitochondria comparing hepatoma HepG2 cells and normal hepatic HL7702 cells. MALAT1 was quantitated by quantitative real-time PCR. The Ct value was normalized over that of COX2 (mitochondrial housekeeping gene) and then standardized by setting normal HL7702 cells as 1 for comparison. ∗∗∗∗p < 0.0001 between two cell lines. (D) RNA FISH of mitochondria-associated MALAT1 in HepG2 cells. MALAT1 was probed with antisense oligonucleotide probes (red) provided in the Ribo Fluorescent In Situ Hybridization Kit (C10910, RiboBio). Mitochondria were labeled with MitoTracker (green). Cells were counterstained with DAPI and imaged under a confocal laser-scanning microscope (Carl Zeiss). Scale bar = 10 μm. Note the colocalization of MALAT1 and MitoTracker in individual mitochondria (enlarged windows). (E) Quantitation of MALAT1 RNA FISH images. Pearson’s correlation coefficient was calculated for the entire image (Rtotal) and the pixels above thresholds (Rcoloc) in 5 tested fields of view. (F) Scatterplot of MALAT1 and MitoTracker. Channel 1 (red), MALAT1; channel 2 (green), MitoTracker. The regression line is plotted along with the threshold level for channel 1 (vertical line) and channel 2 (horizontal line). Mean ± SEM is indicated in the right upper corner of the image.
In addition to those lncRNAs that have previously been reported to be located within the mitochondria, including RMRP, RPPH1, and RN7SK,12,17 we found that the nuclear genome-encoded MALAT1 was enriched in the mitochondria of HepG2 cells (Figures S1, S2D, and S2E). Using qPCR, we also confirmed that mitochondrial MALAT1 abundance was ∼12-fold higher in hepatoma HepG2 cells than that in normal hepatic HL7702 cells. In addition, this nuclear-encoded lncRNA was also abundantly localized in the mitochondria of two other human hepatoma cell lines (Huh751 and SMMC-7721) (Figure 1C).
We then validated the presence of MALAT1 lncRNA in the HepG2 mitochondria using RNA FISH. The location of mitochondria was tracked by a MitoTracker dye. Two types of fluorescence probes were used for RNA FISH. First, we used commercial fluorescent antisense oligonucleotide probes as provided in the Fluorescent In Situ Hybridization Kit (RiboBio, Guangzhou, China). We observed colocalization of MALAT1 (red) and MitoTracker (green) in individual, snake-, and small fragment-like mitochondria (Figure 1D, enlarged panels). Second, we performed RNA FISH using digoxigenin-11-deoxyuridine triphosphate ( DIG-11-dUTP)-labeled single-stranded DNA probes as prepared by asymmetric PCR.14 We confirmed the colocalization of MALAT1 (green) and MitoTracker (red) in individual mitochondria (Figure S3).Quantitation of RNA FISH also confirmed the localization of MALAT1 in mitochondria (Figures 1E, 1F, S3B, and S3C). The MALAT1-mitoTracker merged area of each field was quantified using the ImageJ and Particle Analysis Plugin.18,19 The quantitative co-localization was observed between MALAT1 and mitochondria, with Rcoloc values of 0.73 ± 0.03 for commercial antisense oligonucleotide probes and 0.61 ± 0.12 for single-stranded DNA probes. As expected, the co-localization signal of MALAT1 was decreased in cells that were transfected with shMALAT1 lentivirus (Figure S4).
To exclude the possibility that MALAT1 is located in the cytoplasm itself or in some other cytoplasmic organelles, we isolated mitochondria and performed the RNA FISH assay for the isolated mitochondria on smearing slides. By combining the MitoTracker and probe staining, we validated the presence of MALAT1 in the isolated mitochondria (Figure S5A, top panel). RNA FISH quantitation also confirmed the co-localization of MALAT1 in isolated mitochondria, with Rcoloc values of 0.91 ± 0.03 (Figures S5B and S5C). Like MALAT1, the lncRNA H19 is often overexpressed in HCC, and its dysregulation is closely related with tumorigenesis, metastasis, prognosis, and diagnosis.20,21 However, H19 was not found in the list of mtRNA-seq lncRNAs, and therefore we used H19 as a lncRNA control. H19 was not detected in isolated HepG2 mitochondria (Figure S5A, bottom panel). These data suggest that the nucleus-encoded lncRNA MALAT1 can be transported to the mitochondria in HepG2 cells.
MALAT1 Binds to mtDNA and Alters Its Epigenotype
In the nucleus, MALAT1 regulates multiple gene targets by altering epigenotypes where the lncRNA binds to DNA. For example, MALAT1 controls the histone 3 lysine 4 (H3K4) epigenotype in the EEF1A1 promoter.22 To determine whether MALAT1 utilizes a similar mechanism to regulate mitochondrial genes, we performed RNA reverse transcription-associated trap sequencing (RAT-seq)23, 24, 25 to identify the specific MALAT1-mtDNA interaction sites and found that MALAT1 interacted with multiple mtDNAs, including MT-RNR1, MT-RNR2, MT-CO2, MT-ND3, and MT-CYTB (Figure 2A, red arrows).
Figure 2.

MALAT1 Binds to mtDNAs and Affects Their Synthesis
(A) The binding of MALAT1 to mtDNAs. RNA reverse transcription-associated trap sequencing (RAT-seq) was performed to find the MALAT1-interacting mtDNAs. The red arrows point to the MALAT1 binding sites in the mitochondrial genome. (B) MALAT1-mtDNA interaction by ChIRP (chromatin isolation by RNA purification). Isolated mitochondria are cross-linked to fix the lncRNA-chromatin DNA complex. The lncRNA-interacting chromatin DNA is extracted, and the lncRNA-interacting target signal is quantitated by quantitative real-time PCR. For comparison, the Ct value was normalized over that of input and set the random probe control as 1. ∗∗∗p < 0.001 as compared with the random control group. (C) The mtDNA transcriptome in MALAT1 knockdown cells. The expression of each mitochondrial gene was quantitated by quantitative real-time PCR. Error bars represent the standard error of the average of three independent PCR reactions. Throughout the manuscript, the shCT group was set as 1 for comparison unless otherwise indicated. ∗∗∗∗p < 0.0001 between the treatment and control groups. (D) Measurement of the mitochondrial proteome. Western blot was utilized to detect the expression of MT-CO1 protein COX-1. (E) Mitochondria number. The number of mitochondria per cell was counted under transmission electron microscopy. n = 50 cells. ∗∗∗∗p < 0.0001 between groups. (F) mtDNA copy number. The mtDNA copy number was quantitated by quantitative real-time PCR for three mtDNA genes (ND1, CYB, and MT-CO2). ∗∗∗∗p < 0.0001 between groups. (G) Mitochondria. DNA replication factor SSBP1. The expression of SSBP1 was measured by quantitative real-time PCR. ∗∗∗∗p < 0.0001 between groups. (H) mtDNA replication factor PLOG1 by quantitative real-time PCR. ∗∗∗∗p < 0.0001 between groups. (I) mtDNA replication factor TFAM. The expression of TFAM was measured by quantitative real-time PCR. ∗∗∗∗p < 0.0001 between groups.
The MALAT1-mtDNA interaction was validated by a ChIRP assay (chromatin isolation by RNA purification). Mitochondria were isolated from HepG2 cells, and three 3′-end biotinylated oligonucleotide DNA probes were hybridized to MALAT1. The biotinylated probe/MALAT1/chromatin mtDNA complex was pulled down with streptavidin C1 beads, and mtDNA was quantitated by qPCR at the specific MALAT1-mtDNA interaction sites. This assay confirmed the binding of MALAT1 to the mtDNA at the D-loop, MT-CO2, and MT-ND3 sites (Figure 2B).
We recently reported that mitochondrial CpG DNA methylation changes during stem cell senescence.26 In order to determine if the binding of MALAT1 would alter the epigenotype at CpG islands of mtDNA, we used two short hairpin RNAs (shRNAs) to knock down MALAT1 in HepG2 cells by targeting the middle and the 3′ fragment of MALAT1 (Figure S6A).22 CpG methylation was then examined by sodium bisulfite sequencing (Figure S6B). Mitochondrial CpG island 3 was predominantly unmethylated in HepG2 cells. After MALAT1 knockdown, we observed increased DNA methylation at one CpG site of CpG island 3 (Figure S6C). The status of DNA methylation at CpG island 1, however, was not significantly affected by MALAT1.
We then determined if the binding of MALAT1 would affect the transcription of mitochondrial genes. After MALAT1 was knocked down using shRNA, we found decreased abundance of multiple mitochondrial genes, including MT-CO1, MT-CO2, MT-ND5, and MT-ND3 (Figure 2C). Western blot analysis also showed reduction in the corresponding proteins (Figure 2D).
In order to determine if MALAT1 regulates the morphology or number of mitochondria, we used transmission electron microscopy (TEM) and observed a reduction in mitochondria number in MALAT1-knockdown cells (Figure S7). The number of mitochondria was reduced by about half of the control cells (Figure 2E). As compared with the vector control (HepG2), the shRNA control group (shCT) also showed a slight reduction of mitochondrial number per cell (though not statistically different), suggesting that lentiviral infection itself may also have some effect on mitochondrial function.
We quantitated mitochondrial copy number by measuring DNA abundance from mitochondrial anterior, middle, and posterior genes, including MT-ND1, MT-CO2, and MT-CYB. In agreement with the electron microscopy data, we found that mtDNA copy number was significantly decreased after MALAT1 knockdown (Figure 2F).
mtDNA replication is independent of nuclear DNA replication, as mitochondria have their own replication complex.27 PLOγ is a mammalian DNA polymerase that is present in mitochondria.28 Mitochondrial single-stranded DNA-binding protein (mtSSBP) and Twinkle (TWNK) are mitochondrial helicases that work together to achieve helix destabilization during replication.29 TFAM (mitochondrial transcription factor A ) is an essential component of the nucleoid, which has been shown to be directly proportional to the mtDNA copy number.30 We measured the expression of these mtDNA replication complex genes and found that all of these genes were significantly downregulated in shMALAT1-1/2 cells, in parallel with the decreased mtDNA copy number (Figures 2G–2I).
MALAT1 Is Essential for Mitochondrial Function in HepG2 Cells
Having shown that MALAT1 affects mitochondrial number, we examined whether it participates in the regulation of mitochondrial biogenesis and energetics. MALAT1 knockdown cells exhibited a reduction in four phases of the real-time oxygen consumption rate (OCR): basal respiration, ATP-producing capability, maximum respiration, and spare respiratory capacity decline. After MALAT1 depletion, the basal respiration ability in HepG2 cells was reduced in comparison to that of the control cells (Figure 3A). However, there was no significant change in glycolytic function, as assessed by the extracellular acidification rate (ECAR) (Figure 3B). We then quantitated the mitochondria ATP-producing capability. MALAT1 knockdown significantly decreased ATP synthesis as compared with the controls (Figure 3C).
Figure 3.

MALAT1 Knockdown Induces Mitochondrial Dysfunction
(A) MALAT1 knockdown interferes with metabolic potentials in HepG2 cells. Metabolic potentials were assessed by measuring OCR. Treatment with shMALAT1-1 and shMALAT1-2 attenuated basal mitochondria respiration ability and relative OXPHOS ability. Data are presented as mean ± SEM from three independent assays. Significant differences were determined by one-way ANOVA followed by Tukey’s post hoc test. ∗∗∗∗p < 0.001 compared with the control groups. (B) Glycolytic function in MALAT1 knockdown cells. Glycolytic function was assessed by measuring ECAR. No statistical differences were detected among the treatment groups. Data are presented as mean ± SEM from three independent assays. (C) MALAT1 affects ATP production. The shMALAT1-1- and shMALAT1-2-treated cells show impaired ATP-producing ability compared with the control groups. (D) Fluorescence of the MitoSox-stained mitochondrial ROS. ∗∗∗∗p < 0.0001, ordinary one-way ANOVA, followed by Student’s t test. (E) Mitochondria Mn-SOD activities. ∗∗p = 0.0016, ordinary one-way ANOVA, followed by Student’s t test. (F) Mitochondrial ROS production. Mitochondrial ROS showed red fluorescence by MitoSox staining. Scale bar = 50 μm. MALAT1 knockdown cells show diminished ROS compared with control groups.
Cancer cells have increased production of mitochondrial-derived reactive oxygen species (mROS), a byproduct of the mitochondrial electron transport chain that may lead to the activation of tumorigenic signaling and metabolic reprogramming.31 We measured mROS using MitoSOX and found that mROS was significantly lower in the shMALAT1-1/2 cells than that in the control cells (Figures 3D and 3F). We also measured the activity of mitochondrial Mn-SOD, an antioxidative enzyme that eliminates mROS. We found that knocking down shMALAT1 significantly enhanced its specific enzymatic activity in the mitochondria (Figure 3E).
Enrichment of MALAT1 Affects Mitochondrial Apoptosis
Mitochondria apoptosis was increased in shMALAT1-treated HepG2 cells, where we observed swollen mitochondria, enlarged vesicular matrix compartments, small vesicular matrix compartments surrounding swollen vesicular compartments, and an absent inner boundary membrane (Figure 4A). In some mitochondria, two lamellar cristae were contained within a swollen matrix bound by an inner boundary membrane, and the outer membrane appeared to be ruptured. However, some differences in mitochondrial morphology were noticed between the two shRNA-treated groups. In the shMALAT1-1 group, mitochondria had an expanded matrix space with less dense staining of the matrix and fewer cristae, and the outer membrane was ruptured by the expanded matrix. However, the shMALAT1-2 group exhibited less severe apoptosis.
Figure 4.

Knockdown of MALAT1 Induces Mitochondrial Apoptosis
(A) Abnormal mitochondrial structure in MALAT1 knockdown HepG2 cells. Scale bar = 0.5 μm. Under TEM, mitochondria had swollen vesicular matrix compartments and small vesicular matrix compartments surrounding a swollen vesicular compartment. (B) Mitochondria apoptosis biomarkers. Western blot was used to measure the biomarkers for mitochondrial apoptosis, including Bcl-2, Bax, Caspase-3, and cytochrome C. β-Actin and MT-CO1 were used as the cytoplasmic and mitochondrial controls. (C) Quantitation of western blot results. Data are presented as mean ± SEM. Significant differences were determined by one-way ANOVA followed by Student’s t test. ∗∗∗∗p < 0.001 compared with the shCT group. (D) FACS analysis of cell death. Standard dot plot diagram from FACS shows the progression of cell death. Q1, double negative (annexin V and 7-AAD negative) represented healthy cells; Q2, annexin V positive and 7-AAD negative represented apoptotic cells; Q3, annexin V &7-AAD double positive represented necrotic cells. (E) Percentage of cell population. Apoptotic, healthy, and necrotic cells were quantitated by flow cytometry. ∗∗∗∗p < 0.0001 compared with the shCT control group. (F) Mitochondria membrane potential. The membrane potential was measured by JC-1 staining. FCCP was used as the positive control of cell apoptosis. In cells with high mitochondrial membrane potential, JC-1 spontaneously forms complexes with intense red fluorescence. In apoptotic or unhealthy cells, JC-1 was stained with green fluorescence. The ratio of green to red fluorescence is associated with the membrane potential. ∗∗∗∗p < 0.0001, ∗∗p < 0.01 compared with the shCT control group.
As seen in Figures 4B and 4C, MALAT1 knockdown induced a series of events related to mitochondrial apoptosis, including caspase-3 activation, increased expression of cytochrome C, and attenuated expression of Bcl-2. The mitochondrial apoptosis activator BAX was downregulated in shMALAT1-treated cells, suggesting that shMALAT1-induced apoptosis may not be derived from the formation of an activated BAX oligomeric pore.32 Again, we also observed some variations in apoptosis markers between the HepG2 and shCT controls. It is likely that the lentiviral infection itself may have some effect on these variables.
Apoptotic cells were further quantitated using Annexin V/7-AAD fluorescence-activated cell sorting (FACS) staining (Figures 4D and 4E). Standard dot plot diagrams from FACS illustrate the progression of cell death (Figure 4D). Q1, Q2, and Q3 represented healthy, apoptotic, and necrotic cells, respectively. We found that MALAT1 knockdown induced apoptosis in HepG2 cells. These findings demonstrate that MALAT1 is required for maintaining normal mitochondrial function by suppressing mitochondria-specific apoptosis.
We also measured mitochondria membrane potential using JC-1 staining (Figure 4F). JC-1 green fluorescence indicates a decrease in mitochondrial membrane potential, an early event in apoptosis. FCCP (carbonylcyanide p-(trifluoromethoxy) phenylhydrazone) was used as the positive control for cell apoptosis. We showed that MALAT1 knockdown increased the loss of mitochondrial membrane potential, confirming that knockdown of MALAT1 in HepG2 triggers an early event in apoptosis.
MALAT1 Functions via the Mitochondrial Autophagy Pathway
Damaged mitochondria are normally removed by a specialized autophagy process, called mitophagy. Selective autophagy targets different groups of substrates and damaged organelles for autophagosome-lysosomal degradation.33,34 Several pathways are activated in mitophagy. In the PINK1/Parkin pathway, phosphorylation of Parkin and binding to phosphorylated-ubiquitinated proteins result in the accumulation of ubiquitinated chains on a variety of mitochondrial proteins, which are recognized by selective cargo receptors, including SQSTM1/p62, Optineurin, and NDP52.35,36 In the BNIP3L/Nix pathway, BNIP3 and BNIP3L/Nix bind to members of the LC3 family to target mitochondria to autophagosomes. We were interested to learn whether mitochondrial MALAT1 might be involved in the regulation of this mitophagy pathway.
We used western blot to measure these mitophagy pathway proteins. shMALAT1-treated cells exhibited a significant decrease in mitophagy events. Compared with the control cells, MALAT1 knockdown cells showed reduced expression of mitophagy markers, particularly PINK1, SQSTM1/p62, NDP52, BNIP3, and LC3B-I/II (Figures 5A and 5B).
Figure 5.

MALAT1 Knockdown Impairs Mitophagy
(A) Mitophagy biomarkers were detected by western blot. β-Actin was used as the control. (B) Quantitation of mitophagy biomarker western blot results. ∗∗∗∗p < 0.0001, ∗∗p < 0.01 compared with the shCT control group. (C) The LC3B II/I ratio. Autophagy was assessed by LC3B-II/I ratio. After knockdown of MALAT1, the LC3B-II/I ratio was significantly decreased. ∗∗∗∗p < 0.0001 compared with the shCT control group. (D) Acidic lysosome by Lysotracker staining. The intensity of the fluorescence stained by lysotracker was measured. ∗∗∗∗p < 0.0001 compared with the shCT control group.
Microtubule-associated protein 1 light chain 3 (LC3) plays a critical role in autophagy. The LC3B II/I ratio, designated the cytosolic LC3 ratio, reflects the total proteolytic flux and is a sensitive quantitative index to monitor autophagy in the cell. The LC3B-II/I ratio increases when autophagy is induced. After MALAT1 knockdown, the LC3B-II/I ratio was significantly decreased (Figure 5C), suggesting the critical role of MALAT1 in this autophagy process.
We also examined mitochondria and lysosomal surface markers. There was a decrease in the mitochondria outer membrane marker Cyclophilin F (CYDP) and an increase in the lysosome-associated membrane glycoprotein (LAMP-1) (Figures S8A and S8B). Lysosomal enzymes function optimally in an acidic environment, and increases in lysosomal pH can impede enzymatic ability. We labeled lysosomes using lysotracker and found that the number of red-stained (acidic) lysosomes decreased significantly in the MALAT1-treated cells compared with the control group cells (Figures 5D and S8C), suggesting impairment of lysosomal function in MALAT1-deficient cells.
Effect of MALAT1 on the Biological Behavior of Hepatocellular Carcinoma Cells
MALAT1 is associated with lung carcinoma invasion and metastasis. We examined the invasion of shMALAT1-1/2 cells using Transwell assays and found that the average number of invading MALAT1 knockdown cells was significantly lower than that from HepG2 random vector cells (shCT) (Figure 6A). Similarly, MALAT1 knockdown also altered cell proliferation (Figure 6B), wound healing (Figure 6C), progression through the cell cycle (Figure S9A), and clone formation (Figure S9B).
Figure 6.

MALAT1 Affects Cancer Biology Behavior
(A) MALAT1 knockdown cells showed decreased cell invasion ability. Ordinary one-way ANOVA, followed by Student’s t test. ∗∗∗∗p < 0.0001 compared with the shCT control group. (B) Cell proliferation assay. Total cells were counted after 24 h, 48 h, 72 h, and 96 h. Ordinary one-way ANOVA, followed by Student’s t test. ∗∗∗∗p < 0.0001 compared with the shCT control group. (C) Wound healing assay. Scale bar = 50 μm. MALAT1 knockdown cells showed slower wound healing capability indicating slower migration ability. (D) The putative model of MALAT1 as an epigenetic messenger in controlling cancer metabolism. MALAT1 is aberrantly expressed in HCC mitochondria, where it binds to mtDNA and alters mtDNA methylation and mitochondrial function, including mitochondria synthesis, metabolism, mitophagy, ROS regulation, and apoptosis.
In an initial step to examine the shuttling of nuclear MALAT1 to mitochondria, we isolated mitochondria from HepG2 cells and performed RNA chromatin precipitation (RNA immunoprecipitation [RIP]) for HuR12,37,38 and MTCH2 (mitochondrial carrier homolog 2).39, 40, 41 MALAT1 interacted with MTCH2 both in the whole cell (Figure S10A) and in isolated mitochondria (Figure S10B). MALAT1 also interacted with HuR (Figure S10C). These data suggest that MALAT1 may be shuttled by the HuR and MTCH2 complexes into mitochondria, where MALAT1 regulates metabolism and apoptosis (Figure 6D).
Discussion
MALAT1, a highly conserved lncRNA, exerts an oncogenic role in multiple cancers, including HCC. Previous work has mainly focused on the role of MALAT1 in metastasis, prognosis, and tumorigenesis,15,42 but its role in mitochondrial dysfunction and aberrant energy metabolism has not been examined. In this study, we provide the first evidence that in hepatoma HepG2 cells, the nuclear genome-encoded lncRNA MALAT1 is aberrantly transported to the mitochondria, where it plays a pivotal role in regulating mitochondrial function. MALAT1 binds to multiple loci on mtDNA, where it epigenetically regulates mitochondrial function. Knockdown of MALAT1 induces alterations in the structure, transcriptome, and function of mitochondria. MALAT1-deficient cells show multiple abnormalities in mitochondrial function, including mitochondrial copy number, oxidative phosphorylation (OXPHOS), ATP production, mitophagy, and apoptosis. This study suggests that the nuclear genome-encoded lncRNA MALAT1 may function as an epigenetic factor in the regulation of mitochondrial metabolism in HCC cells (Figure 6D).
The mitochondrial genome consists of 16,569 base pairs of DNA that encode 37 genes to synthesize core subunits of the oxidative phosphorylation system.43,44 The mitochondrial genome, however, cannot independently produce all of the protein components needed for energy metabolism. Instead, mitochondria rely heavily on imported proteins, and perhaps RNAs, encoded by the nuclear genome.9,10 Here, we provide the first evidence that MALAT1 lncRNA may function as an epigenetic messenger to coordinate a variety of functions between the nucleus and the mitochondria. MALAT1 does not encode a protein, but it is able to bind to mtDNAs and epigenetically regulate mitochondrial function. Inhibition of this MALAT1-mediated communication network interrupts the function of mitochondria, including mitochondrial biosynthesis and energy metabolism. In addition, MALAT1 knockdown stimulates mitochondrial apoptosis and suppresses mitophagy. Recently, we also demonstrated that lncCytB, a mitochondrial genome-encoded lncRNA, can be aberrantly transported into the nucleus in HepG2 cells.22 Clearly, there is significant crosstalk between the nucleus and mitochondria that can modify cancer cell metabolism.9,45 Shuttled lncRNAs, such as the nuclear genome-encoded MALAT1 and the mitochondrial genome-encoded lncCytB, may function as essential molecules to deliver epigenetic signals to tightly coordinate mitochondrial and nuclear function.9,10
MALAT1 was first identified as an oncogenic lncRNA in association with the survival and metastasis of non-small-cell lung cancer. Recent studies have also associated its expression with the survival and progression of multiple malignancies, including uterine endometrial stromal sarcoma, breast cancer, and HCC.46,47 Although its association with clinical outcomes has been well studied, its mechanism of action has not been well characterized. Several studies have been focused on its role as a competing endogenous RNA (ceRNA) to regulate microRNAs (miRNAs), including miR-195, miR-183, miR-23c, miR-155, miR-197, miR-203, and miR-20b-5p. Our data reveal a novel mechanism for MALAT1 action in cancer. In the mitochondria, MALAT1 regulates energy metabolism, mtDNA replication, transcription, mitochondrial apoptosis, mitophagy, and mitochondria stability.
Autophagy (macroautophagy) is a fundamental cellular process that helps cells maintain the metabolic state to afford high-efficiency energy requirements.48 Autophagy targets damaged intracellular organelles and misfolded proteins to the lysosome for degradation. Mitophagy, a special form of autophagy, plays a critical role in the removal of damaged mitochondria and in the control of mitochondria quality.49,50 Autophagy facilitates metastasis in HCC by upregulating the expression of epithelial-mesenchymal transition (EMT).51 In this study, we demonstrate that MALAT1-deficient cells exhibit decreased expression of the mitophagy markers PINK1, SQSTM1/p62, NDP52, BNIP3, and the LC3B-II/I ratio. By labeling lysosomes using LysoTracker, we show that the number of red-stained lysosomes was reduced in the shMALAT1-treated cells, suggesting that MALAT1 plays a critical role in the regulation of autophagy in hepatoma cells.
The data from this study indicate that, in addition to its regulatory role at the transcriptional and/or post-transcriptional levels, MALAT1 may act as a nucleus-to-mitochondria messenger. MALAT1 is aberrantly expressed in HCC cells. After being transported into mitochondria, MALAT1 binds to multiple sites of mtDNA and alters the status of DNA methylation at the CpG 3 site in front of MTCO1. Both quantitative real-time PCR and western blot assays document the downregulation of COX1 in MALAT1 knockdown cells. Mitochondrial metabolism is also altered in these cells. Our results thus support the concept that retrograde and anterograde signaling occur as lncRNAs shuttle between the nucleus and mitochondria.9,10 As a result of this crosstalk, lncRNAs function as epigenetic messengers, altering mitochondrial metabolism during oncogenesis. Mitochondria-derived lncRNAs, on the other hand, may also shuttle into the nucleus, where they may regulate target genes related to tumor phenotypes.22
Dysregulation of cellular energetics is a hallmark of cancer cells, with enhanced absorption and utilization of glucose and glutamine. lncRNAs are implicated in the regulation of this metabolic reprogramming. For example, glutamine metabolism and ROS, the most important by-products of the electron transport chain in the mitochondria, are regulated by lncRNAs HOTTIP,52 CCAT2,53 and UCA1.54 lncRNAs Ftx and p21 promote the Warburg effect and enhance tumor progression.55,56 HOTAIR decreased UQCRQ (Ubiquinol-Cytochrome C Reductase, Complex III Subunit VII), leading to the impairment of the mitochondrial respiratory chain.57 SAMMSON interacted with mitochondrial surface protein P32 in cancer cells.58,59 Nuclear MALAT1 mediated glycolysis through the HIF-1α pathway in HCC.60 In this study, we show that MALAT1 functions as a nucleus-to-mitochondria epigenetic messenger to control metabolic reprogramming. MALAT1 binds to mtDNA and regulates mitochondrial genes epigenetically. Knockdown of MALAT1 induces multiple abnormalities in mitochondrial function, including altered mitochondrial structure, low OXPHOS, decreased ATP production, reduced mitophagy, decreased mtDNA copy number, and activation of mitochondrial apoptosis.
Overall, this study greatly expands our knowledge of the nucleus-encoded oncogenic lncRNA MALAT1 in regulating mitochondrial function. We provide the first evidence that the nuclear genome-encoded lncRNA MALAT1 functions as a critical epigenetic player in the regulation of mitochondrial metabolism of hepatoma cells, laying the foundation for further clarifying the roles of lncRNAs in tumor metabolic reprogramming. Additionally, this study provides solid evidence that lncRNA may function as an epigenetic messenger to coordinate a variety of functions between the nucleus and the mitochondria.
It is possible that knocking down MALAT1 using shRNAs may not target MALAT1 specifically in mitochondria. Future studies are necessary to target MALAT1 using other approaches, like antisense LNA GapmeRs and CRISPR Cas9. Ideally, it would be preferable to target the lncRNA specifically in mitochondria, while preserving the nuclear MALAT1. An unbiased global gene expression profile could then be used to evaluate the effect on pathways related to mitochondria, autophagy, and apoptosis.
We have demonstrated that the nuclear-encoded MALAT1 can be shuttled to mitochondria by RNA-binding proteins HuR and MTCH2. Perhaps a post-transcriptional modification, like m6A, might act as a signal that regulates the mitochondrial translocation of the nuclear MALAT1. Finally, MALAT1 may also function as a precursor and produce a highly conserved, tRNA-like 61 bp cytoplasmic RNA (MALAT1-associated small cytoplasmic RNA, MASCRNA).61 It would be interesting to learn if this small tRNA-like cytoplasmic RNA is also shuttled into mitochondria.
In conclusion, the lncRNA MALAT1 is a nucleus-to-mitochondria epigenetic messenger that influences metabolic reprogramming in HCC cells by regulating mitochondrial function in cancer cells.
Materials and Methods
Cell Culture
HepG2 cells and 293T cells, purchased from ATCC, were maintained in high-glucose DMEM media supplemented with 10% fetal bovine serum (FBS) and 1% penicillin/streptomycin. The normal hepatic cell line HL7702 was purchased from the Type Culture Collection of the Chinese Academy of Sciences (Shanghai, China) and was maintained with 20% FBS and 1% penicillin/streptomycin in high-glucose DMEM media at 37°C with 5% CO2.
Mitochondria Isolation, Reverse Transcription, and RNA Sequencing
Mitochondria were isolated using a Qproteome Mitochondria Isolation Kit (QIAGEN, Cat.#37612) with modifications as previously described.62,63 Specifically, the combined mitochondria supernatants were treated with RNase A buffer (4 μg/mL RNase A) at room temperature for 15 min to remove any cytoplasmic RNA on the outer mitochondrial membranes. After centrifugation at 6,000g for 10 min, the pellet was suspended in Mitochondria Purification Buffer and was subjected to gradient purification following the manufacturer’s manual.
The isolated mitochondria and whole-cell lysate were used for RNA extraction using Trizol (Invitrogen, CA, USA). To confirm the purity of the isolated mitochondria, mitochondrial RNAs were reverse transcribed into cDNAs, and qPCR was performed to quantitate the mitochondria genome-encoded RNA (COX2) and the nuclear RNA (U6). Mitochondrial RNAs were then subjected to Illumina sequencing (Shanghai Biotechnology, Shanghai, China).
Quantitation of Gene Expression by Quantitative Real-Time PCR
Whole-cell and mitochondrial cDNAs were synthesized, and quantitative real-time PCR was performed using the FastStart Universal SYBR Green Master mix (Millipore Sigma, MA, USA) with a StepOnePlus real-time PCR system (ABI Prism 7900HT; Applied Biosystems, USA). The threshold cycle (Ct) values of target genes were normalized over the Ct of COX2 for gene expressions in mitochondria and the Ct of β-actin in whole cell lysate. For comparison, the shCT group was set as 1 unless otherwise indicated. Primers used for real-time PCR and quantitative real-time PCR are listed in Table S1.
Western Blot for Mitochondrial Proteins
Western blot was used to detect mitochondrial proteins. Antibodies used for western blot were: Anti-LAMP1 antibody-Lysosome Marker (ab24170), Anti-Cyclophilin F antibody (ab110324), Mitophagy Antibody Sampler Kit (Cell Signaling Technology [CST], #43110), Bcl-2 (124) Mouse monoclonal antibody (mAb) (CST, #15071), Cytochrome c (D18C7) Rabbit mAb (CST, #11940), Caspase-3 antibody (CST, #9662), Bax (D2E11) Rabbit mAb (CST, #5023), β-Actin (8H10D10) Mouse mAb (CST, #3700), and BID antibody (CST, #2002). The blots were developed by Odyssey clx Imaging System (LI-COR).
Knockdown of MALAT1 in HepG2 Cells
To study the role of MALAT1 in HCC cells, two shRNAs were cloned into a pGreenPuro vector to knockdown MALAT1: shMALT1-1#: 5′-CACAGGGAAAGCGAGTGGTTGGTAA-3′ and shMALAT1-2#: 5′-GATCCATAATCGGTTTCAAGGTA-3′. The copGFP reporter in the vector was used to track the lentiviral transfection. A random shRNA (5′-GCAGCAACTGGACACGTGATCTTAA-3′) was cloned in the same vector as the assay control (shCT). Three days after lentiviral infection, HepG2 cells were selected by puromycin, and mixed stable cells were collected for gene analysis by RT-PCR.
RAT-Seq
An RNA RAT-seq assay64 was used to examine lncRNA-mtDNA interactions. After in situ reverse transcription in the isolated nuclei using gene strand-specific reverse transcription and biotin-dCTP (deoxycytidine triphosphate), the biotin-cDNA/chromatin DNA complex was isolated with streptavidin magic beads (Invitrogen, CA, USA) and used for PCR amplification of the genomic DNA that interacts with the lncRNA.
RNA FISH Assay
FISH was performed using two probes. In the first approach, we performed RNA FISH for MALAT1 using commercial antisense oligonucleotide probes in a FISH Kit (C10910, RiboBio, China). Briefly, cells were fixed in 4% formaldehyde for 10 min and were permeabilized in 1 × PBS containing 0.5% Triton X-100 for 5 min at 4°C. After treatment with pre-hybridization buffer at 37°C for 30 min, hybridization was carried out with fluorescent probes following the protocol provided by the manufacturer. Images were obtained using a confocal laser-scanning microscope (Carl Zeiss).
In a second approach, RNA FISH was performed using asymmetric PCR-derived antisense DNA probes.14 FISH probes are prepared as antisense single-stranded DNA molecules using a simple asymmetric PCR and labeled with digoxigenin-labeled dUTP (Digoxigenin labeling DNA mix, Cat.11277065910 ROCHE). After probe hybridization, lncRNAs in the mitochondria are detected by anti-digoxigenin-fluorescein. For RNA FISH of the isolated mitochondria smear, we first treated mitochondria supernatants with RNase A buffer (4 μg/mL RNase A) at room temperature for 15 min to remove the cytoplasmic RNA on the outer mitochondrial membranes. After centrifugation, mitochondria were smeared on slides for RNA FISH. In combination with MitoTracker (MitoTracker Red CMXRos, Cat.M7512, Invitrogen), RNAs can be visualized within mitochondria. The locations of MALAT1 FISH probes are shown in Figure S11.
ChIRP
Mitochondria were first isolated following the Qproteome Mitochondria Isolation Kit (QIAGEN, Cat. #37612) manual. After treatment with RNase (4 μg/mL RNase A), the isolated mitochondria were cross-linked, lysed, and sonicated. Three 3′-end biotinylated oligonucleotide DNA probes were hybridized to MALAT1. The biotinylated probe/MALAT1/chromatin mtDNA complex was pulled down with streptavidin C1 beads (Invitrogen 65002). The MALAT1-pulldown chromatin mtDNA was extracted and quantitated by qPCR for the interacted mtDNA.24
Mitochondrial Oxidative Phosphorylation and Glycolysis
Mitochondrial metabolism was determined by measuring the OCR and ECAR of the cells with the XF-96 Flux Analyzer (Seahorse Biosciences, North Billerica, MA, USA) at the Gerontology Seahorse Core Facility.65 Seahorse XF Cell Mito Stress Test and Glycolysis Stress Test were used to examine OCR and ECAR, respectively, following the manufacturer’s instructions. All readings were normalized to total DNA content.
Detection of mtDNA Copy Number
mtDNA copy number was examined using a previous protocol.65 Briefly, genomic DNA was extracted from 300,000 cells by phenol-chloroform extraction. The mitochondrial copy number was estimated by real-time PCR (CFX Connect Real-Time System, Bio-Rad) using three mtDNA targets (ND1, CYB, and MT-CO2) and one cytoplasmic DNA target (β-actin) (Integrated DNA Technologies [IDT], CA, USA).
Detection of mtDNA Methylation
mtDNA methylation was measured as previously described.26,42 The PCR primers used to amplify the bisulfite-treated mtDNA are listed in Table S1. PCR products were cloned into the pJet vector and sequenced for the quantitation of CpG methylation. DNA methylation was calculated as the average percentage of all CpG sites.
Transmission Electron Microscopy
Transmission electron microscopy was used to examine structural changes of mitochondria. Control and shMALAT1-treated HepG2 cells were pre-fixed with 4% glutaraldehyde and then fixed with 1% citric acid. Samples were dehydrated with ethanol, embedded with Eponate 12 epoxy resin, and semi-thin sliced by LEICA EM UC7 Ultra-Thin Slicer. After double staining with uranyl acetate and lead citrate, slides were observed under transmission electron microscopy (FEI Tecnai Spirit). For mitochondrial number quantitation, electron microscope slides were viewed and counted by two independent technicians. In each group, 3 cells (N = 3) were counted for the number of mitochondria in the treatment group.
Detection of mROS, Mitochondrial SOD Enzyme Activity, and JC-1 Mitochondria Membrane Potential
mROS was detected by MitoSOX (M36008), following the manufacturer’s instructions. Plasma superoxide dismutase (SOD) activity was detected using a Cu/Zn-SOD and Mn-SOD Assay Kit (S0103) from Beyotime Institute of Biotechnology (Beijing, China) according to manufacturer’s protocol.8 Mitochondrial membrane potential was detected by the JC-1 kit (C2006) from Beyotime Institute of Biotechnology (Beijing, China), following the manufacturer’s protocol.
RIP
The Magna RIP RNA-Binding Protein Immunoprecipitation Kit (EMD Millipore, #17-700) was used to assess the interaction of the lncRNA with MTCH2/HuR following the manufacturer’s specifications.66 Rabbit anti-IgG was used as the RIP control. We used ΔCt values for determining enrichment fold change relative to IgG controls.
Cell Cycle and Apoptosis Analysis by Flow Cytometry
Cells were fixed in absolute ethyl alcohol at −20°C overnight, washed twice with PBS, and resuspended in PI staining solution containing 0.1 mg/mL RNase A, 50 μg/mL propidium-iodide, and 0.2% Triton. Cell cycle distribution was analyzed using bivariate flow cytometry on a Fortessa flow cytometer. To detect cell apoptosis, 2 × 10⁵ cells were harvested, and then resuspended in 500 μL Annexin V binding buffer, and incubated with 5 μL Annexin V for 10 min and 5 μL 7-AAD for 15 min, following the manufacture’s instruction by flow cytometry.
Statistical Analysis
The data are expressed as mean ± standard deviation of at least three sample replicates, unless stated otherwise. For comparison, the value of the random shRNA control group (shCT) was set as 1, and the fold-change was calculated for the shMALAT1-1/shMALAT1-2 groups. Data were analyzed using GraphPad software (version 6.0c; PRISM, San Diego, CA, USA). Student’s t test or one-way ANOVA (Bonferroni test) was used to compare statistical differences for variables among treatment groups.
Results were considered statistically significant at p < 0.05.
Availability of Data and Material
Raw FASTQ sequencing files comprised of three cell mitochondrial RNA datasets have been deposited to the NCBI Gene Expression Omnibus under accession number GEO: GSE119946.
Author Contributions
Conception and design: A.R.H., J.F.H., and J.C.; Development of methodology: Y.Z., L.Z., X.L., and P.C.; Acquisition of data: Y. Z., X.L., S.K., J.X., L.Z., H.L., T.S., and X.W.; Analysis and interpretation of data: Y.Z., X.L., S.J.K., J.X., L.Z., H.L., T.S., and X.W.; Writing, review, and/or revision of the manuscript: Y.Z., A.R.H., J.F.H., and J.C.; Administrative, technical, or material support (i.e., reporting or organizing data, constructing databases): L.L., S.Z., W.L., Y.M., Y.L., M.L., and S.L.; Study supervision: A.R.H., J.F.H., and J.C.
Conflicts of Interest
The authors declare no competing interests.
Acknowledgments
This work was supported by a Key Project of Chinese Ministry of Education grant (311015), the National Basic Research Program of China (973 Program; 2015CB943303), a Nation Key Research and Development Program of China grant (2016YFC13038000), the Research on Chronic Noncommunicable Diseases Prevention and Control of National Ministry of Science and Technology (2016YFC1303804), the National Health Development Planning Commission Major Disease Prevention and Control of Science and Technology Plan of Action, Cancer Prevention and Control (ZX-07-C2016004), the National Key R&D Program of China (2018YFA0106902), the National Natural Science Foundation of China (82050003, 32000431, 31430021, 81874052, 81672275, 31871297, and 81670143), the Natural Science Foundation of Jilin Province (20150101176JC, 20180101117JC, and 20130413010GH), the Provincial Science Fund of Jilin Province Development and Reform Commission (2014N147 and 2017C022), and a California Institute of Regenerative Medicine (CIRM) grant (RT2-01942). This work was supported in part by a Merit Review from the United States Department of Veterans Affairs, Biomedical Laboratory Research and Development Service (BX002905).
Footnotes
Supplemental Information can be found online at https://doi.org/10.1016/j.omtn.2020.09.040.
Contributor Information
Andrew R. Hoffman, Email: arhoffman@stanford.edu.
Ji-Fan Hu, Email: jifan@stanford.edu, hujifan@jlu.edu.cn.
Jiuwei Cui, Email: cuijw@jlu.edu.cn.
Supplemental Information
References
- 1.Zong W.X., Rabinowitz J.D., White E. Mitochondria and Cancer. Mol. Cell. 2016;61:667–676. doi: 10.1016/j.molcel.2016.02.011. [DOI] [PMC free article] [PubMed] [Google Scholar]
- 2.Vyas S., Zaganjor E., Haigis M.C. Mitochondria and Cancer. Cell. 2016;166:555–566. doi: 10.1016/j.cell.2016.07.002. [DOI] [PMC free article] [PubMed] [Google Scholar]
- 3.Weinberg S.E., Chandel N.S. Targeting mitochondria metabolism for cancer therapy. Nat. Chem. Biol. 2015;11:9–15. doi: 10.1038/nchembio.1712. [DOI] [PMC free article] [PubMed] [Google Scholar]
- 4.Savic L.J., Chapiro J., Duwe G., Geschwind J.F. Targeting glucose metabolism in cancer: new class of agents for loco-regional and systemic therapy of liver cancer and beyond? Hepat. Oncol. 2016;3:19–28. doi: 10.2217/hep.15.36. [DOI] [PMC free article] [PubMed] [Google Scholar]
- 5.Lee M., Yoon J.H. Metabolic interplay between glycolysis and mitochondrial oxidation: The reverse Warburg effect and its therapeutic implication. World J. Biol. Chem. 2015;6:148–161. doi: 10.4331/wjbc.v6.i3.148. [DOI] [PMC free article] [PubMed] [Google Scholar]
- 6.Miyanishi K., Tanaka S., Sakamoto H., Kato J. The role of iron in hepatic inflammation and hepatocellular carcinoma. Free Radic. Biol. Med. 2019;133:200–205. doi: 10.1016/j.freeradbiomed.2018.07.006. [DOI] [PubMed] [Google Scholar]
- 7.Yuan X., Wang B., Yang L., Zhang Y. The role of ROS-induced autophagy in hepatocellular carcinoma. Clin. Res. Hepatol. Gastroenterol. 2018;42:306–312. doi: 10.1016/j.clinre.2018.01.005. [DOI] [PubMed] [Google Scholar]
- 8.Anastasiadou E., Jacob L.S., Slack F.J. Non-coding RNA networks in cancer. Nat. Rev. Cancer. 2018;18:5–18. doi: 10.1038/nrc.2017.99. [DOI] [PMC free article] [PubMed] [Google Scholar]
- 9.Zhao Y., Sun L., Wang R.R., Hu J.F., Cui J. The effects of mitochondria-associated long noncoding RNAs in cancer mitochondria: New players in an old arena. Crit. Rev. Oncol. Hematol. 2018;131:76–82. doi: 10.1016/j.critrevonc.2018.08.005. [DOI] [PubMed] [Google Scholar]
- 10.Dong Y., Yoshitomi T., Hu J.F., Cui J. Long noncoding RNAs coordinate functions between mitochondria and the nucleus. Epigenetics Chromatin. 2017;10:41. doi: 10.1186/s13072-017-0149-x. [DOI] [PMC free article] [PubMed] [Google Scholar]
- 11.Rackham O., Shearwood A.M., Mercer T.R., Davies S.M., Mattick J.S., Filipovska A. Long noncoding RNAs are generated from the mitochondrial genome and regulated by nuclear-encoded proteins. RNA. 2011;17:2085–2093. doi: 10.1261/rna.029405.111. [DOI] [PMC free article] [PubMed] [Google Scholar]
- 12.Noh J.H., Kim K.M., Abdelmohsen K., Yoon J.H., Panda A.C., Munk R., Kim J., Curtis J., Moad C.A., Wohler C.M. HuR and GRSF1 modulate the nuclear export and mitochondrial localization of the lncRNA RMRP. Genes Dev. 2016;30:1224–1239. doi: 10.1101/gad.276022.115. [DOI] [PMC free article] [PubMed] [Google Scholar]
- 13.Vendramin R., Marine J.C., Leucci E. Non-coding RNAs: the dark side of nuclear-mitochondrial communication. EMBO J. 2017;36:1123–1133. doi: 10.15252/embj.201695546. [DOI] [PMC free article] [PubMed] [Google Scholar]
- 14.Zhao Y., Liu S., Zhou L., Li X., Meng Y., Li Y., Li L., Jiao B., Bai L., Yu Y. Aberrant shuttling of long noncoding RNAs during the mitochondria-nuclear crosstalk in hepatocellular carcinoma cells. Am. J. Cancer Res. 2019;9:999–1008. [PMC free article] [PubMed] [Google Scholar]
- 15.Kim J., Piao H.L., Kim B.J., Yao F., Han Z., Wang Y., Xiao Z., Siverly A.N., Lawhon S.E., Ton B.N. Long noncoding RNA MALAT1 suppresses breast cancer metastasis. Nat. Genet. 2018;50:1705–1715. doi: 10.1038/s41588-018-0252-3. [DOI] [PMC free article] [PubMed] [Google Scholar]
- 16.Best J., Schotten C., Theysohn J.M., Wetter A., Müller S., Radünz S., Schulze M., Canbay A., Dechêne A., Gerken G. Novel implications in the treatment of hepatocellular carcinoma. Ann. Gastroenterol. 2017;30:23–32. doi: 10.20524/aog.2016.0092. [DOI] [PMC free article] [PubMed] [Google Scholar]
- 17.Kim K.M., Noh J.H., Abdelmohsen K., Gorospe M. Mitochondrial noncoding RNA transport. BMB Rep. 2017;50:164–174. doi: 10.5483/BMBRep.2017.50.4.013. [DOI] [PMC free article] [PubMed] [Google Scholar]
- 18.Buchan K.D., Prajsnar T.K., Ogryzko N.V., de Jong N.W.M., van Gent M., Kolata J., Foster S.J., van Strijp J.A.G., Renshaw S.A. A transgenic zebrafish line for in vivo visualisation of neutrophil myeloperoxidase. PLoS ONE. 2019;14:e0215592. doi: 10.1371/journal.pone.0215592. [DOI] [PMC free article] [PubMed] [Google Scholar]
- 19.Taxiarchis A., Mahdessian H., Silveira A., Fisher R.M., Van’t Hooft F.M. PNPLA2 influences secretion of triglyceride-rich lipoproteins by human hepatoma cells. J. Lipid Res. 2019;60:1069–1077. doi: 10.1194/jlr.M090928. [DOI] [PMC free article] [PubMed] [Google Scholar]
- 20.Zhang J., Han C., Ungerleider N., Chen W., Song K., Wang Y., Kwon H., Ma W., Wu T. A Transforming Growth Factor-β and H19 Signaling Axis in Tumor-Initiating Hepatocytes That Regulates Hepatic Carcinogenesis. Hepatology. 2019;69:1549–1563. doi: 10.1002/hep.30153. [DOI] [PMC free article] [PubMed] [Google Scholar]
- 21.Abbastabar M., Sarfi M., Golestani A., Khalili E. lncRNA involvement in hepatocellular carcinoma metastasis and prognosis. EXCLI J. 2018;17:900–913. doi: 10.17179/excli2018-1541. [DOI] [PMC free article] [PubMed] [Google Scholar]
- 22.Li X., Chen N., Zhou L., Wang C., Wen X., Jia L., Cui J., Hoffman A.R., Hu J.F., Li W. Genome-wide target interactome profiling reveals a novel EEF1A1 epigenetic pathway for oncogenic lncRNA MALAT1 in breast cancer. Am. J. Cancer Res. 2019;9:714–729. [PMC free article] [PubMed] [Google Scholar]
- 23.Chen N., Zhao G., Yan X., Lv Z., Yin H., Zhang S., Song W., Li X., Li L., Du Z. A novel FLI1 exonic circular RNA promotes metastasis in breast cancer by coordinately regulating TET1 and DNMT1. Genome Biol. 2018;19:218. doi: 10.1186/s13059-018-1594-y. [DOI] [PMC free article] [PubMed] [Google Scholar]
- 24.Jia L., Wang Y., Wang C., Du Z., Zhang S., Wen X., Zhou L., Li H., Chen H., Li D. Oplr16 serves as a novel chromatin factor to control stem cell fate by modulating pluripotency-specific chromosomal looping and TET2-mediated DNA demethylation. Nucleic Acids Res. 2020;48:3935–3948. doi: 10.1093/nar/gkaa097. [DOI] [PMC free article] [PubMed] [Google Scholar]
- 25.Murray C.J., Ortblad K.F., Guinovart C., Lim S.S., Wolock T.M., Roberts D.A., Dansereau E.A., Graetz N., Barber R.M., Brown J.C. Global, regional, and national incidence and mortality for HIV, tuberculosis, and malaria during 1990-2013: a systematic analysis for the Global Burden of Disease Study 2013. Lancet. 2014;384:1005–1070. doi: 10.1016/S0140-6736(14)60844-8. [DOI] [PMC free article] [PubMed] [Google Scholar]
- 26.Yu D., Du Z., Pian L., Li T., Wen X., Li W., Kim S.J., Xiao J., Cohen P., Cui J. Mitochondrial DNA Hypomethylation Is a Biomarker Associated with Induced Senescence in Human Fetal Heart Mesenchymal Stem Cells. Stem Cells Int. 2017;2017:1764549. doi: 10.1155/2017/1764549. [DOI] [PMC free article] [PubMed] [Google Scholar]
- 27.Clay Montier L.L., Deng J.J., Bai Y. Number matters: control of mammalian mitochondrial DNA copy number. J. Genet. Genomics. 2009;36:125–131. doi: 10.1016/S1673-8527(08)60099-5. [DOI] [PMC free article] [PubMed] [Google Scholar]
- 28.Falkenberg M. Mitochondrial DNA replication in mammalian cells: overview of the pathway. Essays Biochem. 2018;62:287–296. doi: 10.1042/EBC20170100. [DOI] [PMC free article] [PubMed] [Google Scholar]
- 29.Milenkovic D., Matic S., Kühl I., Ruzzenente B., Freyer C., Jemt E., Park C.B., Falkenberg M., Larsson N.G. TWINKLE is an essential mitochondrial helicase required for synthesis of nascent D-loop strands and complete mtDNA replication. Hum. Mol. Genet. 2013;22:1983–1993. doi: 10.1093/hmg/ddt051. [DOI] [PMC free article] [PubMed] [Google Scholar]
- 30.Ekstrand M.I., Falkenberg M., Rantanen A., Park C.B., Gaspari M., Hultenby K., Rustin P., Gustafsson C.M., Larsson N.G. Mitochondrial transcription factor A regulates mtDNA copy number in mammals. Hum. Mol. Genet. 2004;13:935–944. doi: 10.1093/hmg/ddh109. [DOI] [PubMed] [Google Scholar]
- 31.Sullivan L.B., Chandel N.S. Mitochondrial reactive oxygen species and cancer. Cancer Metab. 2014;2:17. doi: 10.1186/2049-3002-2-17. [DOI] [PMC free article] [PubMed] [Google Scholar]
- 32.McArthur K., Whitehead L.W., Heddleston J.M., Li L., Padman B.S., Oorschot V., Geoghegan N.D., Chappaz S., Davidson S., San Chin H. BAK/BAX macropores facilitate mitochondrial herniation and mtDNA efflux during apoptosis. Science. 2018;359:eaao6047. doi: 10.1126/science.aao6047. [DOI] [PubMed] [Google Scholar]
- 33.Xu Z., Yang L., Xu S., Zhang Z., Cao Y. The receptor proteins: pivotal roles in selective autophagy. Acta Biochim. Biophys. Sin. (Shanghai) 2015;47:571–580. doi: 10.1093/abbs/gmv055. [DOI] [PubMed] [Google Scholar]
- 34.Birgisdottir A.B., Lamark T., Johansen T. The LIR motif - crucial for selective autophagy. J. Cell Sci. 2013;126:3237–3247. doi: 10.1242/jcs.126128. [DOI] [PubMed] [Google Scholar]
- 35.Lazarou M., Sliter D.A., Kane L.A., Sarraf S.A., Wang C., Burman J.L., Sideris D.P., Fogel A.I., Youle R.J. The ubiquitin kinase PINK1 recruits autophagy receptors to induce mitophagy. Nature. 2015;524:309–314. doi: 10.1038/nature14893. [DOI] [PMC free article] [PubMed] [Google Scholar]
- 36.Heo J.M., Ordureau A., Paulo J.A., Rinehart J., Harper J.W. The PINK1-PARKIN Mitochondrial Ubiquitylation Pathway Drives a Program of OPTN/NDP52 Recruitment and TBK1 Activation to Promote Mitophagy. Mol. Cell. 2015;60:7–20. doi: 10.1016/j.molcel.2015.08.016. [DOI] [PMC free article] [PubMed] [Google Scholar]
- 37.Ahmad S., Mu X., Yang F., Greenwald E., Park J.W., Jacob E., Zhang C.Z., Hur S. Breaching Self-Tolerance to Alu Duplex RNA Underlies MDA5-Mediated Inflammation. Cell. 2018;172:797–810.e13. doi: 10.1016/j.cell.2017.12.016. [DOI] [PMC free article] [PubMed] [Google Scholar]
- 38.Marchese D., de Groot N.S., Lorenzo Gotor N., Livi C.M., Tartaglia G.G. Advances in the characterization of RNA-binding proteins. Wiley Interdiscip. Rev. RNA. 2016;7:793–810. doi: 10.1002/wrna.1378. [DOI] [PMC free article] [PubMed] [Google Scholar]
- 39.Buzaglo-Azriel L., Kuperman Y., Tsoory M., Zaltsman Y., Shachnai L., Zaidman S.L., Bassat E., Michailovici I., Sarver A., Tzahor E. Loss of Muscle MTCH2 Increases Whole-Body Energy Utilization and Protects from Diet-Induced Obesity. Cell Rep. 2016;14:1602–1610. doi: 10.1016/j.celrep.2016.01.046. [DOI] [PubMed] [Google Scholar]
- 40.Maryanovich M., Zaltsman Y., Ruggiero A., Goldman A., Shachnai L., Zaidman S.L., Porat Z., Golan K., Lapidot T., Gross A. An MTCH2 pathway repressing mitochondria metabolism regulates haematopoietic stem cell fate. Nat. Commun. 2015;6:7901. doi: 10.1038/ncomms8901. [DOI] [PubMed] [Google Scholar]
- 41.Zaltsman Y., Shachnai L., Yivgi-Ohana N., Schwarz M., Maryanovich M., Houtkooper R.H., Vaz F.M., De Leonardis F., Fiermonte G., Palmieri F. MTCH2/MIMP is a major facilitator of tBID recruitment to mitochondria. Nat. Cell Biol. 2010;12:553–562. doi: 10.1038/ncb2057. [DOI] [PMC free article] [PubMed] [Google Scholar]
- 42.Amodio N., Raimondi L., Juli G., Stamato M.A., Caracciolo D., Tagliaferri P., Tassone P. MALAT1: a druggable long non-coding RNA for targeted anti-cancer approaches. J. Hematol. Oncol. 2018;11:63. doi: 10.1186/s13045-018-0606-4. [DOI] [PMC free article] [PubMed] [Google Scholar]
- 43.Dennerlein S., Wang C., Rehling P. Plasticity of Mitochondrial Translation. Trends Cell Biol. 2017;27:712–721. doi: 10.1016/j.tcb.2017.05.004. [DOI] [PubMed] [Google Scholar]
- 44.McCormick E.M., Muraresku C.C., Falk M.J. Mitochondrial Genomics: A complex field now coming of age. Curr. Genet. Med. Rep. 2018;6:52–61. doi: 10.1007/s40142-018-0137-x. [DOI] [PMC free article] [PubMed] [Google Scholar]
- 45.De Paepe B., Lefever S., Mestdagh P. How long noncoding RNAs enforce their will on mitochondrial activity: regulation of mitochondrial respiration, reactive oxygen species production, apoptosis, and metabolic reprogramming in cancer. Curr. Genet. 2018;64:163–172. doi: 10.1007/s00294-017-0744-1. [DOI] [PubMed] [Google Scholar]
- 46.Yoshimoto R., Mayeda A., Yoshida M., Nakagawa S. MALAT1 long non-coding RNA in cancer. Biochim. Biophys. Acta. 2016;1859:192–199. doi: 10.1016/j.bbagrm.2015.09.012. [DOI] [PubMed] [Google Scholar]
- 47.Toraih E.A., Ellawindy A., Fala S.Y., Al Ageeli E., Gouda N.S., Fawzy M.S., Hosny S. Oncogenic long noncoding RNA MALAT1 and HCV-related hepatocellular carcinoma. Biomed Pharmacother. 2018;102:653–669. doi: 10.1016/j.biopha.2018.03.105. [DOI] [PubMed] [Google Scholar]
- 48.White E., Mehnert J.M., Chan C.S. Autophagy, Metabolism, and Cancer. Clin Cancer Res. 2015;21:5037–5046. doi: 10.1158/1078-0432.CCR-15-0490. [DOI] [PMC free article] [PubMed] [Google Scholar]
- 49.Vara-Perez M., Felipe-Abrio B., Agostinis P. Mitophagy in Cancer: A Tale of Adaptation. Cells. 2019;8:493. doi: 10.3390/cells8050493. [DOI] [PMC free article] [PubMed] [Google Scholar]
- 50.Kulikov A.V., Luchkina E.A., Gogvadze V., Zhivotovsky B. Mitophagy: Link to cancer development and therapy. Biochem. Biophys. Res. Commun. 2017;482:432–439. doi: 10.1016/j.bbrc.2016.10.088. [DOI] [PubMed] [Google Scholar]
- 51.Dash S., Sarashetti P.M., Rajashekar B., Chowdhury R., Mukherjee S. TGF-β2-induced EMT is dampened by inhibition of autophagy and TNF-α treatment. Oncotarget. 2018;9:6433–6449. doi: 10.18632/oncotarget.23942. [DOI] [PMC free article] [PubMed] [Google Scholar]
- 52.Staff P.G., PLOS Genetics Staff Correction: fMiRNA-192 and miRNA-204 Directly Suppress lncRNA HOTTIP and Interrupt GLS1-Mediated Glutaminolysis in Hepatocellular Carcinoma. PLoS Genet. 2016;12:e1005825. doi: 10.1371/journal.pgen.1005825. [DOI] [PMC free article] [PubMed] [Google Scholar]
- 53.Redis R.S., Vela L.E., Lu W., Ferreira de Oliveira J., Ivan C., Rodriguez-Aguayo C., Adamoski D., Pasculli B., Taguchi A., Chen Y. Allele-Specific Reprogramming of Cancer Metabolism by the Long Non-coding RNA CCAT2. Mol. Cell. 2016;61:640. doi: 10.1016/j.molcel.2016.02.006. [DOI] [PubMed] [Google Scholar]
- 54.Li H.J., Li X., Pang H., Pan J.J., Xie X.J., Chen W. Long non-coding RNA UCA1 promotes glutamine metabolism by targeting miR-16 in human bladder cancer. Jpn. J. Clin. Oncol. 2015;45:1055–1063. doi: 10.1093/jjco/hyv132. [DOI] [PubMed] [Google Scholar]
- 55.Yang F., Zhang H., Mei Y., Wu M. Reciprocal regulation of HIF-1α and lincRNA-p21 modulates the Warburg effect. Mol. Cell. 2014;53:88–100. doi: 10.1016/j.molcel.2013.11.004. [DOI] [PubMed] [Google Scholar]
- 56.Li X., Zhao Q., Qi J., Wang W., Zhang D., Li Z., Qin C. lncRNA Ftx promotes aerobic glycolysis and tumor progression through the PPARγ pathway in hepatocellular carcinoma. Int. J. Oncol. 2018;53:551–566. doi: 10.3892/ijo.2018.4418. [DOI] [PMC free article] [PubMed] [Google Scholar]
- 57.Kong L., Zhou X., Wu Y., Wang Y., Chen L., Li P., Liu S., Sun S., Ren Y., Mei M. Targeting HOTAIR Induces Mitochondria Related Apoptosis and Inhibits Tumor Growth in Head and Neck Squamous Cell Carcinoma in vitro and in vivo. Curr. Mol. Med. 2015;15:952–960. doi: 10.2174/1566524016666151123112716. [DOI] [PubMed] [Google Scholar]
- 58.Goding C.R. Targeting the lncRNA SAMMSON Reveals Metabolic Vulnerability in Melanoma. Cancer Cell. 2016;29:619–621. doi: 10.1016/j.ccell.2016.04.010. [DOI] [PubMed] [Google Scholar]
- 59.Leucci E., Vendramin R., Spinazzi M., Laurette P., Fiers M., Wouters J., Radaelli E., Eyckerman S., Leonelli C., Vanderheyden K. Melanoma addiction to the long non-coding RNA SAMMSON. Nature. 2016;531:518–522. doi: 10.1038/nature17161. [DOI] [PubMed] [Google Scholar]
- 60.Luo F., Liu X., Ling M., Lu L., Shi L., Lu X., Li J., Zhang A., Liu Q. The lncRNA MALAT1, acting through HIF-1α stabilization, enhances arsenite-induced glycolysis in human hepatic L-02 cells. Biochim. Biophys. Acta. 2016;1862:1685–1695. doi: 10.1016/j.bbadis.2016.06.004. [DOI] [PubMed] [Google Scholar]
- 61.Wilusz J.E., Freier S.M., Spector D.L. 3′ end processing of a long nuclear-retained noncoding RNA yields a tRNA-like cytoplasmic RNA. Cell. 2008;135:919–932. doi: 10.1016/j.cell.2008.10.012. [DOI] [PMC free article] [PubMed] [Google Scholar]
- 62.Barrey E., Saint-Auret G., Bonnamy B., Damas D., Boyer O., Gidrol X. Pre-microRNA and mature microRNA in human mitochondria. PLoS ONE. 2011;6:e20220. doi: 10.1371/journal.pone.0020220. [DOI] [PMC free article] [PubMed] [Google Scholar]
- 63.Geiger J., Dalgaard L.T. Isolation and Analysis of Mitochondrial Small RNAs from Rat Liver Tissue and HepG2 Cells. Methods Mol. Biol. 2018;1782:337–350. doi: 10.1007/978-1-4939-7831-1_20. [DOI] [PubMed] [Google Scholar]
- 64.Sun J., Li W., Sun Y., Yu D., Wen X., Wang H., Cui J., Wang G., Hoffman A.R., Hu J.-F. A novel antisense long noncoding RNA within the IGF1R gene locus is imprinted in hematopoietic malignancies. Nucleic Acids Res. 2014;42:9588–9601. doi: 10.1093/nar/gku549. [DOI] [PMC free article] [PubMed] [Google Scholar]
- 65.Kim S.J., Mehta H.H., Wan J., Kuehnemann C., Chen J., Hu J.F., Hoffman A.R., Cohen P. Mitochondrial peptides modulate mitochondrial function during cellular senescence. Aging (Albany NY) 2018;10:1239–1256. doi: 10.18632/aging.101463. [DOI] [PMC free article] [PubMed] [Google Scholar]
- 66.Shults C.L., Dingwall C.B., Kim C.K., Pinceti E., Rao Y.S., Pak T.R. 17β-estradiol regulates the RNA-binding protein Nova1, which then regulates the alternative splicing of estrogen receptor β in the aging female rat brain. Neurobiol. Aging. 2018;61:13–22. doi: 10.1016/j.neurobiolaging.2017.09.005. [DOI] [PMC free article] [PubMed] [Google Scholar]
Associated Data
This section collects any data citations, data availability statements, or supplementary materials included in this article.
Supplementary Materials
Data Availability Statement
Raw FASTQ sequencing files comprised of three cell mitochondrial RNA datasets have been deposited to the NCBI Gene Expression Omnibus under accession number GEO: GSE119946.