

Abstract
We performed a meta‐analysis to determine cancer risks at multiple sites and their associations with tumor mutation burden (TMB), an index for immunogenicity, in heart or lung transplant recipients. A comprehensive search of PubMed, Web of Science, EMBASE, and Medline was conducted. Random effects models were used to calculate standardized incidence ratios (SIRs) versus the general population and to determine the risks of different cancers. Weighted linear regression (WLR) was used to analyze the associations between the SIRs and TMBs. (PROSPERO CRD42020159599). Data from 21 studies including 116,438 transplant recipients (51,173 heart transplant recipients and 65,265 lung transplant recipients) with a total follow‐up of 601,330.7 person‐years were analyzed. Compared with the general population, heart transplant recipients displayed a 3.13‐fold higher cancer risk [SIR: 3.13; 95% confidence interval (CI): 2.38–4.13; p < 0.001]; lung transplant recipients displayed a 4.28‐fold higher cancer risk [SIR: 4.28; 95% CI: 3.18–5.77; p < 0.001]. The correlation coefficients were 0.54 (p = 0.049) and 0.79 (p < 0.001) in heart and lung transplant recipients, respectively, indicating that 29% and 63% of the differences in the SIRs for cancer types might be explained by the TMBs. Our study demonstrated that both heart and lung transplant recipients displayed a higher risk of certain site‐specific cancers. These findings can provide individualized guidance for clinicians for detection of cancer among heart or lung transplantation recipients. In addition, we provided evidence that increased risks of post‐transplant cancers can be attributed to immunosuppression.
Keywords: cancer risk, heart transplantation, lung transplantation, meta‐analysis, tumor mutation burden
Our study demonstrated that both heart and lung transplant recipients displayed a higher risk of certain site‐specific cancers. These findings can provide individualized guidance for clinicians for detection of cancer among heart or lung transplantation recipients. In addition, we provided evidence that increased risks of post‐transplant cancers can be attributed to immunosuppression.
1. INTRODUCTION
Heart or lung transplantation is recognized as the best treatment option to improve the quality of life and survival of patients with some end‐stage cardiac or pulmonary diseases, such as heart failure, chronic obstructive pulmonary disease, and idiopathic pulmonary fibrosis. According to the International Society for Heart and Lung Transplantation (ISHLT), 1 heart transplant recipients have a median survival of more than 12 years and lung transplant recipients who survived past the first year after primary transplant, have a median survival of 8.7 years.
Nevertheless, compared with the general population, heart or lung transplant recipients are at higher risk for cancers. In accordance with the ISHLT, 16% of all 5‐year‐survivors and 28% of 10‐year‐survivors were diagnosed with at least one post‐heart transplantation cancer and 17.3% of the post‐lung transplantation recipients died from malignancies 5–10 years after transplantation. 1 , 2 , 3 Compared with the general population, the cancer risk of liver or kidney transplant recipients has increased by 2 to 4 times, and the cancer risk of thoracic organs is even higher. 4 , 5 , 6 , 7 , 8 Though exerting great efficacy in the extension of survival in solid organ transplantations, immunosuppression is considered to be an important inducement of tumors after organ transplantation. 9 , 10 , 11 , 12 , 13 , 14 , 15
Tumor mutation burden (TMB) is defined as the total number of somatic gene coding errors, base substitution, gene insertion or deletion errors detected in every million bases. 16 The diversity of TMB and cancer types reflect the different immunogenicity, which is intimately related to the ability of the immune system to recognize tumors. As a result, this may be related to the risks of multiple sites of heart or lung transplant recipients.
Herein, we performed a large‐scale examination of prospective cohort studies and conducted a meta‐analysis to determine the risks of overall cancer, and each site‐specific cancer of heart or lung transplant recipients and determine which cancer type has the highest risk. We also compared these associations among recipients with different baseline characteristics and used weighted linear regression (WLR) to analyze the associations between corresponding standardized incidence ratios (SIRs) and TMBs for a better understanding concerning the role of the immune system in transplant recipients with malignancies and the identification of opportunities to improve transplant safety.
2. METHODS
2.1. Data sources
A comprehensive and systemic search was conducted using network databases, including PubMed (update to February 2020), Web of Science (update to February 2020), EMBASE (1980 to February 2020), and Medline (1966 to February 2020). We used “lung transplantation” or “heart transplantation” combined with “cancer,” “neoplasm,” and “tumor” as well as their Medical Subject Headings (MeSH) terms. A manual search was conducted of the reference lists originating from retrieved review articles and conference abstracts. We contacted the author for supplemental data when important information was missing. Meanwhile, We evaluated all searched results according to the Preferred Reporting Items for Systematic Reviews and Meta‐Analyses (PRISMA) statement (Table S1). 17 The protocol was registered in the Prospective Register of Systematic Reviews (PROSPERO CRD42020159599).
2.2. Study selection criteria
Studies pertaining to the affirmation of cancer risk among heart or lung transplant recipients were included if the following criteria were met: (1) population‐based cohort studies on heart or lung recipients; (2) study reported at least one site‐specific cancer risk (no matter positive or negative results) in heart or lung transplant recipients (3) SIRs and 95% confidence intervals (CIs) could be obtained or estimated from the article. Studies were excluded if they met any of the criteria below: (1) participants received other solid organ transplantations rather than lung or heart transplantation; (2) lack of available data with appropriate statistics; (3) studies were not published in English or duplicate publications.
2.3. Data extraction
Three authors (F.G., Z.H., R.W.) extracted the necessary data independently and any disagreements were resolved after discussion among the 3 investigators. The following information was recorded: the first author's name, reported outcomes, median of follow‐up duration, mean or median age of heart or lung transplant recipients, SIRs with their 95% CIs, country, study period, and publication year. In 2017, Chalmers et al. 18 measured the distribution of TMB across a diverse cohort of 100,000 cancer cases through a targeted comprehensive genomic profiling (CGP) assay, and tested for association between somatic alterations and TMB in over 100 tumor types. We extracted the relevant TMBs directly when the malignancy of the included studies was found in Chalmers’ study. Otherwise, we took the average value of the related malignancies’ TMBs mentioned in the study (leukemia, melanoma, the cancer of cervix, brain, pancreas, liver, breast, prostate, colorectal, skin, lung, and bladder).
2.4. Quality assessment
The methodological quality of the selected studies was evaluated using criteria from the Newcastle Ottawa Scale (NOS) (Table 1), which included selection (4 items), comparability (1 item), and outcome (3 items). 19 Any disagreement was resolved by consensus.
TABLE 1.
Demographic details of the included studies
| Study | Region | Number of transplant cases | Median/Mean age (years) | Median Follow‐up Duration (years) | NOS scores | Reported outcomes |
|---|---|---|---|---|---|---|
| Heart transplantation | ||||||
| Serraino et al. (2007) 25 | Italy | 724 | NA | 6.2 | 7 | All cancers, LC, Lung cancer, NHL, KS |
| Kellerman et al. (2009) 26 | USA | 851 | 53.0 | 5.3 | 8 | OC, LC, SC, CC, PC, PLC, Lung cancer, BC, Prostate cancer, KC, Bladder cancer, KS, Melanoma, Brain cancer |
| Collett et al. (2010) 27 | UK | 3609 | 42.0 | NA | 7 | All cancers, SCC, Lip cancer, OC, LC, AC, CC, Lung cancer, BCC, KC, HL, NHL, NMSC |
| Jiang et al. (2010) 28 | Canadian | 1703 | 55.0 | 4.8 | 9 | All cancers, OC, CC, PC, PLC, Lung cancer, BC, Prostate cancer, KC, Bladder cancer, NHL, Melanoma |
| Jensen et al. (2010) 29 | Denmark | 459 | 50.0 | NA | 8 | SCC, BCC, Melanoma |
| Engels et al., (2011) 30 | USA | 17593 | 47.0 | 7.5 | 8 | LC, Lung cancer, KC, NHL |
| Na et al. (2013) 7 | Australia | 1518 | 47.0 | 5.2 | 8 | All cancers, Lip cancer, OC, Esophagus cancer, LC, CC, Lung cancer, KC, HL, NHL, KS, NMSC, Melanoma, Brain cancer |
| Ohman et al. (2015) 33 | Sweden | 437 | 42.9 | 5.7 | 8 | Lip cancer, OC, KC, Bladder cancer |
| Safaeian et al. (2016) 34 | USA | 22186 | 48.0 | 3.7 | 9 | CC |
| Hortlund et al. (2017) 37 | Multiple (Denmark/Sweden) | 506/894 | 45.5/45.5 | 8.8/8.8 | 8 | All cancers, Lip cancer, KC, HL, NHL, NMSC |
| Jäämaa‐Holmberg et al. (2019) 41 | Finland | 479 | 55.0 | 9.4 | 9 | All cancers, SCC, Lip cancer, OC, Esophagus cancer, SC, CC, Lung cancer, Prostate cancer, KC, Bladder cancer, HL, NHL, KS, BCC, Melanoma |
| O'Neill et al. (2019) 43 | Ireland | 214 | 47.1 | 7.0 | 8 | All cancers, SCC, AC, Prostate cancer CC, Lung cancer, BC, NHL, BCC |
| Lung cancer transplantation | ||||||
| Jensen et al. (2010) 28 | Denmark | 384 | 53.0 | 5.0 | 8 | HL, BCC, Melanoma |
| Collett et al. (2010) 27 | UK | 2058 | 42.0 | NA | 7 | All cancers, SCC, OC, LC, Lung cancer, BC, KC, HL, NHL, KS, NMSC |
| Engels et al. (2011) 30 | USA | 7013 | 47.0 | 7.5 | 8 | LC, CC, Lung cancer, KC, PTLD |
| Krynitz et al. (2013) 31 | Sweden | 1012 | 50.0 | 5.0 | 8 | All cancers, SCC, Lip cancer, OC, LC, SC, CC, PLC, Lung cancer, BC, Cervix cancer, VVC, Prostate cancer, Bladder cancer, HL, Leukemia, Skin cancer, Melanoma, Brain cancer, TC |
| Na et al. (2013) 7 | Australia | 1200 | 47.0 | 5.2 | 8 | All cancers, CC, Lung cancer, NHL, NMSC |
| Morton et al. (2014) 32 | USA | 8543 | 57.0 | 10.0 | 8 | HL, Leukemia |
| Ohman et al. (2015) 33 | Sweden | 359 | 52.0 | 3.2 | 8 | Lip cancer |
| Hortlund et al. (2017) 37 | Multiple (Denmark/Sweden) | 471/584 | 45.5/45.5 | 8.8/8.8 | 8 | All cancers, Lip cancer, NMSC |
| Ekstrom et al. (2017) 35 | Sweden | 331 | 55.4 | 2.8 | 9 | All cancers, SCC, LC, SC, CC, Lung cancer, BC, Cervix cancer, VVC, Prostate cancer, Bladder cancer, PTLD, NHL, Leukemia, Skin cancer |
| Fink et al. (2017) 36 | USA | 1681 | 57.0 | 3.7 | 7 | All cancers, CC, KC, NHL |
| Magruder et al. (2017) 38 | USA | 18093 | 55.0 | 3.0 | 8 | All cancers, OC, Esophagus cancer, LC, SC, CC, PLC. Lung cancer, BC, Cervix cancer, VVC, Prostate cancer, KC, Bladder cancer, PTLD, Leukemia, KS, non‐Melanoma, skin cancer, Brain cancer, TC |
| Rizvi et al. (2017) 39 | Norway | 360 | 50.8 | 4.1 | 8 | SCC |
| Tsai et al. (2019) 40 | China | 1047 | 45.7 | 4.7 | 8 | All cancers, SCC, OC, Esophagus cancer, LC, CC, Lung cancer, BC, Cervix cancer, Prostate cancer, Bladder cancer, HL, NMSC, Brain cancer, TC |
| O'Neill et al. (2019) 43 | Ireland | 188 | 40.9 | 4.0 | 9 | All cancers, SCC, CC, Lung cancer, Cervix cancer, VVC, Prostate cancer, PTLD, NHL, Skin cancer, BCC |
| Triplette et al. (2019) 44 | USA | 8993 | 54.0 | 3.9 | 9 | SCC, Lung cancer |
| Laprise et al. (2019) 42 | USA | 12948 | 57.0 | 4.0 | 8 | Lip cancer |
Abbreviations: AC, Anus cancer; BC, Breast cancer; BCC, Basal cell carcinoma; CC, Colorectal cancer; HL, Hodgkin's lymphoma; KC, Kidney cancer; KS, Kaposi sarcoma; LC, Lung cancer; NHL, non‐Hodgkin's lymphoma; NMSC, non‐Melanoma skin cancer; OC, Oral cancer; PC, Pancreas cancer; PLC, Pharynx and larynx cance; PTLD, Posttransplant lymphoproliferative disorders; SC, Stomach cancer; TC, Thyroid cancer; VVC, Vulva and vagina cancer.
2.5. Statistical analysis
We examined cancer risks in heart or lung transplant recipients on the basis of the SIRs and their 95% CIs published in each study. A random‐effects model was adopted to calculate SIRs and 95% CIs 20 , 21 for heart or lung transplant recipients versus the general population. The synthesized SIRs were classified into 7 modules by anatomical site or histology: all cancers, digestive system, respiratory system, reproductive and urinary systems, lymphatic and hematological systems, integumentary system, and neurological system. We conducted subgroup analyses to investigate sources of heterogeneity and sensitivity analyses to explore whether any study had a large influence on the pooled‐effect estimates. Subgroup analysis based on age (50 years or older, <50 years) and region (Europe, Asia, North America, Oceania) was carried out. Sensitivity analysis was conducted by consecutive exclusion of each study. Heterogeneity was assessed using Cochran's Q test and the I 2 statistic; we defined statistical heterogeneity as noteworthy if an I 2 statistic ≥50%. 22 Funnel plot tests, Egger's test, 23 and Begg's test 24 were utilized to appraise the publication bias. The population sizes of heart or lung transplantation were used as weights in the WLR to analyze the association and calculate the correlation coefficients between TMBs and SIRs in multiple‐site cancers. Because both TMBs and SIRs were not normally distributed, we took the logarithm of each and compared them. All statistical manipulation was carried out by Stata software (version 15, StataCorp). All p‐values were 2‐tailed; statistical significance was considered as p‐value <0.05.
3. RESULTS
3.1. Study selection
In total, 1324 citations met the search criteria. After elimination of 619 duplicates, 705 underwent title and abstract screening. The full text of 98 articles was examined. Finally, 21 7 , 25 , 26 , 27 , 28 , 29 , 30 , 31 , 32 , 33 , 34 , 35 , 36 , 37 , 38 , 39 , 40 , 41 , 42 , 43 , 44 of them met the inclusion criteria for our meta‐analysis (Figure 1).
FIGURE 1.
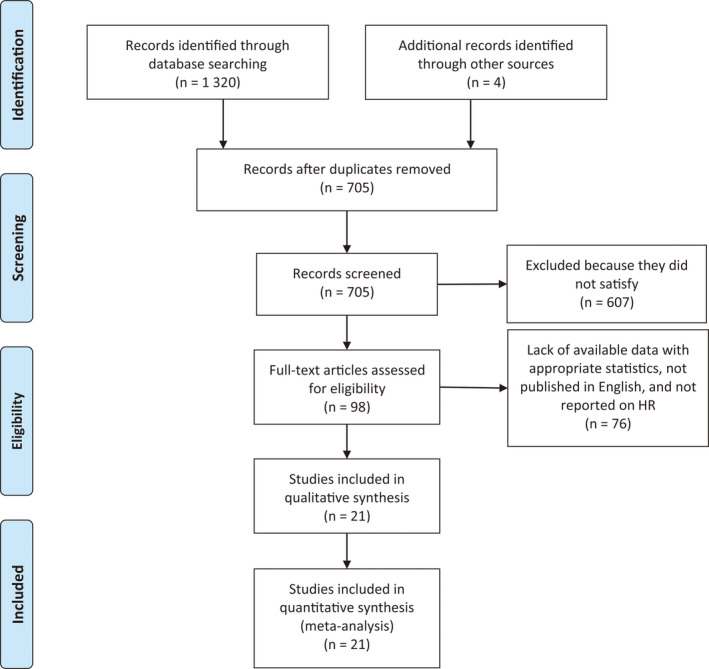
PRISMA diagram of study selection
3.2. Study characteristics
All 21 studies were prospective cohort studies. Table 1 shows the demographic details of the included studies. In heart or lung transplantation, 51,173 and 65,265 recipients were followed up for a total of 259,913.2 and 341,417.5 person‐years, with a median follow‐up time of 6.4 (range: 3.7–9.4 years) and 5.2 (range: 2.8–10.0 years) years, respectively. The mean or median age of heart and lung transplant recipients was 48.4 (range: 42.0–55.0) and 50.3 (range: 40.9–57.0) years old with organ transplantation, respectively.
3.3. Cancer risk in transplant recipients
A pooled analysis of 21 studies on the risk of various cancers in heart or lung transplant recipients is presented in Table 2. Furthermore, Figures S1–S4 show the forest plot for cancer at different sites. Both heart and lung transplant recipients were at a higher risk of all cancers, with a 3.13‐fold higher cancer risk [SIR: 3.13; 95% CI: 2.38–4.13; p < 0.001] and a 4.28‐fold higher cancer risk [SIR: 4.28; 95% CI: 3.18–5.77; p < 0.001], respectively. As for system‐specific cancers, among heart transplant recipients, the most common five systems were integumentary system [SIR: 22.86; 95% CI: 15.32–34.11; p < 0.001], lymphatic and hematological systems [SIR: 12.65; 95% CI: 8.58–18.94; p < 0.001], reproductive and urinary systems [SIR: 2.57; 95% CI: 1.85–3.56; p < 0.001], respiratory system [SIR: 2.43; 95% CI: 2.04–2.89; p < 0.001], digestive system [SIR: 1.48; 95% CI: 1.11–1.96; p = 0.007]. The most common five systems with the highest increased risk in lung transplant recipients were lymphatic and hematological systems [SIR: 14.24; 95% CI: 9.69–20.95; p < 0.001], integumentary system [SIR: 12.26; 95% CI: 7.03–22.81; p < 0.001], respiratory system [SIR: 5.90; 95% CI: 4.66–88.03; p < 0.001], digestive system [SIR: 3.49; 95% CI: 2.00–6.08; p < 0.001], reproductive and urinary systems [SIR: 1.96; 95% CI: 1.40–2.74; p < 0.001]. The results of sensitivity analyses are listed in Figures S5–S6, indicating that the omission of any single study did not result in a significant difference of the pooled results, except for cancer of colorectal, anus, liver, respiratory system, and reproductive and urinary systems in heart transplant recipients and cancer of esophagus, stomach, liver, pharynx and larynx, breast, cervix, vulva and vagina, kidney, bladder, basal cell carcinoma, and non‐melanoma in lung transplant recipients. However, the variable findings may be attributed to the limited number of included cohorts or the effects of heart or lung transplantation.
TABLE 2.
SIRs of all cancers and specific cancer types by anatomical site or histology among heart or lung transplant recipients
| Site | Heart | Lung | ||||||||
|---|---|---|---|---|---|---|---|---|---|---|
| N | SIR (95% Cl) | p‐value | I‐square | P heterogeneity | N | SIR (95% Cl) | p‐value | I‐square | P heterogeneity | |
| All cancers | 8 | 3.13 (2.38, 4.13) | <0.001 | 96.2% | <0.001 | 10 | 4.28 (3.18, 5.77) | <0.001 | 95.8% | <0.001 |
| Digestive system | 20 | 1.48 (1.11, 1.96) | 0.007 | 43.9% | 0.019 | 19 | 3.49 (2.00, 6.08) | <0.001 | 92.1% | <0.001 |
| Esophagus | 2 | 1.73 (0.44, 6.89) | 0.435 | 0.0% | 0.812 | 2 | 3.26 (1.16, 9.12) | 0.025 | 12.5% | 0.285 |
| Stomach | 2 | 1.66 (0.37, 7.35) | 0.506 | 0.0% | 0.715 | 3 | 4.76 (1.58, 14.31) | 0.005 | 58.8% | 0.088 |
| Colorectal | 7 | 1.16 (0.84, 1.60) | 0.371 | 51.7% | 0.053 | 8 | 3.38 (1.44, 7.92) | 0.005 | 96.0% | <0.001 |
| Anus | 2 | 8.49 (2.63, 27.39) | <0.001 | 0% | 0.667 | — | — | — | — | — |
| Liver | 5 | 1.40 (0.89, 2.20) | 0.149 | 0.0% | 0.421 | 6 | 3.37 (1.23, 9.24) | 0.018 | 70.9% | 0.004 |
| Pancreas | 2 | 2.62 (0.91, 7.55) | 0.075 | 0.0% | 0.446 | — | — | — | — | — |
| Respiratory system | 16 | 2.90 (2.31, 3.64) | <0.001 | 61.4% | 0.001 | 15 | 5.19 (4.04, 6.68) | <0.001 | 76.5% | <0.001 |
| Pharynx and larynx | 2 | 2.24 (0.67, 7.49) | 0.190 | 0.0% | 0.712 | 2 | 4.54 (1.58, 14.31) | 0.005 | 0.0% | 0.967 |
| Lung | 8 | 2.42 (2.01, 2.93) | <0.001 | 50.3% | 0.050 | 9 | 5.97 (4.66, 7.66) | <0.001 | 80.4% | <0.001 |
| Oral cavity | 6 | 6.48 (3.40, 12.37) | <0.001 | 46.7% | 0.095 | 4 | 2.34 (0.88, 6.25) | 0.090 | 58.4% | 0.065 |
| Reproductive and urinary systems | 20 | 2.57 (1.85, 3.56) | <0.001 | 19.9% | 0.290 | 27 | 1.96 (1.40, 2.74) | <0.001 | 72.0% | 0.770 |
| Breast | 3 | 1.72 (0.69, 4.27) | 0.244 | 0.0% | 0.705 | 5 | 0.77 (0.58, 1.03) | 0.077 | 23.8% | 0.283 |
| Cervix | — | — | — | — | — | 5 | 3.02 (1.07, 8.49) | 0.036 | 64.5% | 0.024 |
| Vulva and vagina | — | — | — | — | — | 4 | 10.16 (3.50, 29.50) | <0.001 | 0.0% | 0.883 |
| Prostate | 4 | 1.29 (0.97, 1.71) | 0.075 | 0.0% | 0.924 | 5 | 1.25 (0.87, 1.81) | 0.230 | 15.8% | 0.314 |
| Kidney | 9 | 4.29 (2.90, 6.36) | <0.001 | 65.6% | 0.003 | 4 | 2.71 (1.30, 5.64) | 0.008 | 54.7% | 0.085 |
| Bladder | 4 | 1.86 (0.83, 4.16) | 0.129 | 19.9% | 0.290 | 4 | 2.84 (1.81, 4.44) | <0.001 | 0.0% | 0.770 |
| Lymphatic and hematological systems | 12 | 12.75 (8.58, 18.94) | <0.001 | 91.5% | <0.001 | 19 | 14.24 (9.69, 20.95) | <0.001 |
88.8% |
<0.001 |
| PTLD a | — | — | — | — | — | 4 | 17.95 (15.33, 21.02) | <0.001 | 0.0% | 0.607 |
| Hodgkin's lymphoma | 4 | 11.64 (6.50, 20.87) | <0.001 | 0.0% | 0.912 | 5 | 8.83 (2.81, 27.69) | <0.001 | 91.1% | <0.001 |
| non‐Hodgkin's lymphoma | 8 | 13.00 (8.21, 20.59) | <0.001 | 94.6% | <0.001 | 6 | 29.62 (19.07, 46.03) | <0.001 | 82.1% | <0.001 |
| Leukemia | — | — | — | — | — | 4 | 2.15 (1.10, 4.17) | 0.024 | 0.0% | <0.001 |
| Integumentary system | 27 | 22.86 (15.32, 34.11) | <0.001 | 96.9% | <0.001 | 27 | 12.66 (7.03, 22.81) | <0.001 | 98.5% | <0.001 |
| Skin cancer | — | — | — | — | — | 3 | 28.83 (9.44, 88.03) | <0.001 | 98.1% | <0.001 |
| Kaposi sarcoma | 4 | 112.76 (62.25, 204.25) | <0.001 | 0.0% | 0.474 | 2 | 9.64 (1.26, 73.91) | 0.029 | 0.0% | 0.971 |
| Lip | 6 | 49.92 (29.26, 85.19) | <0.001 | 75.1% | 0.001 | 5 | 29.15 (7.10, 119.72) | <0.001 | 95.6% | <0.001 |
| Squamous cell carcinoma | 4 | 55.54 (28.27, 109.13) | <0.001 | 95.5% | <0.001 | 7 | 10.65 (1.81, 62.54) | 0.009 | 99.4% | <0.001 |
| Basal cell carcinoma | 4 | 7.74 (5.67, 10.58) | <0.001 | 70.3% | 0.018 | 2 | 6.08 (3.02, 12.21) | <0.001 | 44.1% | 0.181 |
| non‐Melanoma skin cancer | 4 | 39.31 (17.74, 87.09) | <0.001 | 98.1% | <0.001 | 6 | 10.72 (3.76, 30.59) | <0.001 | 97.5% | 0.000 |
| Melanoma | 5 | 3.06 (2.23, 4.19) | <0.001 | 0.0% | 0.981 | 2 | 2.43 (0.85, 6.97) | 0.098 | 0.0% | 0.955 |
| Neurological | 2 | 2.28 (0.69, 7.52) | 0.178 | 0.0% | 0.403 | 6 | 2.18 (1.22, 3.92) | 0.009 | 16.5% | 0.308 |
| Brain | 2 | 2.28 (0.69, 7.52) | 0.178 | 0.0% | 0.403 | 3 | 2.12 (0.93, 4.83) | 0.075 | 0.0% | 0.915 |
| Thyroid | — | — | — | — | — | 3 | 2.69 (0.75, 9.74) | 0.131 | 65.5% | 0.055 |
An SIR >1 suggests that the cancer risk is higher than that of the ordinary population; The p‐values less than 0.05 are in bold.
Abbreviations: CI, Confidence interval; N, Number of studies; PTLD, Posttransplant lymphoproliferative disorders; SIR, Standardized incidence ratio.
PTLD is not a separate category from Non‐Hodgkin lymphoma or Hodgkin lymphoma.
3.4. Correlation between SIRs and TMBs
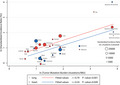
In heart or lung transplant recipients, we observed a significant correlation between TMBs and SIRs (heart transplantation: p = 0.049; lung transplantation: p < 0.001). The correlation coefficients between SIRs and TMBs (heart transplantation: 0.54 and lung transplantation: 0.79) suggested that 29% and 63% of the differences in SIRs across cancer types might be explained by the TMBs, respectively (Figure 2).
FIGURE 2.
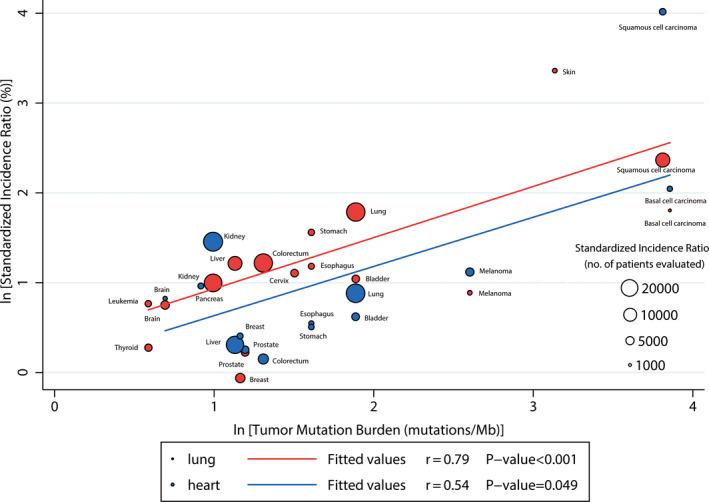
Correlation between Tumor Mutational Burdens and Standardized Incidence Ratios in heart or lung transplant recipients. The number of transplant recipients who were analyzed for the SIR is shown for each tumor type (size of the circle). Data on the x and y axis are shown on a logarithmic scale
3.5. Subgroup analyses
The results of our subgroup analyses are presented in Table 3. Furthermore, Figures S7–S10 show the forest plot for cancer at different sites. We performed subgroup analyses according to age (50 years or older, <50 years), and region (Europe, Asia, North America, Oceania). First, we found that heart transplant recipients older than 50 years were at higher risk for cancers than those younger than 50 years, with the exception of lung cancer. Second, lung transplant recipients had significantly higher risks of lung and liver cancers in Europe than in other regions. Third, our study denoted that lung transplant recipients were at the highest risk for all cancers in South America. Fourth, most malignancies were at increased risks worldwide in transplant recipients, while a few tumors were at decreased risk. It may be associated with the different susceptibilities of the malignancies in different regions. Subgroup analysis showed that the age and region of transplant recipients are not the source of heterogeneity.
TABLE 3.
SIRs of all cancers and specific cancer types among heart or lung transplant recipients in subgroup analysis
| Site | Heart | Lung | ||||||||
|---|---|---|---|---|---|---|---|---|---|---|
| N | SIR (95% Cl) | p‐value | I‐square | P heterogeneity | N | SIR (95% Cl) | p‐value | I‐square | P heterogeneity | |
| Age group | ||||||||||
| <50 yr | 34 | 3.68 (2.72, 4.97) | <0.001 | 97.4% | <0.001 | 46 | 4.37 (3.01, 6.35) | <0.001 | 97.9% | <0.001 |
| All cancers | 5 | 2.95 (2.23, 3.90) | <0.001 | 93.8% | <0.001 | 7 | 3.52 (2.80, 4.41) | <0.001 | 85.6% | <0.001 |
| Squamous cell carcinoma | 2 | 46.24 (8.08, 254.66) | <0.001 | 97.7% | <0.001 | 3 | 4.28 (0.48, 37.80) | 0.191 | 95.4% | <0.001 |
| Oral cavity | 3 | 5.02 (2.59, 9.74) | <0.001 | 0.0% | 0.525 | 3 | 3.14 (0.80, 12.33) | 0.102 | 61.7% | 0.074 |
| Colorectal | 4 | 0.99 (0.85, 1.17) | 0.942 | 0.0% | 0.665 | 5 | 1.49 (1.09, 2.04) | 0.014 | 23.4% | 0.265 |
| Liver | 3 | 1.10 (0.65, 1.85) | 0.725 | 0.0% | 0.806 | 4 | 2.23 (0.55, 9.09) | 0.264 | 72.1% | 0.013 |
| Lung | 4 | 2.51 (2.18, 2.89) | <0.001 | 18.1% | 0.300 | 6 | 5.12 (3.99, 6.57) | <0.001 | 48.7% | 0.083 |
| Cervix | — | — | — | — | — | 3 | 3.86 (0.92, 16.26) | 0.065 | 42.4% | 0.176 |
| Prostate | — | — | — | — | — | 3 | 1.64 (0.93, 2.89) | 0.089 | 0.0% | 0.369 |
| Kidney | 6 | 4.07 (2.70, 6.12) | <0.001 | 57.8% | 0.037 | 2 | 1.63 (0.81, 3.26) | 0.171 | 0.0% | 0.586 |
| Bladder | — | — | — | — | — | 2 | 2.00 (0.77, 5.19) | 0.153 | 0.0% | 0.504 |
| PTLD a | — | — | — | — | — | 2 | 18.62 (15.57, 22.25) | <0.001 | 0.0% | 0.519 |
| non‐Hodgkin's lymphoma | 5 | 8.89 (5.05, 15.66) | <0.001 | 93.9% | <0.001 | 4 | 22.82 (17.01, 30.63) | <0.001 | 40.7% | 0.504 |
| non‐Melanoma skin cancer | — | — | — | — | 4 | 20.23 (7.30, 56.08) | <0.001 | 97.4% | <0.001 | |
| Melanoma | 2 | 3.00 (2.06, 4.37) | <0.001 | 0.0% | 0.660 | — | — | — | ||
| ≥50 yr | 25 | 4.56 (2.57, 8.08) | <0.001 | 98.0% | <0.001 | 26 | 7.25 (3.70, 14.10) | <0.001 | 99.3% | <0.001 |
| All cancers | 2 | 4.03 (1.84, 8.82) | <0.001 | 98.3% | <0.001 | 3 | 6.83 (2.93, 16.93) | <0.001 | 98.7% | <0.001 |
| Squamous cell carcinoma | 2 | 67.14 (41.32, 109.09) | <0.001 | 88.3% | 0.003 | 4 | 20.92 (1.98, 220.51) | 0.011 | 99.6% | <0.001 |
| Oral cavity | 3 | 8.37 (2.43, 28.91) | 0.001 | 74.1% | 0.021 | — | ||||
| Colorectal | 3 | 1.35 (0.44, 4.12) | 0.600 | 76.7% | 0.014 | 3 | 8.25 (1.71, 39.74) | 0.009 | 96.8% | <0.001 |
| Liver | 1 | 3.30 (0.61, 18.00) | 0.522 | — | — | 2 | 6.62 (1.10, 40.04) | 0.039 | 79.6% | 0.027 |
| Lung | 3 | 2.05 (1.00, 4.17) | 0.049 | 79.3% | 0.008 | 3 | 8.10 (4.42, 14.85) | <0.001 | 93.5% | <0.001 |
| Cervix | — | — | — | — | — | 2 | 2.44 (0.40, 14.68) | 0.334 | 85.8% | <0.001 |
| Prostate | — | — | — | — | — | 2 | 1.04 (0.76, 1.42) | 0.817 | 0.0% | 0.352 |
| Kidney | 3 | 4.32 (1.61, 11.60) | 0.004 | 71.5% | 0.030 | 2 | 4.48 (0.97, 20.60) | 0.054 | 77.6% | 0.035 |
| Bladder | 3 | 1.69 (0.61, 4.65) | 0.313 | 46.6% | 0.154 | 2 | 3.13 (1.89, 5.21) | <0.001 | 0.0% | 0.880 |
| PTLD a | — | — | — | — | — | 2 | 17.95 (15.33, 21.02) | <0.001 | 0.0% | 0.607 |
| non‐Hodgkin's lymphoma | 2 | 23.78 (19.30, 29.29) | <0.001 | 0.0% | 0.572 | 2 | 52.19 (33.79, 80.63) | <0.001 | 43.2% | 0.185 |
| non‐Melanoma skin cancer | — | — | — | — | — | 1 | 2.19 (1.31, 3.69) | 0.004‐ | ||
| Melanoma | 3 | 3.20 (1.81, 8.82) | <0.001 | 0.0% | 0.910 | — | — | — | ||
| Region group | — | — | — | |||||||
| South America | 15 | 2.74 (1.66, 4.50) | <0.001 | 97.8% | <0.001 | 18 | 4.86 (3.16, 7.49) | <0.001 | 98.6% | <0.001 |
| All cancers | 1 | 2.70 (2.30, 3.20) | <0.001 | — | — | 4 | 5.07 (3.21, 8.02) | <0.001 | 96.5% | <0.001 |
| Squamous cell carcinoma | — | — | — | — | — | 1 | 8.10 (6.30, 10.30) | <0.001 | ||
| Oral cavity | 2 | 4.42 (2.46, 7.93) | <0.001 | 0.0% | 0.805 | — | — | — | ||
| Colorectal | 3 | 0.95 (0.79, 1.13) | 0.553 | 0.0% | 0.937 | 3 | 3.88 (0.98, 15.41) | 0.054 | 98.3% | <0.001 |
| Liver | 2 | 1.39 (0.50, 3.80) | 0.527 | 39.2% | 0.200 | 2 | 2.46 (1.20, 5.05) | 0.014 | 0.0% | 0.667 |
| Lung | 3 | 1.95 (1.20, 3.15) | 0.007 | 75.4% | 0.017 | 3 | 5.67 (4.68, 6.87) | <0.001 | 69.4% | 0.038 |
| Kidney | 1 | 2.88 (2.33, 3.55) | <0.001 | — | — | 3 | 2.84 (1.16, 6.98) | 0.023 | 69.8% | 0.036 |
| PTLD a | — | — | — | — | — | 2 | 17.42 (13.69, 22.17) | <0.001 | 30.3% | 0.231 |
| non‐Hodgkin's lymphoma | 2 | 13.21 (4.63, 37.68) | <0.001 | 98.1% | <0.001 | 1 | 61.80 (43.52, 87.75)‐ | <0.001 | ||
| non‐Melanoma skin cancer | — | — | — | — | — | 1 | 2.19 (1.31, 3.71) | 0.003 | ||
| Melanoma | 2 | 2.95 (1.47, 5.92) | 0.002 | 0.0% | 0.886 | — | — | — | ||
| Europe | 37 | 7.38 (4.86, 11.21) | <0.001 | 98.8% | <0.001 | 31 | 9.80 (5.24, 18.32) | <0.001 | 98.8% | <0.001 |
| All cancers | 6 | 3.29 (2.30, 4.72) | <0.001 | 96.8% | <0.001 | 4 | 4.50 (2.47, 8.20) | <0.001 | 96.5% | <0.001 |
| Squamous cell carcinoma | 4 | 55.54 (28.27, 109.13) | <0.001 | 95.5% | <0.001 | 5 | 15.70 (1.52, 161.03) | 0.021 | 99.2% | <0.001 |
| Oral cavity | 3 | 10.06 (3.28, 4.72) | <0.001 | 65.8% | 0.053 | 2 | 6.42 (2.24, 18.34) | 0.001 | 0.0% | 0.714 |
| Colorectal | 3 | 1.87 (0.83, 4.21) | 0.034 | 70.5% | 0.034 | 3 | 3.88 (0.73, 20.77) | 0.113 | 77.4% | 0.012 |
| Liver | 2 | 2.15 (0.87, 5.32) | 0.366 | 0.0% | 0.366 | 3 | 9.96 (4.37, 22.71) | <0.001 | 0.0% | 0.375 |
| Lung | 4 | 2.76 (2.04, 3.75) | <0.001 | 43.9% | 0.148 | 4 | 8.73 (4.39, 17.34) | <0.001 | 82.2% | 0.001 |
| Kidney | 5 | 6.35 (4.21, 9.60) | <0.001 | 33.5% | 0.198 | 1 | 2.50 (0.46, 13.69) | 0.632 | ||
| PTLD a | — | — | — | — | — | 2 | 17.95 (15.33, 21.02) | <0.001 | 0.0% | 0.607 |
| non‐Hodgkin's lymphoma | 5 | 16.70 (11.11, 24.97) | <0.001 | 71.9% | 0.007 | 4 | 27.96 (22.29, 35.08) | <0.001 | 0.0% | 0.403 |
| non‐Melanoma skin cancer | 3 | 41.52 (16.13, 106.85) | <0.001 | 98.7% | <0.001 | 3 | 39.99 (13.70, 108.75) | <0.001 | 97.5% | <0.001 |
| Melanoma | 2 | 3.38 (1.35, 8.43) | 0.009 | 0.0% | <0.001 | 2 | 2.43 (0.85, 6.97) | 0.098 | 0.0% | 0.955 |
| Asia | 7 | 1.79 (1.26, 2.56) | 0.001 | 29.5% | 0.203 | |||||
| All cancers | — | — | — | — | — | 1 | 1.65 (1.21, 2.24) | 0.001 | — | — |
| Squamous cell carcinoma | — | — | — | — | — | 1 | 1.99 (0.95, 4.17) | 0.068 | — | — |
| Oral cavity | — | — | — | — | — | — | — | — | — | — |
| Colorectal | — | — | — | — | — | 1 | 1.99 (0.95, 4.17) | 0.843 | — | — |
| Liver | — | — | — | — | — | 1 | 0.21 (0.03, 1.49) | 0.068 | — | — |
| Lung | — | — | — | — | — | 1 | 2.29 (1.52, 5.61) | 0.117 | — | — |
| Kidney | — | — | — | — | — | 1 | 2.29 (1.52, 5.61) | 0.001 | — | — |
| non‐Hodgkin's lymphoma | — | — | — | — | — | — | — | — | — | — |
| non‐Melanoma skin cancer | — | — | — | — | — | 1 | 2.98 (0.42, 21.20) | 0.275 | — | — |
| Melanoma | — | — | — | — | — | — | — | — | — | — |
| Oceania | 8 | 2.61 (1.64, 4.13) | <0.001 | 88.5% | <0.001 | 5 | 4.42 (2.28, 8.59) | <0.001 | 91.7% | <0.001 |
| All cancers | 1 | 2.64 (2.32, 2.98) | <0.001 | — | — | 1 | 4.28 (3.49, 5.19) | <0.001 | — | — |
| Squamous cell carcinoma | — | — | — | — | — | — | — | — | — | ‐ |
| Oral cavity | 1 | 1.41 (0.04, 7.88) | 0.799 | — | — | — | — | — | — | — |
| Colorectal | 1 | 0.99 (0.54, 1.63) | 0.972 | — | — | 1 | 2.58 (1.12, 5.09) | 0.014 | — | — |
| Liver | 1 | 1.85 (0.22, 6.69) | 0.480 | — | — | — | — | — | — | — |
| Lung | 1 | 2.18 (1.39, 3.22) | <0.001 | — | — | 1 | 3.82 (1.65, 3.53) | <0.001 | — | — |
| Kidney | 1 | 2.36 (0.87, 5.14) | 0.058 | — | — | — | — | — | — | — |
| non‐Hodgkin's lymphoma | 1 | 7.80 (5.71, 10.41) | <0.001 | — | — | 1 | 16.8 (11.1, 24.4) | <0.001 | — | — |
| non‐Melanoma skin cancer | — | — | — | — | — | 1 | 1.64 (0.53, 3.83) | 0.327 | — | — |
| Melanoma | 1 | 3.04 (2.03, 4.36) | <0.001 | — | — | — | — | — | — | — |
An SIR >1 suggests that the cancer risk is higher than that of the ordinary population; The p‐values less than 0.05 are in bold.
Abbreviations: CI, Confidence interval; N, Number of studies; PTLD, Posttransplant lymphoproliferative disorders; SIR, Standardized incidence ratio; yr, years old.
PTLD is not a separate category from Non‐Hodgkin lymphoma or Hodgkin lymphoma.
3.6. Publication bias analysis
Significant heterogeneity existed in the pooled analyses. With the limited information available, we were unable to detect any source leading to substantial heterogeneity. Furthermore, Egger's and Begg's test results showed no evidence of publication bias for all cancers analyzed in heart or lung transplant recipients (Figures S11–S12).
4. DISCUSSION
Our large‐scale quantitative study included 116,438 transplant recipients (51,173 heart transplant recipients and 65,265 lung transplant recipients) from 29 cohorts (12 cohorts for heart transplantation and 17 cohorts for lung transplantation). In terms of our results, we found that heart and lung transplant populations had significantly increased risks of cancer compared with the general population. Moreover, the incidences of various malignancies we observed correlate closely with data previously reported for a variety of post‐transplantation patient populations.
In 2011, Engels et al. 30 conducted a large cohort study to calculate the risk of cancers in solid organ transplant recipients. They found that the Non‐Hodgkin's lymphoma (NHL) incidence was the highest in lung recipients, which is consistent with the results we observed. However, they reported that the risk of breast and prostate cancer were decreased in solid organ transplant recipients, we did not find the association in heart or lung transplantation. Overall, it does appear that heart or lung transplant patients remain more vulnerable to malignancy than the overall solid organ transplant population [The SIR of heart and lung transplant patients are 3.13 (2.38, 4.13) and 4.28 (3.18, 5.77), respectively, versus 2.10 (2.06–2.14) for all solid organ transplant recipients]. Heo et al. 45 reported the cancer risk among renal transplant recipients. Similarly, NHL also showed a higher risk [SIR: 28.64 (7.70–73.32)] in renal transplantation. We found that the incidence of kidney cancer was higher in renal transplantation than in heart or lung transplantation. [The SIR of heart and lung transplant patients are 4.29 (2.90, 6.36) and 2.71 (1.30, 5.64), respectively, versus 16.31 (7.44–30.95) for renal transplant recipients]. Furthermore, the findings of our subgroup analyses indicated that the risk of certain cancers (e.g., lung cancer, liver cancer) varied by regions and ages, suggesting the presence of ethnicity‐based and age‐based differences. As the most common cause of mortality in patients with solid organ transplant, 46 we observed that the incidence of posttransplant lymphoproliferative disorders (PTLD) increased significantly in lung transplantation and the rate not influenced by age and region.
Several mechanisms may explain the increased cancer risk for heart or lung transplant recipients. Both viral and nonviral factors are involved in cancer progression after heart or lung transplantation. Infection with the hepatitis C and hepatitis B virus are considered risk factors for liver cancer, while Epstein‐Barr (EB) virus infection may be associated with an increased risk of non‐Hodgkin's lymphoma. 47 , 48 Additionally, risks also increased for certain malignancies without established links to infections. The risk of few cancers (e.g., non‐melanoma skin cancer and lip cancer) are increased in HIV‐infected populations 12 , 25 which may reflect the loss of immune surveillance, activation of the immune system, or the effects of chronic inflammation. Transplant recipients have higher risks of colorectal and lip cancer than HIV‐infected individuals. 12
Compared with heart transplantation, lung cancer risk was higher among lung recipients, perhaps due to the smoking‐related lung diseases (eg, chronic obstructive pulmonary disease) that could be the indication for a lung transplant, which leads to a worse prognosis in the transplant state. Moreover, lung cancer risk increased over time among lung recipients, suggesting a cumulative effect of transplantation. 30 In lung recipients receiving single‐lung transplantation, most lung cancers occur in the other natural lung. 49 , 50 However, some cancers occurred in the first 6 months after transplantation may have cancers before surgery but delayed reports of cancer discovery in the explanted lung. 51 , 52 It could be the potential reasons for the difference in malignancy rates between heart transplantation and lung transplantation.
Long‐term use of immunosuppressive therapy is related to the increased incidence of cancer. Immunosuppression is possibly related to the direct damage of cells and cell repair systems. 53 , 54 Generally, immunosuppressants act by depleting T cells, leading to decreased acute rejection rates and increased graft survival. 55 Immunosuppressants also have the ability to reduce immune surveillance, which facilitates the survival and proliferation of abnormal cells. 56 In lung transplantation, the use of immunosuppressants is more intensive and the large amount of lymphoid tissue conveyed within the lung graft is the likely cause of the significantly increased risk of non‐Hodgkin's lymphoma in lung transplant recipients. 6 In addition, the significant elevation of skin‐related malignancies (e.g., basal cell carcinoma and SCC) and cervical cancer in transplant recipients may be related to the increased susceptibility to human papillomavirus. 57 Compared with 11% to 32% in normal skin, up to 90% of SCCs in solid organ transplantation recipients contain human papillomavirus DNA. 58 Immunosuppressants have also shown the possibility to increase the risk of UV‐related carcinogenic effects. 59 , 60
TMB is a promising biomarker for predicting the response to immune checkpoint inhibitors of solid tumors. 61 To some extent, TMB reflects the immunogenicity of the tumor. The higher the TMB of a certain cancer is, the more types of abnormal proteins are produced, which would be recognized as antigens, leading to a higher possibility of being recognized by the immune system. Therefore, when the immune system is normal, malignancies with a high TMB are less likely to grow. Immunosuppressive drugs lower the ability of immune surveillance of the immune system, leading to increased survival of high‐TMB malignancies, which supports the increased risk of cancer in transplant recipients. In 2019, D’Arcy et al. 62 reported the survival after cancer diagnosis among solid organ transplant recipients. They found that for most cancers (e.g., melanoma, breast cancer, bladder cancer, colorectal cancer), the cancer‐specific mortality rate of transplant recipients was higher than the cancer patients, especially increase in melanoma, which may be due to the use of immunosuppressants leading to impaired immunity in transplant recipients. Furthermore, melanoma has a higher TMB than most other cancers according to Chalmers et al. study. These findings indicate that the use of immunosuppressants may be an important factor in promoting the occurrence and development of cancers in transplant recipients. The correlation coefficients between SIRs and TMBs suggested that 29% and 63% of the differences in SIRs across cancer types might be explained by the TMBs, respectively. However, as for the remaining 71% and 37%, we tend to believe that it might be explained by the following reasons: the different susceptibilities to different malignancies in transplant recipients, use of individualized doses of immunosuppressants, or the insufficient intensity of cancer screening in transplant recipients. The high correlation between the cancers’ SIRs and their TMBs in lung transplantation may be related to high immunosuppressive intensity in lung transplantation. 6
There are several strengths to this study. First, to our knowledge, this is the first comprehensive meta‐analysis estimating the risk of each site‐specific cancer after heart or lung transplantation and exploring the relationship between corresponding SIRs and their TMBs. Second, the large sample size allowed us to quantitatively assess the impact of heart or lung transplantation on the risk of cancer at multiple sites, thus, our findings were more reliable than any individual study. Third, the SIRs were calculated across subgroups, which could assess the impact of heart or lung transplantation in different populations.
We acknowledge some limitations in regards to our meta‐analysis: first, heterogeneity between studies was high, which may be due to the following: (1) no detailed information on the smoking status, 63 body mass index, 64 alcohol use 65 and immunosuppressants 66 were available that allow us to perform an adjustment for these potential confounders; and (2) although all studies used the general population as reference, the matching criteria for studies in different countries may be different. Second, as there was no pre‐transplant disease data for heart or lung transplant recipients, we cannot determine whether this information would have an effect on heart or lung transplant recipients’ risk of developing cancer. However, this information was very important, which could be the source of bias, such as cystic fibrosis, a prime reason for lung transplantation, it also increases the incidence of gastrointestinal cancers regardless of whether the patient has a transplantation. Third, due to data limitations, we are unable to analyze different subtypes of tumors to explore the impact of tumor properties on the cancer risk of transplant recipients.
In conclusion, this meta‐analysis demonstrated that both heart and lung transplant recipients displayed a higher risk in site‐specific cancers and for most cancers, the cancer‐specific risk was higher in lung transplantation than heart transplantation. Moreover, the correlation between TMBs and SIRs in lung transplantation is higher, which may due to the high immunosuppressive intensity. Such associations can provide individualized guidance for clinicians in the detection of cancer among heart or lung transplantation recipients. In addition, we provided evidence that the risks of different cancers might be related to TMB, suggesting that the increased risks of post‐transplant cancers were attributed to the intervention of immunosuppression.
CONFLICT OF INTEREST
The authors of this manuscript have no conflicts of interest to disclose.
AUTHOR CONTRIBUTIONS
All authors contributed to the design of the study and to the drafting of the paper and have seen and approved the final version.
Supporting information
Table S1‐Fig S1‐S12
ACKNOWLEDGMENTS
This study was supported by the National Natural Science Foundation of China (Grant No.81871893) and Key Project of Guangzhou Scientific Research Project (Grant No.201804020030) provides and maintains database.
Ge F, Li C, Xu X, et al. Cancer risk in heart or lung transplant recipients: A comprehensive analysis of 21 prospective cohorts. Cancer Med. 2020;9:9595-9610. 10.1002/cam4.3525
Fan Ge, Caichen Li, Xin Xu, Zhenyu Huo are joint first authors.
Contributor Information
Jianxing He, Email: drjianxing.he@gmail.com.
Wenhua Liang, Email: liangwh1987@163.com.
DATA AVAILABILITY STATEMENT
The raw data supporting the conclusions of this article will be made available by Jianxing He (drjianxing.he@gmail.com) for a period of 5 years after the publication date.
REFERENCES
- 1. Chambers DC, Cherikh WS, Goldfarb SB, et al. The International Thoracic Organ Transplant Registry of the International Society for Heart and Lung Transplantation: thirty‐fifth adult lung and heart‐lung transplant report‐2018; Focus theme: Multiorgan Transplantation. J Heart Lung Transplant. 2018;37:1169‐1183. [DOI] [PubMed] [Google Scholar]
- 2. Chambers DC, Cherikh WS, Harhay MO, et al. The International Thoracic Organ Transplant Registry of the International Society for Heart and Lung Transplantation: thirty‐sixth adult lung and heart‐lung transplantation Report‐2019; Focus theme: Donor and recipient size match. J Heart Lung Transplant. 2019;38:1042‐1055. [DOI] [PMC free article] [PubMed] [Google Scholar]
- 3. ISHLT Adult Heart Transplantation Statistics . 2018. https://ishltregistries.org/registries/slides.asp
- 4. Aberg F, Pukkala E, Höckerstedt K, Sankila R, Isoniemi H. Risk of malignant neoplasms after liver transplantation: a population‐based study. Liver Transpl. 2008;14:1428‐1436. [DOI] [PubMed] [Google Scholar]
- 5. Adami J, Gäbel H, Lindelöf B, et al. Cancer risk following organ transplantation: a nationwide cohort study in Sweden. Br J Cancer. 2003;89:1221‐1227. [DOI] [PMC free article] [PubMed] [Google Scholar]
- 6. Engels EA, Pfeiffer RM, Fraumeni JF Jr, et al. Spectrum of cancer risk among US solid organ transplant recipients. JAMA. 2011;306:1891‐1901. [DOI] [PMC free article] [PubMed] [Google Scholar]
- 7. Na R, Grulich AE, Meagher NS, McCaughan GW, Keogh AM, Vajdic CM. Comparison of de novo cancer incidence in Australian liver, heart and lung transplant recipients. Am J Transplant. 2013;13:174‐183. [DOI] [PubMed] [Google Scholar]
- 8. Koshiol J, Pawlish K, Goodman MT, McGlynn KA, Engels EA. Risk of hepatobiliary cancer after solid organ transplant in the United States. Clin Gastroenterol. 2014;12(9):1541‐1549.e3. [DOI] [PMC free article] [PubMed] [Google Scholar]
- 9. Nair N, Gongora E, Mehra MR. Long‐term immunosuppression and malignancy in thoracic transplantation: where is the balance? J Heart Lung Transplant. 2014;33:461‐467. [DOI] [PubMed] [Google Scholar]
- 10. de Mattos AM, Olyaei AJ, Bennett WM. Nephrotoxicity of immunosuppressive drugs: long‐term consequences and challenges for the future. Am J Kidney Dis. 2000;35:333‐346. [DOI] [PubMed] [Google Scholar]
- 11. Engels EA. Inflammation in the development of lung cancer: epidemiological evidence. Expert Rev Anticancer Ther. 2008;8:605‐615. [DOI] [PubMed] [Google Scholar]
- 12. Grulich AE, van Leeuwen MT, Falster MO, Vajdic CM. Incidence of cancers in people with HIV/AIDS compared with immunosuppressed transplant recipients: a meta‐analysis. Lancet. 2007;370:59‐67. [DOI] [PubMed] [Google Scholar]
- 13. Guba M, Graeb C, Jauch K‐W, Geissler EK. Pro‐ and anti‐cancer effects of immunosuppressive agents used in organ transplantation. Transplantation. 2004;77:1777‐1782. [DOI] [PubMed] [Google Scholar]
- 14. van Leeuwen MT, Grulich AE, Webster AC, et al. Immunosuppression and other risk factors for early and late non‐Hodgkin lymphoma after kidney transplantation. Blood. 2009;114:630‐637. [DOI] [PubMed] [Google Scholar]
- 15. Dell‐Olio D, Kelly DA. Immunosuppressants: what's new? Curr Opin Organ Transplant. 2010;15:594‐600. [DOI] [PubMed] [Google Scholar]
- 16. Samstein RM, Lee CH, Shoushtari AN, et al. Tumor mutational load predicts survival after immunotherapy across multiple cancer types. Nat Genet. 2019;51:202‐206. [DOI] [PMC free article] [PubMed] [Google Scholar]
- 17. Moher D, Liberati A, Tetzlaff J, Altman DG. Preferred reporting items for systematic reviews and meta‐analyses: the PRISMA statement. PLoS Med. 2009;6:e1000097. [DOI] [PMC free article] [PubMed] [Google Scholar]
- 18. Chalmers ZR, Connelly CF, Fabrizio D, et al. Analysis of 100,000 human cancer genomes reveals the landscape of tumor mutational burden. Genome Med. 2017;9:34. [DOI] [PMC free article] [PubMed] [Google Scholar]
- 19. Wells GJhwocpceoa . The Newcastle‐Ottawa Scale (NOS) for assessing the quality of non randomised studies in meta‐analyses. 2001.
- 20. DerSimonian R. Meta‐analysis in clinical trials. Control Clin Trials. 1986;7:177‐188. [DOI] [PubMed] [Google Scholar]
- 21. Ades A, Lu G, Higgins JJMDM. The interpretation of random‐effects meta‐analysis in decision models. Med Decis Making. 2005;25:646‐654. [DOI] [PubMed] [Google Scholar]
- 22. Higgins JP, Thompson SG, Deeks JJ, Altman DGJB. Measuring inconsistency in meta‐analyses. BMJ. 2003;327:557‐560. [DOI] [PMC free article] [PubMed] [Google Scholar]
- 23. Egger M, Smith GD, Schneider M, Minder CJB. Bias in meta‐analysis detected by a simple, graphical test. BMJ. 1997;315:629‐634. [DOI] [PMC free article] [PubMed] [Google Scholar]
- 24. Begg CB, Mazumdar MJB. Operating characteristics of a rank correlation test for publication bias. Biometrics. 1994;50:1088‐1101. [PubMed] [Google Scholar]
- 25. Serraino D, Piselli P, Busnach G, et al. Risk of cancer following immunosuppression in organ transplant recipients and in HIV‐positive individuals in southern Europe. Eur J Cancer. 1990;2007(43):2117‐2123. [DOI] [PubMed] [Google Scholar]
- 26. Kellerman L, Neugut A, Burke B, Mancini D. Comparison of the incidence of de novo solid malignancies after heart transplantation to that in the general population. Am J Cardiol. 2009;103:562‐566. [DOI] [PubMed] [Google Scholar]
- 27. Collett D, Mumford L, Banner NR, Neuberger J, Watson C. Comparison of the incidence of malignancy in recipients of different types of organ: a UK Registry audit. Am J Transplant. 2010;10:1889‐1896. [DOI] [PubMed] [Google Scholar]
- 28. Jensen AO, Svaerke C, Farkas D, Pedersen L, Kragballe K, Sorensen HT. Skin cancer risk among solid organ recipients: a nationwide cohort study in Denmark. Acta Derm Venereol. 2010;90:474‐479. [DOI] [PubMed] [Google Scholar]
- 29. Jiang Y, Villeneuve PJ, Wielgosz A, Schaubel DE, Fenton SSA, Mao Y. The incidence of cancer in a population‐based cohort of Canadian heart transplant recipients. Am J Transplant. 2010;10:637‐645. [DOI] [PubMed] [Google Scholar]
- 30. Engels EA, Pfeiffer RM, Fraumeni JF, et al. Spectrum of cancer risk among US solid organ transplant recipients. JAMA. 2011;306:1891‐1901. [DOI] [PMC free article] [PubMed] [Google Scholar]
- 31. Krynitz B, Edgren G, Lindelof B, et al. Risk of skin cancer and other malignancies in kidney, liver, heart and lung transplant recipients 1970 to 2008–a Swedish population‐based study. Int J Cancer. 2013;132:1429‐1438. [DOI] [PubMed] [Google Scholar]
- 32. Morton LM, Gibson TM, Clarke CA, et al. Risk of myeloid neoplasms after solid organ transplantation. Leukemia. 2014;28:2317‐2323. [DOI] [PMC free article] [PubMed] [Google Scholar]
- 33. Ohman J, Rexius H, Mjornstedt L, et al. Oral and lip cancer in solid organ transplant patients–a cohort study from a Swedish Transplant Centre. Oral Oncol. 2015;51:146‐150. [DOI] [PubMed] [Google Scholar]
- 34. Safaeian M, Robbins HA, Berndt SI, Lynch CF, Fraumeni JF Jr, Engels EA. Risk of colorectal cancer after solid organ transplantation in the United States. Am J Transplant. 2016;16:960‐967. [DOI] [PMC free article] [PubMed] [Google Scholar]
- 35. Ekstrom M, Riise GC, Tanash HA. Risk of cancer after lung transplantation for COPD. Int J Chron Obstruct Pulmon Dis. 2017;12:2841‐2847. [DOI] [PMC free article] [PubMed] [Google Scholar]
- 36. Fink AK, Yanik EL, Marshall BC, et al. Cancer risk among lung transplant recipients with cystic fibrosis. J Cyst Fibros. 2017;16:91‐97. [DOI] [PMC free article] [PubMed] [Google Scholar]
- 37. Hortlund M, Arroyo Muhr LS, Storm H, Engholm G, Dillner J, Bzhalava D. Cancer risks after solid organ transplantation and after long‐term dialysis. Int J Cancer. 2017;140:1091‐1101. [DOI] [PubMed] [Google Scholar]
- 38. Magruder JT, Crawford TC, Grimm JC, et al. Risk factors for de novo malignancy following lung transplantation. Am J Transplant. 2017;17:227‐238. [DOI] [PubMed] [Google Scholar]
- 39. Rizvi SMH, Aagnes B, Holdaas H, et al. Long‐term change in the risk of skin cancer after organ transplantation: a population‐based nationwide cohort study. JAMA Dermatol. 2017;153:1270‐1277. [DOI] [PMC free article] [PubMed] [Google Scholar]
- 40. Tsai H‐I, Lee C‐W, Kuo C‐F, et al. De novo malignancy in organ transplant recipients in Taiwan: a nationwide cohort population study. Oncotarget. 2017;8:36685‐36695. [DOI] [PMC free article] [PubMed] [Google Scholar]
- 41. Jäämaa‐Holmberg S, Salmela B, Lemström K, Pukkala E, Lommi J. Cancer incidence and mortality after heart transplantation ‐ a population‐based national cohort study. Acta Oncol (Stockholm, Sweden). 2019;58:859‐863. [DOI] [PubMed] [Google Scholar]
- 42. Laprise C, Cahoon EK, Lynch CF, et al. Risk of lip cancer after solid organ transplantation in the United States. Am J Transplant. 2019;19:227‐237. [DOI] [PMC free article] [PubMed] [Google Scholar]
- 43. O'Neill JP, Sexton DJ, O'Leary E, et al. Post‐transplant malignancy in solid organ transplant recipients in Ireland, The Irish Transplant Cancer Group. Clin Transplant. 2019;33:e13669. [DOI] [PubMed] [Google Scholar]
- 44. Triplette M, Crothers K, Mahale P, et al. Risk of lung cancer in lung transplant recipients in the United States. Am J Transplant. 2019;19:1478‐1490. [DOI] [PMC free article] [PubMed] [Google Scholar]
- 45. Heo J, Noh OK, Oh Y‐T, Chun M, Kim L. Cancer risk after renal transplantation in South Korea: a nationwide population‐based study. BMC Nephrol. 2018;19:311. [DOI] [PMC free article] [PubMed] [Google Scholar]
- 46. Piening N, Saurabh S, Munoz Abraham AS, Osei H, Fitzpatrick C, Greenspon J. Sterile necrotizing and non‐necrotizing granulomas in a heart transplant patient with history of PTLD: a unique finding. Int J Surg Case Rep. 2019;60:8‐12. [DOI] [PMC free article] [PubMed] [Google Scholar]
- 47. Bouvard V, Baan R, Straif K, et al. A review of human carcinogens–Part B: biological agents. Lancet Oncol. 2009;10:321‐322. [DOI] [PubMed] [Google Scholar]
- 48. Mayer V, Ebbesen P. Persistent viral infections in human carcinogenesis. Eur J Cancer Prev. 1994;3:5‐14. [DOI] [PubMed] [Google Scholar]
- 49. Minai OA, Shah S, Mazzone P, et al. Bronchogenic carcinoma after lung transplantation: characteristics and outcomes. J Thorac Oncol. 2008;3:1404‐1409. [DOI] [PubMed] [Google Scholar]
- 50. Dickson RP, Davis RD, Rea JB, Palmer SM. High frequency of bronchogenic carcinoma after single‐lung transplantation. J Heart Lung Transplant. 2006;25:1297‐1301. [DOI] [PMC free article] [PubMed] [Google Scholar]
- 51. Abrahams NA, Meziane M, Ramalingam P, Mehta A, DeCamp M, Farver CF. Incidence of primary neoplasms in explanted lungs: long‐term follow‐up from 214 lung transplant patients. Transpl Proc. 2004;36:2808‐2811. [DOI] [PubMed] [Google Scholar]
- 52. Ritchie AJ, Mussa S, Sivasothy P, Stewart S. Single‐lung transplant complicated by unexpected explant carcinoma: a management dilemma. J Heart Lung Transplant. 2007;26:1206‐1208. [DOI] [PubMed] [Google Scholar]
- 53. Buzzeo BD, Heisey DM, Messing EM. Bladder cancer in renal transplant recipients. Urology. 1997;50:525‐528. [DOI] [PubMed] [Google Scholar]
- 54. Yan L, Chen P, Chen EZ, Gu A, Jiang ZY. Risk of bladder cancer in renal transplant recipients: a meta‐analysis. Br J Cancer. 2014;110:1871‐1877. [DOI] [PMC free article] [PubMed] [Google Scholar]
- 55. Holt CD. Overview of immunosuppressive therapy in solid organ transplantation. Anesthesiol Clin. 2017;35:365‐380. [DOI] [PubMed] [Google Scholar]
- 56. Sanches MM, Travassos AR, Soares‐de‐Almeida L. The relationship between immunodepression and the development of skin cancer. Acta Med Port. 2017;30:69‐72. [DOI] [PubMed] [Google Scholar]
- 57. Chin‐Hong PV, Reid GE; Practice ASTIDCo . Human papillomavirus infection in solid organ transplant recipients: guidelines from the American Society of Transplantation Infectious Diseases Community of Practice. Clin Transplant. 2019;33:e13590. [DOI] [PubMed] [Google Scholar]
- 58. Mittal A, Colegio OR. Skin cancers in organ transplant recipients. Am J Transplant. 2017;17:2509‐2530. [DOI] [PubMed] [Google Scholar]
- 59. Brem R, Li F, Karran P. Reactive oxygen species generated by thiopurine/UVA cause irreparable transcription‐blocking DNA lesions. Nucleic Acids Res. 2009;37:1951‐1961. [DOI] [PMC free article] [PubMed] [Google Scholar]
- 60. Kelly GE, Meikle W, Sheil AG. Effects of immunosuppressive therapy on the induction of skin tumors by ultraviolet irradiation in hairless mice. Transplantation. 1987;44:429‐434. [DOI] [PubMed] [Google Scholar]
- 61. Stenzinger A, Allen JD, Maas J, et al. Tumor mutational burden standardization initiatives: recommendations for consistent tumor mutational burden assessment in clinical samples to guide immunotherapy treatment decisions. Genes Chromosomes Cancer. 2019;58:578‐588. [DOI] [PMC free article] [PubMed] [Google Scholar]
- 62. D'Arcy ME, Coghill AE, Lynch CF, et al. Survival after a cancer diagnosis among solid organ transplant recipients in the United States. Cancer. 2019;125:933‐942. [DOI] [PMC free article] [PubMed] [Google Scholar]
- 63. Ordóñez‐Mena JM, Schöttker B, Mons U, et al. Quantification of the smoking‐associated cancer risk with rate advancement periods: meta‐analysis of individual participant data from cohorts of the CHANCES consortium. BMC Med. 2016;14:62. [DOI] [PMC free article] [PubMed] [Google Scholar]
- 64. Freisling H, Arnold M, Soerjomataram I, et al. Comparison of general obesity and measures of body fat distribution in older adults in relation to cancer risk: meta‐analysis of individual participant data of seven prospective cohorts in Europe. Br J Cancer. 2017;116:1486‐1497. [DOI] [PMC free article] [PubMed] [Google Scholar]
- 65. Bagnardi V, Rota M, Botteri E, et al. Alcohol consumption and site‐specific cancer risk: a comprehensive dose‐response meta‐analysis. Br J Cancer. 2015;112:580‐593. [DOI] [PMC free article] [PubMed] [Google Scholar]
- 66. Hojo M, Morimoto T, Maluccio M, et al. Cyclosporine induces cancer progression by a cell‐autonomous mechanism. Nature. 1999;397:530‐534. [DOI] [PubMed] [Google Scholar]
Associated Data
This section collects any data citations, data availability statements, or supplementary materials included in this article.
Supplementary Materials
Table S1‐Fig S1‐S12
Data Availability Statement
The raw data supporting the conclusions of this article will be made available by Jianxing He (drjianxing.he@gmail.com) for a period of 5 years after the publication date.