Abstract
Purpose:
To demonstrate the feasibility of 3D multi-shot magnetic resonance imaging acquisitions for stimulus-evoked blood oxygenation level dependent (BOLD) functional magnetic resonance imaging (fMRI) in the human spinal cord in vivo.
Methods:
Two fMRI studies were performed at 3 Tesla. The first study was a hypercapnic gas challenge where data were acquired from healthy volunteers using a multi-shot 3D fast field echo (FFE) sequence as well as single-shot multi-slice echo-planar imaging (EPI). In the second study, another cohort of healthy volunteers performed an upper extremity motor task while fMRI data were acquired using a 3D multi-shot acquisition.
Results:
Both 2D-EPI and 3D-FFE were shown to be sensitive to BOLD signal changes in the cervical spinal cord, and had comparable contrast-to-noise ratios in gray matter. FFE exhibited much less signal drop-out and weaker geometric distortions compared to EPI. In the motor paradigm study, the mean number of active voxels was highest in the ventral gray matter horns ipsilateral to the side of the task and at the spinal level associated with innervation of finger extensors.
Conclusion:
Highly multi-shot acquisition sequences such as 3D-FFE are well suited for stimulus-evoked spinal cord BOLD fMRI.
Keywords: spinal cord, functional magnetic resonance imaging, stimulus-evoked paradigms, healthy controls, gradient echo imaging, 3 Tesla
1. Introduction
The efficient k-space sampling sequence echo-planar imaging (EPI) was proposed by Mansfield over four decades ago [1] and is widely used across magnetic resonance imaging (MRI) applications [2, 3, 4, 5]. Due to its ability to collect an image in only tens of milliseconds – effectively freezing physiological motion – and highest signal-to-noise ratio per unit time, EPI was used in the first functional magnetic resonance imaging (fMRI) study [6] (measuring changes in cerebral blood volume) and two [7, 8] of the initial three [9] concurrent reports on blood oxygenation level dependent (BOLD) fMRI in the human brain [10, 11]. Although other acquisitions have been explored for many years [12], EPI is virtually ubiquitous in brain fMRI.
The development of fMRI in the human spinal cord has, however, followed a different trajectory. The first spinal cord fMRI study, performed at 1.5 Tesla and published over two decades ago [13], did not use EPI and reported BOLD contrast co-localized to spinal cord gray matter. The second spinal cord fMRI study, performed at 3 Tesla, similarly did not use EPI [14] and stated that future developments could consider its use. The use of sequences other than single-shot EPI is driven by the inherent and well-known challenges of imaging the spinal cord that include substantial physiological noise, B0 inhomogeneities, and signal drop-out throughout the region of interest [15, 16, 17, 18, 19, 20, 21]. Spin-echo fMRI with BOLD T2-weighting has also been used to mitigate some of these challenges [22]. Mechanisms of potential non-BOLD contrast have also been proposed [23] and debated [24]. To date there are still just over one hundred papers on spinal cord fMRI [25], and no consensus on the optimal approaches to acquire, process, and/or analyze these data.
At 7 Tesla (7T), we previously investigated the use of a multi-shot 3D gradient-echo acquisition sequence (FFE) [26, 27] for fMRI in the brain, and showed it to be a viable pulse sequence that exhibited slightly lower BOLD sensitivity but significantly reduced geometric distortions compared to single-shot EPI [28, 29]. Reduced distortions are desired in spinal cord MRI due to the small size of the cord and need to accurately register functional images to their corresponding anatomical images, so we selected an FFE sequence to mitigate geometric distortions and also satisfy specific absorption rate constraints [30] at 7T, thus facilitating the detection of resting state networks in the human spinal cord [31, 32, 33]. We then continued this line of work and translated the FFE sequence to 3 Tesla (3T) to further evaluate the relative impact of acquisition and processing choices on the detectability of resting state spinal cord networks [34]. The FFE sequence has, however, not yet been systematically evaluated in detecting stimulus-evoked BOLD signal changes in spinal cord fMRI. Therefore, while spin-echo fMRI could have potentially been employed to mitigate geometric distortions, we chose to continue our investigations of FFE to evaluate its suitability for detecting stimulus-evoked signals in the cervical spinal cord.
Herein we present two 3T studies aimed at addressing this gap in the FFE literature. The first is a hypercapnic gas challenge to characterize global BOLD signal changes within the cord and surrounding structures. This study additionally acquired functional images with EPI to facilitate a comparison between single-shot EPI and multi-shot FFE in response to this paradigm. The second study uses a unilateral finger extension (motor) paradigm, performed on the left and right sides, to characterize BOLD signal changes that are focal and manifest in regions of spinal cord gray matter predicted a priori by known anatomical connections.
2. Methods
2.1. Data acquisition
Experiments were performed on a Philips Achieva 3T scanner (Best, The Netherlands) with a dual-channel transmit body coil and a 16-channel neurovascular coil for reception. All volunteers were healthy with no history of spinal cord injury or neurological impairment. Subjects were recruited, provided informed consent, and scanned under a protocol approved by the Vanderbilt University Institutional Review Board.
After the initial sagittal scan to identify the vertebral levels, all anatomical and functional images for both studies were acquired axially with 5-mm slices and a field of view of 150×150 mm2. Anatomical images were high resolution (0.65×0.65 mm2) and acquired using an averaged multi-echo gradient echo (mFFE) [35, 36] T2*-weighted sequence. Functional images were acquired with an in-plane resolution of 1×1 mm2 and the same number of slices as the corresponding anatomical images (defined below).
2.1.1. Gas challenge study
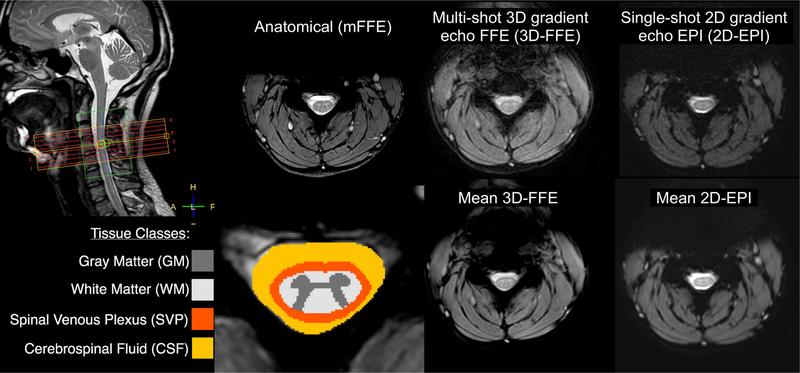
Seven volunteers (26.4±4.9 years, 4 female) participated in the hypercapnic gas challenge study. The imaging stack of eight contiguous slices was positioned to include all of vertebral level C4 and the majority of C3 and C5 (Fig. 1, top left). Two gas challenge fMRI runs were acquired. One run was a multi-shot 3D-FFE sequence with the following parameters: in-plane k-space matrix = 150×150, echo time (TE) = 10 ms, repetition time (TR) = 36.4 ms, flip angle = 8°, echo train length (ETL; k-space lines per radiofrequency pulse) = 7, sensitivity encoding (SENSE) [37] = 2.0, overcontiguous slices = ‘yes’ (resulting in a reduction factor of 1.6 in the z-direction), volume acquisition time (VAT) = 1870 ms, number of volumes (after 5 discarded “dummy” scans during the approach to steady-state magnetization) = 333 (10 min 22.7 sec), preparation = SPIR (spectral presaturation with inversion recovery), phase encode = right–left, receiver bandwidth = 526 Hz/pixel, and effective echo spacing = 1.117 ms. The other fMRI run was a single-shot 2D-EPI sequence with the following parameters: in-plane k-space matrix = 150×150, TE = 30 ms, TR = VAT = 2000 ms, flip angle = 70°, ETL = 75, SENSE = 2.0, number of volumes (after 5 “dummy” scans) = 300 (10 min 0 sec), saturation band positioned anterior to the spine, preparation = SPAIR (spectral attenuated inversion recovery), phase encode = anterior–posterior, slice order = interleaved, receiver bandwidth = 1192 Hz/pixel, and effective echo spacing = 0.547 ms.
Figure 1:
Imaging stack placement (top left), tissue class definitions (bottom left), and anatomical/functional images for one subject in the hypercapnic gas challenge study. The green box overlaying the imaging stack is the region of interest selected for B0 shimming. Axial images show one slice at the center of the C4 vertebral body. The phase-encode direction is left-right in 3D-FFE and anterior-posterior in 2D-EPI. The 3D-FFE images show good gray/white matter contrast and minimal distortions. The 2D-EPI images also show acceptable contrast between gray and white matter, but have more pronounced distortions/artifacts within the cord and cerebrospinal fluid.
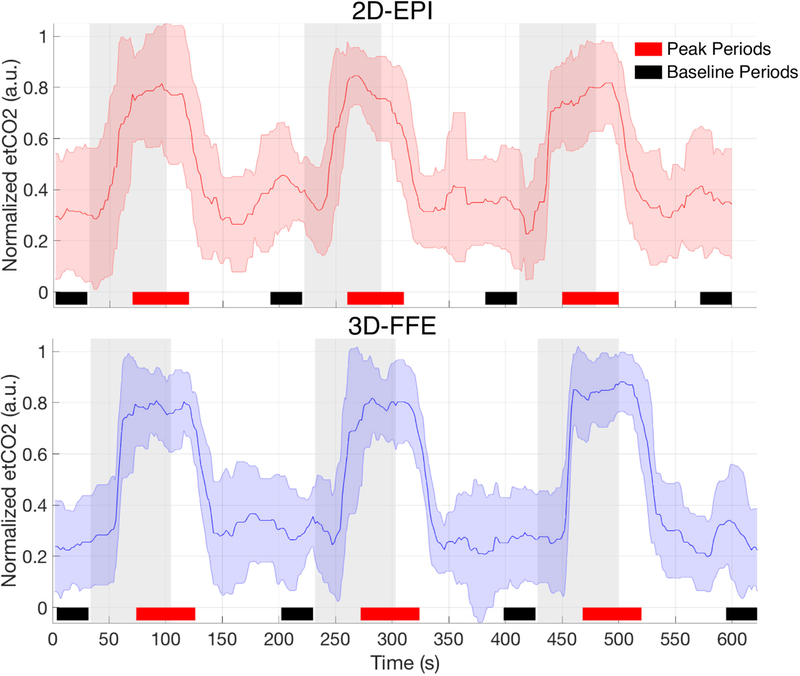
A hypercapnic normoxia gas mixture (5% CO2, 21% O2, 74% N2) was used to elicit global vasodilation. The gas presentation paradigm is described in Fig. 2. Respiration, cardiac, and end-tidal CO2 (etCO2) signals were recorded, and the order of the functional runs alternated between subjects.
Figure 2:
Mean end-tidal CO2 timecourse over all subjects/runs. Raw end-tidal CO2 traces were median filtered and artifactual spikes were removed prior to group averaging. The gas presentation paradigm for the 2D-EPI acquisition was: 30s rest – 70s gas – 120s rest – 70s gas – 120s rest – 70s gas – 120s rest = 600s total. Due to a discrepancy in the true volume acquisition time reported by the scanner console, the paradigm for the 3D-FFE sequence was extended slightly: 31.8s rest – 72.9s gas – 125.3s rest – 72.9s gas – 123.4s rest – 72.9s gas – 123.5s rest = 622.7s total. Room air was delivered during rest periods, and gray bars represent delivery periods of a hypercapnic normoxia gas mixture (5% CO2, 21% O2, 74% N2). Mean signals across baseline periods (denoted by black bars) were used for percent signal change calculations, and peak periods (denoted by red bars) were used for mean peak signal change lines in Fig. 4.
2.1.2. Motor paradigm study
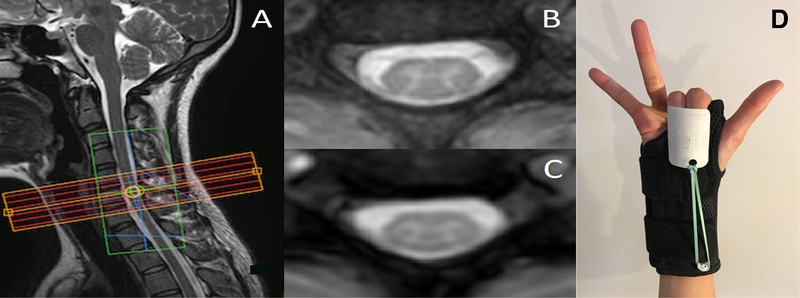
Seven volunteers (25.7±4.5 years, 3 female) participated in the unilateral finger extension study. The imaging stack was positioned to include all of vertebral level C6 and part of C5 and C7 (Fig. 3A), roughly corresponding to neurological cord segments C7 and C8 [38]. The imaging stack consisted of six contiguous slices for the first three subjects and eight contiguous slices for the last four subjects. This change back to an 8-slice protocol was made to address the slightly lower signal in the first and last slices due to the 3D slab excitation profile, and two slices were removed from the 8-slice acquisitions to ensure that the same number of slices were analyzed across subjects.
Figure 3:
(A) Imaging stack placement for one subject in the motor paradigm study. The green box overlaying the imaging stack is the region of interest selected for B0 shimming. (B) Anatomical image for one axial slice and (C) the corresponding 3D-FFE functional image that has been interpolated to match the in-plane spatial resolution of the anatomical. (D) The splint provided automatic flexion after self-paced extensions of the index and middle fingers.
FMRI data were acquired with a 3D-FFE sequence similar to the previous study with the following parameters: TE = 10 ms, TR = 36.4 ms, flip angle = 8°, ETL = 7, SENSE = 2.0, overcontiguous slices = ‘yes’, VAT = 1870 ms, number of volumes (after 5 “dummy” scans) = 278 (8 min 39.9 sec). (These parameters were the same for the 6-slice and 8-slice acquisitions.) The paradigm was a block design with 8 cycles of alternating 30-sec rest and 30-sec motor task, followed by a final period of rest. The motor task involved repeated self-paced unilateral extension of the index and middle fingers (Fig. 3D). A splint provided automatic flexion after extension of the index and middle fingers [39]. Within each session, 4 functional runs were acquired (two runs for both left and right finger extension tasks).
2.2. Data processing and analysis
2.2.1. Gas challenge study
Anatomical masks of gray matter (GM), white matter (WM), and cerebrospinal fluid (CSF) were manually defined for each subject (Fig. 1, bottom left). A fourth tissue mask for the spinal cord venous plexus (SVP) was created by dilating the border of cord white matter by two voxels, which was intended to encompass the spinal veins running along the cord’s periphery. The custom fMRI preprocessing pipeline, based upon a pipeline previously described in detail [32], was applied to each fMRI run and included motion correction focused on the cord/canal, RETROICOR [40], and co-registration/resampling to the high-resolution anatomical image. An initial step of slice timing correction was additionally applied to the 2D-EPI data. No spatial smoothing was applied. While relatively few distortions or signal drop-out were present in the 3D-FFE data, significant susceptibility artifacts and tissue distortion in the 2D-EPI data were addressed through manual editing of the tissue masks prior to statistical analysis. The manual editing procedure involved erasing voxels from the tissue masks that demonstrated significant signal dropout in the co-registered 2D-EPI image, as well as minor editing of the tissue boundaries in cases of distortion. In total, across all slices and subjects, the tissue masks for GM, WM, SVP, and CSF were reduced by 1.4%, 3.2%, 19.4%, and 27.1%, respectively, for the analyses of 2D-EPI data.
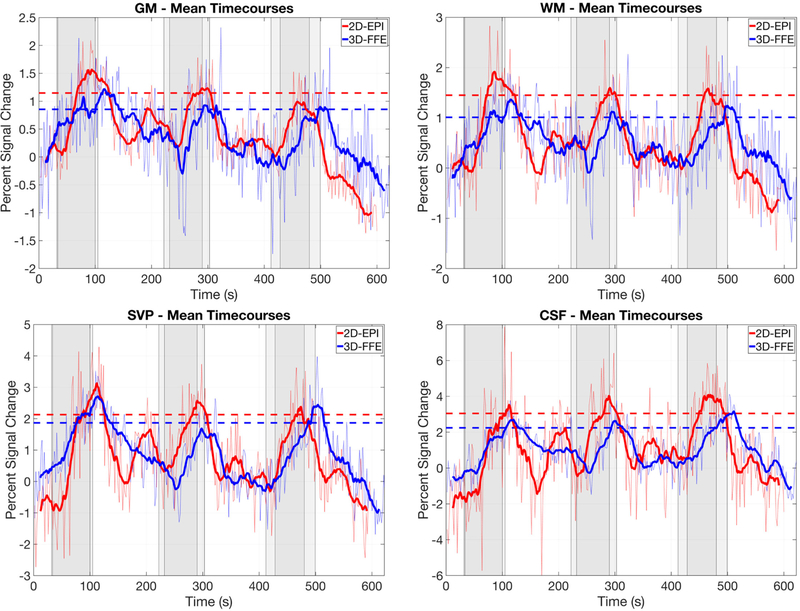
A general linear model (GLM) was applied using a gamma function convolved with the stimulus timecourse and delayed by 20 sec from the onset of gas blocks, which most closely matched the observed average etCO2 timecourse (Fig. 2). To further mitigate the impact of cord motion, additional slice-wise regressors included estimates of both in-plane translations. Percent signal change time series were calculated at the voxel level by dividing the signal at each time point by the mean signal of the voxel across the four baseline periods. To compare the magnitude of signal change between the two acquisition schemes, voxels within each tissue class were sorted for each subject according to the t-values estimated from the GLM analysis, and the top half of voxels for each subject were used in the group average signal timecourse (Fig. 4). Additionally, the numbers of voxels demonstrating a significant BOLD effect (i.e., ‘active’ voxels) for each acquisition scheme were assessed and compared. Statistical tests were not corrected for multiple comparisons.
Figure 4:
Mean percent BOLD signal change timecourses in response to the hypercapnic gas challenge for each tissue class (defined in Fig. 1, bottom left) and acquisition scheme (2D-EPI and 3D-FFE). Results are averaged across subjects. For each subject, the top half of all voxels for each tissue class, according to t-values from the GLM analyses, were used in the timecourse calculations. Dark lines on each plot represents a 20-point moving average of the raw mean timecourse. Dashed lines represent the mean signal change in the raw mean timecourse across the three peak periods (defined in Fig. 2). Sets of gray bars represent the gas delivery periods for each acquisition, with the onset of gas blocks for the FFE acquisition being delayed slightly due to a difference in timing (see Fig. 2 legend). The vertical axis in each plot is scaled according to the dynamic range of the data. It is important to note that while the spatial resolution is matched between these sequences, important differences in other acquisition parameters will influence the percent signal change and contrast-to-noise ratio: TE = 30 ms, TR = 2000 ms, flip angle = 70°, echo train length (ETL) = 75 for 2D-EPI; and TE = 10 ms, TR = 36.4 ms, flip angle = 8°, ETL = 7 for 3D-FFE. Complete details of the acquisition parameters are presented in the Methods.
2.2.2. Motor paradigm study
FMRI data for the motor paradigm study were preprocessed and analyzed in a fashion similar to the gas challenge study described above including the same initial steps of motion correction, RETROICOR, and co-registration to the anatomical image. We expected BOLD signal changes of interest in response to the motor paradigm to be more confined to GM (as opposed to the gas challenge which elicited global vasodilation), so we extracted eigenvectors from the CSF and WM masks (steps #12 and #13 in our fMRI pipeline [32]) and also regressed these noise components from the data. A low-pass filter (up to 0.25 Hz) was applied to further clean the timeseries of high-frequency noise. Finally, prior to GLM analyses, functional data were spatially smoothed with an anisotropic kernel equal to twice the voxel size using AFNI’s ‘3dmerge’ function [41]. The smoothing operation was performed within the cord after creating a spinal cord mask (via a logical union of the GM and WM masks) and then eroding by two voxels to avoid contaminating the GM signal with that of the spinal veins (i.e., the SVP).
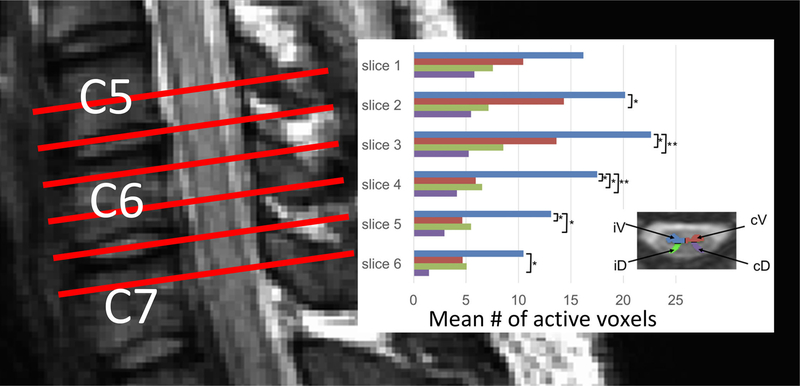
Because genuine BOLD fluctuations are expected to manifest predominantly in GM, regions of interest (ROIs) were defined for left and right ventral and dorsal horns according to each subject’s anatomical image. Relative to the side that the motor task was performed on for each run, ROIs were defined as ipsilateral and contralateral ventral (iV and cV) and dorsal (iD and cD) GM (illustrated via the legend inset within Fig. 7). GLM analyses were used to calculate the number of active voxels in each ROI at the group level, and Tukey-Kramer tests were used in the statistical analyses where p < 0.05 was considered statistically significant.
Figure 7:
(left) Schematic illustrating imaging stack placement for the motor paradigm study. The slices are centered on vertebral level C6. (right) Mean number of active gray matter voxels (across subjects) for each slice where the colors correspond to the four regions of interest defined in the legend inset: ipsilateral ventral (iV), contralateral ventral (cV), ipsilateral dorsal (iD), and contralateral dorsal (cD). The iV horn exhibits more active voxels compared to other horns in the same slice (* = p < 0.05; ** = p < 0.01). The highest mean number of active voxels was observed in slice 3, which roughly corresponds to spinal cord segment C7 and innervation of finger extensors.
3. Results
3.1. Gas challenge study
A robust increase of 4–5 mmHg (∼0.5–0.7 kPa) in end-tidal CO2 was observed across subjects during delivery of the hypercapnic normoxia gas mixture (Fig. 2). Figure 4 demonstrates that both sequences detected BOLD signal change in all tissues of interest. 2D-EPI demonstrated higher average peak signal change for all tissue classes. The average percent peak signal changes in GM and WM were 1.15% and 1.45%, respectively, for 2D-EPI, and 0.86% and 1.01% for 3D-FFE, respectively. However, mean temporal signal-to-noise ratio (TSNR) in spinal cord GM across subjects (calculated across all voxels) was significantly higher for 3D-FFE compared to 2D-EPI (20.1±2.3 vs. 18.3±1.0; paired t-test, p < 0.031), resulting in GM contrast-to-noise ratios that were comparable between the sequences. A plot of TSNR across all tissue types and both acquisition sequences is presented in Supporting Information Figure S1.
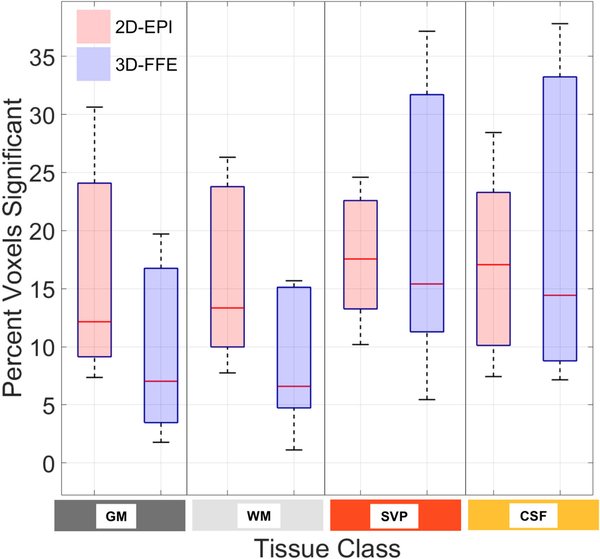
The variances of the signal changes from one time point to the next in CSF and the SVP were much higher in 2D-EPI (note the different dynamic ranges of the vertical axes), suggesting a greater sensitivity to flow effects and/or CSF pulsation compared to 3D-FFE. Figure 5 shows the percentage of voxels for each tissue class exhibiting significant temporal correlation to the model of the hypercapnic stimulus at p < 0.05 (t > 1.65, uncorrected) based upon a one-tailed test. Across subjects, the percentage of ‘active’ voxels within each tissue class did not differ significantly between acquisition schemes (p > 0.05).
Figure 5:
Percentage of voxels, across subjects, exhibiting significant BOLD signal changes (p < 0.05, based upon a one-tailed test) in response to the hypercapnic gas challenge for each tissue class (defined in Fig. 1, bottom left) and acquisition scheme. For each subject, voxels with t > 1.65 (uncorrected) as determined from the GLM analysis are counted and expressed as a percent of the total number of voxels for each tissue class. There were no statistically significant differences between 2D-EPI and 3D-FFE across subjects (paired t-test, p > 0.05) despite different TEs for the two sequences.
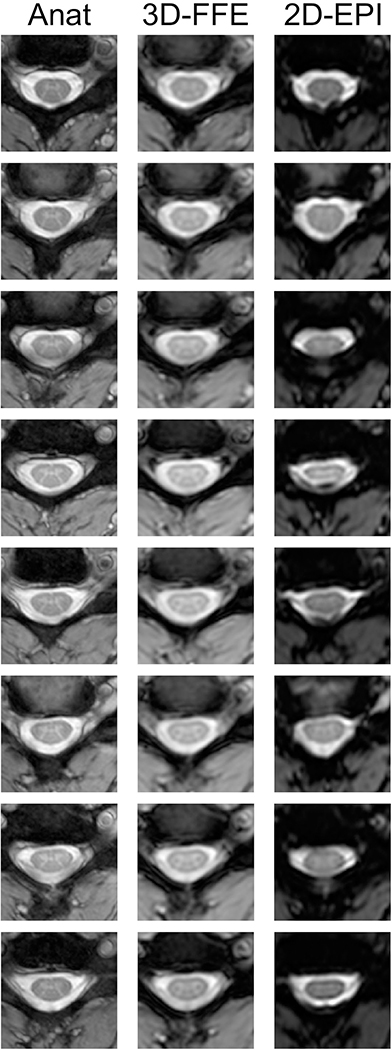
The results presented in Fig. 4 and Fig. 5 reflect global BOLD signal changes both within the spinal cord and in the vasculature surrounding the cord in response to a hypercapnic gas challenge. As such, the analyses are expected to be more ‘forgiving’ to slight geometric distortions in the functional images and/or slight inaccuracies in the alignment of the functional images to the anatomical images. However, most spinal cord fMRI studies are interested in detecting spatially specific regions of activation that are small, and thus would be particularly vulnerable to the deleterious effects of geometric distortions and alignment inaccuracies. Therefore, Fig. 6 presents a comparison of the anatomical and functional images generated from each acquisition sequence for one subject.
Figure 6:
Eight contiguous slices spanning C3 to C5 in one representative subject. The first column shows the high-resolution anatomical images, the second column shows the mean 3D-FFE functional images, and the third column shows the mean 2D-EPI functional images. Across slices and subjects, the 3D-FFE sequence produced functional images that are robust to geometric distortions and signal drop-out, and more closely resemble the anatomical images. The 2D-EPI images, however, show a range of distortions including stretch, shear, and compression, and significant signal drop-out in CSF and WM on some slices.
The 2D-EPI images acquired for the gas challenge study exhibited substantial distortions across slices and subjects, and minor manual edits were required in the functional-to-anatomical registrations on some slices. Importantly, it was not possible to achieve a reliable rigid-body registration of the functional image to the anatomical image in some slices due to the geometric distortions (e.g., Fig. 6, second row). For this reason, as well as the additional practical consideration that each fMRI run was nearly 9 minutes, we chose to acquire fMRI data using only 3D-FFE for the subsequent motor paradigm study.
3.2. Motor paradigm study
The mean TSNR in GM was 17.3±4.5 across subjects. Figure 7 displays number of active voxels in each GM ROI across slices. The mean number of ‘active’ voxels within iV tended to be higher than other horns for the same slice, with the most significant differences (p < 0.01) observed in slices 3 and 4. The highest mean number of active voxels was observed in slice 3, which roughly corresponds to spinal cord segment C7 and innervation of finger extensors [42].
4. Discussion
We have presented two spinal cord fMRI studies that demonstrate the efficacy of using a highly multi-shot 3D-FFE acquisition for stimulus-evoked spinal cord BOLD fMRI at 3T. The first study used a controlled gas challenge to induce mild hypercapnia, and also acquired fMRI data using a single-shot 2D-EPI acquisition to permit an evaluation of the relative merits of both sequences. While the gas challenge evoked global vasodilation and thus signal changes throughout the cord and SVP, the second study evaluated the spatial specificity of task-evoked BOLD signal changes that were expected to manifest primarily in the ventral (motor) horns in response to a unilateral finger extension (motor) paradigm.
In the design of an experiment to compare 3D-FFE and 2D-EPI, our options were to vary TE and keep spatial resolution constant – or vary spatial resolution and keep TE constant. It was not possible to keep TE and spatial resolution constant for both sequences and also maintain comparable VATs of ∼2 sec. Because the spinal cord is a very small structure and a 1×1 mm2 in-plane resolution already creates partial volume effects between gray and white matter for fMRI, we decided to maintain spatial resolution and vary TE. While EPI provided slightly higher detection and peak signal change of BOLD response in the tissues of interest, FFE provided similar levels of detection despite a much shorter echo time (10 ms vs. 30 ms for EPI).
FMRI studies commonly set TE equal to T2* to maximize BOLD contrast-to-noise ratio (CNR), but a review of the 4 Tesla study that established this recommendation shows that BOLD CNR vs. TE in tissue is a broad curve and setting TE to be less than half of T2* resulted in only a ∼15% decrease in BOLD CNR relative to the maximal value (Fig. 3c in [43]). A follow-up study similarly showed a broad curve for BOLD CNR in tissue and demonstrated that TE ≈ T2*/3 resulted in only a slight decrease in CNR (Fig. 3c in [44]). Therefore, although BOLD CNR is maximal when TE = T2*, in practice this is not a strict requirement and is likely detrimental for spinal cord fMRI studies because maximizing BOLD CNR also maximizes signal dropout and geometric distortions [34]. These early studies characterizing BOLD CNR curves [43, 44] thus support our observation of comparable GM CNR between these sequences despite substantially different echo times.
A previous report investigated the simultaneous hypercapnia responses in the brain and cervical spinal cord [45]. Similar to that study, we observed robust signal changes of 1–1.5% in GM and WM, and 2–3% in voxels at the edge of the cord (i.e., SVP) and outside the cord in CSF, suggesting that observed BOLD effects in these regions in response to a global stimulus is associated with the vasculature in WM and along the cord and nerve rootlets. We cannot rule out the possibility that components of this residual temporal variance, particularly in the SVP and CSF, reflect hypercapnia-induced changes in CSF pulsation and/or the volumetric ratio of the CSF/cord compartments [46, 47, 45]. However, our use of RETROICOR should have mitigated much of the effects of respiratory motion on the data, which are thought to mediate the relationship between hypercapnia and CSF pulsation. Furthermore, changes to the CSF/parenchyma ratio would influence signal at the CSF/cord boundary, i.e., the SVP in this study, so are unlikely to explain our findings in CSF. Interestingly, signal changes in CSF (and, to a lesser degree, SVP) were highly variable in 2D-EPI data – possibly due to sequence sensitivity to flow effects and CSF pulsation compared to 3D-FFE.
An important contribution of the first study is the opportunity to evaluate functional images acquired using both sequences. While both sequences exhibit sensitivity to BOLD signal changes, as was expected, functional images acquired using 3D-FFE had higher TSNR, fewer susceptibility artifacts, and more manageable geometric distortions (Fig. 6, middle column). In comparison, geometric distortions and signal drop-out in 2D-EPI were moderate to severe (Fig. 6, right column). On some slices (Fig. 6, first row), signal dropout in EPI was addressable through our robust image registration procedure [32], however geometric distortions in other slices could not be addressed satisfactorily via rigid-body registration (e.g., Fig. 6, second row). Thus, the relative merits of 3D-FFE – higher TSNR, comparable VAT, and fewer and more manageable susceptibility artifacts – make it an attractive option for BOLD fMRI in the spinal cord where accurate visualization and co-registration of small gray matter structures is critically important.
We then employed the 3D-FFE sequence to characterize BOLD signal changes in individual GM horns of the cervical spinal cord during an upper extremity motor task. Previous studies have reported laterality of motor activity in the spinal cord [48, 49], though with data acquired using 2D-EPI sequences. We observed BOLD signal changes that tended to be higher in the ventral GM horn on the ipsilateral side to the task than in the contralateral GM horn (Fig. 7), which corresponds to the lateralized association of ventral horns with motor neuron activity. Additionally, the highest mean number of active voxels was observed in vertebral level C6, which roughly corresponds to spinal cord segment C7 [38] and innervation of finger extensors [42]. Taken together, these observations demonstrate that fMRI data acquired using a sequence other than EPI is capable of delineating BOLD signal change in GM of the cervical spinal cord at fine spatial scales, thus suggesting potential applications for spatially-reliable non-invasive measurement and monitoring of spinal cord function.
An unbiased comparison of single- and multi-shot acquisition sequences is challenging in the development of fMRI methods due to the fundamental differences of how the data are acquired and the desire to fix one important acquisition parameter, possibly TE or spatial resolution, and then vary the other parameters accordingly. Thus, in the gas challenge study presented herein, we chose to fix the k-space matrix size to be acquired and vary TE, flip angle, and TR/VAT. The resultant 2D-EPI and 3D-FFE acquisition sequences thus had different TEs, which impacts BOLD contrast, but also reflects a genuine attempt at comparing the strengths of one sequence (BOLD contrast for 2D-EPI) against the strengths of another (improved geometric fidelity for 3D-FFE). It should be noted, however, that although the same k-space matrix size was acquired between EPI and FFE, the spatial resolution ultimately achieved is dependent upon T2* signal decay during the echo train and its filtering effects upon k-space, and thus is unavoidably different between the sequences.
In conclusion, we have demonstrated the feasibility of using a highly multi-shot acquisition sequence for stimulus-evoked spinal cord BOLD fMRI. Multi-shot 3D-FFE data were shown to be sensitive to a global hypercapnia stimulus, and also exhibited spatial specificity in response to a unilateral upper extremity motor task. Highly multi-shot acquisitions may therefore be viewed as a viable alternative to 2D-EPI for notoriously challenging fMRI acquisitions in the spinal cord. Importantly, such multi-shot sequences may be particularly beneficial for stimulus-evoked spinal cord fMRI at 7T [50] where the impact of B0 inhomogeneities and signal drop-out is known to be significantly worse than at lower fields [51].
Supplementary Material
Acknowledgments
The authors thank Dr. Manus Donahue for discussions regarding the hypercapnic gas challenge and Dr. Ryan Solinsky for discussions regarding the results of the motor paradigm study. We also thank Dr. Rangaprakash Deshpande and Olivia Rowe for critically reviewing the final manuscript. The first three authors contributed equally to this work. This research was supported by the National Institutes of Health (NIH) grants R21NS087465 (S.A.S.), T32EB014841 and R01NS104149 (J.C.G.), and K99EB016689, R00EB016689, and R01EB027779 (R.L.B.). Support was also received from the Department of Defense W81XWH-13-1-0073 (S.A.S.), the National Multiple Sclerosis Society RG-1501-02840 (S.A.S.), and the Yoshida Scholarship Foundation (S.M.). The content is solely the responsibility of the authors and does not necessarily represent the official views of the NIH.
Footnotes
Conflict of Interest
The authors declare no competing interests.
References
- [1].Mansfield P Multi-planar image formation using NMR spin echoes. J Phys C Solid State Phys 10, L55–L58 (1977). [Google Scholar]
- [2].Stehling MK, Turner R & Mansfield P Echo-planar imaging: magnetic resonance imaging in a fraction of a second. Science 254, 43–50 (1991). [DOI] [PubMed] [Google Scholar]
- [3].Ordidge R The development of echo-planar imaging (EPI): 1977–1982. MAGMA 9, 117–121 (1999). [PubMed] [Google Scholar]
- [4].Cohen MS & Weisskoff RM Ultra-fast imaging. Magn Reson Imaging 9, 1–37 (1991). [DOI] [PubMed] [Google Scholar]
- [5].Poustchi-Amin M, Mirowitz SA, Brown JJ, McKinstry RC & Li T Principles and applications of echo-planar imaging: a review for the general radiologist. Radiographics 21, 767–779 (2001). [DOI] [PubMed] [Google Scholar]
- [6].Belliveau JW et al. Functional mapping of the human visual cortex by magnetic resonance imaging. Science 254, 716–719 (1991). [DOI] [PubMed] [Google Scholar]
- [7].Bandettini PA, Wong EC, Hinks RS, Tikofsky RS & Hyde JS Time course EPI of human brain function during task activation. Magn Reson Med 25, 390–397 (1992). [DOI] [PubMed] [Google Scholar]
- [8].Kwong KK et al. Dynamic magnetic resonance imaging of human brain activity during primary sensory stimulation. Proc Natl Acad Sci U S A 89, 5675–5679 (1992). [DOI] [PMC free article] [PubMed] [Google Scholar]
- [9].Ogawa S et al. Intrinsic signal changes accompanying sensory stimulation: functional brain mapping with magnetic resonance imaging. Proc Natl Acad Sci U S A 89, 5951–5955 (1992). [DOI] [PMC free article] [PubMed] [Google Scholar]
- [10].Kwong KK Record of a single fMRI experiment in May of 1991. Neuroimage 62, 610–612 (2012). [DOI] [PMC free article] [PubMed] [Google Scholar]
- [11].Bandettini PA Sewer pipe, wire, epoxy, and finger tapping: the start of fMRI at the Medical College of Wisconsin. Neuroimage 62, 620–631 (2012). [DOI] [PMC free article] [PubMed] [Google Scholar]
- [12].Constable RT, McCarthy G, Allison T, Anderson AW & Gore JC Functional brain imaging at 1.5 T using conventional gradient echo MR imaging techniques. Magn Reson Imaging 11, 451–459 (1993). [DOI] [PubMed] [Google Scholar]
- [13].Yoshizawa T, Nose T, Moore GJ & Sillerud LO Functional magnetic resonance imaging of motor activation in the human cervical spinal cord. Neuroimage 4, 174–182 (1996). [DOI] [PubMed] [Google Scholar]
- [14].Stroman PW, Nance PW & Ryner LN BOLD MRI of the human cervical spinal cord at 3 Tesla. Magn Reson Med 42, 571–576 (1999). [DOI] [PubMed] [Google Scholar]
- [15].Giove F et al. Issues about the fMRI of the human spinal cord. Magn Reson Imaging 22, 1505–1516 (2004). [DOI] [PubMed] [Google Scholar]
- [16].Piché M et al. Characterization of cardiac-related noise in fMRI of the cervical spinal cord. Magn Reson Imaging 27, 300–310 (2009). [DOI] [PubMed] [Google Scholar]
- [17].Verma T & Cohen-Adad J Effect of respiration on the B0 field in the human spinal cord at 3T. Magn Reson Med 72, 1629–1636 (2014). [DOI] [PubMed] [Google Scholar]
- [18].Bosma RL & Stroman PW Assessment of data acquisition parameters, and analysis techniques for noise reduction in spinal cord fMRI data. Magn Reson Imaging 32, 473–481 (2014). [DOI] [PubMed] [Google Scholar]
- [19].Eippert F, Kong Y, Jenkinson M, Tracey I & Brooks JCW Denoising spinal cord fMRI data: approaches to acquisition and analysis. Neuroimage 154, 255–266 (2017). [DOI] [PubMed] [Google Scholar]
- [20].Topfer R, Foias A, Stikov N & Cohen-Adad J Real-time correction of respiration-induced distortions in the human spinal cord using a 24-channel shim array. Magn Reson Med 80, 935–946 (2018). [DOI] [PubMed] [Google Scholar]
- [21].Vannesjo SJ, Miller KL, Clare S & Tracey I Spatiotemporal characterization of breathing-induced B0 field fluctuations in the cervical spinal cord at 7T. Neuroimage 167, 191–202 (2018). [DOI] [PMC free article] [PubMed] [Google Scholar]
- [22].Stroman PW et al. Continuous descending modulation of the spinal cord revealed by functional MRI. PLoS One 11, e0167317 (2016). [DOI] [PMC free article] [PubMed] [Google Scholar]
- [23].Stroman PW, Tomanek B, Krause V, Frankenstein UN & Malisza KL Functional magnetic resonance imaging of the human brain based on signal enhancement by extravascular protons (SEEP fMRI). Magn Reson Med 49, 433–439 (2003). [DOI] [PubMed] [Google Scholar]
- [24].Jochimsen TH, Norris DG & Möller HE Is there a change in water proton density associated with functional magnetic resonance imaging? Magn Reson Med 53, 470–473 (2005). [DOI] [PubMed] [Google Scholar]
- [25].Powers JM, Ioachim G & Stroman PW Ten key insights into the use of spinal cord fMRI. Brain Sci 8, E173 (2018). [DOI] [PMC free article] [PubMed] [Google Scholar]
- [26].van der Meulen P, Groen JP & Cuppen JJM Very fast MR imaging by field echoes and small angle excitation. Magn Reson Imaging 3, 297–299 (1985). [DOI] [PubMed] [Google Scholar]
- [27].van der Meulen P, Groen JP, Tinus AMC & Bruntink G Fast Field Echo imaging: an overview and contrast calculations. Magn Reson Imaging 6, 355–368 (1988). [DOI] [PubMed] [Google Scholar]
- [28].Barry RL, Strother SC, Gatenby JC & Gore JC Data-driven optimization and evaluation of 2D EPI and 3D PRESTO for BOLD fMRI at 7 Tesla: I. Focal coverage. Neuroimage 55, 1034–1043 (2011). [DOI] [PMC free article] [PubMed] [Google Scholar]
- [29].Swisher JD, Sexton JA, Gatenby JC, Gore JC & Tong F Multishot versus single-shot pulse sequences in very high field fMRI: a comparison using retinotopic mapping. PLoS One 7, e34626 (2012). [DOI] [PMC free article] [PubMed] [Google Scholar]
- [30].International Commission on Non-Ionizing Radiation Protection (ICNIRP). Guidelines for limiting exposure to time-varying electric, magnetic, and electromagnetic fields (up to 300 GHz). Health Phys 74, 494–522 (1998). [PubMed] [Google Scholar]
- [31].Barry RL, Smith SA, Dula AN & Gore JC Resting state functional connectivity in the human spinal cord. Elife 3, e02812 (2014). [DOI] [PMC free article] [PubMed] [Google Scholar]
- [32].Barry RL, Rogers BP, Conrad BN, Smith SA & Gore JC Reproducibility of resting state spinal cord networks in healthy volunteers at 7 Tesla. Neuroimage 133, 31–40 (2016). [DOI] [PMC free article] [PubMed] [Google Scholar]
- [33].Conrad BN et al. Multiple sclerosis lesions affect intrinsic functional connectivity of the spinal cord. Brain 141, 1650–1664 (2018). [DOI] [PMC free article] [PubMed] [Google Scholar]
- [34].Barry RL, Conrad BN, Smith SA & Gore JC A practical protocol for measurements of spinal cord functional connectivity. Sci Rep 8, 16512 (2018). [DOI] [PMC free article] [PubMed] [Google Scholar]
- [35].Held P, Dorenbeck U, Seitz J, Fründ R & Albrich H MRI of the abnormal cervical spinal cord using 2D spoiled gradient echo multiecho sequence (MEDIC) with magnetization transfer saturation pulse. A T2* weighted feasibility study. J Neuroradiol 30, 83–90 (2003). [PubMed] [Google Scholar]
- [36].Barry RL & Smith SA Measurement of T2* in the human spinal cord at 3T. Magn Reson Med 82, 743–748 (2019). [DOI] [PMC free article] [PubMed] [Google Scholar]
- [37].Pruessmann KP, Weiger M, Scheidegger MB & Boesiger P SENSE: sensitivity encoding for fast MRI. Magn Reson Med 42, 952–962 (1999). [PubMed] [Google Scholar]
- [38].Cadotte DW et al. Characterizing the location of spinal and vertebral levels in the human cervical spinal cord. AJNR Am J Neuroradiol 36, 803–810 (2015). [DOI] [PMC free article] [PubMed] [Google Scholar]
- [39].Lister GD, Kleinert HE, Kutz JE & Atasoy E Primary flexor tendon repair followed by immediate controlled mobilization. J Hand Surg Am 2, 441–451 (1977). [DOI] [PubMed] [Google Scholar]
- [40].Glover GH, Li T-Q & Ress D Image-based method for retrospective correction of physiological motion effects in fMRI: RETROICOR. Magn Reson Med 44, 162–167 (2000). [DOI] [PubMed] [Google Scholar]
- [41].Cox RW AFNI: software for analysis and visualization of functional magnetic resonance neuroimages. Comput Biomed Res 29, 162–173 (1996). [DOI] [PubMed] [Google Scholar]
- [42].Zhang L, Zhang C-G, Dong Z & Gu Y-D Spinal nerve origins of the muscular branches of the radial nerve: an electrophysiological study. Neurosurgery 70, 1438–1441 (2012). [DOI] [PubMed] [Google Scholar]
- [43].Menon RS, Ogawa S, Tank DW & Uǧurbil K 4 Tesla gradient recalled echo characteristics of photic stimulation-induced signal changes in the human primary visual cortex. Magn Reson Med 30, 380–386 (1993). [DOI] [PubMed] [Google Scholar]
- [44].Gati JS, Menon RS, Uǧurbil K & Rutt BK Experimental determination of the BOLD field strength dependence in vessels and tissue. Magn Reson Med 38, 296–302 (1997). [DOI] [PubMed] [Google Scholar]
- [45].Cohen-Adad J et al. BOLD signal responses to controlled hypercapnia in human spinal cord. Neuroimage 50, 1074–1084 (2010). [DOI] [PubMed] [Google Scholar]
- [46].Friese S, Hamhaber U, Erb M, Kueker W & Klose U The influence of pulse and respiration on spinal cerebrospinal fluid pulsation. Invest Radiol 39, 120–130 (2004). [DOI] [PubMed] [Google Scholar]
- [47].Piechnik SK, Evans J, Bary LH, Wise RG & Jezzard P Functional changes in CSF volume estimated using measurement of water T2 relaxation. Magn Reson Med 61, 579–586 (2009). [DOI] [PubMed] [Google Scholar]
- [48].Maieron M et al. Functional responses in the human spinal cord during willed motor actions: evidence for side- and rate-dependent activity. J Neurosci 27, 4182–4190 (2007). [DOI] [PMC free article] [PubMed] [Google Scholar]
- [49].Weber KA, Chen Y, Wang X, Kahnt T & Parrish TB Lateralization of cervical spinal cord activity during an isometric upper extremity motor task with functional magnetic resonance imaging. Neuroimage 125, 233–243 (2016). [DOI] [PMC free article] [PubMed] [Google Scholar]
- [50].Seifert AC, Kong Y, Miller KL, Tracey I & Vannesjo SJ Finger-tapping task fMRI in the human cervical spinal cord at 7T. Proc Int Soc Magn Reson Med 27, 298 (2019). [Google Scholar]
- [51].Barry RL, Vannesjo SJ, By S, Gore JC & Smith SA Spinal cord MRI at 7T. Neuroimage 168, 437–451 (2018). [DOI] [PMC free article] [PubMed] [Google Scholar]
Associated Data
This section collects any data citations, data availability statements, or supplementary materials included in this article.


