

Abstract
Metabolomics—the endpoint of the omics cascade—is increasingly recognized as a preferred method for understanding the ultimate responses of biological systems to stress. Flow injection electrospray (FIE) mass spectrometry (MS) has advantages for untargeted metabolic fingerprinting due to its simplicity and capability for high-throughput screening but requires a high resolution mass spectrometer to resolve metabolite features. In this study, we developed and validated a high throughput and highly reproducible metabolomics platform integrating FIE with ultrahigh-resolution Fourier transform ion cyclotron resonance (FTICR) MS for analysis of both polar and nonpolar metabolite features from plasma samples. FIE-FTICR MS enables high throughput detection of hundreds of metabolite features in a single mass spectrum without a front-end separation step. Using plasma samples from genetically identical obese mice with or without type 2 diabetes (T2D), we validated the intra- and inter-sample reproducibility of our method and its robustness for simultaneously detecting alterations in both polar and nonpolar metabolite features. Only 5 min is needed to acquire an ultra-high resolution mass spectrum in either positive or negative ionization mode. Approximately 1000 metabolic features were reproducibly detected and annotated in each mouse plasma group. For significantly altered and highly abundant metabolite features, targeted tandem MS (MS/MS) analyses can be applied to confirm their identity. With this integrated platform, we successfully detected over 300 statistically significant metabolic features in T2D mouse plasma as compared to controls and identified new T2D biomarker candidates. This FIE-FTICR MS-based method is high-throughput and highly reproducible with great promise for metabolomics studies toward a better understanding and diagnosis of human diseases.
Keywords: Fourier transform ion cyclotron resonance mass spectrometry, Flow injection electrospray, metabolite fingerprinting, plasma metabolomics, diabetes, high-throughput platform
Graphical Abstract

INTRODUCTION
Metabolomics is the global characterization of diverse classes of small molecule metabolites as a representation of the (patho)physiological states of biological systems.1, 2 Metabolites are the final downstream products of cellular regulatory systems, so changes in the metabolites reflect the ultimate response of biological systems to intrinsic and extrinsic stresses.3 The two major metabolomics techniques are nuclear magnetic resonance (NMR) spectroscopy and mass spectrometry (MS).2–6 Compared to NMR-based metabolomics, MS-based metabolomics has much higher sensitivity and selectivity.7–9 A typical MS-based metabolomics workflow involves on-line liquid chromatography (LC), gas chromatography (GC), or capillary electrophoresis (CE) to separate metabolites prior to MS, which is not only time-consuming but also introduces run-to-run variability and presents challenges when processing large batches of clinical samples.10, 11 In contrast, direct infusion (DI, using a syringe pump or chip-based microfluidics device), or flow injection electrospray (FIE, using a LC-based sample delivery system without any column coupled to the mass spectrometer) have the advantages for metabolomics due to their simplicity and potential for high-throughput screening capacity.11–14 Consequently, large numbers of metabolites can be simultaneously detected without a front-end separation step. Nevertheless, to utilize these methods to accurately annotate metabolites, high resolution and mass accuracy are essential.15
Fourier transform ion cyclotron resonance (FTICR) MS has great potential to become a powerful technique for metabolomics in combination with DI or FIE methods benefiting from the ultrahigh resolving power, high mass accuracy, and wide dynamic range of a high-field FTICR mass spectrometer.16–19 However, the existing methods for DI require manual steps, such as using a syringe pump for injection, which is not ideal for high-throughput analysis.13 Although chip-based microfluidics devices can be used to automate sample injection and minimize cross-sample contamination, the instability of the resulting nano-ESI spray and the nozzle-to-nozzle variability are significant roadblocks for high-throughput analysis.20–23 In contrast, in FIE-MS, the analytes are automatically introduced to an ESI source using the flow from LC without a front-end separation step.11, 23 Previous studies have demonstrated that both polar and nonpolar compounds can be detected using ESI.9, 24–27 The wash step can be built into the flow injection method, and the electrospray is much more stable in both positive and negative ion modes. Thus, FIE coupled to FTICR MS has significant potential for high-throughput metabolomics analysis of complex biological and clinical samples.
Herein, we report a robust and high-throughput FIE-FTICR MS-based platform for metabolomics, allowing the simultaneous detection of both polar and nonpolar metabolites in mouse plasma samples with high confidence. A simple methanol extraction step was employed for efficient plasma metabolite extraction and detection, with excellent extraction and injection reproduciblity. Only 5 min is needed to acquire a high-resolution mass spectrum that enables the detection of hundreds of metabolite features. Parallel sample extractions (e.g. 17 samples in this study) can be easily performed in 30 min without the need for drying and reconstitution of extracted metabolites, making this method particularly attractive for clinical applications.
Diabetes is a metabolic disorder characterized by complex alterations of key molecules and regulatory pathways, making metabolomic analysis particularly appealing for characterizing and understanding its pathophysiology.28, 29 In this work, we used a strong genetic mouse model of type 2 diabetes (T2D), Black and Tan Brachyury (BTBR) mice homozygous for the LeptinOb mutation30, 31, in order to test the applicability of our FIE-FTICR MS-based platform to a clinically-relevant problem. A total of 367 metabolic features showed statistically significant differences between non-diabetic and T2D mice, whereas 312 metabolic features showed statistically significant differences when T2D mice were fed diets nearly identical in energy density and macronutrient content but differing in nutrient sources. Additionally, targeted MS/MS analysis can be applied to further confirmed the identity of selected metabolites of interest. Taken together, we have validated a new FIE-FTICR MS-based metabolomics platform that is high-throughput and highly reproducible and used it to linking the metabolic response to disease phenotype in a mouse model of T2D. Our findings could have broad implications for the study of this widespread and potentially debilitating disease.32
MATERIALS AND METHODS
Animals
Male and female BTBR mice heterozygous for the LeptinOb mutation (OB) were purchased from the Jackson Labroatory (Bar Harbor, ME) and were bred in-house at the University of Wisconsin Breeding Core to generate homozygous OB experimental mice or wild-type (WT) littermate controls. Mice were single-housed in temperature- and humidity-controlled environments with a 12:12-h light/dark cycle with ad libitum access to standard mouse chow and acidified water (Innovive, San Diego, CA), and provided mouse igloos and nylon bones for enrichment. Upon weaning between 3 and 4 weeks of age, male mice were randomized to one of two commonly-used pelleted chows (Teklad global soy protein-free extruded 2920X, Envigo, Indianapolis, IN; or Rodent Laboratory Chow 5001; Purina, Neenah, WI). The diet compositions are compared in Table S3. Body weights and random fed blood glucose levels were measured prior to euthanasia at 10 weeks of age. Blood glucose was measured using a blood glucose meter (AlphaTRAK) and rat/mouse-specific test strips. For insulin tolerance tests (ITTs), 9 week-old male mice were fasted in the morning for 4–6 h, then injected intraperitoneally with regular human insulin (Humulin®-R, 0.75 U/kg). Blood glucose readings were taken from tail blood before injection (t=0) and 30, 60, and 90 min after injection. WT mice were used as phenotypic controls, and OB mice were sorted into three groups based on the diet they were fed and their T2D status.
All animal studies were approved by the Institutional Animal Care and Use Committees of the University of Wisconsin-Madison and the William S. Middleton Memorial Veterans Hospital, which are both accredited by the Association for Assessment and Accreditation of Laboratory Animal Care. All animals were treated in accordance with the standards set forth by the National Institutes of Health Office of Animal Care and Use.
Sample collection
Mice were anesthetized using 2,2,2-tribromoethanol (Sigma, #T48402). Blood was collected retro-orbitally using a heparin-coated glass capillary tube and mixed with 5 μM EDTA, 10 nM di-peptidyl peptidase 4 (DPP-4) inhibitor (Millipore, #DPP4) and 20 nM aprotinin (Fisher Bioreagents, #BP2503–10). Following sample collection, mice were euthanized by cervical dislocation. Plasma was isolated via centrifugation and stored at −80 °C until needed.
Metabolite extraction
For metabolite extraction, a 2:1 methanol:plasma extraction was applied as reported previously.33 Frozen mouse plasma samples were thawed on ice in a cold room (4 °C). Thirty-microliter plasma aliquots were mixed with 60 μl of chilled LC-MS grade methanol (MeOH) followed by vortexing for 10 s. The samples were placed on a nutating mixer for 20 min and then centrifuged at 13,000 g for 10 min at 4 °C. Fifty microliters of supernatant was transferred to a new microcentrifuge tube and mixed with 50 μl of water for FIE-FTICR MS analysis.
FTICR MS-based platform for metabolomics
The FIE- FTICR MS experiments were performed using a Waters nanoACQUITY UPLC (Waters Corporation, Milford, MA, USA) coupled to a Bruker solariX 12 T FTICR mass spectrometer (Bruker Daltonics, Bremen, Germany) without LC column. Metabolite extracts were directly injected from the Waters nanoACQUITY UPLC into the FTICR MS via 100 μm x 40 cm PEEK tubing with three injection replicates per sample. The flow rate was set to 20 μl/min. Ions were accumulated for 0.1 s and 8 M transient size was applied. The m/z range was set to 40–1200 with 50 m/z Q1 mass. 50 scans were collected for each mass spectrum. Dry gas flow was set to 4 L/min at 150 °C. Largest frequency values for octopole (5 MHz), quadrupole (2 MHz), and transfer hexapole (6 MHz) were used to improve ion transition. Time of flight was set to 0.8 ms. Sweep excitation power was set to 27%. The estimated resolving power at 400 m/z was 190,000. The mobile phase was 50:50 methanol:water with 0.1% formic acid or 10 mM ammonium acetate added for positive or negative modes, respectively. The FTICR MS was calibrated with 1 mM NaTFA in both positive and negative modes before experiments. Targeted MS/MS was performed via direct infusion of plasma samples from the three obese mouse groups. The isolation window was set to 2 m/z, and the collisional energy was optimized based on the precursor ions.
Data analysis
The mouse phenotyping data were analyzed in GraphPad Prism v.8 (GraphPad Software, San Diego, CA). To compare weights, blood glucose levels, and ITT area under the curve (AUC), each OB group was compared to its own WT control group by t-test. Within the WT groups and OB groups, data were compared by one-way ANOVA with Tukey’s test post-hoc to correct for multiple comparisons. To prepare ITT data for analysis, each individual’s blood glucose levels after insulin injection were normalized as the percent blood glucose value before injection. For AUC analyses, the baseline was set at 100% and AUC quantified as the total negative peak area. The percent blood glucose values at each timepoint after injection were compared within and between OB groups and WT control groups by two-way paired ANOVA with Sidak’s test post-hoc to correct for multiple comparisons. Statistical significance was set at p < 0.05.
The mass spectra were processed and analyzed using DataAnalysis 4.3 (Bruker Daltonics, Bremen, Germany). The workflow is summarized in Figure S1A. Bucket (mass) lists in the positive and negative modes were generated using the T-ReX 2D workflow in MetaboScape 4.0 (Bruker Daltonics, Bremen, Germany). The mzDelta was set to 0.50 mDa, max. The maximum charge state was set to 3, and the intensity threshold was set to 0. The minimum number of features for the result was set to 5. The bucket lists in the positive and negative modes were merged into one bucket list with 1.0 ppm m/z tolerance. Features with a ratio of sample average:blank average < 10 were deleted. The merged bucket list was annotated with the SmartFormula function in MetaboScape 4.0 with 2.0 ppm as the narrow Δm/z cutoff, 5.0 ppm as the wide Δm/z cutoff, 20 as the narrow mSigma cutoff, and 50 as the wide mSigma cutoff. Elements were set to CHNOPS, and element ratio filters proposed by Kind and Fiehn34, and Kessler et al.35 were applied with common element ratio presets in MetaboScape 4.0, including 0.2–3.1 H/C ratio, 0–1.3 N/C ratio, 0–1.2 O/C ratio, 0–0.3 P/C ratio, 0–0.34 P/O ratio, and 0–0.8 S/C ratio. Electron configuration was set to Even (Senior and Lewis). Heuristic element count probability check was applied.34 Statistical analysis was performed using MetaboScape 4.0 and the online software MetaboAnalyst.36 The putative metabolites were annotated by METLIN with a 2 ppm mass error cutoff37–40. In most cases, the isomer with the lowest METLIN number was reported. Lipids and lipid-like molecules were reported as a combined general chemical name with total fatty acid carbon number:number of double bonds.41–44 For carbohydrates, short peptides, fatty acids, glycerophosphocholines and glycerophosphoethanolamines, more than one isomers with similar structures and chemical properties may be reported for one mass. SmartFormula and METLIN MS based annotations provide information on the chemical formulas and tentative chemical names, respectively.45, 46 Figure S2A shows the numbers of features or annotations in each step. METLIN annotations were then classified using “ClassyFire” and categorized as either non-polar or polar metabolites based on the superclass information.47
RESULTS
A high-throughput and highly reproducible FIE-FTICR MS-based platform
We report an integrated FIE-FTICR MS-based platform for metabolomics analysis of plasma samples and demonstrated its high reproducibility (Figure 1). This FIE-FTICR MS-based metabolomics platform workflow begins with methanol extraction of plasma metabolites, followed by FIE directly injected into the FTICR-MS without LC separation. It provides peak detection, label-free quantification, feature annotation, and options for targeted MS/MS for metabolite identification with data processing performed using DataAnalysis, MetaboScape and METLIN45, 46 (Figure 1). A detailed data analysis workflow is shown in Figure S1. The single-step methanol extraction protocol, through the centrifucation step, can be completed in approximately 30 min for multiple samples simultaneously (e.g. all 17 plasma samples in this study). MeOH- and water-containing extracts are ESI-MS compatible and can be directly injected into FTICR-MS without further drying and reconstitution of extracted metabolites. Following injection, only 5 minutes (including a ~2 minute wash step) is required to acquire a high resolution mass spectrum composed of hundreds of distinct metabolic features. In sum, we were able to complete 12 sample injections in a single hour of instrument time.
Figure 1.

Workflow of the FIE-FTICR MS-based platform for metabolomics. Plasma samples were first extracted and then directly injected into FTICR MS without LC separation for detection and label-free quantification of metabolite features. Metaboscape was used for statistical analysis and SmartFormula annotation. METLIN provided annotations by accurate mass matching.Targeted MS/MS was performed for highly abundant and statistically significant features.
First, we sought to evaluate the injection reproducibility of our FIE-FTICR MS platform for plasma metabolomics. Three injection replicates of a single mouse plasma sample were completed in both positive and negative ion modes. A representative zoomed-in positive ion mode mass spectrum revealed 14 unique features in a 70 m/z range annotated within 5 ppm mass error using the SmartFormula function in MetaboScape 4.0, and 12 of them annotated within 2 ppm (Figure S3A). Benefiting from the ultrahigh resolution of FTICR MS, the peaks at 570.3487 and 570.3574 m/z (Δm/z = 0.0087) could be distinguished as two annotations (Figure S3B). The full and zoomed-in positive (Figure S4A) and negative (Figure S4B) ion mode mass spectra of each injection replicate demonstrate the high reproducibility of our platform. After merging positive and negative bucket lists, over 400 features were annotated using the SmartFormula function (mass error cutoff: 5 ppm) in one injection replicate (Figure S4C). A total of 306 features were shared among the three injection replicates (Figure S4D). The median coefficient of variation (CV%) of intensity was 10.3% for shared features. By combining the injection replicates, 585 unique features were detected and annotated.
Next, to evaluate extraction reproducibility, three aliquots from the same mouse plasma sample were extracted independently. The mass spectra of the three extraction replicates showed excellent reproducibility in both positive and negative modes (Figure 2A and 2B). Approximately 600 features were consistently annotated using the SmartFormula function (mass error cutoff: 5 ppm) in one extraction replicate (Figure 2C). The numbers of annotations represent the total unique features from the 3 injection replicates for each extraction replicate in both positive and negative ion modes. A total of 488 features (65.0%) were shared among the three extraction replicates (Figure 2D). Fewer than 8.8% unique features were detected and annotated in a single extraction. For the shared features, the minimum CV% of intensity is 0.5%, and the maximum CV% of intensity is 69.0%. The median CV% of intensity is 16.4%.
Figure 2.
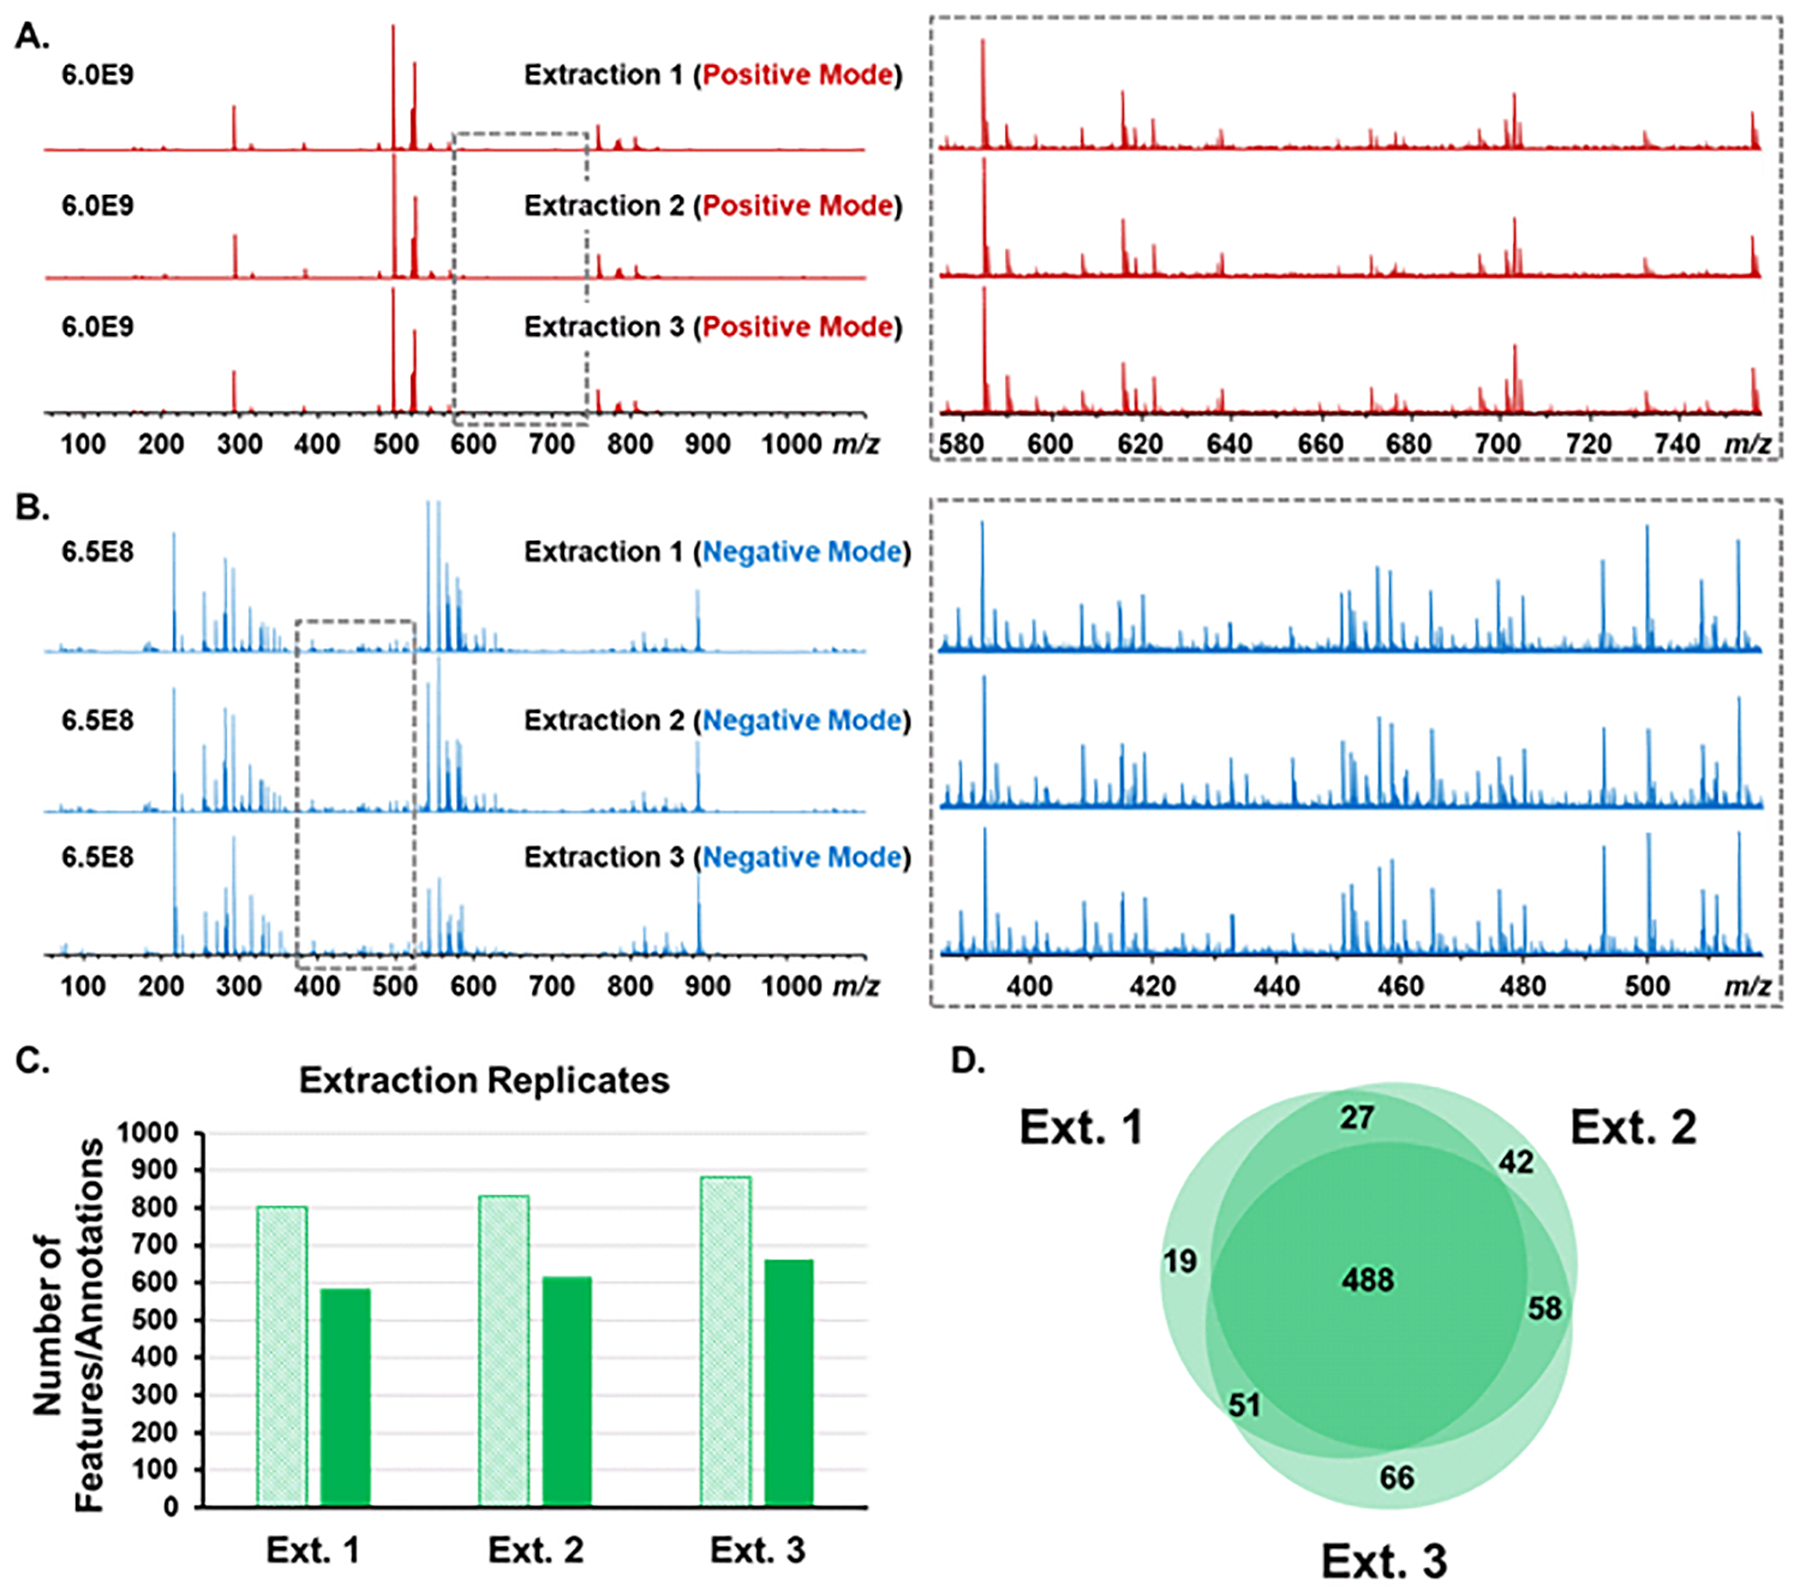
Evaluation of reproducibility of FIE-FTICR MS with extraction replicates. Mass spectra of 3 extraction replicates of the OBP sample in positive mode (A) and negative mode (B). The zoomed-in mass spectra revealed the low abundance metabolite features. C. The number of features after blank reduction (light shading) and annotations (dark shading) from MetaboScape 4.0 (Δm < 5 ppm) of 3 extraction replicates. The number of annotations represent the total annotations of 3 injection replicates in each extraction in both positive and negative modes. D. Venn diagram shows the numbers of shared and unique SmartFormula annotations in 3 extraction replicates (3 injection replicates in each extraction).
We were able to detect both nonpolar and polar metabolites using the described single-step MeOH extraction protocol (Figure 3). The nonpolar compounds detected were classified under a single superclass of lipids and lipid-like molecules, whereas polar metabolites fell into multiple superclasses, with the most frequently observed being organic oxygen molecules, organic acids and their derivatives, as well as organic nitrogen compounds (Figure 3). At the subclass level, we observed a number of nonpolar and polar metabolites of putative importance in metabolic disease, including nonpolar fatty acids and fatty- acid conjugates, as well as polar metabolite subclasses such as amino acids, peptides and their analogues (Figure 3).
Figure 3.

Chemical ontology of metabolites from the methanol extraction. Shown here are the most abundant metabolite classes showing statistically significant changes in this study. Nonpolar metabolites (orange) fall into one superclass, lipids and lipid-like compounds, whereas polar metabolites (blue) fall into multiple superclasses.
Metabolomics of OBP, OBP-T2D and OBT-T2D plasma using FIE-FTICR MS
Using lean, WT mice as phenotypic controls, OB mice were sorted into three groups: nondiabetic obese mice fed the Purina diet (OBP, n=5), type 2 diabetic obese mice fed the Purina diet (OBP-T2D, n=6) and type 2 diabetic obese mice fed the Teklad diet (OBT-T2D, n=6). Plasma samples from OBP (n=5), OBP-T2D (n=6) and OBT-T2D (n=6) mice were collected, extracted, and analyzed using the methods described above (Figure 4A). The three obese mouse groups did not vary significantly in body weight at 10 weeks of age (Figure 4B), and OBP-T2D and OBT-T2D mice had elevated blood glucose levels compared to WT control mice at the time of euthanasia (Figure 4C). All obese groups were severely insulin resistant compared to the WT mouse group on the same diet, whether represented as the percent baseline blood glucose measurements after insulin injection (Figure 4D) or as the integration of the insulin tolerance test over the time period (Figure 4E). The average of features in each OBP, OBP-T2D, and OBT-T2D sample were 660, 818, and 943, respectively, whereas the average of SmartFormula annotations in each OBP, OBP-T2D, and OBT-T2D sample were 516, 640, and 715, respectively (Figure S2B). In positive ion mode, 765 features were detected from the three mouse plasma groups, whereas 875 features were detected in negative ion mode. 87 features with the same Bucket label (Δm < 1 ppm) were combined to generate the merged mass list (Figure S2C).
Figure 4.
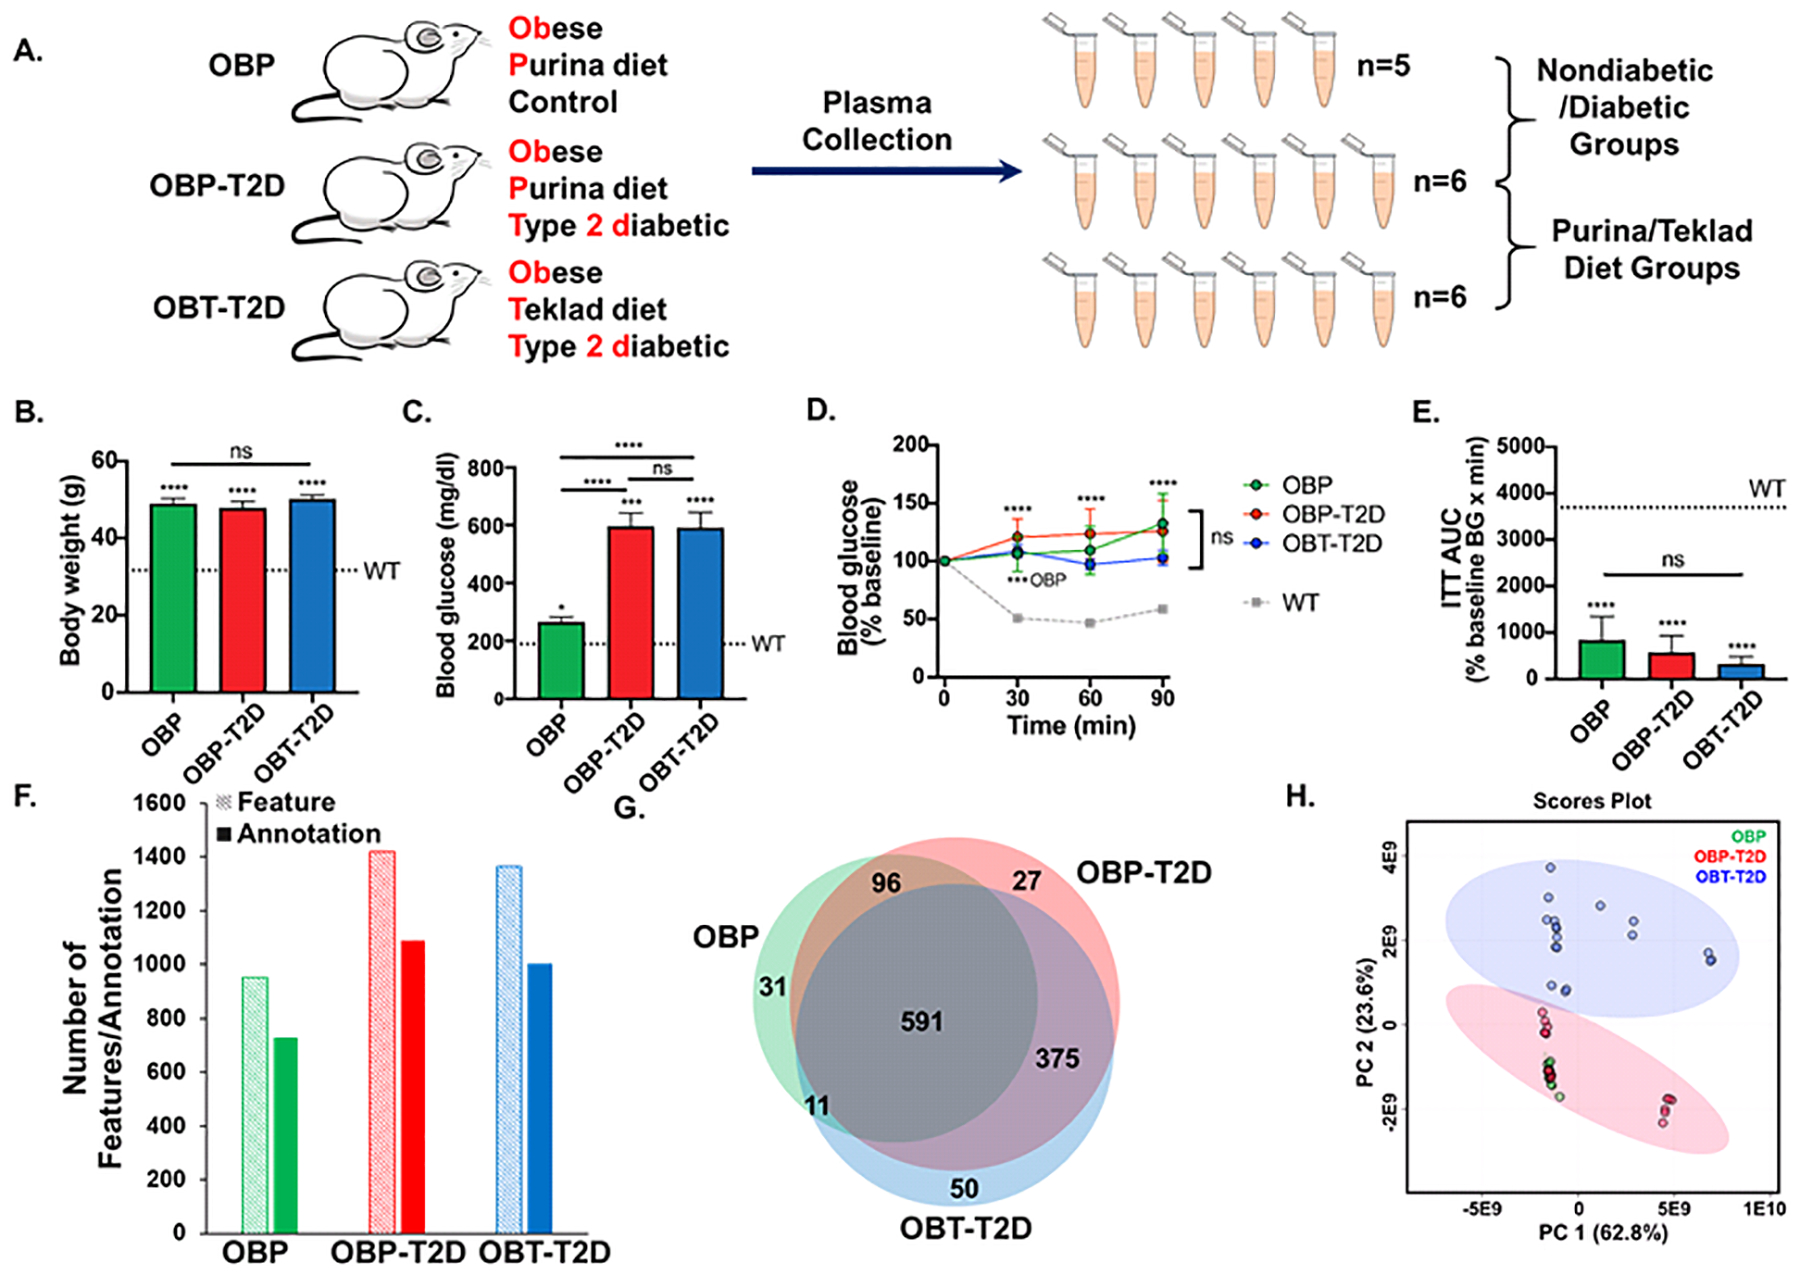
Application of FIE-FTICR MS to type 2 diabetes using three mouse groups. A. Schematic overview of three mouse groups used in the diabetes study. Plasma samples from OBP (n=5) and OBP-T2D (n=6) mice were used for nondiabetic vs. diabetic (T2D) group comparisons. Plasma samples from OBP-T2D (n=6) and OBT-T2D (n=6) mice were used for Purina diet vs. Teklad diet group comparisons. B. Random-fed blood glucose levels of 10-week-old obese mice as compared to the mean weight of lean wild-type (WT) controls. D. Body weights of 10-week-old obese mice as compared to the mean weight WT controls. D. Normalized blood glucose values of obese mice during insulin tolerance tests, with the mean of WT controls shown for comparison. E. Area-under-the-curve (AUC) analyses for the data shown in D. F. The numbers of features (light shading) and chemical formula annotations (solid shading) from MetaboScape 4.0 (Δm < 5 ppm) of the OBP, OBP-T2D, and OBT-T2D groups. G. Venn diagram of chemical formula annotations of OBP, OBP-T2D, and OBT-T2D plasma samples. H. Principal component analysis (PCA) of the 3 groups based on FIE-FTICR MS data. The 95% confidence limit was indicated as the shaded area. In B-E, * = p<0.05; *** = p<0.001 and ****, p<0.0001 for OB groups vs. their WT controls or the indicated OB vs. OB comparison. ns = not significant.
Comparisons between OBP and OBP-T2D metabolites were used to investigate the effect of T2D status on the plasma metabolome, whereas comparisons between OBP-T2D and OBT-T2D metabolites were utilized to determine the effect of diet on the T2D plasma metabolome. The total features detected and annotated from the three mouse plasma groups were 729, 1089 and 1004 features in the OBP, OBP-T2D and OBT-T2D mouse plasma groups, respectively. A total of 591 features were shared among the three sample groups (Figure 4G). The obese, T2D mouse groups (OBP-T2D and OBT-T2D) shared more common features than the obese mouse groups fed solely the Purina diet (OBP and OBP-T2D). Principal component analysis (PCA) was performed that included all detected metabolic features in both positive and negative ion modes to assess the variability in the data (Figure 4H). PCA score plots (PC1 versus PC2) of the three mouse plasma sample groups with the 95% confidence limit (shaded area) showed separation between the OBP-T2D and OBT-T2D groups . The OBP samples are tightly clustered compared to the OBP-T2D and OBT-T2D samples. A volcano plot showed 367 SmartFormula annotated metabolic features were at least 2-fold different between the OBP and OBP-T2D groups when p(FDR) < 0.05 was used (Figure 5A). A heat map of the top 25 most significant metabolic features revealed good clustering between the non-diabetic and T2D groups (Figure 5B). Using the same analysis methods, 312 SmartFormula annotated metabolic features were at least 2-fold different between the OBP-T2D and OBT-T2D groups (Figure 5C), with good clustering between diet groups using the top 25 most significant metabolic features (Figure 5D).
Figure 5.

Metabolic differences between the diabetic (OBP vs. OBP-T2D) and diet (OBP-T2D vs. OBT-T2D) groups. A. Volcano plot of OBP vs. OBP-T2D groups. A total of 367 blank-reduced features showed statistically significant differences (p(FDR) < 0.05). B. Heat map represents the top 25 significant features from t-test analysis of OBP vs. OBP-T2D. C. Volcano plot of OBP-T2D vs. OBT-T2D groups. A total of 312 metabolic features showed statistically significant differences (p(FDR) < 0.05). D. Heat map represents the top 25 significant features from t-test analysis of OBP-T2D vs. OBT-T2D.
METLIN annotated metabolites (p(FDR) < 0.05) significantly different by T2D status or diet in the context of T2D are listed in Table S1 and Table S2, respectively, and a representative selection of polar and nonpolar METLIN annotated metabolites is shown in Figure 6. Glucose/fructose was significantly increased in OBP-T2D plasma vs. OPB and was essentially unchanged in OBT-T2D vs. OBP-T2D, correlating very well with phenotype (Figure 6). Dislipidemia—a pathological elevation in plasma cholesterol, triglycerides, or both that is associated with alterations in circulating levels of other lipids and free fatty acids—is a common co-morbidity of T2D. In our study, cholesterol/lathosterol was significantly elevated in OBP-T2D mice vs. OBP, and even more strongly elevated in OBT-T2D (Figure 6). Interestingly, monoacylglycerols (MG) were unchanged between OBP-T2D and OBP and were lower in OBT-T2D vs. OBP-T2D, while a number of phosphatidylcholine (PC), phosphatidylethanolamine (PE), phosphatidylserine (PS), and phosphatydilinositide (PI) glycerophospholipids were sequentially lower by T2D status and diet (Figure 6). Nevertheless, a variety of fatty acids, including myristic acid, gaidic acid, linolenic acid, linoleic acid, oleic acid, eicosapentaenoic acid (EPA) and docosahexaenoic acid (DHA), were significantly higher in the OBP-T2D group vs. the OBP group and were relatively less affected by diet (Figure 6, Tables S1, and Table S2), which, combined with the cholesterol/lathosterol data supports a dislipidemic phenotype. Alterations in energy metabolism are also associated with the T2D phenotype, and peptides such as AspLysLysLys and GlyArgArgArg were significantly higher in OBP-T2D plasma vs. OBP and and even higher in OBP-T2D, while others, such as glucoheptonic acid, were lower in OBP-T2D vs. OBP and lower still in OBP-T2D (Figure 6).
Figure 6.
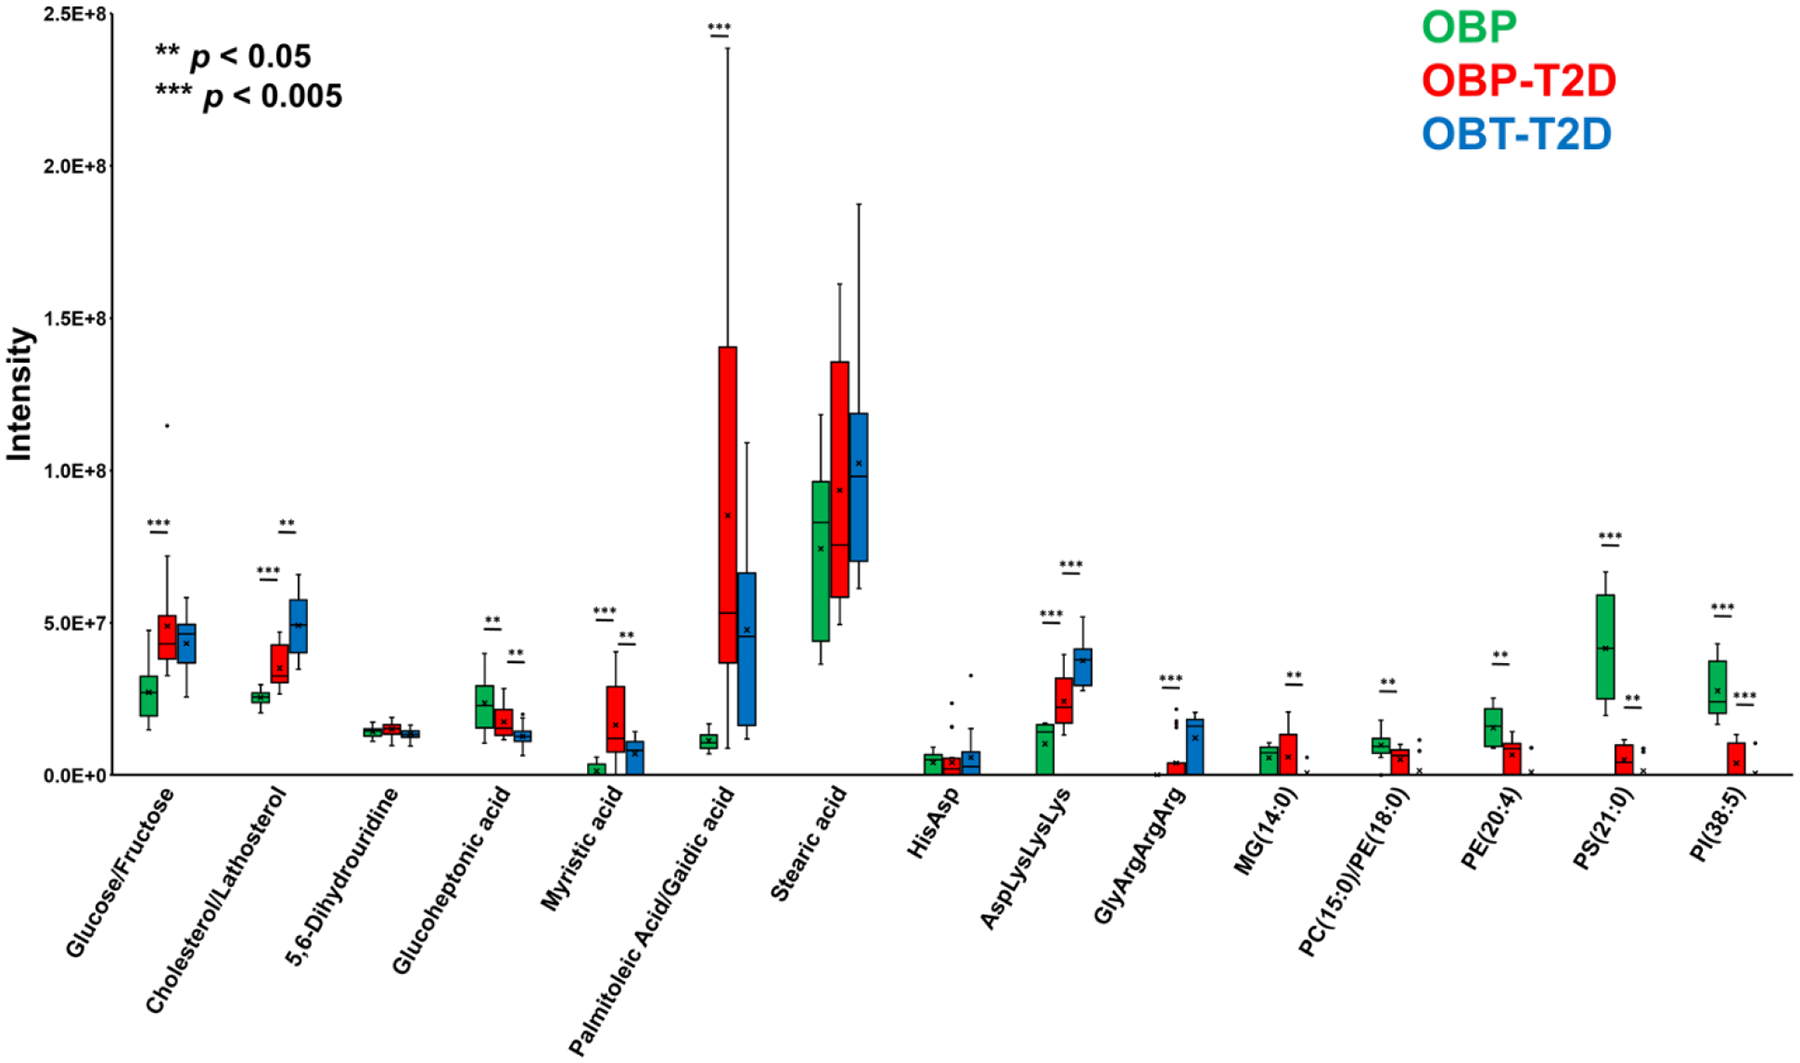
Box & Whisker plots to compare representative putative metabolites for diabetic (OBP vs. OBP-T2D) and diet (OBP-T2D vs. OBT-T2D) effect from plasma samples. ** = p < 0.05; *** = p < 0.005
Targeted MS/MS identification for metabolites
To increase confidence in the annotations and to differentiate between structural isomers, tandem MS (MS/MS) is required.48, 49 The CID experiments performed on the FTICR MS increased confidence in the identity of the metabolic features that show statistically significant changes between the diabetic and nondiabetic groups and were highly abundant (>1×10⁷ peak intensity in a single scan). A feature at m/z 179.0563 is preliminarily annotated as a hexose based on accurate mass alone (Figure 7). Statistical analysis indicates that it is significantly increased in the OBP-T2D group compared to the OBP control group, making it a candidate for more detailed identification (Figure 7A). Using the theoretical CID MS/MS spectra generated from the METLIN quadrupole time-of-flight (QTOF) experimental library, we can compare our experimental MS/MS spectra to the spectra in the METLIN library for a variety of hexoses. Based on the comparison of our experimental MS/MS to the METLIN library, including the scoring of the top hits and manual inspection, the experimental CID mass spectrum of the feature at m/z 179.0563 shows a good agreement with the theoretical CID mass spectrum of deprotonated glucose (Figure 7B). In support of this, glucose had the highest structure score in MS-Finder at 4.34. To assess whether other isobaric hexoses such as fructose or mannose could contribute to the experimentally observed feature at m/z 179.0563, we compared our experimental CID mass spectrum with that of the theoretical CID mass spectrum of fructose and mannose (Figures 7C and 7D). In the theoretical CID mass spectrum of fructose (Figure 7C), the MS/MS fragment peaks at m/z 96.9696, m/z 119.035, m/z 143.0343 and m/z 149.0444 are missing and this is reflected in its reduced score of 3.39. However, if the experimentally observed feature at m/z 179.0563 is a mixture of glucose and fructose, it is difficult to exclude the presence of fructose based solely on the comparison of CID mass spectra. In the theoretical CID mass spectrum of mannose (Figure 7D), the additional peaks at m/z 134.8723 and m/z 135.0414 are not detected in the experimental spectrum and it has a score of 2.84, which makes the feature at m/z 179.0563 unlikely to be mannose. In sum, this example confirmed the reliability of our high-resolution FIE-FTICR MS platform to accurately annotate a peak based on accurate mass and limited the identity of this peak to two hexoses that have been shown to have clinical importance in T2D.50, 51
Figure 7.

Characterization of glucose by ultrahigh-resolution MS and MS/MS. A. Example of label-free quantification of metabolite at 179.0563 m/z. B. MS/MS analysis of metabolites at 179.0563 m/z. The experimental CID mass spectrum is compared with the theoretical CID mass spectrum of glucose. C. MS/MS analysis of metabolites at 179.0563 m/z. The experimental CID mass spectrum is compared with the theoretical CID mass spectrum of fructose. D. MS/MS analysis of metabolites at 179.0563 m/z. The experimental CID mass spectrum is compared with the theoretical CID mass spectrum of mannose. Predicted chemical formulas are labeled in the theoretical CID mass spectra.
DISCUSSION
This study aimed to establish a highly reproducible platform for high-throughput metabolomics analysis of polar and non-polar metabolites simultaneously. By using three injection replicates and three extraction replicates, we were able to demonstrate consistency in both the number of features and SmartFormula annotations obtained, with ~800 features detected in each extraction replicate, ~600 of which were annotated using the SmartFormula function in MetaboScape 4.0. Furthermore, we showed robustness in the intensity of the features with a median %CV of 16% (Figure 2). One of the main concerns of FIE or similar approaches is the lack of chromatographic information to provide an additional dimension of confirmation of compound identity52. With our FIE-FTICR MS platform, we take advantage of the high-resolution FTICR MS to resolve hundreds of metabolite features and identify isotopic patterns to determine chemical formulas. Furthermore, we can use a single platform for all data acquisition without the need for verification of compound annotation on a separate platform, as often used in FIE-MS studies.53, 54 Finally, if desired, targeted MS/MS can be applied to further resolve statistically- and/or biologically-significant features (Figure 7).
Our method provides a simple sample preparation and a short analysis time of 35 minutes from the start of sample extraction to the end of analysis. Sample extractions in parallel can be easily implemented to further reduce the sample preparation time for a large sample size. FIE allows analysis of a plasma sample in 5 minutes, in contrast to chromatographic methods that require 0.5–1 h or longer for a GC or LC run.55–57 Additionally, our sample workup is shorter than previous FIE studies53, 54 in the field due to the omission of a long incubation during extraction and drying of the extraction supernatant.58, 59 We have shown good extraction reproducibility, underscoring the utility of our method for quantitative metabolomic studies.
For MS-based metabolomics, there is still a lack of methods for simultaneous detection of changes for both polar and nonpolar compounds in a fast, reproducible manner with confidence in the annotation of compounds. Here, we developed a metabolomics strategy that can detect changes in both polar and nonpolar metabolites involved in lipid and primary metabolism in a high-throughput manner (Figure 3). In addition, our method functions without the bias elicited by selective chromatographic retention or restrict ions to a targeted metabolite list, as is often the case in FIE (8). Furthermore, the ultrahigh-resolution of the FTICR and selected MS/MS to identify key features increases the level of confidence in the metabolite annotations.
Using our metabolomics platform to study plasma samples from non-diabetic and T2D mice, we were able to both replicate the previous findings including both nonpolar and polar metabolites55, 60–62 as as well as detect potential new T2D biomarkers and lead compounds for future biological characterization. Among the nonpolar metabolites, we observed a general increase in the levels of lipids with shorter acyl chains and increased degrees of unsaturation (number of double bonds), in general agreeing with the literature60. For lipids, we found a global increase in circulating levels of medium- and long-length free fatty acids, such as myristic, palmitic and arachidonic acids, consistent with previous studies in these diabetic samples.55, 56, 63, 64 In addition, we observed a decrease in phosphatidylcholines (PCs) of fewer total carbons and an increase in PCs with more total carbons (Figure 6 and Table S1) which is in agreement with the previous finding.65 The rationale behind an increase in longer fatty acids is a shift in oxidation and an increase in lipolysis. In addition to PCs, we observed changes in the levels of phosphatidylserine (PS) and phosphatidylinositol (PI), important cell signaling molecules66, which have not been reported previously in plasma in diabetes to our knowledge. These general trends in lipid abundance were much more strongly affected by T2D status than by diet, which was relatively unexpected considering the role of diet in providing lipid precursors. Of the polar metabolites, glucose is the most well-known biomarker of the diabetic state, and our new methodology highly reproduced our phenoytypic characterization. We also reproduced published findings of increased hexoses and branched chain amino acids (BCAAs) in the T2D state.55, 62 What we believe are novel findings include alterations in peptide levels, with an increase in observed peptides in T2D samples compared to diet-matched controls, whereas differing diets had no clear trend in peptide levels. As peptides can function in cellular signaling, some of these peptides may be worthy of future study in developing T2D therapeutics.67 Support for this concept includes studies that supplementation with naturally derived dipeptides can buffer against increases in glucose elevation.68
CONCLUSIONS
The FIE-FTICR MS-based platform coupled with single-step methanol extraction is a robust, highly reproducible, and high-throughput method for plasma metabolomics. The single step methanol extraction can be easily implemented in parallel for a large sample size. Subsequently, it only takes 5 minutes to acquire a high resolution mass spectrum that enabled detection of hundreds of metabolic features. Excellent injection and extraction reproducibility were achieved using the present platform. Mouse plasma samples were used as an example to show the capability of metabolite quantification and identification to a clinically-relevant problem: namely, T2D. Approximately 1000 metabolic features were reproducibly detected and annotated in each mouse plasma group. A total of 367 metabolic features showed statistically significant differences between the obese, nondiabetic and T2D groups fed on the same diet (OBP and OBP-T2D), whereas 312 metabolic features showed statistically significant differences between the obese, T2D groups (OBP-T2D and OPT-T2D) fed on different diets nearly identical in energy density and macronutrient content, but not ingredients or some micronutrients. Moreover, we demonstrated the mouse plasma metabolome is altered more by T2D status than by diet within the context of T2D. Among these statistically significant metabolic features, we detected both nonpolar lipids (i.e. fatty acids and phospholipids) and polar compounds (e.g., glucose/fructose and peptides). If desired, targeted MS/MS analysis can be used to increase the confidence of in metabolite identification, which was used in this work to differentiate glucose/fructose from other hexoses. Taken together, we have demonstrated that this FIE-FTICR MS-based platform allows for quantitative analysis of clinically-relevant metabolomics samples with high throughput and high reproducibility.
Supplementary Material
Figure S1. Data analysis workflow for feature detection and compound annotation.
Figure S2. Summarization of numbers of features or annotations.
Figure S3. Representative ultra-high resolution FTICR mass spectra.
Figure S4. Evaluation of reproducibility of FIE-FTICR MS with injection replicates.
Table S1. Significant metabolites in OBP and OBP-T2D groups.
Table S2. Significant metabolites in OBP-T2D and OBT-T2D groups.
Table S3. Comparison of compositions of Teklad and Purina diet.
Table S4. Merged mass list; mass lists in positive and negative ion modes; mass list for reproducibility experiments; all METLIN annotations; MS/MS mass list of 179.0563 m/z.
ACKNOWLEDGEMENTS
This work was funded in part by Merit Review Award I01 BX003700 (to M.E.K.) from the United States (U.S.) Department of Veterans Affairs Biomedical Laboratory Research and Development (BLR&D) Service, a UW2020 WARF Discovery Initiative grant from the UW-Madison Office of the Vice Chancellor for Research and Graduate Education and the Wisconsin Alumni Research Foundation (to E.D.C., D.B.D., and M.E.K), National Institutes of Health (NIH) grants UL1TR002373 (to A.R.B), and R01 DK102598 (to M.E.K.). B.W. acknowledges support from the NIH Molecular and Pathology Training Program T32GM081061 and F31HL152647 (to B.W.). T.N.T. acknowledges support from the NIH Chemistry-Biology Interface Training Program T32 GM008505. Y. G. would like to acknowledge NIH R01 GM125085, R01 HL109810, and S10 OD018475 (to Y.G.). The study sponsors had no role in the study design; collection, analysis or interpretation of data; the writing of the report; or the decision to submit the paper for publication. The content is solely the responsibility of the authors and does not necessarily represent the official views of the National Institutes of Health, the U.S. Department of Veterans Affairs, or the United States Government.
Footnotes
SUPPORTING INFORMATION
The following supporting information is available free of charge at ACS website http://pubs.acs.org
REFERENCES
- 1.Fiehn O, Metabolomics – the link between genotypes and phenotypes. Plant Mol. Biol 2002, 48, (1–2), 155–171. [PubMed] [Google Scholar]
- 2.Nicholson JK; Lindon JC, Metabonomics. Nature 2008, 455, (7216), 1054–1056. [DOI] [PubMed] [Google Scholar]
- 3.Patti GJ; Yanes O; Siuzdak G, Metabolomics: the apogee of the omics trilogy. Nat. Rev. Mol. Cell Biol 2012, 13, (4), 263–269. [DOI] [PMC free article] [PubMed] [Google Scholar]
- 4.Emwas AH; Roy R; McKay RT; Tenori L; Saccenti E; Gowda GAN; Raftery D; Alahmari F; Jaremko L; Jaremko M; Wishart DS, NMR Spectroscopy for Metabolomics Research. Metabolites 2019, 9, (7), 123–161. [DOI] [PMC free article] [PubMed] [Google Scholar]
- 5.Dettmer K; Aronov PA; Hammock BD, Mass spectrometry-based metabolomics. Mass Spectrom. Rev 2007, 26, (1), 51–78. [DOI] [PMC free article] [PubMed] [Google Scholar]
- 6.Monge ME; Dodds JN; Baker ES; Edison AS; Fernández FM, Challenges in Identifying the Dark Molecules of Life. Annu. Rev. Anal. Chem 2019, 12, (1), 177–199. [DOI] [PMC free article] [PubMed] [Google Scholar]
- 7.Emwas A-HM, The Strengths and Weaknesses of NMR Spectroscopy and Mass Spectrometry with Particular Focus on Metabolomics Research In Metabonomics, Bjerrum JT, Ed. Humana Press: New York, NY, 2015; Vol. 1277, pp 161–193. [DOI] [PubMed] [Google Scholar]
- 8.Griffin JL; Atherton H; Shockcor J; Atzori L, Metabolomics as a tool for cardiac research. Nat. Rev. Cardiol 2011, 8, (11), 630–643. [DOI] [PubMed] [Google Scholar]
- 9.Han X; Yang K; Gross RW, Multi-dimensional mass spectrometry-based shotgun lipidomics and novel strategies for lipidomic analyses Mass Spectrom. Rev 2012, 31, (1), 134–178. [DOI] [PMC free article] [PubMed] [Google Scholar]
- 10.Lei Z; Huhman DV; Sumner LW, Mass Spectrometry Strategies in Metabolomics. J. Biol. Chem 2011, 286, (29), 25435–25442. [DOI] [PMC free article] [PubMed] [Google Scholar]
- 11.Beckmann M; Parker D; Enot DP; Duval E; Draper J, High-throughput, nontargeted metabolite fingerprinting using nominal mass flow injection electrospray mass spectrometry. Nat. Protoc 2008, 3, (3), 486–504. [DOI] [PubMed] [Google Scholar]
- 12.Gonzalez-Dominguez R; Sayago A; Fernandez-Recamales A, High-Throughput Direct Mass Spectrometry-Based Metabolomics to Characterize Metabolite Fingerprints Associated with Alzheimer’s Disease Pathogenesis. Metabolites 2018, 8, (3), 52–60. [DOI] [PMC free article] [PubMed] [Google Scholar]
- 13.Han J; Danell RM; Patel JR; Gumerov DR; Scarlett CO; Speir JP; Parker CE; Rusyn I; Zeisel S; Borchers CH, Towards high-throughput metabolomics using ultrahigh-field Fourier transform ion cyclotron resonance mass spectrometry. Metabolomics 2008, 4, (2), 128–140. [DOI] [PMC free article] [PubMed] [Google Scholar]
- 14.Kiss A; Lucio M; Fildier A; Buisson C; Schmitt-Kopplin P; Cren-Olive C, Doping Control Using High and Ultra-High Resolution Mass Spectrometry Based Non-Targeted Metabolomics-A Case Study of Salbutamol and Budesonide Abuse. Plos One 2013, 8, (9), e74584–e74596. [DOI] [PMC free article] [PubMed] [Google Scholar]
- 15.Kind T; Fiehn O, Metabolomic database annotations via query of elemental compositions: Mass accuracy is insufficient even at less than 1 ppm. BMC Bioinformatics 2006, 7, 234–243. [DOI] [PMC free article] [PubMed] [Google Scholar]
- 16.Brown SC; Kruppa G; Dasseux JL, Metabolomics applications of FT‐ICR mass spectrometry Mass Spectrom. Rev 2005, 24, (2), 223–231. [DOI] [PubMed] [Google Scholar]
- 17.Junot C; Madalinski G; Tabet JC; Ezan E, Fourier transform mass spectrometry for metabolome analysis. Analyst 2010, 135, (9), 2203–2219. [DOI] [PubMed] [Google Scholar]
- 18.Marshall AG; Hendrickson CL; Jackson GS, Fourier transform ion cyclotron resonance mass spectrometry: a primer. Mass Spectrom. Rev 1998, 17, (1), 1–35. [DOI] [PubMed] [Google Scholar]
- 19.Draper J; Lloyd AJ; Goodacre R; Beckmann M, Flow infusion electrospray ionisation mass spectrometry for high throughput, non-targeted metabolite fingerprinting: a review. Metabolomics 2012, 9, (1), 4–29. [Google Scholar]
- 20.Shi X; Wahlang B; Wei XL; Yin XM; Falkner KC; Prough RA; Kim SH; Mueller EG; McClain CJ; Cave M; Zhang X, Metabolomic Analysis of the Effects of Polychlorinated Biphenyls in Nonalcoholic Fatty Liver Disease. J. Proteome Res 2012, 11, (7), 3805–3815. [DOI] [PMC free article] [PubMed] [Google Scholar]
- 21.Lorkiewicz P; Higashi RM; Lane AN; Fan TWM, High information throughput analysis of nucleotides and their isotopically enriched isotopologues by direct-infusion FTICR-MS Metabolomics 2012, 8, (5), 930–939. [DOI] [PMC free article] [PubMed] [Google Scholar]
- 22.Southam AD; Weber RJM; Engel J; Jones MR; Viant MR, A complete workflow for high-resolution spectral-stitching nanoelectrospray direct-infusion mass-spectrometry-based metabolomics and lipidomics. Nat. Protoc 2017, 12, (2), 310–328. [DOI] [PubMed] [Google Scholar]
- 23.Nanita SC; Kaldon LG, Emerging flow injection mass spectrometry methods for high-throughput quantitative analysis. Anal. Bioanal. Chem 2016, 408, (1), 23–33. [DOI] [PubMed] [Google Scholar]
- 24.Chalcraft KR; McCarry BE, Tandem LC columns for the simultaneous retention of polar and nonpolar molecules in comprehensive metabolomics analysis J. Sep. Sci 2013, 36, (21–22), 3478–3485. [DOI] [PubMed] [Google Scholar]
- 25.Ebshiana AA; Snowden SG; Thambisetty M; Parsons R; Hye A; Legido-Quigley C, Metabolomic Method: UPLC-q-ToF Polar and Non-Polar Metabolites in the Healthy Rat Cerebellum Using an In-Vial Dual Extraction. PloS one 2015, 10, (4), e0122883–e0122902. [DOI] [PMC free article] [PubMed] [Google Scholar]
- 26.Kirkwood JS; Maier C; Stevens JF, Simultaneous, untargeted metabolic profiling of polar and nonpolar metabolites by LC-Q-TOF mass spectrometry Curr. Protoc. Toxicol 2013, 56, (1), 4.39.1–4.39.12. [DOI] [PMC free article] [PubMed] [Google Scholar]
- 27.Hyötyläinen T; Orešič M, Optimizing the lipidomics workflow for clinical studies--practical considerations Anal. Bioanal. Chem 2015, 407, (17), 4973–4993. [DOI] [PubMed] [Google Scholar]
- 28.Grapov D; Fahrmann J; Hwang J; Poudel A; Jo J; Periwal V; Fiehn O; Hara M, Diabetes Associated Metabolomic Perturbations in NOD Mice. Metabolomics 2015, 11, (2), 425–437. [DOI] [PMC free article] [PubMed] [Google Scholar]
- 29.Sas KM; Karnovsky A; Michailidis G; Pennathur S, Metabolomics and Diabetes: Analytical and Computational Approaches. Diabetes 2015, 64, (3), 718–732. [DOI] [PMC free article] [PubMed] [Google Scholar]
- 30.Clee SM; Nadler ST; Attie AD, Genetic and genomic studies of the BTBR ob/ob mouse model of type 2 diabetes. Am. J. Ther 2005, 12, (6), 491–498. [DOI] [PubMed] [Google Scholar]
- 31.Kimple ME; Keller MP; Rabaglia MR; Pasker RL; Neuman JC; Truchan NA; Brar HK; Attie AD, Prostaglandin E2 Receptor, EP3, Is Induced in Diabetic Islets and Negatively Regulates Glucose- and Hormone-Stimulated Insulin Secretion. Diabetes 2013, 62, (6), 1904–1912. [DOI] [PMC free article] [PubMed] [Google Scholar]
- 32.Zheng Y; Ley SH; Hu FB, Global aetiology and epidemiology of type 2 diabetes mellitus and its complications. Nat. Rev. Endocrinol 2018, 14, (2), 88–98. [DOI] [PubMed] [Google Scholar]
- 33.Polson C; Sarkar P; Incledon B; Raguvaran V; Grant R, Optimization of protein precipitation based upon effectiveness of protein removal and ionization effect in liquid chromatography–tandem mass spectrometry. J. Chromatogr. B: Anal. Technol. Biomed. Life Sci 2003, 785, (2), 263–275. [DOI] [PubMed] [Google Scholar]
- 34.Kind T; Fiehn O, Seven Golden Rules for heuristic filtering of molecular formulas obtained by accurate mass spectrometry. BMC Bioinformatics 2007, 8, (1), 1–20. [DOI] [PMC free article] [PubMed] [Google Scholar]
- 35.Kessler N; Walter F; Persicke M; Albaum SP; Kalinowski J; Goesmann A; Niehaus K; Nattkemper TW, ALLocator: an interactive web platform for the analysis of metabolomic LC-ESI-MS datasets, enabling semi-automated, user-revised compound annotation and mass isotopomer ratio analysis. PloS one 2014, 9, (11), e113909–e113930. [DOI] [PMC free article] [PubMed] [Google Scholar]
- 36.Chong J; Soufan O; Li C; Caraus I; Li S; Bourque G; Wishart DS; Xia J, MetaboAnalyst 4.0: towards more transparent and integrative metabolomics analysis. Nucleic Acids Res. 2018, 46, (W1), W486–W494. [DOI] [PMC free article] [PubMed] [Google Scholar]
- 37.Sana TR; Roark JC; Li X; Waddell K; Fischer SM, Molecular formula and METLIN Personal Metabolite Database matching applied to the identification of compounds generated by LC/TOF-MS. J. Biomol. Tech 2008, 19, (4), 258–266. [PMC free article] [PubMed] [Google Scholar]
- 38.Boudah S; Olivier MF; Aros-Calt C; Oliveira L; Fenaille F; Tabet JC; Junot C, Annotation of the human serum metabolome by coupling three liquid chromatography methods to high-resolution mass spectrometry. J. Chromatogr. B: Anal. Technol. Biomed. Life Sci 2020, 966, 34–47. [DOI] [PubMed] [Google Scholar]
- 39.Brown M; Wedge DC; Goodacre R; Kell DB; Baker PN; Kenny LC; Mamas MA; Neyses L; Dunn WB, Automated workflows for accurate mass-based putative metabolite identification in LC/MS-derived metabolomic datasets. Bioinformatics 2011, 27, (8), 1108–1112. [DOI] [PMC free article] [PubMed] [Google Scholar]
- 40.Bobeldijk I; Hekman M; de Vries-van der Weij J; Coulier L; Ramaker R; Kleemann R; Kooistra T; Rubingh C; Freidig A; Verheij E, Quantitative profiling of bile acids in biofluids and tissues based on accurate mass high resolution LC-FT-MS: compound class targeting in a metabolomics workflow. J. Chromatogr. B: Anal. Technol. Biomed. Life Sci 2008, 871, (2), 306–313. [DOI] [PubMed] [Google Scholar]
- 41.Brügger B; Erben G; Sandhoff R; Wieland FT; Lehmann WD, Quantitative analysis of biological membrane lipids at the low picomole level by nano-electrospray ionization tandem mass spectrometry. Proc. Natl. Acad. Sci. U. S. A 1997, 94, (6), 2339–2344. [DOI] [PMC free article] [PubMed] [Google Scholar]
- 42.Shon JC; Shin HS; Seo YK; Yoon YR; Shin H; Liu KH, Direct infusion MS-based lipid profiling reveals the pharmacological effects of compound K-reinforced ginsenosides in high-fat diet induced obese mice. J. Agric. Food Chem 2015, 63, (11), 2919–2929. [DOI] [PubMed] [Google Scholar]
- 43.Hinz C; Liggi S; Griffin JL, The potential of Ion Mobility Mass Spectrometry for high-throughput and high-resolution lipidomics. Curr. Opin. Chem. Biol 2018, 42, 42–50. [DOI] [PubMed] [Google Scholar]
- 44.O’Kell AL; Garrett TJ; Wasserfall C; Atkinson MA, Untargeted metabolomic analysis in naturally occurring canine diabetes mellitus identifies similarities to human Type 1 Diabetes. Sci. Rep 2017, 7, (1), 9467–9473. [DOI] [PMC free article] [PubMed] [Google Scholar]
- 45.Smith CA; Maille GO; Want EJ; Qin C; Trauger SA; Brandon TR; Custodio DE; Abagyan R; Siuzdak G, METLIN: a metabolite mass spectral database. Ther. Drug Monit 2005, 27, (6), 747–751. [DOI] [PubMed] [Google Scholar]
- 46.Guijas C; Montenegro-Burke JR; Domingo-Almenara X; Palermo A; Warth B; Hermann G; Koellensperger G; Huan T; Uritboonthai W; Aisporna AE; Wolan DW; Spilker ME; Benton HP; Siuzdak G, METLIN: A Technology Platform for Identifying Knowns and Unknowns. Anal. Chem 2018, 90, (5), 3156–3164. [DOI] [PMC free article] [PubMed] [Google Scholar]
- 47.Feunang YD; Eisner R; Knox C; Chepelev L; Hastings J; Owen G; Fahy E; Steinbeck C; Subramanian S; Bolton E; Greiner R; Wishart DS, ClassyFire: automated chemical classification with a comprehensive, computable taxonomy. J. Cheminform 2016, 8, (1), 1–20. [DOI] [PMC free article] [PubMed] [Google Scholar]
- 48.Rochat B, Proposed Confidence Scale and ID Score in the Identification of Known-Unknown Compounds Using High Resolution MS Data. J. Am. Soc. Mass Spectrom 2017, 28, (4), 709–723. [DOI] [PubMed] [Google Scholar]
- 49.Schymanski EL; Jeon J; Gulde R; Fenner K; Ruff M; Singer HP; Hollender J, Identifying Small Molecules via High Resolution Mass Spectrometry: Communicating Confidence. Environ. Sci. Technol 2014, 48, (4), 2097–2098. [DOI] [PubMed] [Google Scholar]
- 50.Hou R; Panda C; Voruganti VS, Heterogeneity in Metabolic Responses to Dietary Fructose. Front. Genet 2019, 10, 945. [DOI] [PMC free article] [PubMed] [Google Scholar]
- 51.Ang BRG; Yu GF, The Role of Fructose in Type 2 Diabetes and Other Metabolic Diseases. J. Nutr. Food Sci 2020, 8, (1), 1–4. [Google Scholar]
- 52.Dunn WB; Hankemeier T, Mass spectrometry and metabolomics: past, present and future. Metabolomics 2013, 9, (1), 1–3. [Google Scholar]
- 53.Fave G; Beckmann M; Lloyd AJ; Zhou S; Harold G; Lin W; Tailliart K; Xie L; Draper J; Mathers JC, Development and validation of a standardized protocol to monitor human dietary exposure by metabolite fingerprinting of urine samples. Metabolomics 2011, 7, (4), 469–484. [DOI] [PMC free article] [PubMed] [Google Scholar]
- 54.Southam A; Payne T; Cooper H; Arvanitis T; Viant M, Dynamic Range and Mass Accuracy of Wide-Scan Direct Infusion Nanoelectrospray Fourier Transform Ion Cyclotron Resonance Mass Spectrometry-Based Metabolomics Increased by the Spectral Stitching Method. Anal. Chem 2007, 79, (12), 4595–4602. [DOI] [PubMed] [Google Scholar]
- 55.Xu F; Tavintharan S; Sum CF; Woon K; Lim SC; Ong CN, Metabolic Signature Shift in Type 2 Diabetes Mellitus Revealed by Mass Spectrometry-based Metabolomics. J. Clin. Endocrinol. Metab 2013, 98, (6), E1060–1065. [DOI] [PubMed] [Google Scholar]
- 56.Xiang J; Lv Q; Yi F; Song Y; Le L; Jiang B; Xu L; Xiao P, Dietary Supplementation of Vine Tea Ameliorates Glucose and Lipid Metabolic Disorder via Akt Signaling Pathway in Diabetic Rats. Molecules 2019, 24, (10), 1866–1887. [DOI] [PMC free article] [PubMed] [Google Scholar]
- 57.Fuhrer T; Zamboni N, High-throughput discovery metabolomics Curr. Opin. Biotechnol 2015, 31, 73–78. [DOI] [PubMed] [Google Scholar]
- 58.Puchalska P; Martin SE; Huang X; Lengfeld JE; Daniel B; Graham MJ; Han X; Nagy L; Patti GJ; Crawford PA, Hepatocyte-Macrophage Acetoacetate Shuttle Protects against Tissue Fibrosis. Cell Metab. 2019, 29, (2), 383–398. [DOI] [PMC free article] [PubMed] [Google Scholar]
- 59.Cajka T; Smilowitz JT; Fiehn O, Validating Quantitative Untargeted Lipidomics Across Nine Liquid Chromatography–High-Resolution Mass Spectrometry Platforms. Anal. Chem 2017, 89, (22), 12360–12368. [DOI] [PubMed] [Google Scholar]
- 60.Kler RS; Jackson S; Bartlett K; Bindoff LA; Eaton S; Pourfarzam M; Frerman FE; Goodman SI; Watmough NJ; Turnbull DM, Quantitation of acyl-CoA and acylcarnitine esters accumulated during abnormal mitochondrial fatty acid oxidation. J. Biol. Chem 1991, 266, (34), 22932–22938. [PubMed] [Google Scholar]
- 61.Tai ES; Tan MLS; Stevens RD; Low YL; Muehlbauer MJ; Goh DLM; Ilkayeva OR; Wenner BR; Bain JR; Lee JJM; Lim SC; Khoo CM; Shah SH; Newgard CB, Insulin resistance is associated with a metabolic profile of altered protein metabolism in Chinese and Asian-Indian men. Diabetologia 2010, 53, (4), 757–767. [DOI] [PMC free article] [PubMed] [Google Scholar]
- 62.Cortassa S; Caceres V; Tocchetti CG; Bernier M; de Cabo R; Paolocci N; Sollott SJ; Aon MA, Metabolic remodelling of glucose, fatty acid and redox pathways in the heart of type 2 diabetic mice. J. Physiol 2018, 598, (7), 1393–1415. [DOI] [PMC free article] [PubMed] [Google Scholar]
- 63.Suhre K; Meisinger C; Doring A; Altmaier E; Belcredi P; Gieger C; Chang D; Milburn MV; Gall WE; Weinberger KM; Mewes HW; Hrabe de Angelis M; Wichmann HE; Kronenberg F; Adamski J; Illig T, Metabolic Footprint of Diabetes: A Multiplatform Metabolomics Study in an Epidemiological Setting. PLoS One 2010, 5, (11), e13953–e13963. [DOI] [PMC free article] [PubMed] [Google Scholar]
- 64.Guasch-Ferre M; Hruby A; Toledo E; Clish CB; Martinez-Gonzalez MA; Salas-Salvado J; Hu FB, Metabolomics in Prediabetes and Diabetes: A Systematic Review and Meta-analysis. Diabetes Care 2016, 39, (5), 833–846. [DOI] [PMC free article] [PubMed] [Google Scholar]
- 65.Floegel A; Stefan N; Yu Z; Muhlenbruch K; Drogan D; Joost HG; Fritsche A; Haring HU; Hrabe de Angelis M; Peters A; Roden M; Prehn C; Wang-Sattler R; Illig T; Schulze MB; Adamski J; Boeing H; Pischon T, Identification of Serum Metabolites Associated with Risk of Type 2 Diabetes Using a Targeted Metabolomic Approach. Diabetes 2013, 62, (2), 639–648. [DOI] [PMC free article] [PubMed] [Google Scholar]
- 66.Ile KE; Schaaf G; Bankaitis VA, Phosphatidylinositol transfer proteins and cellular nanoreactors for lipid signaling. Nat. Chem. Biol 2006, 2, (11), 576–583. [DOI] [PubMed] [Google Scholar]
- 67.Bellezza I; Peirce MJ; Minelli A, Cyclic dipeptides: from bugs to brain. Trends Mol. Med 2014, 20, (10), 551–558. [DOI] [PubMed] [Google Scholar]
- 68.Vahdatpour T; Nokhodchi A; Zakeri-Milani P; Mesgari-Abbasi M; Ahmadi-Asl N; Valizadeh H, Leucine–glycine and carnosine dipeptides prevent diabetes induced by multiple low‐doses of streptozotocin in an experimental model of adult mice. J. Diabetes Investig 2019, 10, (5), 1177–1188. [DOI] [PMC free article] [PubMed] [Google Scholar]
Associated Data
This section collects any data citations, data availability statements, or supplementary materials included in this article.
Supplementary Materials
Figure S1. Data analysis workflow for feature detection and compound annotation.
Figure S2. Summarization of numbers of features or annotations.
Figure S3. Representative ultra-high resolution FTICR mass spectra.
Figure S4. Evaluation of reproducibility of FIE-FTICR MS with injection replicates.
Table S1. Significant metabolites in OBP and OBP-T2D groups.
Table S2. Significant metabolites in OBP-T2D and OBT-T2D groups.
Table S3. Comparison of compositions of Teklad and Purina diet.
Table S4. Merged mass list; mass lists in positive and negative ion modes; mass list for reproducibility experiments; all METLIN annotations; MS/MS mass list of 179.0563 m/z.