Abstract
Aims/Introduction
Sodium–glucose cotransporter 2 inhibitor (SGLT2i) lowers blood glucose and causes a whole‐body energy deficit by boosting renal glucose excretion, thus affecting glucose and energy metabolism. This energy deficit not only decreases bodyweight, but also increases food intake. This food intake increase offsets the SGLT2i‐induced bodyweight decrease, but the effect of the food intake increase on the SGLT2i regulation of glucose metabolism remains unclear.
Materials and Methods
We administered SGLT2i (luseogliflozin) for 4 weeks to hepatic gluconeogenic enzyme gene G6pc reporter mice with/without obesity, which were either fed freely or under a 3‐hourly dietary regimen. The effect of feeding condition on the gluconeogenic response to SGLT2i was evaluated by plasma Gaussia luciferase activity, an index of the hepatic gluconeogenic response, in G6pc reporter mice. Energy expenditure was measured by indirect calorimetry.
Results
In the lean mice under controlled feeding, SGLT2i decreased bodyweight and plasma glucose, and increased the hepatic gluconeogenic response while decreasing blood insulin. SGLT2i also increased oxygen consumption under controlled feeding. However, free feeding negated all of these effects of SGLT2i. In the obese mice, SGLT2i decreased bodyweight, blood glucose and plasma insulin, ameliorated the upregulated hepatic gluconeogenic response, and increased oxygen consumption under controlled feeding. Under free feeding, although blood glucose was decreased and plasma insulin tended to decrease, the effects of SGLT2i – decreased bodyweight, alleviation of the hepatic gluconeogenic response and increased oxygen consumption – were absent.
Conclusions
Food intake management is crucial for SGLT2i to affect glucose and energy metabolism during type 2 diabetes treatment.
Keywords: Energy expenditure, Gluconeogenesis, Sodium–glucose cotransporters
This study showed that increased food intake negates the regulatory effects of sodium–glucose cotransporter 2 inhibitor on glucose metabolism and hepatic gluconeogenesis. Food intake management is crucial for sodium–glucose cotransporter 2 inhibitor to affect glucose and energy metabolism in the treatment of type 2 diabetes.
Introduction
Hepatic glucose production plays an important role in the regulation of blood glucose in type 2 diabetes. Indeed, increased hepatic glucose production is highly correlated with elevated fasting blood glucose 1 . Because this increase in hepatic glucose production is caused by an increase in hepatic gluconeogenesis in type 2 diabetes 2 , hepatic gluconeogenesis is a target of antidiabetic drugs, such as metformin.
Another component of the therapeutic arsenal for type 2 diabetes is sodium–glucose cotransporter 2 inhibitor (SGLT2i), which promotes renal glucose excretion 3 , 4 , 5 . SGLT2i also improves glucose tolerance through its effect on hepatic gluconeogenesis. SGLT2i enhances the inhibitory effect of insulin on hepatic glucose production in both type 2 diabetes patients and obese/insulin‐resistant animals 6 , 7 , 8 , 9 . Our recent evaluation of the effect of SGLT2i on the hepatic gluconeogenic response in hepatic gluconeogenic enzyme gene reporter (L‐G6pc‐GLuc) mice also showed that SGLT2i alleviates the increase in the hepatic gluconeogenic response caused by obesity/insulin resistance 10 . These L‐G6pc‐GLuc mice express secreted Gaussia luciferase (GLuc) under the hepatic promoter of the gluconeogenic gene G6pc. In these animals, the hepatic gluconeogenic response, represented by the level of hepatic G6pc expression, can thus be evaluated by measuring plasma GLuc activity 10 . Two weeks of SGLT2i administration to insulin‐sensitive lean L‐G6pc‐GLuc mice under controlled feeding increases plasma GLuc activity. A high‐fat diet (HFD) markedly increases plasma GLuc activity together with obesity and insulin resistance in L‐G6pc‐GLuc mice; this elevated plasma GLuc activity is reduced after 3‐week treatment with SGLT2i.
The hepatic glucose production‐suppressing properties of SGLT2i are reportedly due to alleviation of insulin resistance 6 , 7 , 8 , 9 . SGLT2i not only improves glucose intolerance, but also induces weight loss, resulting in the alleviation of insulin resistance 11 . By stimulating renal glucose excretion, SGLT2i causes an energy deficit, resulting in bodyweight loss by decreasing adipose tissue weight 12 , 13 , 14 . However, this persistent negative energy balance and weight loss caused by SGLT2i induces compensatory hyperphagia 4 , 15 . In rats, food intake increases with the SGLT2i dose, and calorie intake increases by approximately 30% in approximately 1 month 16 . An increase in food intake was also observed in both SGLT2i‐administered mice and SGLT2‐deficient mice 9 , 17 . In a long‐term SGLT2i trial in type 2 diabetes patients, food intake increased after 12 weeks 18 . Increased food intake clearly cancels out the weight loss effects of SGLT2i 18 , but it is unclear whether this altered food intake also modifies the regulatory effects of SGLT2i on glucose metabolism and hepatic gluconeogenesis. Therefore, in the present study, lean and obese L‐G6pc‐GLuc mice were fed in accordance with a strict feeding protocol in which food was rationed every 3 h and the effects of food intake on the hepatic gluconeogenic response‐regulating properties of SGLT2i were investigated.
Methods
Mouse experiments
Mouse experiments were carried out in accordance with the Guide for the Care and Use of Laboratory Animals, eighth edition, and were approved by the Committee for Ethical Use of Experimental Animals at Kanazawa University, Kanazawa, Japan (approval nos. AP‐194033 and AP‐163742). L‐G6pc‐GLuc male mice were generated by crossing liver‐specific Cre recombinase‐expressing mice 19 , 20 and G6pc‐YFP/GLuc transgenic mice, which carry G6pc promoter and floxed yellow fluorescent protein followed by GLuc, as described previously 10 . Mice were housed in a temperature‐controlled environment under a 12‐h light/dark cycle with free access to normal chow (NC; CRF‐1; Oriental Yeast Co., Ltd., Kyoto, Japan) and water under specific pathogen‐free conditions. Obese mice were generated by feeding 7‐week‐old mice a HFD (60% fat; D12492; Research Diets, Inc., New Brunswick, NJ, USA) for 14–16 weeks. The macronutrient energy profile of the NC was protein : fat : carbohydrate = 24.5:13.6:61.9, and that of the HFD was protein : fat : carbohydrate = 17.9:60.7:21.4.
SGLT2i treatment with or without controlled feeding
Lean (10–12‐week‐old) and obese (21–23‐week‐old) mice were allowed free access to diets with or without SGLT2i for 4 weeks. The diets containing SGLT2i (luseogliflozin, 100 mg/kg diet; provided by Taisho Pharmaceutical Co., Ltd., Tokyo, Japan) were produced based on NC and a HFD (HFD‐60; Oriental Yeast Co., Ltd.) 21 , 22 . We used an automatic feeding device with a food intake monitoring system (cFDM‐300AS and Feedam V1.4.1; Melquest Ltd., Toyama, Japan) during a 1‐week acclimation period and 4‐week administration period. Under the controlled feeding condition, mice were fed a fixed amount of food with or without SGLT2i every 3 h for 4 weeks. The 3‐hourly feeding dosages 23 were determined according to the 5‐day average food consumption of 10‐week‐old NC‐fed or 21‐week‐old HFD‐fed mice without SGLT2i administration, which was measured by the food intake monitoring system. All mice ate a fixed amount of food every 3 h. Locomotor activity was measured by a passive infrared sensor in the cFDM‐300AS food intake monitoring system. Liver samples were harvested from fed mice at the end of the 4‐week administration of SGLT2i.
Food intake measurement
Both lean and obese mice were acclimated to feeding from a Multifeeder MF‐1M (Shinfactory, Fukuoka, Japan) 1 week before the initiation of the free feeding condition. Food intake was measured daily during the 4‐week experimental period.
Indirect calorimetry and respiratory measurements
After 4 weeks of free or controlled feeding, mice were housed individually in chambers of the Oxymax Comprehensive Lab Animal Monitoring System (Oxymax‐CLAMS; Columbus Instruments, Columbus, OH, USA). Oxygen consumption (VO2), carbon dioxide production (VCO2) and the respiratory exchange ratio (RER [VCO2/VO2]) were evaluated for two consecutive days. The rates of glucose oxidation, lipid oxidation and energy production were calculated from the following formulae: glucose oxidation rate (g/min) = 4.55 VCO2 (L/min) − 3.21 VO2 (L/min); lipid oxidation rate (g/min) = 1.67 (VO2 − VCO2); and energy production rate (kcal/min) = 3.91 VO2 + 1.10 VCO2 24 , 25 .
Blood and hepatic parameter analysis
Blood glucose levels were measured using a Glucocard G + Meter (Arkray, Kyoto, Japan). Plasma insulin concentrations were determined using a mouse insulin enzyme‐linked immunosorbent assay kit (Fujifilm Wako Pure Chemical Co., Osaka, Japan). Plasma glucagon concentrations were determined using a Mercodia Glucagon enzyme‐linked immunosorbent assay kit (Mercodia, Uppsala, Sweden). Plasma GLuc activity was quantified using a Renilla Luciferase Assay System (Promega, Madison, WI, USA). Plasma β‐hydroxybutyrate concentrations were measured using a β‐hydroxybutyrate Colorimetric Assay Kit (BioVision Inc., Milpitas, CA, USA). Plasma concentrations of free fatty acids were determined by NEFA C‐Test‐Wako kits (Fujifilm Wako Pure Chemical Co.). Hepatic triglyceride and glycogen contents were measured as described previously 10 , 26 .
Quantitative polymerase chain reaction
Ribonucleic acid extraction and complementary deoxyribonucleic acid synthesis were carried out as described previously 26 . Quantitative polymerase chain reaction was carried out with the SYBR Select Master Mix (Thermo Fisher Scientific, Waltham, MA, USA), and the results were normalized using the Rplp0 gene as internal control. The sequence‐specific primers used in the present study were described previously 10 , 27 , 28 and are available on request.
Immunoblotting
Immunoblotting was carried out using the following antibodies: anti‐phospho‐Akt (Thr308; #9275, 1:1,000), anti‐phospho‐Akt (Ser473; #9271, 1:1,000) and anti‐Akt (#9272, 1:1,000). Immunoblot images are representative of at least three independent immunoblot analyses and were quantified by densitometry on a ChemiDoc Touch imaging system (Bio‐Rad Laboratories, Hercules, CA, USA).
Insulin tolerance test
Insulin tolerance tests were carried out in obese L‐G6pc‐GLuc mice, which were administered a HFD without SGLT2i for 3 days as a wash‐out period after 4‐week administration of HFD with or without SGLT2i under the free feeding or controlled feeding condition. Mice were intravenously administered insulin (0.75 U/kg bodyweight; Humulin R insulin; Eli Lilly, Indianapolis, IN, USA) after a 4‐h fast.
Statistical analysis
Data are presented as the mean ± standard error of the mean. Statistical analysis was carried out using IBM SPSS Statistics 24 (IBM Japan, Tokyo, Japan). Group comparisons in time‐course data were examined using one‐way or two‐way repeated‐measures anova followed by Bonferroni’s multiple comparison test. Group comparisons were tested using Student’s t‐test or two‐way anova. Differences were considered statistically significant at P < 0.05.
Results
Glucose‐lowering effects of SGLT2i in lean mice
We measured food intake under free feeding in lean L‐G6pc‐GLuc mice with or without SGLT2i administration and found that SGLT2i administration significantly increased food intake (mean daily food intake during the administration period: 3.58 ± 0.05 g and 4.09 ± 0.16 g in control mice [n = 5] and SGLT2i‐administered mice [n = 6], respectively; Figure 1a). We then compared the effects of SGLT2i under controlled feeding and free feeding. Because the daily food intake was 3.20 g under controlled feeding in lean mice 23 , the given dose of SGLT2i under free feeding was approximately 128% of that under controlled feeding. As described previously 10 , under controlled feeding, SGLT2i significantly decreased bodyweight, blood glucose and plasma insulin levels (Figure 1b–d). However, under free feeding, SGLT2i had an insignificant effect on bodyweight, blood glucose levels and plasma insulin levels (Figure 1b–d). There were no differences in the plasma levels of glucagon, β‐hydroxybutyrate or free fatty acids between the control and SGLT2i groups under either the controlled and free feeding condition (Figure 1e,g).
Figure 1.
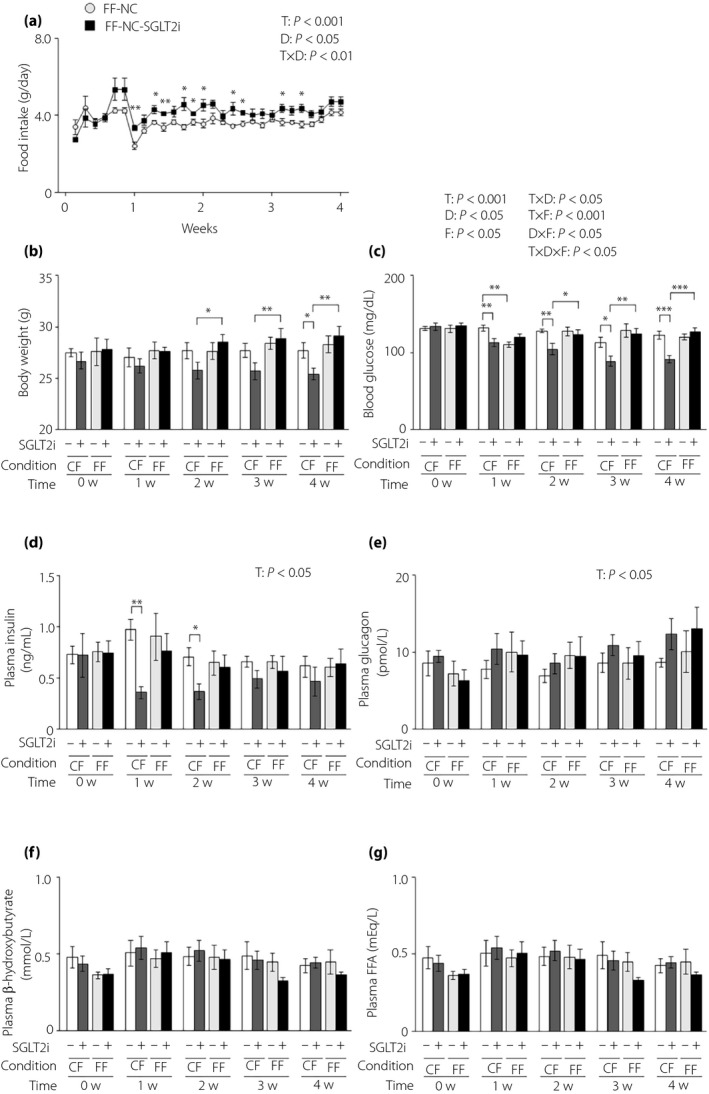
The glucose‐lowering effects of sodium–glucose cotransporter 2 inhibitor (SGLT2i) are attenuated in lean mice under free feeding conditions. (a) Food intake in lean hepatic gluconeogenic enzyme gene reporter (L‐G6pc‐GLuc) mice with normal chow (NC) with or without SGLT2i for 4 weeks under free feeding (FF). (b–g) L‐G6pc‐GLuc mice were administered NC with (+) or without (−) SGLT2i for 4 weeks under controlled feeding (CF) or FF. (b) Body weight. (c) Blood glucose levels. (d) Plasma insulin levels. (e) Plasma glucagon levels. (f) Plasma β‐hydroxybutyrate levels. (g) Plasma FFA levels. Values are the mean ± standard error of the mean (n = 5–6 mice/group). *P < 0.05, **P < 0.01 and ***P < 0.001. D, drug effect; D × F, drug and feeding condition interaction; F, feeding condition effect; T, time effect; T × D, time and drug interaction; T × F, time and feeding condition interaction; T × D × F, three‐way interaction.
Energy‐regulating effects of SGLT2i in lean mice
Because the weight‐decreasing effect of SGLT2i was diminished under free feeding, we measured energy expenditure, the increase of which results in energy deficit and bodyweight reduction 29 . Therefore, we measured VO2 and the RER in lean L‐G6pc‐GLuc mice under free or controlled feeding with or without SGLT2i administration. SGLT2i increased VO2 under controlled feeding in lean mice, but not under free feeding (Figure 2a). No differences were found in the RER, glucose oxidation rate or lipid oxidation rate between the control and SGLT2i groups under either feeding condition (Figure 2b,c). SGLT2i administration increased the rate of energy production in the dark phase under controlled feeding (Figure 2c). SGLT2i had no effect on locomotor activity under controlled feeding (Figure 2d).
Figure 2.
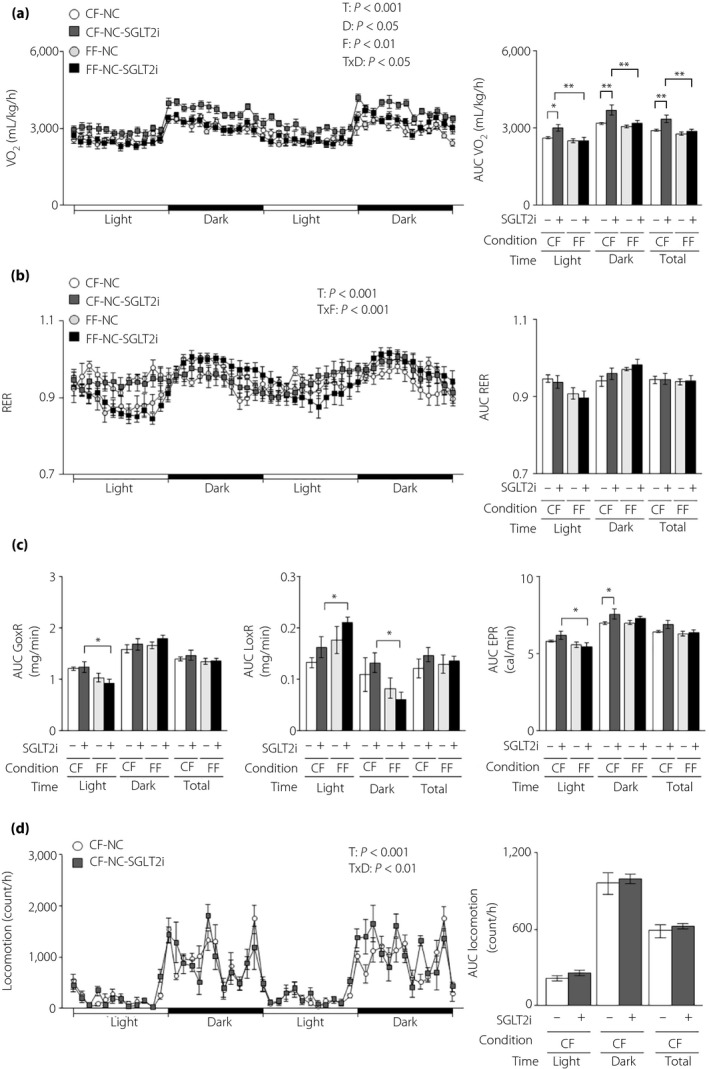
The energy‐regulating effects of sodium–glucose cotransporter 2 inhibitor (SGLT2i) are diminished in lean mice under free feeding conditions. Hepatic gluconeogenic enzyme gene reporter (L‐G6pc‐GLuc) mice were administered normal chow (NC) with (+) or without (−) SGLT2i for 4 weeks under controlled feeding (CF) or free feeding (FF). (a) Oxygen consumption rate (VO2; left) and its areas under the curve (AUC; right). (b) Respiratory exchange ratio (RER; left) and its AUCs (right). (c) AUCs of the glucose oxidation rate (GoxR; left), lipid oxidation rate (LoxR; middle) and energy production rate (EPR; right). (d) Locomotor activities (left) and their AUCs (right). Values are the mean ± standard error of the mean (n = 5–6 mice/group). *P < 0.05 and **P < 0.01. D, drug effect; F, feeding condition effect; T, time effect; T × D, time and drug interaction; T × F, time and feeding condition interaction.
SGLT2i effects on the hepatic gluconeogenic response in lean mice
Feeding condition had a potent influence on the ability of SGLT2i to lower blood glucose and insulin, as well as energy expenditure. Thus, we investigated its influence on the effect of SGLT2i on hepatic glucose and lipid metabolism. We measured plasma GLuc activity, an index of the hepatic gluconeogenic response, and found that SGLT2i increased plasma GLuc activity until 2 weeks after SGLT2i administration, while decreasing plasma insulin, under controlled feeding (Figure 3a). SGLT2i also decreased hepatic glycogen and triglyceride levels at 4 weeks after administration under controlled feeding (Figure 3b,c). However, SGLT2i produced an insignificant change in plasma GLuc activity and hepatic levels of glycogen and triglyceride under free feeding (Figure 3a–c). We also measured the hepatic expression of genes associated with glucose metabolism, lipid metabolism and pro‐inflammatory cytokines at 4 weeks after administration. Among these genes, hepatic Pck1 and G6pc expressions showed an increasing tendency in the SGLT2i‐administered group under controlled feeding, but not under free feeding (Figure 3d). SGLT2i administration upregulated hepatic Akt phosphorylation under controlled feeding, but induced only an insignificant marginal increase in the phosphorylation of Thr‐308 of Akt under free feeding (Figure 3e).
Figure 3.
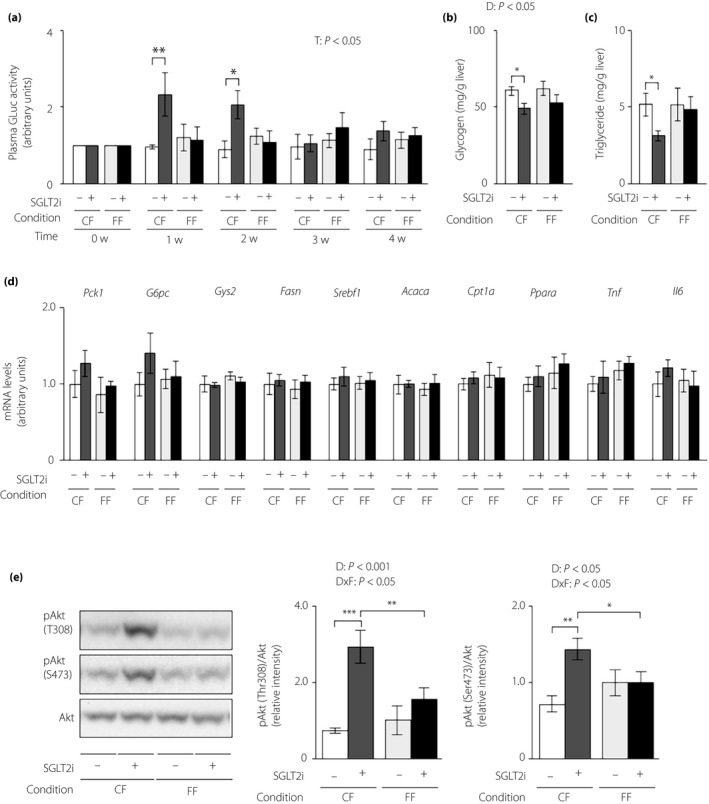
The hepatic gluconeogenic response increase induced by sodium–glucose cotransporter 2 inhibitor (SGLT2i) is attenuated in lean mice under free feeding conditions. Hepatic gluconeogenic enzyme gene reporter (L‐G6pc‐GLuc) mice were administered normal chow (NC) with (+) or without (−) SGLT2i for 4 weeks under controlled feeding (CF) or free feeding (FF). (a) Plasma GLuc activities. (b) Hepatic glycogen contents. (c) Hepatic triglyceride contents. (d) Hepatic messenger ribonucleic acid (mRNA) expression levels of genes related to glucose metabolism (Pck1, G6pc, Gys2), lipid metabolism (Fasn, Srebf1, Acaca, Cpt1a, Ppara) and inflammation (Tnf, Il6). (e) Immunoblotting analysis of phosphorylated Akt (pAkt) and total Akt protein (left). pAkt levels were normalized to total Akt levels (middle and right). Values are the mean ± standard error of the mean (n = 5–6 mice/group). *P < 0.05, **P < 0.01 and ***P < 0.001. T, time effect; D, drug effect; D × F, drug and feeding condition interaction.
Glucose‐lowering and energy‐regulating effects of SGLT2i in obese mice
Next, we investigated the gluco‐regulating effects of SGLT2i in HFD‐induced obese mice, which had mild glucose intolerance and an overt increase in plasma GLuc activity with marked obesity 23 . We measured food intake in obese L‐G6pc‐GLuc mice under free `feeding with or without SGLT2i administration. SGLT2i also increased food intake in obese mice from 1 week after the start of administration (mean daily food intake during the administration period: 3.00 ± 0.08 g and 3.39 ± 0.13 g in control mice [n = 7] and SGLT2i‐administered mice [n = 7], respectively; Figure 4a). Because the daily food intake was 2.80 g under controlled feeding in obese mice 23 , the given dose of SGLT2i under free feeding was approximately 121% of that under controlled feeding. Bodyweight decreased significantly under controlled feeding in obese mice, but remained unaltered by SGLT2i administration under free feeding (Figure 4b). Blood glucose levels were decreased by SGLT2i administration under both controlled and free feeding conditions (Figure 4c). SGLT2i administration significantly decreased plasma insulin levels under controlled feeding, and showed an insignificant tendency to decrease plasma insulin under free feeding (Figure 4d). Plasma levels of glucagon, β‐hydroxybutyrate and free fatty acids remained unaltered by SGLT2i under either feeding condition (Figure 4e–g).
Figure 4.
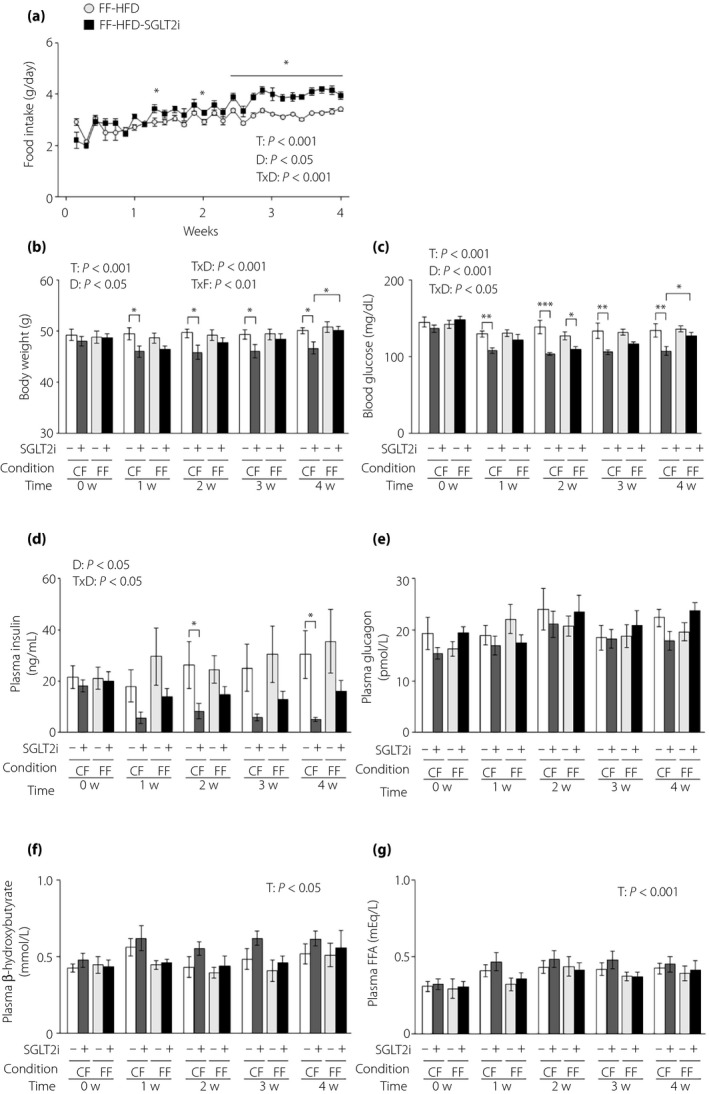
The glucose‐lowering effects of sodium–glucose cotransporter 2 inhibitor (SGLT2i) are attenuated in obese mice under free feeding conditions. (a) Food intake in obese hepatic gluconeogenic enzyme gene reporter (L‐G6pc‐GLuc) mice fed a high‐fat diet (HFD) with or without SGLT2i for 4 weeks under free feeding (FF). (b–e) Obese L‐G6pc‐GLuc mice were administered a HFD with (+) or without (−) SGLT2i for 4 weeks under controlled feeding (CF) or FF. (b) Body weight. (c) Blood glucose levels. (d) Plasma insulin levels. (e) Plasma glucagon levels. (f) Plasma β‐hydroxybutyrate levels. (g) Plasma FFA levels. Values are the mean ± standard error of the mean (n = 7 mice/group). *P < 0.05, **P < 0.01 and ***P < 0.001. D, drug effect; T, time effect; T × D, time and drug interaction; T × F, time and feeding condition interaction.
SGLT2i increased VO2 in controlled feeding obese mice, but not in free feeding obese mice (Figure 5a). SGLT2i resulted in no change in the RER under controlled feeding, but decreased the RER under free feeding (Figure 5b). SGLT2i administration decreased the glucose oxidation rate and increased the lipid oxidation rate only under free feeding (Figure 5c). There was no difference in the energy production rate between the control and SGLT2i groups (Figure 5c). SGLT2i had no effect on locomotor activity under either feeding condition (Figure 5d).
Figure 5.
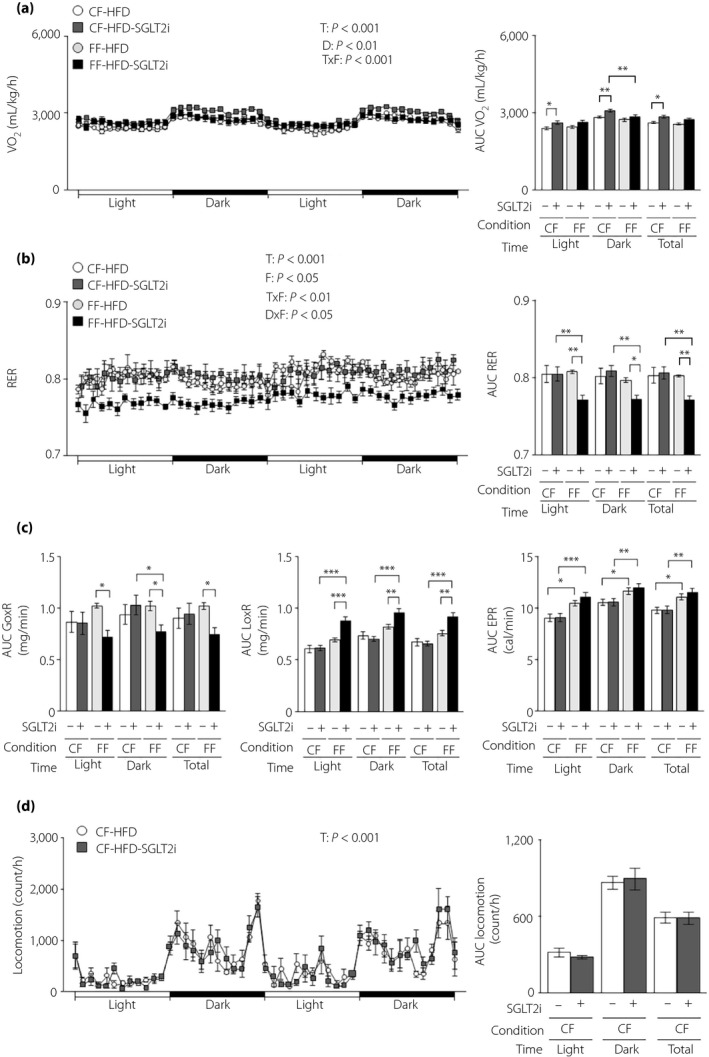
The energy‐regulating effect of sodium–glucose cotransporter 2 inhibitor (SGLT2i) is diminished in obese mice under free feeding conditions. Obese hepatic gluconeogenic enzyme gene reporter (L‐G6pc‐GLuc) mice were administered a high‐fat diet (HFD) with (+) or without (−) SGLT2i for 4 weeks under controlled feeding (CF) or free feeding (FF). (a) Oxygen consumption rate (VO2; left) and its areas under the curve (AUCs; right). (b) Respiratory exchange ratio (RER; left) and its AUCs (right). (c) AUCs of the glucose oxidation rate (GoxR; left), lipid oxidation rate (LoxR; middle) and energy production rate (EPR; right). (d) Locomotor activities (left) and its AUC (right). Values are the mean ± standard error of the mean (n = 7 mice/group). *P < 0.05, **P < 0.01 and ***P < 0.001. D, drug effect; D × F, drug and feeding condition interaction; F, feeding condition effect; T, time effect; T × F, time and feeding condition interaction.
SGLT2i effects on the hepatic gluconeogenic response in obese mice
Finally, we evaluated the effects of SGLT2i on hepatic parameters of glucose and lipid metabolism under both feeding conditions in obese L‐G6pc‐GLuc mice. Under controlled feeding, SGLT2i decreased plasma GLuc activity from 3 weeks after inhibitor initiation, and also decreased hepatic levels of triglycerides, but not glycogen, at 4 weeks after administration (Figure 6a–c). However, under free feeding, there was no difference in plasma GLuc activity, hepatic glycogen and hepatic triglycerides between control and SGLT2i treatment in obese mice (Figure 6a–c). Hepatic expression of G6pc and the lipogenic enzymes, Fasn and Acaca, decreased in the SGLT2i‐administered group under controlled feeding, but not under free feeding (Figure 6d). There was no difference in the hepatic expression of the other genes, including Tnf and Il6, between the control and SGLT2i groups under either feeding condition (Figure 6d). Hepatic Akt phosphorylation at Thr308 was increased in SGLT2i‐administered obese mice under controlled feeding, but not under free feeding (Figure 6e). Finally, we investigated whole‐body insulin sensitivity with insulin tolerance tests in obese L‐G6pc‐GLuc mice with or without SGLT2i administration under controlled feeding or free feeding. SGLT2i enhanced the insulin‐dependent blood glucose decrease under controlled feeding, but not free feeding (Figure 6f).
Figure 6.
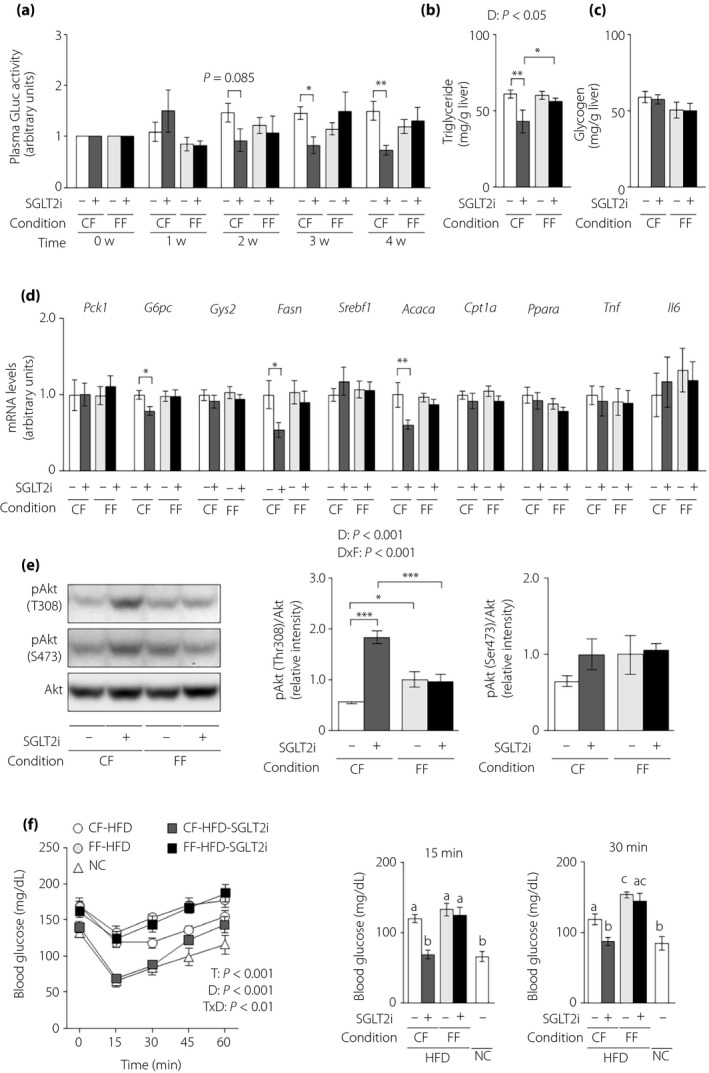
The effects of sodium–glucose cotransporter 2 inhibitor (SGLT2i) on the hepatic gluconeogenic response and steatosis are diminished in obese mice under free feeding conditions. Obese hepatic gluconeogenic enzyme gene reporter (L‐G6pc‐GLuc) mice were administered a high‐fat diet (HFD) with (+) or without (−) SGLT2i for 4 weeks under controlled feeding (CF) or free feeding (FF). (a) Plasma GLuc activities. (b) Hepatic triglyceride contents. (c) Hepatic glycogen contents. (d) Hepatic messenger ribonucleic acid (mRNA) expression levels of genes related to glucose metabolism (Pck1, G6pc, Gys2), lipid metabolism (Fasn, Srebf1, Acaca, Cpt1a, Ppara) and inflammation (Tnf, Il6). (e) Immunoblotting analysis of phosphorylated Akt (pAkt) and total Akt protein (left). pAkt levels were normalized to total Akt levels (middle and right). (f) Blood glucose levels during insulin tolerance tests (left), at 15 min (middle) and at 30 min (right). Values are the mean ± standard error of the mean (n = 7 mice/group). *P < 0.05, **P < 0.01 and ***P < 0.001. D, drug effect; D × F, drug and feeding condition interaction; T, time effect; T × D, time and drug interaction.
Discussion
SGLT2i plays a prominent role in the treatment of obese type 2 diabetes patients because of its blood glucose‐lowering and weight loss‐inducing effects, which are due to increased renal glucose excretion 30 . At the same time, the sustained negative energy balance caused by SGLT2i increases food intake 9 , 17 , 18 , which undermines the weight loss‐inducing properties of the drug 18 . It has been suggested that the effects of SGLT2i on glucose metabolism might also be altered by the increased food intake. Indeed, the plasma insulin‐reducing effect of SGLT2i is lower in rats without controlled feeding 16 . However, it was unclear how increased food intake influences the effect of SGLT2i on glucose metabolism regulation, particularly that of hepatic gluconeogenesis, which is closely linked to the blood glucose level. We thus compared the glucose metabolism‐regulating effects of SGLT2i under controlled and free feeding conditions, and found that feeding condition has a significant impact on the effects of SGLT2i. As we have previously reported 10 , SGLT2i decreased bodyweight and blood glucose in lean mice under controlled feeding, and the hepatic gluconeogenic response (i.e., blood GLuc activity) increased with the decrease in plasma insulin. These SGLT2i effects were absent in mice under free feeding. Bodyweight, blood glucose, insulin level and the hepatic gluconeogenic response are all decreased under controlled feeding in obese mice 10 . However, under free feeding, the weight loss‐ and hepatic gluconeogenic response‐alleviating effects of SGLT2i disappeared, even though the blood glucose level still decreased and the insulin level trended downward.
In the lean mice, which possess insulin sensitivity, SGLT2i enhances the hepatic gluconeogenic response by reducing the plasma insulin level under controlled feeding, as described previously 10 . However, under free feeding, the hepatic gluconeogenic response was unaffected by SGLT2i, because SGLT2i had little influence on plasma insulin levels. SGLT2i was associated with a decreasing tendency of plasma insulin levels under controlled feeding, which was statistically significant until 2 weeks after the start of administration. Partly because controlled feeding itself showed a non‐significant tendency for a decrease in plasma insulin levels in the control group of lean mice, as reported previously 10 , this significant decrease in plasma insulin was lost after 3 weeks. Although plasma insulin showed an increasing tendency in mice with SGLT2i administration after 1 week, this increase was not evident in a previous study carried out using the same regimen 10 . Under controlled feeding, SGLT2i increased the hepatic gluconeogenic response while decreasing plasma insulin. The difference in the hepatic gluconeogenic response between the SGLT2i and control groups disappeared after 3 weeks under controlled feeding. One reason for its disappearance might be that enhanced insulin sensitivity compensated for the reduction in hepatic insulin action induced by a plasma insulin decrease. Indeed, SGLT2i increased hepatic Akt phosphorylation despite the tendency for decreased plasma insulin, suggesting that SGLT2i would enhance insulin sensitivity even in lean mice. Although there was no difference in plasma glucagon levels between the groups, it seems likely that some other factor, such as the sympathetic nervous system, was also involved in neutralizing the effect of SGLT2i on hepatic gluconeogenesis.
In obesity and type 2 diabetes, SGLT2i decreases blood glucose levels by not only increasing renal glucose excretion, but also ameliorating insulin resistance. Indeed, SGLT2i enhances the suppressive effects of hepatic glucose production on insulin 6 , 7 , 8 , 9 . The present results also showed that hepatic Akt phosphorylation was increased and that the increased hepatic gluconeogenesis response 23 was alleviated in insulin‐resistant obese mice under controlled feeding after 2‐week treatment with SGLT2i, despite the lower plasma insulin level. However, SGLT2i failed to induce hepatic Akt phosphorylation or ameliorate the exacerbated hepatic gluconeogenic response in the obese mice under free feeding. This suggests that the effect of SGLT2i on the hepatic gluconeogenic response was lost under free feeding because of insufficient amelioration of hepatic insulin resistance.
The ability of SGLT2i to improve hepatic insulin resistance is considered to be due to the suppression of hepatic triglyceride accumulation and hepatic inflammation, the loss of bodyweight, and the relief of glucose toxicity 11 . The suppression of hepatic triglyceride accumulation could be related to the effects of SGLT2i on hepatic insulin resistance in these HFD‐induced obese mice. Indeed, SGLT2i administration resulted in enhanced insulin sensitivity (i.e., a lowered gluconeogenic response and increased Akt phosphorylation), and decreased hepatic lipogenic gene expressions and triglyceride levels under controlled feeding. However, free feeding negated all of these effects of SGLT2i.
In the present study, it took 2–3 weeks for SGLT2i to show the alleviation of an increased hepatic gluconeogenic response under controlled feeding. The effects of SGLT2i might require this long duration in order to reduce hepatic triglyceride levels and enhance hepatic insulin sensitivity. Indeed, 1‐week SGLT2i administration to the rat is reported to alleviate insulin resistance in muscle, but to have an insignificant effect on triglyceride levels and insulin sensitivity in the liver 31 . SGLT2i is reported to reduce hepatic inflammation, which results in hepatic insulin resistance. Indeed, Xu et al. 32 reported that 16‐week administration of SGLT2i decreased the hepatic expression of pro‐inflammatory cytokines. However, 4‐week SGLT2i administration had little impact on the hepatic expression of pro‐inflammatory cytokine genes in obese mice in the present study.
SGLT2i decreased bodyweight under controlled feeding, but not under free feeding. This SGLT2i‐induced bodyweight loss might also have caused the amelioration in insulin sensitivity. Several articles have shown that much of the weight loss induced by SGLT2i is caused by the loss of adipose tissue 12 , 13 , 14 . An adipose tissue expansion results in an increase in pro‐inflammatory cytokines, which induce hepatic insulin resistance 33 , 34 . Given that Obata et al. 17 showed that 8‐week SGLT2i administration decreased the adipose gene expression of pro‐inflammatory cytokines, SGLT2i administration might have caused the attenuation of adipose inflammation in the present study.
In contrast, the contribution of the glucose toxicity‐alleviating component to the ameliorating effects of SGLT2i on hepatic insulin resistance was limited in these high‐fat models, which only show mild hyperglycemia 29 . Indeed, in these obese mice, SGLT2i lowered blood glucose levels, even under free feeding, but there was no clear amelioration of the hepatic insulin resistance or the increased hepatic gluconeogenic response. Similar levels of hyperglycemia to the HFD models in the present study were shown by 90% partial pancreatectomy rats, which are not obese 35 , 36 . Skeletal muscle and adipose tissue insulin resistance is ameliorated in these animals with pancreatectomy when glucose toxicity is alleviated by the SGLT inhibitor phlorizin, but their hepatic insulin resistance is not 35 , 36 . However, phlorizin improves hepatic insulin resistance in Zucker diabetic fatty rats, which show a postprandial blood glucose level of nearly 500 mg/dL 37 . Advanced glucose intolerance models are thus required to evaluate the hepatic glucose toxicity‐ameliorating properties of SGLT2i.
SGLT2i decreased the bodyweight of mice under controlled feeding, regardless of the presence of obesity. This effect was lost under free feeding, which shows that the negative energy balance caused by SGLT2i is offset by the increased food intake under free feeding. SGLT2i results in a negative energy balance by increasing energy consumption, as well as by increasing renal glucose excretion. Indeed, SGLT2i increased the oxygen consumption per bodyweight under controlled feeding in both lean and obese mice, although there was no difference in the oxygen consumption per body between the SGLT2i‐administered group and the control, even under controlled feeding. SGLT2i is reported to result in a shift in fuel utilization toward fat in type 2 diabetes patients 38 . The RER and glucose oxidation decreased, whereas lipid oxidation showed a tendency to increase under free feeding in obese mice, but not under controlled feeding. Daniele et al. 39 reported that 2‐week SGLT2i administration to type 2 diabetes patients resulted in similar phenotypic changes to these free feeding mice. Given that less insulin action induces greater utilization of lipid 40 , the SGLT2i‐induced decrease in plasma insulin can reduce muscular and hepatic insulin action, and increase lipid oxidation in insulin‐resistant mice under free feeding, but not in insulin‐sensitive mice under controlled feeding.
In conclusion, SGLT2i alters the bodyweight, blood glucose, plasma insulin, energy consumption and hepatic gluconeogenic response, but these effects are all lost under free feeding in lean mice. In obese mice, SGLT2i decreases bodyweight and the hepatic gluconeogenic response, and increases energy consumption under controlled feeding. However, although blood glucose was decreased and plasma insulin tended to decrease, free feeding diminishes these effects of SGLT2i. The present findings directly show the influence of diet intake control on the effects of SGLT2i. Considering the importance of increased hepatic gluconeogenesis and decreased energy consumption in obese type 2 diabetes, diet intake control is indispensable during SGLT2i treatment of type 2 diabetes.
Disclosure
EH, HW, KK and MM declare no conflict of interest. YI and HI received luseogliflozin and grant support from Taisho Pharmaceutical Co., Ltd.
Acknowledgments
We thank K Nagamori and C Asahi (Kanazawa University) for providing technical assistance, and ThinkSCIENCE (Tokyo, Japan) for help with the preparation of the manuscript. This work was supported by the Japan Society for the Promotion of Science KAKENHI (grant numbers 18KT0020, 20H04943 and 20H04102 to HI, and 15H05678 and 19K09192 to YI), and by a research grant from Taisho Pharmaceutical Co., Ltd. to HI. The funding sources had no role in the study design, in the collection, analysis or interpretation of data, in the writing of the report, or in the decision to publish.
J Diabetes Investig 2021; 12: 35–47
References
- 1. Defronzo RA. Banting Lecture. From the triumvirate to the ominous octet: a new paradigm for the treatment of type 2 diabetes mellitus. Diabetes 2009; 58: 773–795. [DOI] [PMC free article] [PubMed] [Google Scholar]
- 2. Magnusson I, Rothman DL, Katz LD, et al Increased rate of gluconeogenesis in type II diabetes mellitus. A 13C nuclear magnetic resonance study. J Clin Invest 1992; 90: 1323–1327. [DOI] [PMC free article] [PubMed] [Google Scholar]
- 3. DeFronzo RA, Norton L, Abdul‐Ghani M. Renal, metabolic and cardiovascular considerations of SGLT2 inhibition. Nat Rev Nephrol 2017; 13: 11–26. [DOI] [PubMed] [Google Scholar]
- 4. Rajeev SP, Cuthbertson DJ, Wilding JP. Energy balance and metabolic changes with sodium‐glucose co‐transporter 2 inhibition. Diabetes Obes Metab 2016; 18: 125–134. [DOI] [PubMed] [Google Scholar]
- 5. Ferrannini E, Solini A. SGLT2 inhibition in diabetes mellitus: rationale and clinical prospects. Nat Rev Endocrinol 2012; 8: 495–502. [DOI] [PubMed] [Google Scholar]
- 6. Merovci A, Solis‐Herrera C, Daniele G, et al Dapagliflozin improves muscle insulin sensitivity but enhances endogenous glucose production. J Clin Invest 2014; 124: 509–514. [DOI] [PMC free article] [PubMed] [Google Scholar]
- 7. Kim JK, Zisman A, Fillmore JJ, et al Glucose toxicity and the development of diabetes in mice with muscle‐specific inactivation of GLUT4. J Clin Invest 2001; 108: 153–160. [DOI] [PMC free article] [PubMed] [Google Scholar]
- 8. Han S, Hagan DL, Taylor JR, et al Dapagliflozin, a selective SGLT2 inhibitor, improves glucose homeostasis in normal and diabetic rats. Diabetes 2008; 57: 1723–1729. [DOI] [PubMed] [Google Scholar]
- 9. Jurczak MJ, Lee HY, Birkenfeld AL, et al SGLT2 deletion improves glucose homeostasis and preserves pancreatic beta‐cell function. Diabetes 2011; 60: 890–898. [DOI] [PMC free article] [PubMed] [Google Scholar]
- 10. Inaba Y, Hashiuchi E, Watanabe H, et al Hepatic gluconeogenic response to single and long‐term SGLT2 inhibition in lean/obese male hepatic G6pc‐reporter mice. Endocrinology 2019; 160: 2811–2824. [DOI] [PubMed] [Google Scholar]
- 11. Vallon V, Thomson SC. Targeting renal glucose reabsorption to treat hyperglycaemia: the pleiotropic effects of SGLT2 inhibition. Diabetologia 2017; 60: 215–225. [DOI] [PMC free article] [PubMed] [Google Scholar]
- 12. Bolinder J, Ljunggren O, Kullberg J, et al Effects of dapagliflozin on body weight, total fat mass, and regional adipose tissue distribution in patients with type 2 diabetes mellitus with inadequate glycemic control on metformin. J Clin Endocrinol Metab 2012; 97: 1020–1031. [DOI] [PubMed] [Google Scholar]
- 13. Sasaki T, Sugawara M, Fukuda M. Sodium‐glucose cotransporter 2 inhibitor‐induced changes in body composition and simultaneous changes in metabolic profile: 52‐week prospective LIGHT (Luseogliflozin: the Components of Weight Loss in Japanese Patients with Type 2 Diabetes Mellitus) Study. J Diabetes Investig 2019; 10: 108–117. [DOI] [PMC free article] [PubMed] [Google Scholar]
- 14. Yokono M, Takasu T, Hayashizaki Y, et al SGLT2 selective inhibitor ipragliflozin reduces body fat mass by increasing fatty acid oxidation in high‐fat diet‐induced obese rats. Eur J Pharmacol 2014; 727: 66–74. [DOI] [PubMed] [Google Scholar]
- 15. Brown E, Wilding JPH, Barber TM, et al Weight loss variability with SGLT2 inhibitors and GLP‐1 receptor agonists in type 2 diabetes mellitus and obesity: mechanistic possibilities. Obes Rev 2019; 20: 816–828. [DOI] [PubMed] [Google Scholar]
- 16. Devenny JJ, Godonis HE, Harvey SJ, et al Weight loss induced by chronic dapagliflozin treatment is attenuated by compensatory hyperphagia in diet‐induced obese (DIO) rats. Obesity (Silver Spring) 2012; 20: 1645–1652. [DOI] [PubMed] [Google Scholar]
- 17. Obata A, Kubota N, Kubota T, et al Tofogliflozin improves insulin resistance in skeletal muscle and accelerates lipolysis in adipose tissue in male mice. Endocrinology 2016; 157: 1029–1042. [DOI] [PubMed] [Google Scholar]
- 18. Ferrannini G, Hach T, Crowe S, et al Energy balance after sodium‐glucose cotransporter 2 inhibition. Diabetes Care 2015; 38: 1730–1735. [DOI] [PMC free article] [PubMed] [Google Scholar]
- 19. Inoue H, Ogawa W, Ozaki M, et al Role of STAT‐3 in regulation of hepatic gluconeogenic genes and carbohydrate metabolism in vivo. Nat Med 2004; 10: 168–174. [DOI] [PubMed] [Google Scholar]
- 20. Yakar S, Liu JL, Stannard B, et al Normal growth and development in the absence of hepatic insulin‐like growth factor I. Proc Natl Acad Sci USA 1999; 96: 7324–7329. [DOI] [PMC free article] [PubMed] [Google Scholar]
- 21. Kimura T, Obata A, Shimoda M, et al Protective effects of the SGLT2 inhibitor luseogliflozin on pancreatic beta‐cells in db/db mice: The earlier and longer, the better. Diabetes Obes Metab 2018; 20: 2442–2457. [DOI] [PubMed] [Google Scholar]
- 22. Takahashi K, Nakamura A, Miyoshi H, et al Effect of the sodium‐glucose cotransporter 2 inhibitor luseogliflozin on pancreatic beta cell mass in db/db mice of different ages. Sci Rep 2018; 8: 6864. [DOI] [PMC free article] [PubMed] [Google Scholar]
- 23. Hashiuchi E, Watanabe H, Kimura K, et al Dietary restriction is indispensable for the gluco‐regulating effects of SGLT2 inhibition in male mice [Data file]. Figshare; 2019. Available from: https://figshare.com/s/3776cee71bfeff955eb5 Accessed November 1, 2019.
- 24. Ferrannini E. The theoretical bases of indirect calorimetry: a review. Metabolism 1988; 37: 287–301. [DOI] [PubMed] [Google Scholar]
- 25. Even PC, Nadkarni NA. Indirect calorimetry in laboratory mice and rats: principles, practical considerations, interpretation and perspectives. Am J Physiol Regul Integr Comp Physiol 2012; 303: R459–R476. [DOI] [PubMed] [Google Scholar]
- 26. Inaba Y, Furutani T, Kimura K, et al Growth arrest and DNA damage‐inducible 34 regulates liver regeneration in hepatic steatosis in mice. Hepatology 2015; 61: 1343–1356. [DOI] [PubMed] [Google Scholar]
- 27. Watanabe H, Inaba Y, Kimura K, et al Dietary mung bean protein reduces hepatic steatosis, fibrosis, and inflammation in male mice with diet‐induced, nonalcoholic fatty liver disease. J Nutr 2017; 147: 52–60. [DOI] [PubMed] [Google Scholar]
- 28. Kimura K, Inaba Y, Watanabe H, et al Nicotinic alpha‐7 acetylcholine receptor deficiency exacerbates hepatic inflammation and fibrosis in a mouse model of non‐alcoholic steatohepatitis. J Diabetes Investig 2019; 10: 659–666. [DOI] [PMC free article] [PubMed] [Google Scholar]
- 29. Bluher M. Obesity: global epidemiology and pathogenesis. Nat Rev Endocrinol 2019; 15: 288–298. [DOI] [PubMed] [Google Scholar]
- 30. Davies MJ, D’Alessio DA, Fradkin J, et al Management of hyperglycaemia in type 2 diabetes, 2018. A consensus report by the American Diabetes Association (ADA) and the European Association for the Study of Diabetes (EASD). Diabetologia 2018; 61: 2461–2498. [DOI] [PubMed] [Google Scholar]
- 31. O’Brien TP, Jenkins EC, Estes SK, et al Correcting postprandial hyperglycemia in Zucker diabetic fatty rats with an SGLT2 inhibitor restores glucose effectiveness in the liver and reduces insulin resistance in skeletal muscle. Diabetes 2017; 66: 1172–1184. [DOI] [PMC free article] [PubMed] [Google Scholar]
- 32. Xu L, Nagata N, Nagashimada M, et al SGLT2 inhibition by empagliflozin promotes fat utilization and browning and attenuates inflammation and insulin resistance by polarizing M2 macrophages in diet‐induced obese mice. EBioMedicine 2017; 20: 137–149. [DOI] [PMC free article] [PubMed] [Google Scholar]
- 33. Reilly SM, Saltiel AR. Adapting to obesity with adipose tissue inflammation. Nat Rev Endocrinol 2017; 13: 633–643. [DOI] [PubMed] [Google Scholar]
- 34. Bonnet F, Scheen AJ. Effects of SGLT2 inhibitors on systemic and tissue low‐grade inflammation: the potential contribution to diabetes complications and cardiovascular disease. Diabetes Metab 2018; 44: 457–464. [DOI] [PubMed] [Google Scholar]
- 35. Rossetti L, Smith D, Shulman GI, et al Correction of hyperglycemia with phlorizin normalizes tissue sensitivity to insulin in diabetic rats. J Clin Invest 1987; 79: 1510–1515. [DOI] [PMC free article] [PubMed] [Google Scholar]
- 36. Kahn BB, Shulman GI, DeFronzo RA, et al Normalization of blood glucose in diabetic rats with phlorizin treatment reverses insulin‐resistant glucose transport in adipose cells without restoring glucose transporter gene expression. J Clin Invest 1991; 87: 561–570. [DOI] [PMC free article] [PubMed] [Google Scholar]
- 37. Fujimoto Y, Torres TP, Donahue EP, et al Glucose toxicity is responsible for the development of impaired regulation of endogenous glucose production and hepatic glucokinase in Zucker diabetic fatty rats. Diabetes 2006; 55: 2479–2490. [DOI] [PubMed] [Google Scholar]
- 38. Ferrannini E, Baldi S, Frascerra S, et al Shift to fatty substrate utilization in response to sodium‐glucose cotransporter 2 inhibition in subjects without diabetes and patients with type 2 diabetes. Diabetes 2016; 65: 1190–1195. [DOI] [PubMed] [Google Scholar]
- 39. Daniele G, Xiong J, Solis‐Herrera C, et al Dapagliflozin enhances fat oxidation and ketone production in patients with type 2 diabetes. Diabetes Care 2016; 39: 2036–2041. [DOI] [PMC free article] [PubMed] [Google Scholar]
- 40. Rynders CA, Blanc S, DeJong N, et al Sedentary behaviour is a key determinant of metabolic inflexibility. J Physiol 2018; 596: 1319–1330. [DOI] [PMC free article] [PubMed] [Google Scholar]


