

Abstract
Objective
Increasing adaptive thermogenesis by stimulating browning in white adipose tissue is a promising method of improving metabolic health. However, the molecular mechanisms underlying this transition remain elusive. Our study examined the molecular determinants driving the differentiation of precursor cells into thermogenic adipocytes.
Methods
In this study, we conducted temporal high-resolution proteomic analysis of subcutaneous white adipose tissue (scWAT) after cold exposure in mice. This was followed by loss- and gain-of-function experiments using siRNA-mediated knockdown and CRISPRa-mediated induction of gene expression, respectively, to evaluate the function of the transcriptional regulator Y box-binding protein 1 (YBX1) during adipogenesis of brown pre-adipocytes and mesenchymal stem cells. Transcriptomic analysis of mesenchymal stem cells following induction of endogenous Ybx1 expression was conducted to elucidate transcriptomic events controlled by YBX1 during adipogenesis.
Results
Our proteomics analysis uncovered 509 proteins differentially regulated by cold in a time-dependent manner. Overall, 44 transcriptional regulators were acutely upregulated following cold exposure, among which included the cold-shock domain containing protein YBX1, peaking after 24 h. Cold-induced upregulation of YBX1 also occurred in brown adipose tissue, but not in visceral white adipose tissue, suggesting a role of YBX1 in thermogenesis. This role was confirmed by Ybx1 knockdown in brown and brite preadipocytes, which significantly impaired their thermogenic potential. Conversely, inducing Ybx1 expression in mesenchymal stem cells during adipogenesis promoted browning concurrent with an increased expression of thermogenic markers and enhanced mitochondrial respiration. At a molecular level, our transcriptomic analysis showed that YBX1 regulates a subset of genes, including the histone H3K9 demethylase Jmjd1c, to promote thermogenic adipocyte differentiation.
Conclusion
Our study mapped the dynamic proteomic changes of murine scWAT during browning and identified YBX1 as a novel factor coordinating the genomic mechanisms by which preadipocytes commit to brite/beige lineage.
Keywords: Brite/beige adipose tissue, Adipocyte, Browning, Temporal proteomic, YBX1, Transcriptional regulation
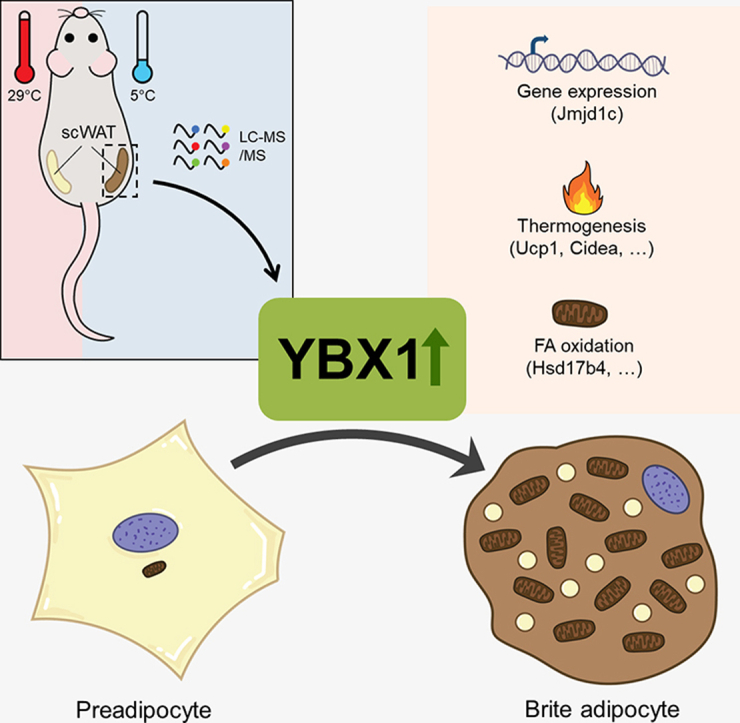
Graphical abstract
Highlights
-
•
Dynamic proteome remodeling occurs in mouse subcutaneous white fat with cold.
-
•
YBX1 acutely increases in response to cold in thermogenic adipose tissues.
-
•
YBX1 is required for the optimal implementation of the early thermogenic program.
-
•
YBX1 promotes metabolic and thermogenic programs and enhances mitochondrial respiration.
1. Introduction
Activating the high-thermogenic capacity of brown adipose tissue (BAT) constitutes a therapeutic opportunity to combat obesity and related metabolic disorders [[1], [2], [3]]. Increased thermogenesis in BAT has the potential to consume excess energy due to its high abundance of mitochondria and the presence of uncoupling protein 1 (UCP1), which uncouples oxidative phosphorylation from ATP production to produce heat [4]. Since the abundance of BAT varies in humans [3,5] and its activity is lower in obesity or diabetes [6,7], other thermogenic adipose tissues such as brite (brown in white) or beige adipose depots (hereafter, brite), which account for a substantial portion of heat production, represent a promising alternative to increase thermogenesis. While brown adipocytes are present in discrete locations (BAT depots) and have a predisposed thermogenic phenotype for heat production in response to various stimuli, brite adipocytes arise in white adipose tissue (WAT) depots upon cold exposure, endurance exercise, microbiota depletion, Roux-en-Y gastric bypass weight-loss surgery, or calorie restriction in a process called “browning” of WAT [[8], [9], [10], [11], [12], [13]]. As increased thermogenic activity of adipose tissues correlates with better metabolic health in rodents and humans [[14], [15], [16]], inducing the formation of brite adipocytes in WAT may efficiently improve WAT function and metabolic health, notably in individuals with obesity.
A number of transcriptional regulators including PRDM16, PPARGC1A, ZFP516, and several others coordinate a thermogenic adipocyte gene expression program that ultimately results in increased thermogenic capacity [[17], [18], [19]]. Adipocyte-specific gene expression programs involved in the development and thermogenic function of brown and brite adipocytes are orchestrated by an adipose-selective chromatin landscape that involves several unique epigenetic regulators such as LSD1, HDAC1, EHMT1, and histone H3 lysine 9 (H3K9) demethylase JMJD1A [[20], [21], [22], [23]]. Although brown and brite fat share common features and similar processes for terminal activation, important characteristics distinguish the biology of these depots [24,25]. Classical brown adipocytes are generated during development in specific BAT depots whereas brite adipocytes arise postnatally in WAT depots. Formation of brite adipocytes is adaptive and plastic and appears to result from de novo differentiation and activation of pre-existing dormant thermogenic adipocytes, which acquired the properties of white energy-storing adipocytes upon stimulus cessation [[26], [27], [28], [29], [30]]. However, the mechanisms unlocking the formation of thermogenic adipocytes in WAT are not completely understood.
In this study, using a label-based proteomic approach, we investigated the mechanisms facilitating the formation of new brite adipocytes in WAT depots during physiological adaptation to cold temperatures. Among proteins acutely upregulated upon cold induction, we identified the multifunctional DNA/RNA binding protein Y-box binding protein 1 (YBX1) as a key player in brite adipogenesis. YBX1 is a “cold-shock domain” containing protein involved in transcriptional regulation, pre-mRNA splicing, mRNA translation and stability, chromatin remodeling, DNA repair, and environmental stress responses [31]. Interestingly, YBX1 forms a complex with the multifunctional Ewing sarcoma (EWS) protein in BAT preadipocytes and 3T3-L1 cell lines upon adipogenic stimulation to promote differentiation into mature adipocytes [32,33]. However, the potential role of YBX1 in controlling the browning of WAT has not been characterized. Using loss- and gain-of-function approaches for YBX1 in cells, we demonstrate a critical role of Ybx1 in priming and maintaining thermogenic capacity during adipogenesis.
2. Materials and methods
2.1. Cold exposure studies in mice
All of the animal studies were conducted with approved protocols from the Danish Animal Experiments Inspectorate (permit numbers 2014-15-0201-00181 and 2015-15-0201-00728) and the University of Copenhagen (project numbers P14-379, P16-010, and P16-021). Male wild-type C57Bl/6NRj mice (Janvier) were used for cold exposure studies. Prior to the experimental procedures, the mice were group housed and acclimatized to our housing unit on a 12:12 h light/dark cycle (lights on at 6:00 and off at 18:00) with ad libitum access to chow food (1310, Altromin) and water. For cold exposure experiments, 12- to 16-week-old mice were individually housed and placed in climate-controlled rodent incubators (HPP750Life, Memmert) at 29 °C to acclimate to thermoneutrality for three weeks. Experimental groups were then moved to an incubator set to 5 °C and kept for 3, 8, 24 h, 1, and 3 weeks until dissection (n = 5 was used per time point). The mice were euthanized by neck dislocation; scWAT, BAT, and vWAT were collected at dissection and immediately snap frozen in liquid nitrogen, fixed in 4% formalin for histology (see the method section on immunohistochemistry), or digested to obtain the stroma-vascular fraction (SVF) and mature adipocyte fraction (MAF) of scWAT (see the Methods section on digestion of the whole scWAT for isolation of SVF and MAF).
2.2. Proteomics
2.2.1. Tissue processing
For proteomic analysis, scWAT depots were washed in cold PBS containing protease inhibitors (Promega, Madison, WI, USA) and PhosStop phosphatase inhibitors (Roche, Madison, WI, USA). Tissues were mechanically homogenized 4–5 times (30 s, 30 cycles/s) at 4 °C in denaturing buffer containing 1% N-octyl glucoside, 7 M of urea, and 2 M of thiourea in 20 mM of HEPES (pH 7.9). The homogenized tissues were incubated at 4 °C for 15 min and centrifuged (16,000 g, 30 min, and 4 °C). The lipid layer was removed, and protein concentrations were measured using a Pierce 660 nm (Thermo Fisher Scientific) protein assay in a plate reader.
2.2.2. Protein reduction and alkylation
Protein lysates were reduced by DTT (10 mM final) in 50 mM of triethyl ammonium bicarbonate (TEAB) and incubated for 30 min at room temperature (RT). The lysates were alkylated using iodoacetamide (20 mM final in 50 mM of TEAB) with 30 min of incubation in the dark at RT.
2.2.3. Protein digestion
Protein lysates were digested for 4 h with endoproteinase Lys-C (1:100 w/w) (Waco, Tokyo, Japan) at RT. The samples were then diluted 10 times with 20 mM of HEPES (pH 7.9) to obtain <1 M of urea and thiourea concentrations for effective digestion efficiency with trypsin (pH adjusted to 7.5–8.0). Trypsin (Promega, Madison, WI, USA) was added to the samples at a 1:50 ratio, and the samples were incubated by rotating overnight at 37 °C. The samples were acidified with 0.1% trifluoroacetic acid (TFA) and insoluble material (lipids), pelleted by centrifugation at 14,000×g for 5 min, and discarded. Peptides were purified using Sep-Pak C18 Classic Cartridge (WAT051910, Waters) before tandem mass tag (TMT) labeling. Briefly, the Sep-Pak columns were washed with 80% acetonitrile (ACN) + 0.1% TFA (4 mL). The columns were then equilibrated twice with 0.1% TFA (12 mL). The acidified peptide solutions were passed through the columns, and the columns were washed using 0.1% TFA (12 mL). Peptides were eluted from the columns first using 50% ACN +0.1% TFA and a second time with 80% ACN +0.1% TFA. A total of 100 μg of purified tryptic peptides derived from each sample (the 6 experimental time points) were used for labeling with 6-plex TMT reagents. Tryptic peptides were lyophilized and resuspended in 100 μL of 100 mM TEAB.
2.2.4. Isobaric labeling the peptides
Isobaric labeling the peptides was performed using 6-plex TMT reagents (Thermo Fisher Scientific) as previously described [34]. Briefly, the 6 different tags were used for the 6 corresponding time points: 0 h (126), 3 h (127), 8 h (128), 24 h (129), 1 w (130), and 3 w (131). Five biological replicates were labeled at each time point. The peptides labeled with different TMT isobaric tags (the 6 time points) were combined into equimolar amounts. The labeled peptides were then acidified using formic acid (FA) (pH ≤ 2.5) and desalted by passing through Poros Oligo R3 RP microcolumns. The peptides were washed on the Poros Oligo R3 RP microcolumns using 0.1% TFA. The samples were then eluted from the columns in two elution steps: the first elution step using 100 μL of 50% ACN and 0.1% TFA and the second elution using 100 μL of 70% ACN and 0.1% TFA. The purified eluates were vacuum dried prior to LC-MS/MS.
2.2.5. HILIC fractionation
Preparative chromatographic separation was performed on an Agilent 1200 capillary HPLC system using an in-house packed TSKgel Amide-80 HILIC 320 μm × 170 mm capillary HPLC column. The lyophilized peptides were resuspended in 90% v/v ACN and 0.1% v/v TFA to achieve a final concentration of 1.5 μg/μL. Forty microliters of each sample corresponding to 60 μg of peptides were loaded onto the column. The peptides were eluted using a gradient from 90% v/v ACN, 0.1% v/v TFA to 60% v/v ACN, and 0.1% v/v TFA over 52 min at a flow rate of 6 μL/min. The fractions were automatically collected in a microwell plate at 1-min intervals after UV detection at 210 nm. The fractions were pooled according to the UV detection into a total of 7 fractions, dried by vacuum centrifugation, and subsequently stored at −20 °C.
2.2.6. Nanoflow liquid chromatography-mass spectrometry (nLC-MS/MS) analysis
The peptides (resuspended in 0.1% FA) were automatically injected and loaded onto a ReproSil-Pur C18 AQ (Dr. Maisch, Ammerbuch-Entringen, Germany) in-house packed trap column (2 cm × 100 μm inner diameter; 5 μm) and separated on an analytical ReproSil-Pur C18 AQ (Dr. Maisch) packed in-house column (17 cm × 75 μm; 3 μm) by reverse-phase chromatography on an EASY-nanoLC system (Thermo Fisher Scientific). The peptides were eluted with an organic solvent gradient from 100% phase A (0.1% FA) to 40% phase B (0.1% FA, 95% ACN) using 135 min gradients via nanoelectrospray. A Q Exactive Plus Hybrid Quadrupole-Orbitrap mass spectrometer (Thermo Fisher Scientific) was operated in the positive ion mode with data-dependent acquisition. The Orbitrap acquired full MS scans with an automatic gain control (AGC) target value of 1 × 10 e6 ions and a maximum fill time of 120 ms. Each MS scan was acquired with high-resolution 70,000 full width at half maximum (FWHM) at m/z 200 in the Orbitrap with a mass range of 300–1200 Da. The 12 most abundant peptide ions were selected from the MS for higher energy collision-induced dissociation (HCD) MS2 fragmentation (normalized collision energy: 31 V) in the Orbitrap. Fragmentation was performed at a high resolution (17,500 FWHM) for a target of 2 × 10 e4 and a maximum injection time of 150 ms using an isolation window of 1.5 m/z and a dynamic exclusion duration of 15 s with a 10 ppm tolerance around the selected precursor. Only those precursors with charged states +2, +3, and +4 were sampled for MS2, and a fixed first mass of 110 was used. Raw data were viewed in Xcalibur v2.0.7 (Thermo Fisher Scientific), and submitted to the Chorus database (http://chorusproject.org) as project no. 1505.
2.2.7. Database searching and statistical and bioinformatic analysis
The LC-MS/MS data were processed with Proteome Discoverer (V2.0, Thermo Fisher Scientific) and subjected to database searching using an in-house Mascot server (V2.2.04, Matrix Science, London, UK). All of the peak lists were searched against mouse UniProt V2013-05 using the following parameters: enzyme, trypsin; maximum missed cleavage, 2; fixed modification, carbamidomethylating (C); and variable modification, oxidation (M), acetyl (protein N-terminus), and TMT (protein N-terminus and K). The MS and MS/MS results were searched with a precursor mass tolerance at 10 ppm and a MS/MS mass tolerance at 0.05 Da. The results were filtered in Proteome Discoverer with the integrated Percolator algorithm [35] to ensure a false discovery rate (FDR) < 0.01. Only peptides identified with high confidence, first rank, and Mascot scores higher than 20 were used. Reporter quantifier was included in the Proteome Discoverer workflow and no minimum threshold was defined for up/downregulation between TMT tag ratios. Protein grouping was applied. The spectrum selector feature of Proteome Discoverer was used employing precursor masses of 350–5000 Da. Peptides with different amino acid sequences or modifications were considered unique. The quantitative data generated were further filtered by removing the data with missing channels, redundant data, and non-unique peptides shared by multiple proteins. Then data were then subjected to statistical analysis. The quantification was conducted at the protein level. TMT-based quantification was performed using the first label (reporter ion 126) as a denominator (reporter ion 126 was used for the control sample with no cold exposure). The protein ratios’ log2 values were normalized by the average of the distribution of the values for each sample. Significance was assessed by performing two-way ANOVA analysis and taking 0.03 as a significant p value threshold. Significantly regulated proteins were imported in Perseus [36] and clustering analysis was performed with the fuzzy c-means algorithm developed by Schwämmle et al., [37].
2.3. Immunoblotting
Frozen tissues were homogenized using steel bead homogenization (Tissue Lyser II, Qiagen) in ice-cold lysis buffer (150 mM of NaCl, 50 mM of HEPES pH 7.5, 10% glycerol, 20 mM of Na-pyrophosphate, 1% IGEPAL CA-630, 20 mM of β-glycerophosphate, 10 mM of NaF, 1 mM of EDTA pH 8.0, 2 mM of Na3VO4, and Sigma Fast Protease Inhibitor Tablets). Cells were washed once with PBS and lysed in lysis buffer (50 mM of HEPES, 150 mM of NaCl, 10 mM of EDTA, 10 mM of Na4P2O7, 100 mM of NaF, 1% Triton X-100, 2 mM of orthovanadate, and 1% protease inhibitor), followed by centrifugation for 10 min at 12,000 rpm. Protein concentrations were determined using BCA assays (Thermo Fisher Scientific). Lysate was denatured by adding 20% sample buffer (0.35 M of Tris HCL, 30% glycerol, 10% SDS, 603 mM of DTT, and 150 μM of bromophenol blue), followed by heating at 95 °C for 5 min. Equal amounts of cleared lysates were separated using SDS-PAGE and transferred to polyvinylidene difluoride (PVDF) membranes (Millipore, Søborg, Denmark). Non-specific binding sites were blocked by preincubating the membranes in 5% BSA in Tris-buffered saline with Tween 20 (TBS-T). The membranes were incubated with primary antibodies (1:1000) overnight at 4 °C. After washing, HRP-conjugated secondary antibodies were applied for 1 h (1:2000). Blots were washed, incubated in enhanced chemiluminescence reagents (Bio-Rad), and analyzed with Chemidoc XRS (Bio-Rad). Antibodies used for detection included YBX1 (#A303-231A, Bethyl Laboratories), AKT (#9272, Cell Signaling Technology), Vinculin (#13901S, Cell Signaling Technology), and UCP1 (ab10983, Abcam) for cell lysates.
2.4. Immunohistochemistry
The scWAT depots were collected from 6 male wild-type C57Bl/6NRj mice (Janvier) housed at thermoneutrality (29 °C) or exposed to cold (4 °C) for 24 h after 3 weeks of acclimation (29 °C) as previously described. Tissues were fixed in 4% formalin and embedded in paraffin for histological evaluation. Slices were deparaffinized, rehydrated according to standard procedures, and stained with hematoxylin-eosin (HE) or YBX1 antibody (fluorescence). For immunofluorescence staining, slides were treated at 98 °C for 20 min in Tris-EDTA buffer (10 mM of Tris-Base, 1 mM of EDTA, 0.05% Tween20, and pH to 9.0). The sections were then permeabilized and blocked for 1 h with NGS buffer (1.5% goat serum, 3% BSA, 0.3% Triton-X, and 0.05% sodium azide slides). The slides were then incubated overnight at 4 °C with anti-YBX1 antibody (#A303-231A, 1:1000, Bethyl Laboratories), followed by 45 min of incubation at RT with secondary antibody Alexa Fluor 568 (1:500, Life Technologies). The slides were then mounted using ProLong Gold Antifade mounting media with DAPI stain (Thermo Fisher Scientific). Brightfield and fluorescence images were obtained with a Zeiss Axio Scan.Z1 using a 20x/0.8 objective and LED excitations at 365 nm (DAPI), 470 nm (autofluorescence), and 555 nm (Alexa Fluor 568).
2.5. Digestion of whole scWAT to isolate SVF and MAF
Individual mouse adipose depots were carefully excised and thoroughly minced with scissors (1–2 mm pieces) using sterile techniques. The minced adipose tissue was digested in 1 mg/mL of collagenase A (Clostridium histolyticum, #C6885, Sigma-Aldrich) in DMEM containing 1% bovine serum albumin (BSA) for 30 min in a shaking water bath at 37 °C using 5 mL of digestion buffer per scWAT depot. Then 10% FBS was added to stop the collagenase digestion. Floating adipocytes were separated from the SVF by centrifugation at 800×g for 5 min. The floating mature adipocyte fraction (MAF) was collected, the supernatant was removed, and the SVF pellet was resuspended in 1 mL of ACK buffer (Thermo Fisher Scientific) and incubated for 5 min at RT in the dark. Then 10 mL of PBS was added to the suspension and the SVF was pelleted by centrifugation at 300×g for 5 min at 4 °C. MAF and SVF were lysed in RLT buffer (1:100 β-Me) on ice for RNA isolation.
2.6. Cell cultures
BAT WT-1 cells (kindly provided by C.R. Kahn [38]) and C3H/10T1/2-CRISPRa-SAM [39] cells were maintained in high-glucose DMEM with 10% fetal bovine serum (FBS), 1% penicillin, and streptomycin. Brown WT-1 preadipocytes were propagated until they reached 80% confluency (day −2), and the complete medium (10% serum media high-glucose DMEM) was switched to induction medium (complete medium including 20 nM of insulin and 1 nM of T3). Two days later when the cells reached confluency (day 0), the induction medium was changed to differentiation medium (complete medium including 20 nM of insulin, 1 nM of T3, 0.125 mM of indomethacin, 5 μM of dexamethasone, and 50 mM of IBMX). On day 2 (d2) after induction of differentiation, the differentiation medium was replaced with induction medium and refreshed on day 4 (d4) of differentiation. On day 6 (d6) after induction of differentiation, fully differentiated brown adipocytes were observed. For an siRNA knockdown experiment in C3H/10T1/2-CRISPRa-SAM cells, the cells were pretreated for 4 days with recombinant BMP4 [40] (20 ng/ml in 0.1% BSA and 4 mM of HCl) with 1% glutamine in the media. One day post-confluency, the cells were induced to differentiate with 5 μM of dexamethasone, 500 of μM indomethacin, 0.85 μM of insulin, and 1 μM of rosiglitazone for two days, followed by 0.85 μM of insulin and 1 μM of rosiglitazone for two more days. Differentiated cells were kept in media containing high-glucose DMEM, 12% FBS, 1% penicillin and streptomycin, 1% extra glutamine, 1% non-essential amino acids, and 1% sodium pyruvate for two more days.
2.7. Loss of function in WT-1 cells and C3H/10T1/2-CRISPRa-SAM with siRNA
SiRNA knockdown was performed by forward-transfection in WT-1 cells at days −2, 0, or 2 in 6-well plates and C3H/10T1/2-CRISPRa-SAM cells on day 0 in 12-well plates. Lipofectamine RNAiMAX (#13778100, Thermo Fisher Scientific) and siRNAs (SMARTpool ON-TARGETplus Ybx1 targeting siRNA #L-048134-00-0005 or ON-TARGETplus non-targeting pool #D-001810-10-05) were pre-incubated for 25 min before being added to the cells. The total siRNA concentration and duration of transfection were held constant (50 nM and 48 h) regardless of the transfection day. WT-1 cells were collected for gene expression analysis by qPCR on days −2, 0, 2, 4, and 6 or for protein expression analysis by Western blotting on days 2, 4, and 6. C3H/10T1/2-CRISPRa-SAM cells were collected for gene expression analysis by qPCR and protein expression analysis by Western blotting on days 2, 4, and 6. On day 6, the cells were treated with either norepinephrine (NE, 10 μM in PBS) or control (PBS) for 6 h prior to harvest.
2.8. Gain of function in preadipocytes via CRISPRa-SAM
Murine mesenchymal C3H/10T1/2 cells stably expressing the CRISPRa-SAM complex were used for gain-of-function experiments following our established protocol [39]. Briefly, the CRISPRa-SAM components (dCas9-VP64 and MS2-P65-HSF1) were delivered in lentiviruses by plasmid co-transfection in C3H/10T1/2 cells. The resulting cell line (C3H/10T1/2-CRISPRa-SAM) was used to activate endogenous genes via chemical transfection with a single guide RNA (gRNA) containing plasmids. The C3H/10T1/2-CRISPRa-SAM cells were maintained in high-glucose DMEM media containing FBS (10%), penicillin streptomycin (1%), blasticidin (2.5 μg/mL), and hygromycin (200 μg/mL) to ensure a retained dCas9-SAM expression. gRNA sequences targeting Ybx1 and Pparg2 promoter regions were designed using the SAM genome engineering online tool (https://zlab.bio/guide-design-resources), annealed, and ligated into the backbone vector following the original protocol [41]. Correct insertion was verified by sequencing plasmids (Genewiz, Essex, UK). Sequences used were Ybx1 (NM_011732) GCCTCCGCCGCCATAGAGAC and Pparg2 (NM_011146), GAATAAACACAGAAAGAATC. Cell transfections were performed as previously described [39]. Briefly, for gene expression analysis (qPCR) and RNA sequencing, 300,000 cells were seeded per well in a 12-well plate (day −3) and transfected at confluence (day −2) using a total of 250 ng of plasmid DNA (conditions: EV, Pparg2 targeting gRNA, Ybx1 targeting gRNA, Pparg2 + Ybx1 and targeting gRNA) and Mirus TransIT-X2 transfection reagent (3 μl per well, Kem-En-Tec, Taastrup, Denmark). Two days after transfection, all of the cells received rosiglitazone (5 μM, day 0) to promote adipogenesis; the media were then changed every 2 days with basal media. For bidirectional expression studies, 250 ng of DNA was combined with 50 nM of siRNAs. MISSION siRNAs (Sigma-Aldrich) targeting Jmjd1c (SASI_Mm02_00433501) were used for these transfections. For Seahorse experiments, 2,000 cells were seeded per well in a XF96 Seahorse plate. The next day, the cells were transfected with 50 ng of gRNA per well (25 ng of Pparg2 targeting gRNA and 25 ng EV/25 ng Ybx1 targeting gRNA) using 0.25 μl of TransIT-X2 reagent per well. Two days after transfection at confluency, the cells were given rosiglitazone (5 μM) to induce differentiation. On days 2 and 4, the cells were given only basal media, and on day 6, the oxygen consumption was measured.
2.9. RNA isolation and quantitative PCR
Cells were lysed in RLT buffer (β-Me, 1:100) on ice; RNAs were isolated using RNeasy spin columns (Qiagen). For tissue RNA isolation, scWAT depots were collected from 9 male wild-type C57Bl/6NRj mice (Janvier) housed at thermoneutrality (29 °C) or exposed to cold (4 °C) for 3 or 7 days after 3 weeks of acclimation (29 °C) as previously described. RNA was extracted from scWAT using an RNeasy Lipid Tissue Mini kit (Qiagen). cDNA was synthesized from 1 μg of RNA using an iScript kit (Bio-Rad) according to the manufacturer's instructions. Real-time PCR was performed using Brilliant III Ultrafast SYBR Green qPCR Master Mix (AH Diagnostics) in a CFX384 Real-Time Bio-Rad System according to the supplier's manual. Raw CT data were normalized to the 18s reference gene following the ΔΔ-CT calculation. PCR primer sequences were synthesized by Tag Copenhagen (Copenhagen, Denmark) and are listed in Table S7.
2.10. Proliferation assay
C3H/10T1/2-CRISPRa-SAM cells were seeded in 96-well plates and transfected either to 40% or 90–95% confluence (day −2) with Pparg2 targeting gRNA + empty vector or Pparg2 + Ybx1 targeting gRNAs as previously described. After 48 h (day 0), cell proliferation in the two different conditions was assessed by MTT assays (#11 465 007 001, Roche) following the kit's procedure.
2.11. Mitochondrial DNA quantification
C3H/10T1/2-CRISPRa-SAM cells were seeded in 12-well plates and transfected at confluency (day −2) with Pparg2 targeting gRNA + empty vector (EV) or Pparg2 + Ybx1 targeting gRNAs as previously described. Two days after transfection, the cells were treated with 5 μM of rosiglitazone (day 0). The media were then changed every 2 days with basal media. On day 6, mature cells were harvested, and total DNA was extracted using the standard phenol-chloroform separation method. The relative mitochondrial DNA content was assessed by measuring the mitochondrial gene CoxII (Mt-Co2) normalized to genomic DNA Rip140 (Nrip1) via qPCR. Primers used for qPCR are shown in Table S7.
2.12. Mitochondrial respiration
Real-time measurements of oxygen consumption rates (OCR) were performed using a Seahorse XF96 Extracellular Flux Analyzer (Agilent Technologies). For ISO-induced assays, the cell culture medium was changed 1 h before the first measurement to XF assay medium-modified DMEM (Agilent Technologies) supplemented with 5 mM of glucose and 2 mM of l-glutamine and adjusted to pH 7.4. The OCR were measured under basal conditions and after injection of 10 μM of isoproterenol, 1 μM of FCCP, and 1 μM of rotenone combined with 1 μM of antimycin A. The area under the curve (AUC) was calculated from the time of the isoproterenol injection (ISO-induced OCR). For Mito stress tests, DMEM (Agilent Technologies) was supplemented with 10 mM of glucose, 2 mM of glutamine, and 1 mM of sodium pyruvate (Agilent Technologies). The OCR were measured under basal conditions and following an injection of oligomycin (5 μM), FCCP (1 μM), and rotenone/antimycin A (1 μM) (Agilent Technologies). Calculations were performed using the Seahorse report generator.
2.13. cDNA library preparation and RNA sequencing
RNAs were harvested on days 0, 2, and 4 from control, Pparg2, or Pparg2 + Ybx1 over-expressing cells as previously described. Total RNA strands were isolated using RNeasy spin columns and assessed for integrity using an RNA 6000 Nano kit (Agilent Technologies). All of the samples (n = 54 and n = 6 experiments from independent passages) displayed intact RNA integrity (RIN > 9). RNA libraries were prepared manually using a TruSeq Stranded Total Ribo-Zero Illumina kit (Illumina). Briefly, rRNA strands were depleted, mRNA fragmented, and cleaned using RNA CleanXP beads (Beckman Coulter), and first- and second-strand DNA was synthesized using SuperScript III Reverse Transcriptase (Life Technologies). A-tailing and adapter ligation were performed according to the manufacturer's protocol; the resulting dsDNA was enriched in a PCR reaction based on predetermined CT values and cleaned using Agencourt AMPure XP beads (Beckman Coulter). Concentrations of enriched dsDNA fragments with specific adapters were determined using a Qubit dsDNA high-sensitivity kit (Invitrogen). The base pair average size and library integrity were analyzed using Bioanalyzer DNA high-sensitivity chips (Agilent). Samples were pooled and diluted to 1.8–2 pM and sequenced using an Illumina NextSeq 500/550 High-Output V2 kit (Illumina) using up to 18 samples per lane with 1% PhiX spike as a control (Illumina).
2.14. Transcriptomic analysis
Raw reads from RNA sequencing were aligned to mouse genome (GRCm38.p6, ENSEMBL release 92) using STAR v2.5.3a [42], and gene coverages were computed by featureCounts v1.5.2 [43] using relevant GENCODE annotation. Genes with low expression that had at least 2 counts per million (CPM) in at least 4 samples were removed. Differentially expressed genes (DEGs) were computed using edgeR v3.22.0 [44] with the glmQLFit/glmQLFTest function using a model of the form y∼0 + group + experiment, where “group” represents the unique combinations of cell types and sampling times and “experiment” is the covariate blocking for the batch effect. Genes with a false discovery rate (FDR) lower than 0.1 were considered differentially expressed. A gene set enrichment analysis (GSEA) was performed using clusterProfiler v3.10.1 [45]. The RNA sequencing datasets generated during this study are available at GEO (accession number GSE149083).
2.15. Statistical analysis
All of the experiments used biological replicates (n = number of animals or number of times the experiment was repeated). All of the statistical tests were performed using GraphPad Prism 8 (GraphPad Software, Inc., La Jolla, CA, USA), and all of the data are represented as mean ± SEM. Comparisons between two groups were conducted using Student's t-test. Comparisons between three groups or more were carried out by ANOVA, followed by post hoc multiple correction tests. ∗p < 0.05, ∗∗p < 0.01, and ∗∗∗p < 0.001.
2.16. Data availability
All of the proteomics data from this study were submitted to the Chorus database (http://chorusproject.org) as project no. 1505. The RNA sequencing datasets generated during this study are available at GEO (accession number GSE149083).
3. Results
3.1. Cold exposure dynamically remodeled protein expression in scWAT
To delineate the molecular mechanisms eliciting the recruitment of brite adipocytes in white adipose tissue in response to cold exposure, we profiled the protein landscape of subcutaneous WAT (scWAT) from cold-exposed mice in a time-dependent manner. We used tandem mass tag (TMT)-based proteomic analysis of scWAT from mice housed either at thermoneutrality (29 °C; minimal thermogenesis) or subjected to 5 °C for acute (3, 8, and 24 h) or chronic (1 and 3 weeks) cold challenges (Figure S1A). A total of 3,209 proteins were quantified under all of the conditions, and 509 significantly changed (FDR < 0.01 and p < 0.03) during cold adaptation (Figure 1A, Table S1, and Table S2). These dynamic changes occurred in distinct phases and followed different patterns as illustrated by the 8 different clusters describing the protein regulation profiles across the time course (Figure 1B and Table S3). The high correlation of proteome profiles observed at 1 and 3 weeks after cold induction indicated that major parts of the browning program were elicited when reaching the first week after cold stimulation (Figure S1B). We categorized the proteins regulated during the acute phase (3, 8, and 24 h) as the potential “regulators” of the scWAT browning process and the proteins regulated during the chronic phase (1 and 3 weeks) as “effectors” playing a key role in metabolic adaptation to increased thermogenic demand. Indeed, early changes concerned functions associated with the regulation of gene expression and chromatin organization or the regulation of proteolysis and stress response (Figure 1C and Figure 1D). STRING network analysis [46] identified a cluster of interrelating proteins involved in the regulation of gene expression as the largest cluster of proteins regulated by acute cold exposure (Figure S1C), consistent with remodeling of scWAT. In comparison, pathways related to metabolic activation were markedly altered in scWAT from cold-acclimated mice (Figure S1D). Upregulated pathways included the oxidation-reduction process, fatty acid metabolism, electron transport chain, and generation of precursor metabolites and energy (Figure 1E). Downregulated pathways included the regulation of cytoskeleton and extracellular matrix organization, locomotion, and cell adhesion (Figure 1F).
Figure 1.

Dynamic proteome remodeling occurred during cold adaptation in mouse subcutaneous adipose tissue. (A) Heat map (blue to yellow) representing all of the differentially expressed proteins during cold adaptation (n = 5, 2-way ANOVA, p < 0.03) clustered after z score normalization. Hierarchical clustering of proteins showing two distinct phases: acute vs chronic cold exposure and functionally related time points. (B) Fuzzy c-means clustering of all of the quantified proteins across the timespan using a tool developed by Schwämmle et al. [37]. Using the lowest value of the minimum centroid distance and the highest Xie-Beni index, proteins responding to cold acclimation in mouse scWAT were classified into 8 distinct clusters of regulation patterns (C1–C8). Proteins altered at early time points of cold exposure (≤24 h) are defined as “regulators” and proteins altered by chronic cold exposure (≥1 week) are referred to as “effectors.” (C–F) Gene ontology enrichment analysis was performed using GOrilla [79] and images were plotted using the REVIGO [80] bubble network for proteins upregulated in response to 3–24 h of cold exposure. (C) Proteins downregulated in response to 3–24 h of cold exposure (D). Upregulated proteins at 1–3 weeks after cold exposure (E). Downregulated proteins at 1–3 weeks after cold exposure (F).
3.2. YBX1 protein abundance and gene expression were regulated by cold in thermogenic adipose tissues
We postulated that the early alterations in protein abundance in scWAT were forerunning the appearance of thermogenically active brite adipocytes in this tissue. Among the proteins upregulated at the early time points, the STRING analysis revealed a nexus of 44 proteins associated with the regulation of gene expression (Figure S2A, Figure S2B, and Table S4). At this network's core, our proteomic data revealed that YBX1, a cold-shock domain (CSD) containing protein, increased by 1.5-fold at 24 h and returned to basal levels after 1 week of cold exposure (Figure S2C), when most brite adipocytes were established within the fat depots. Cold-shock domain proteins in bacteria are known to be regulated in response to temperature decreases [[47], [48], [49]]. Other studies showed that proteins with conserved temperature-sensitive domains played important roles in BAT activation and thermogenesis [50,51]. Increased YBX1 abundance in scWAT upon cold exposure was confirmed by immunoblotting, with a 3-fold increase in protein levels peaking at 24 h (Figure 2A), which preceded UCP1 upregulation (Table S2). Increased YBX1 abundance following cold exposure was also observed in BAT, but not in visceral WAT (vWAT), which is known to undergo minimal browning in mice, suggesting that induction of YBX1 is required for the remodeling of thermogenic adipose tissues. At thermoneutrality, YBX1 abundance was higher in BAT and tended to be higher in scWAT than in vWAT (Figure 2B). Histological analysis of scWAT from mice kept at either thermoneutrality (29 °C) or cold (5 °C) for 24 h clearly showed evidence of browning in the cold-exposed tissues (Figure S2D). Interestingly, these regions displayed increased vascularization (white autofluorescence signals) and corresponded to the zones with the most intense YBX1 signals (red) (Figure 2C and Figure S2D). High-magnification images revealed that YBX1 was preferentially found in both adipocytes and surrounding non-adipocyte cells, but absent in connective tissue, muscle fibers, and blood cells. At the gene level, we found that Ybx1 expression was upregulated in the stromal vascular fraction (SVF) as opposed to mature adipocytes within scWAT in response to 24 h of cold exposure (Figure 2D), suggesting a function for Ybx1 in progenitor cells.
Figure 2.

YBX1 abundance acutely increased in thermogenic adipose tissue upon cold exposure in mice. (A) Representative YBX1 and AKT immunoblots in various fat depots from mice kept at 5 °C for 0, 3, 8, and 24 s, 1 week, or 3 weeks. Quantification of the band intensities (n = 4 replicates per time point). Values are mean ± SEM, ∗p < 0.05, ∗∗p < 0.01, and ∗∗∗p < 0.001 analyzed by one-way ANOVA. (B) Immunoblots of YBX1 and AKT in various fat depots from mice kept at 29 °C for 3 weeks. Quantification of the band intensities (n = 3 replicates per time point). Values are mean ± SEM, ∗p < 0.05 analyzed by one-way ANOVA. (C) Histological analysis of scWAT from mice kept at either thermoneutrality (29 °C) or cold (5 °C) for 24 h. scWAT was stained with hematoxylin and eosin or YBX1 fluorescent antibody (red) together with DAPI (blue). Tissue autofluorescence is shown in white. Representative images (from n = 3 mice per group) are shown. Scale bars 200 μm and magnified scale bars 50 μm. (D)Ybx1 mRNA expression in the isolated mature adipocyte fraction (MAF) and stromal-vascular fraction (SVF) from scWAT of mice exposed to thermoneutrality (29 °C) or cold (5 °C) for 24 h (n = 5 replicates per condition). Values are mean ± SEM. ∗∗∗p < 0.001 analyzed by 2-way ANOVA with Bonferroni's multiple comparisons test.
3.3. YBX1 was necessary for thermogenic gene expression in adipocytes
To test whether YBX1 is required to elicit the thermogenic program in adipocytes during the differentiation process, we performed Ybx1 loss-of-function experiments in brown pre- and maturing adipocytes using siRNA-mediated knockdown (KD). KD of Ybx1 in WT-1 brown preadipocytes (day −2) resulted in efficient Ybx1 silencing on day 0 (95% reduction compared to negative control-transfected cells; p < 0.001) and Ybx1 mRNA expression remained low in these cells throughout differentiation (Figure S3A). Consistent with earlier studies [32], KD of Ybx1 in proliferating preadipocytes impaired adipogenesis as illustrated by the significantly decreased expression of adipocyte-specific genes compared to control cells (Figure S3B). In contrast, Ybx1 KD in confluent cells (at the induction time, day 0; 98% reduction in mRNA levels (p < 0.0001) and 59% reduction in protein levels (p < 0.05) compared to controls; Figure 3A and Figure 3B) had no discernible effect on adipogenesis as evidenced by comparable expression levels of adipocyte marker genes in Ybx1 KD and control cells (Figure S3C). Noticeably, however, silencing of Ybx1 expression in differentiating cells had a major impact on the expression of brown thermogenesis-related genes such as Ppargc1a, Elovl3, Prdm16, Cidea, and Ucp1 (Figure 3C). In addition, the KD of Ybx1 led to a 21% reduction in UCP1 protein expression (p < 0.05) (Figure 3D). These results suggest that YBX1 is not only required for proliferating preadipocytes to commit to the adipogenic process, but also in the later phase of adipocyte differentiation, possibly to support the thermogenic gene expression program. Interestingly, when Ybx1 KD was performed in already differentiating WT-1 cells (d2 following induction), its effect on the regulation of brown marker genes was dampened while no effect on differentiation was observed (Figs. S3D–S3F). Collectively, our results indicated that YBX1 is necessary in the early phase of adipogenesis to induce an optimal thermogenic program. To further test YBX1's role in inducing the thermogenic program in brite adipocytes, we conducted a Ybx1 loss-of-function experiment using C3H/10T1/2 mouse mesenchymal stem cells, which are not pre-programmed to develop into thermogenic adipocytes, but possess the ability to differentiate into brown-like cells with appropriate stimulation [52]. KD of Ybx1 in confluent C3H/10T1/2 cells (day 0) resulted in efficient Ybx1 silencing on day 2 (a 98% reduction in the mRNA level (p < 0.001) and a 75% reduction in the protein level (p < 0.001) compared to controls (Figure 3E and Figure 3F) and the Ybx1 mRNA expression remained low in these cells throughout differentiation. Despite a modest effect of Ybx1 KD on some adipogenic genes including Fabp4 and Fasn (Figure S3G), a significant downregulation of thermogenic genes was observed with Ybx1 deficiency (Figure 3G). This was further manifested by a 64% reduction in the UCP1 protein expression (p < 0.001) upon KD of Ybx1 (Figure 3H). These results suggest YBX1's role as a commitment factor driving the thermogenic fate of adipocytes.
Figure 3.

YBX1 was necessary for the expression of thermogenic genes in adipocytes. Brown WT-1 preadipocytes and C3H/10T1/2 mesenchymal stem cells were transfected with Ybx1-specific (siYbx1, light bars) or negative control siRNA (siCon, dark bars) and induced to differentiate (d0). (A) The efficiency of Ybx1 knockdown (KD) in WT-1 cells is shown at the mRNA level at different days of differentiation following siRNA transfection. (B) The efficiency of Ybx1 knockdown (KD) in WT-1 cells is shown at the protein level by Western blotting on different days of differentiation following siRNA transfection. The blot quantification is on the right. YBX1 was normalized to vinculin (VCL) (C) Effects of Ybx1 KD on the expression of key thermogenic genes (Ppargc1a, Elovl3, Prdm16, Cidea, and Ucp1) across differentiation. (D) The effect of Ybx1 KD on UCP1 protein expression in WT-1 cells is shown by Western blotting, and the quantification is on the right. UCP1 was normalized to vinculin (VCL) (E) The efficiency of Ybx1 KD in C3H/10T1/2 mesenchymal cells is shown at mRNA levels on different days of differentiation following siRNA transfection. (F) The efficiency of Ybx1 KD in C3H/10T1/2 cells is shown at the protein level by Western blotting on different days of differentiation following siRNA transfection. The blot quantification is on the right. YBX1 was normalized to vinculin (VCL). (G) Effects of Ybx1 KD on the expression of key thermogenic genes (Ppargc1a, Elovl3, Prdm16, Cidea, and Ucp1) across differentiation. (H) The effects of Ybx1 KD on UCP1 protein expression in C3H/10T1/2 cells is shown by Western blotting, and the blot quantification is on the right. UCP1 was normalized to vinculin (VCL). For all of the panels in this figure with qPCR data, n = 4 biological replicates were used and the values represent means ± SEM. ∗p < 0.05, ∗∗p < 0.01, and ∗∗∗p < 0.001 analyzed by 2-way ANOVA with Bonferroni's multiple comparisons test. For all of the panels in this figure with Western blotting data, n = 3 biological replicates were used and the values represent means ± SEM. ∗p < 0.05 analyzed by the unpaired t-test.
3.4. YBX1 promoted the thermogenic activity of adipocytes
To determine whether YBX1 is sufficient to promote browning, we assessed the effect of Ybx1 induction on adipocyte fate during differentiation. We employed a cell model in which adipocyte differentiation is solely triggered by activating the master regulator of adipogenesis PPARG2 to avoid any confounding factors inherent to using differentiation cocktails. We used our previously established modified C3H/10T1/2 mesenchymal stem cells expressing the CRISPRa-SAM-dCas9 complex (C3H/10T1/2-CRISPRa-SAM), which mimic typical characteristics of brite or white cell lineages under specific transcriptional controls [39]. Cells were transfected at 90% confluence (day −2) with plasmids delivering gRNAs targeting either the Ybx1 promoter, Pparg2 promoter, or both gRNAs in combination to induce the expression of endogenous Ybx1 or Pparg2 alone or together within the same cell population. Transfection of Ybx1 gRNA yielded a 4- and 3-fold increase in Ybx1 transcripts on days 0 and 2, respectively (Figure 4A, overall overexpression effects across days: p < 0.05), recapitulating the physiological induction that we observed following cold exposure in scWAT. A substantial induction of Pparg2 expression occurred in Pparg2 gRNA-transfected cells (Pparg2 gRNA) compared to empty vector (EV) transfected cells (∼10,000-fold increase 4, 6, and 8 days post-transfection; overall effect of overexpression: p < 0.001; Figure 4B). Induction of Ybx1 expression did not promote proliferation in proliferating cells or clonal expansion of confluent cells, as no differences were detected between Pparg2 gRNA transfected cells and Pparg2 + Ybx1 gRNA transfected cells (Figure S4A and Figure S4B). Notably, induction of Ybx1 expression alone did not promote differentiation in these cells, and no differences were detected in Pparg2 mRNA expression between Pparg2 gRNA transfected cells and Pparg2 + Ybx1 gRNA transfected cells (Figure 4A). No additive or synergistic effect on adipogenesis was detected in cells co-expressing Pparg2 and Ybx1 as Adipoq, Fabp4, and Fasn expression increased to the same extent in Pparg2 and Pparg2 + Ybx1 gRNA transfected cells (Figure S4C). Despite similar differentiation levels and Ucp1 gene expression at basal levels (Figure S4D), the induction of Ucp1 transcription in response to norepinephrine treatment (NE, 10 μM), a hallmark of brite adipocytes, was potentiated by Ybx1 co-overexpression with Pparg2 compared to cells expressing Pparg2 alone (Figure 4C, p < 0.05). This was accompanied by a 2- to 3-fold higher expression of brown-specific genes such as Elovl3 and Cidea in Pparg2 + Ybx1 gRNA transfected cells compared to Pparg2 gRNA transfected cells on days 2 and 4 (Figure 4C, p < 0.05). In addition, higher protein levels of YBX1 and UCP1 were observed in Pparg2 + Ybx1 gRNAs transfected cells compared to Pparg2 gRNA transfected cells (Figure 4D and Figure 4E). Altogether, these data suggest that YBX1 plays a role in the early modulation of thermogenic capacity in adipocytes without affecting overall differentiation levels. To functionally explore YBX1's role in differentiating adipocytes, we tested the mitochondrial respiration capacity in these cells. The oxygen consumption was measured in mature (6 days after differentiation started) C3H/10T1/2-CRISPRa-SAM cells expressing Pparg2 alone or in combination with Ybx1. Co-expression of Ybx1 and Pparg2 led to a 36% higher oxygen consumption after adrenergic stimulation compared to Pparg2-expressing cells (Figure 4F and Figure 4G), indicating that YBX1 promotes energy dissipation and increases thermogenic capacity in adipocytes. This potentiation was observed with no significant difference in mitochondrial DNA content (Figure S4E) or mitochondrial activity (Figure S4F).
Figure 4.

YBX1 potentiated the thermogenic capacity of C3H/10T1/2 mesenchymal stem cells. C3H/10T1/2-CRISPRa-SAM cells were transfected with empty vector (EV) or vector delivering a single-guide RNA (gRNA) directed to the promoter regions of Pparg2 (P) or Ybx1 (Y) as indicated. (A–B) mRNA expression levels of Ybx1 and Pparg2 post-transfection. (C) Gene expression analysis of thermogenic markers Ucp1, Cidea, and Elovl3. Data are based on n = 3 biological replicates. Two-way ANOVA; overall effects of the overexpression and differentiation day are shown for selected groups of interest (P vs EV; P vs P + Y). ∗p < 0.05, ∗∗p < 0.01, and ∗∗∗p < 0.001. (D–E) The effects of Ybx1 overexpression on the levels of YBX1 (D) and UCP1 (E) proteins in C3H/10T1/2 cells is shown by Western blotting and the quantification is added. UCP1 was normalized to vinculin (VCL). Four biological replicates were used, and the values are mean ± SEM. ∗p < 0.05 analyzed by unpaired t-test was applied for statistical analysis. (F) Oxygen consumption rates (OCR) in mature C3H/10T1/2-CRISPRa-SAM cells following injection with isoproterenol (ISO), FCCP, and rotenone/antimycin A (Rot/Anti). A representative experiment is shown. (G) AUC quantification of ISO-induced OCR is illustrated for n = 4 independent experiments. Data are shown as mean ± SEM. ∗p < 0.05 analyzed by paired t-test.
3.5. YBX1 regulated the expression of a unique set of early genes during adipogenesis to potentiate the thermogenic capacity of brite adipocytes
To explore the mechanisms by which YBX1 promotes a thermogenic program during adipogenesis, we further performed mRNA sequencing in the early phases of adipocyte differentiation after Pparg2 induction of C3H/10T1/2-CRISPRa-SAM cells with or without co-expression of Ybx1. As previously described, Pparg2 drastically triggered adipogenic induction independent of Ybx1 (Figure 5A, Figure 5B, and Figs. S5A–C). Co-expression of Ybx1 led to the early upregulation of a specific subset of genes, including Jmjd1c, Fbxo33, and Serpinb6b on days 0 and 2, followed by Hsd17b4 and Cyp4a14 on day 4 (Figure 5C, Figure 5D, Figure S5C, and Table S5). Hsd17b4 and Serpinb6b gene expression was significantly upregulated in scWAT following exposure to cold (5 °C) for 3 or 7 days compared to scWAT from mice kept at thermoneutrality (29 °C) (Figure S5D), and upregulation of HSD17B4 in response to cold was also detected at the protein level (Table S2). Importantly, in agreement with the role of Ybx1 in promoting the formation of thermogenic adipocytes, functional enrichment analysis of gene sets regulated by Ybx1 induction revealed the upregulation of essential metabolic processes involved in fatty acid metabolism, branched-chain amino acid catabolism, mitochondrial fatty acid oxidation, respiratory electron transport, and other pathways related to mitochondrial functions (Figure 5E, Table S6, and Figure S6) without significantly enhancing adipogenesis (Figure S5C). Collectively, our data showed that Ybx1 coordinated the expression of a small and unique set of genes that, in conjunction with Pparg2-induced adipogenesis, participated in enhancing metabolic and thermogenic activity of brite adipocytes.
Figure 5.

YBX1 induced early transcriptional changes to promote browning in C3H/10T1/2 mesenchymal stem cells. C3H/10T1/2-CRISPRa-SAM cells were transfected with empty vector (EV) or vector delivering a single-guide RNA directed to the promoter region of Pparg2 (P) or Pparg2 and Ybx1 (PY) as indicated. (A–C) Volcano plots displaying transcripts significantly regulated by induction of Pparg2 expression (A) or combined induction of Pparg2 and Ybx1 expression compared to EV-transfected control cells (B) and a set of genes upregulated specifically by Ybx1(C). (D) Heat map of fold changes in relative abundance of the set of genes significantly regulated by Pparg2 and Ybx1 co-induction across days of differentiation. (E) Gene set enrichment analysis (GSEA) across different days of differentiation upon Ybx1 over-expression; GO terms with FDR < 0.1 were considered significantly enriched and the top 10 GO terms with the lowest FDR for each contrast are shown in the dot plot. The extended list is provided in Table S6. NES stands for normalized enrichment score for GSEA. Data represent the relative abundance based on counts per million (CPM) and 0.1 false discovery rate (FDR) cut-off.
3.6. JMJD1c participated in mediating the effect of YBX1 on adipocytes
To further explore the mechanisms mediating YBX1's functions in adipocytes, we tested the involvement of early induced histone demethylase JMJD1c in facilitating the effect of YBX1 on the expression of thermogenic genes. To do this, we applied bidirectional manipulation of gene expression in adipocytes [39] to overexpress Ybx1 in combination with knockdown of Jmjd1c. Consistent with our RNA sequencing data, we confirmed the increase in the Jmjd1c transcript by YBX1, which was blunted with Jmjd1c knockdown (Figure 6A). Knockdown of Jmjd1c prevented YBX1-stimulated Cidea expression, with no effect on the expression of Ucp1, Elovl3, or Ppargc1a (Figure 6B) and without affecting differentiation (Figure 6C). Taken together, our data suggest that the browning effect of YBX1 is partially mediated via JMJD1c and its regulatory effect on Cidea. These results also highlight the existence of additional molecular mechanisms involved in YBX1-induced browning.
Figure 6.

JMJD1c contributed to YBX1-induced browning. C3H/10T1/2-CRISPRa-SAM cells were transfected with empty vector (EV) or vector delivering a single-guide RNA directed to the promoter region of Ybx1 as indicated. All of the transfections included the vector delivering a single-guide RNA directed to the promoter region of Pparg2. Furthermore, siRNA targeting Jmjd1c was used for knockdown. (A) Overexpression of Ybx1 in combination with siRNA targeting Jmj1dc. Transfection was performed two days pre-confluency (d2), the cells were harvested at d0, and gene expression levels of Ybx1 and Jmjd1c were assessed. (B–C) On day 6 of differentiation, the cells were harvested after 6 h of 10 μM NE stimulation or not, and the gene expression levels of Ucp1, Elovl3, Ppargc1a, and Cidea(B), and gene expression levels of Fasn, Fabp4, and Adipoq(C) were assessed. Data are based on n = 4 biological replicates and the values are the mean ± SEM. ∗p < 0.05, ∗∗p < 0.01, ∗∗∗p < 0.001, and ∗∗∗∗p < 0.0001 analyzed by 2-way ANOVA; overall effects of overexpression and knockdown are shown.
4. Discussion
Due to the limited amounts of BAT in adult humans, alternative approaches targeting the potential of WAT to produce thermogenic brite adipocytes may provide efficient strategies against obesity and associated metabolic diseases by regulating energy balance. In this study, we generated the first global proteomic landscapes of murine subcutaneous white fat through dynamic adaptation to cold temperature or browning, encompassing the acute response occurring within a few hours to long-term adaptation after several weeks. This revealed very dynamic changes occurring at the protein level only a few hours after exposure to cold.
Among the 509 significantly regulated proteins during cold adaptation, the proteins downregulated in response to chronic cold exposure were mainly involved in extracellular matrix organization, tissue remodeling, cytoskeleton organization, cell adhesion, and cell junction, which may be related to tissue transformation and expansion [53]. As anticipated from transcriptomic studies [54], after chronic cold exposure pathways related to the regulation of metabolic pathways such as oxidative phosphorylation, the TCA cycle, mitochondrial respiration, fatty acid metabolism, the electron transport chain, or generation of precursor metabolites and energy were enriched. However, we found decreased expression of proteins belonging to pathways related to proteolysis and protein modification including ubiquitination, with UBE2V2, UBE3A, UBE2N, UB2K, HECW2, and RNF185 acutely downregulated in response to cold exposure. Interestingly, since ubiquitination of PPARG, PRDM16, and PPARGC1A was shown to increase their degradation rates [[55], [56], [57]], our results are consistent with decreased ubiquitination of thermogenic proteins such as PRDM16 and PPARGC1A after cold induction in adipose tissue. Thus, acute downregulation of proteins belonging to proteolysis and ubiquitination pathways may be directly linked to cold-induced browning and thermogenesis of WAT. Our observations indicate that acutely cold-upregulated proteins are mainly involved in regulating gene expression and transcription. As such, several chromatin-binding proteins including transcription factors and epigenetic modifiers that respond to acute cold exposure are potential regulators priming the chromatin for brite adipogenesis [19]. Thus, many of these early changes are likely to be involved in promoting brite fat development and may function as molecular switches.
At the center of 44 transcriptional regulators acutely upregulated with cold, YBX1, a multifunctional RNA/DNA-binding protein and transcriptional regulator, was one of our identified proteins whose expression peaked after 24 h of cold exposure. Interestingly, we found that YBX1 was preferentially present in thermogenic fat depots, and that cold-induced expression of YBX1 was specific to thermogenic adipose tissues including BAT and scWAT but not vWAT. The mechanisms underlying the regulation of YBX1 expression by cold are unclear, and whether YBX1 induction generally occurs in response to other conditions associated with WAT browning is unknown. YBX1 was previously shown to modulate cell proliferation and differentiation, inflammation, stress response, and transformation of malignant cells [[58], [59], [60]]. In brown preadipocytes, YBX1 together with its interacting partner EWS are essential for early brown fat lineage determination, as their depletion in brown preadipocytes impairs adipogenesis and results in increased expression of myogenic genes [32]. The YBX1-EWS complex has also been described to be involved in brown and 3T3-L1 white preadipocyte proliferation and differentiation by regulating BMP7 and BMP2/4, respectively [32,33]. However, whether YBX1 plays role in brown fat activation or white browning fat has not been described. Our results indicate that YBX1 contributes to the induction of thermogenic gene expression as revealed by loss-of-function studies in differentiating brown and brite adipocytes and by gain-of-function studies in differentiating mesenchymal stem cells, directing the differentiation fate toward thermogenically more active adipocytes. This may occur, at least in part, through the regulation of an early set of genes comprising Jmjd1c, a jumonji C (JmjC) containing histone H3 lysine 9 (H3K9) demethylase, cytochrome P450 4A14 (Cyp4a14), and 17-beta-hydroxysteroid dehydrogenase type 4 (Hsd17b4). JMJD1C has been reported to play a role in 3T3-L1 differentiation [61], but its role in thermogenic adipocytes has not yet been described. Interestingly, JMJD1C was shown to increase ATP production through the coordinated regulation of OXPHOS and glycolysis in homeobox A9 (HOXA9)-dependent acute myeloid leukemia (AML) [62] and more recently found to play a key role in regulating lipogenic genes in hepatocytes [63], suggesting its regulatory function in cellular metabolism. Histone demethylases are actively involved in the epigenetic control of BAT development and thermogenesis [64]. JMJD1A, another H3K9 demethylase, JMJD3, a H3K27me3 demethylase, UTX, LSD1, or LSD2 have been implicated in these processes [23,[65], [66], [67], [68], [69], [70]], highlighting the crucial role of this class of proteins in thermogenic adipocyte fate determination. HSD17B4 is a bifunctional enzyme involved in the peroxisome-derived beta-oxidation of fatty acids, a process involved in the regulation of adipose thermogenesis by modulating mitochondrial dynamics [71], and Cyp4a14 is involved in lipid processing [72], highlighting YBX1's function in regulating lipid metabolic processes. Our combined loss-of-function experiments using siRNA-mediated knockdown of Jmjd1c, together with the induction of Ybx1, showed that knockdown of Jmjd1c prevents the induction of Cidea expression by YBX1, but not other thermogenic genes. This indicates that JMJD1c partially contributes to mediating the effect of YBX1 and that additional mechanisms involved in YBX1-induced browning have yet to be identified. While our results using various cell models to highlight the requirement and sufficiency of YBX1 in supporting the thermogenic function of adipocytes point to a role for YBX1 in adipocyte fate determination, the contribution of YBX1 in thermogenic commitment under physiologic conditions in vivo remains to be demonstrated. In addition, a function for YBX1 in mature adipocytes cannot be excluded. The presence of YBX1 in both non-adipose cells and mature adipocytes in typical WAT-browning pockets where lipid droplets are smaller and less abundant, as revealed by IHC, may be indicative of additional roles for YBX1 in mature thermogenic adipocytes. Whether YBX1 also participates in white to brite adipocyte conversion is an interesting concept requiring further investigation.
Strikingly, YBX1 is an evolutionarily conserved cold-shock domain (CSD) containing protein. CSDs were originally identified in cold-shock proteins (CSP) in bacteria, where some CSPs were rapidly and strongly induced in response to a sudden decrease in temperature to initiate an adaptive response [[47], [48], [49]]. While the sensing and countering mechanisms differ between uni- and pluri-cellular organisms, this suggests an evolutionary conserved molecular core response to a cold environment. In addition, other studies in mice have shown that proteins with conserved temperature-sensitive domains play important roles in BAT activation and thermogenesis [50,51]. CSDs possess nucleic acid (DNA/RNA)-binding properties, which confers a wide variety of functions to CSD containing proteins [49]. Therefore, YBX1's thermogenesis-promoting role may be mediated by other DNA/RNA-binding functions in addition to its regulation of RNA expression by its activity on targeted promoters. YBX1 was proposed to modulate alternative splicing and translation [73]. YBX1's potential role in regulating the translation is in line with our data showing that UCP1 protein expression is enhanced with Ybx1 gain of function without noticeable effect on basal Ucp1 gene expression. A related Y-box protein family member, YBX2, has been described to regulate RNA stability during cold-induced brown fat activation [50]. YBX1 also plays a role in defining miRNAs and other small non-coding RNA compositions of exosomes [74,75], which are important extracellular vesicles for adipose tissue function and whole-body metabolic control in mammals [76]. Importantly, YBX1 is also known to localize to mitochondria [77], where it is involved in recruiting mRNAs coding for oxidative phosphorylation proteins and modulating mitochondrial functions [78]. Whether these functions participate in mediating the YBX1-induced thermogenic capacity of brown or brite adipocytes is currently unknown and deserves further investigation. Our study further showed that the mitochondrial DNA content and function remained unchanged upon YBX1 upregulation, further suggesting that YBX1 enhances isoproterenol-stimulated OCR via alternative mechanisms such as fuel oxidation and/or UCP1 function. These observations nevertheless raise an intriguing speculation that YBX1 coordinates the metabolic activities of thermogenic adipocytes at multiple levels.
5. Conclusion
In summary, we propose that YBX1 is a physiologically induced key factor promoting the development of brite adipocytes contributing to adaptive thermogenesis. This may lead to new therapeutic strategies for treating obesity-related metabolic disorders, aiming at increasing energy expenditure.
Author contributions
A.R., Z.G.H., and B.E.: Conceptualization. A.R., S.S., S.B.T., K.P., and M.L.: Methodology. A.R., S.S., K.P., M.S.I., G.N.C., and A.A.: Formal analysis. A.R., K.P., M.S.I., E.L.B, M.T., P.S.P., and M.A.O.: Investigation. A.R. and B.E.: Writing original draft. K.P., M.S.I., R.B., and Z.G.H.: Writing, review, and editing. O.N.J. and B.E.: Funding acquisition. Z.G.H., R.B., and O.N.J.: Resources. B.E: Supervision.
Acknowledgments
This study was supported by internal funding from the Novo Nordisk Foundation Center for Basic Metabolic Research, an independent research center at the University of Copenhagen partially funded by an unrestricted donation from the Novo Nordisk Foundation (NNF18CC0034900). The ONJ laboratory at SDU is supported by generous grants from the VILLUM Center for Bioanalytical Sciences (VILLUM Foundation grant no. 7292), PRO-MS Danish National Mass Spectrometry Platform for Functional Proteomics (grant no. 5072-00007B), and the Danish National Research Foundation Center for Epigenetics (grant no. DNRF 82). We gratefully acknowledge the support of the Core Facility for Integrated Microscopy (https://cfim.ku.dk). We thank Jakob Bondo Hansen for technical assistance, Bruna Brasil Brandao for experimental assistance and discussion, and the members of the Emanuelli group for discussions.
Footnotes
Supplementary data to this article can be found online at https://doi.org/10.1016/j.molmet.2020.101137.
Conflict of interest
None declared.
Appendix A. Supplementary data
The following are the Supplementary data to this article:
Figure S1. Proteomic regulation by acute and chronic cold in scWAT (related toFigure 1). (A) Experimental workflow; the control and experimental mice groups were kept in a room set to 29 °C to acclimate to thermoneutrality for three weeks. The experimental mice were then moved to an incubator set to 5 °C and kept for 3, 8, or 24 h, 1 week, or 3 weeks before dissection. (B) R-squared correlation numbers shown on a multi-scatter plot indicating that the major parts of the browning program had been elicited after 1 week of cold induction. (C) Significantly regulated proteins from the fuzzy c-means clusters 1, 2, 4, and 7 (upregulated at 3–24 h) organized in known protein–protein interaction networks using STRING (Szklarczyk et al., 2015). Regulation of gene expression was the gene ontology with the highest enrichment using the selected protein list (represented in green). (D) Significantly regulated proteins from the fuzzy c-means clusters 2, 7, and 8 (upregulated at 1–3 weeks) organized in known protein–protein interaction networks using STRING. The oxidation/reduction molecular process was the gene ontology with the highest enrichment using the selected protein list (represented in green). Figure S2. YBX1 is a transcriptional regulator acutely upregulated in response to cold in scWAT (related toFigure 2). (A) STRING network representation of the acutely significantly regulated proteins associated with chromatin function. The line thickness indicates the strengths of confidence for interactions (using the STRING algorithm). YBX1 (marked with a green border) was closely associated with heterogeneous nuclear ribonucleoproteins and proteins involved in RNA splicing and processing. (B) Volcano plot of all of the chromatin-related proteins plotted using the log2-fold change (x axis) and -log2 t-test p value (y axis) of protein abundance ratios (3–24 h vs 0 h). (C) YBX1 protein abundance values from MS data represented as fold changes normalized to 0 h control. N = 4 replicates per condition and values are the mean ± SEM. ∗∗p < 0.001 analyzed by one-way ANOVA with Bonferroni's multiple comparisons test. (D) Histological analysis of scWAT from mice kept either on thermoneutrality (29 °C) or cold (5 °C) for 24 h. scWAT was stained with hematoxylin and eosin or YBX1 fluorescent antibody (red) together with DAPI (blue). Tissue autofluorescence is shown in white. Three mice per group are shown, and the scale bars represent 1000 μm. Figure S3. YBX1 is a regulator of early adipogenesis that also functions as a commitment factor in thermogenic adipocytes (related toFigure 3). (A–B) The efficiency of Ybx1 KD in proliferating WT-1 brown preadipocytes 2 days before the induction of differentiation (d2) is shown and the effects of KD on the differentiation into mature brown adipocytes was evaluated by the expression of Fabp4, Fasn, and Adipoq. (C) The effects of Ybx1 KD on d0 in WT-1 cells is shown on differentiation (assessed by Fabp4, Fasn, and Adipoq expression levels). (D–F) The efficiency and effects of siRNA-mediated KD of Ybx1 in differentiating brown adipocytes (d2) on differentiation (assessed by Fabp4, Fasn, and Adipoq expression levels) and on thermogenic gene expression (assessed by Ucp1, Ppargc1a, and Cidea levels) are shown. (G) The effects of Ybx1 KD on day 0 in C3H/10T1/2 cells is shown on differentiation (assessed by Fabp4, Fasn, and Adipoq expression levels). For all of the panels in this figure, n = 4 biological replicates were used and the values represent means ± SEM. ∗p < 0.05, ∗∗p < 0.01, and ∗∗∗p < 0.001 analyzed by 2-way ANOVA with Bonferroni's multiple comparisons. Figure S4. Effect of Ybx1 overexpression on cell proliferation, differentiation, mitochondrial DNA content, and mitochondrial function (related toFigure 4). C3H/10T1/2-CRISPRa-SAM cells were transfected with empty vector (EV) or vector delivering a single-guide RNA directed to the promoter regions of Pparg2 (P) or Ybx1 (Y) or in combination (PY). (A–B) Two days post-transfection, a proliferation assay (MTT assay) was performed in preadipocytes or confluent cells; 20% FBS or no FBS was included as positive and negative controls, respectively. (C–D) Gene expression analysis of differentiation markers Fasn, Fabp4, and Adipoq and Ucp1. Data are based on n = 3 biological replicates and the values are mean ± SEM. ∗p < 0.05, ∗∗p < 0.01, and ∗∗∗p < 0.001 analyzed by 2-way ANOVA; overall effects of the overexpression and differentiation day are shown for selected groups of interest (P vs EV; P vs PY). (E) C3H/10T1/2-CRISPRa-SAM cells were transfected before confluency with vectors delivering a single-guide RNA directed to the promoter regions of Pparg2 or Pparg2 + Ybx1. On day 6 of differentiation, the mitochondrial DNA content was assessed. Values are mean ± SEM. ∗p < 0.05 analyzed by the unpaired t-test. (F–G) C3H/10T1/2-CRISPRa-SAM cells were transfected before confluency with vectors delivering a single-guide RNA directed to the promoter regions of Pparg2 or Pparg2 + Ybx1. On day 6 of differentiation, the Mito stress test (oligomycin, FCCP, and rotenone/antimycin A) was performed in the Seahorse machine and calculations were conducted using the Seahorse report generator. Data are based on n = 3 biological replicates. Figure S5. Early changes in gene expression induced by Co-expression of Ybx1 with Pparg2 in differentiating C3H/10T1/2-SAM cells (related toFigure 5). (A) Heat map of fold changes (FC) induced by Pparg2-targeted (P) differentiation or additive effects by Ybx1 co-expression (PY). Clustering analysis identified 2 major clusters specific to either day 0 (non-differentiated cells) or days 2 and 4 (committed adipocytes). (B) Over-representation analysis using the Reactome Pathway database on clusters 1 and 2 confirming differentiation stage-specific gene clusters and enrichment in corresponding cellular processes such as cell cycle processes in cells harvested on day 0 (cluster 1) and metabolic processes in differentiated adipocytes on day 4 (cluster 2). (C) Relative abundance of differentiation-related genes such as Pparg, Adipoq, Cebpa, Fabp4, and Plin1 confirmed the lack of differences in differentiation levels of Pparg2 (P) or Pparg2 + Ybx1 (PY) over-expressing cells, together with induction of specific genes such as Jmjd1c, Fbxo33, Cyp4a14, and Hsd17b4 in Pparg2 + Ybx1 (PY) over-expressing cells compared to EV controls and Pparg2 over-expressing cells (P), respectively. Data are expressed as log2-fold changes based on CPMs with an FDR cut-off of 0.1. (D) The mRNA levels of Gpnmb, Hsd17b4, Fbxo33, Krt8, and Serpinb6b in scWAT from mice kept either at thermoneutrality (29 °C) or exposed to cold (5 °C) for 3 or 7 days. N = 3 replicates were used and values are the mean ± SEM. ∗p < 0.05 and ∗∗p < 0.001 analyzed by one-way ANOVA with Bonferroni's multiple comparisons test. Figure S6. Key pathways upregulated by Ybx1 to promote higher metabolic activity of beige adipocytes (related toFigure 5). CNET plot depicting the linkages of genes and biological concepts (GO terms) as a network. Log2-fold changes (PY vs P on d4) of gene expression within selected enrichments.
Table S1: TMT quantification of the proteome (related to Figure 1). The table includes the UniProt accession number of all of the quantified proteins with a brief description. The log2 transformed and normalized TMT quantification at the 6 time points is shown. The average and standard deviation was calculated for five biological replicates.
Table S2: Regulation of proteins in response to cold (related to Figure 1). The table includes the UniProt accession number of all of the regulated proteins with a brief description. The average and standard deviation was calculated for five biological replicates and parametric (ANOVA) and non-parametric (Kruskal-Wallis) statistical p values were used for statistics.
Table S3: Clustering of regulated proteins (related to Figure 1). Clustering performed with the fuzzy c-means algorithm developed by Schwämmle et al. (Schwämmle and Jensen, 2010) and the clustering membership's significance. This significant membership value was defined as “true” when the protein belonged to one cluster with a significantly higher membership compared to another cluster. Those marked as “false” were still associated with the cluster with the most similar centroids but potentially belonged to other clusters. To simplify, clusters of proteins upregulated and downregulated in response to acute and chronic cold exposure were pooled in the same column.
Table S4: Proteins involved in the regulation of gene expression were highly upregulated in response to acute cold exposure (related to Figure 2). The table provides the UniProt accession number, gene ID, and a brief description of 44 proteins known to be involved in regulating the gene expression identified in our MS dataset that were upregulated in response to acute cold exposure. The cluster number is provided to show the exact regulation pattern the proteins followed in response to cold exposure.
Table S5: Differential gene expression dataset (related to Figure 5). The Excel Workbook contained 28 data sheets with the results of differential gene expression (DGE) analysis. The first sheet called “README” contained the details, explanation of contrasts, and acronyms for each comparison. The remaining data sheets only contained the results of DGE analysis.
Table S6: Regulated biological processes in Pparg2 vs Pparg2+ Ybx1 cells in differentiating adipocytes (related to Figure 5). Gene set enrichment analysis (GSEA) identified differentially regulated (up/down) biological processes in Pparg2 vs Pparg2 + Ybx1 cells on different days (d0, d2, and d4) following induction of adipocyte differentiation. The table indicates the subset of genes contributing most to the GO term.
Table S7: List of primer sequences used for quantitative PCR-based gene expression analysis. The forward and reverse primer sequences are provided for each gene.
References
- 1.Seale P., Lazar M.A. Brown fat in humans: turning up the heat on obesity. Diabetes. 2009:1482–1484. doi: 10.2337/db09-0622. [DOI] [PMC free article] [PubMed] [Google Scholar]
- 2.Lidell M.E., Betz M.J., Enerbäck S. Brown adipose tissue and its therapeutic potential. Journal of Internal Medicine. 2014:364–377. doi: 10.1111/joim.12255. [DOI] [PubMed] [Google Scholar]
- 3.Scheele C., Nielsen S. Metabolic regulation and the anti-obesity perspectives of human brown fat. Redox Biology. 2017:770–775. doi: 10.1016/j.redox.2017.04.011. [DOI] [PMC free article] [PubMed] [Google Scholar]
- 4.Townsend K.L., Tseng Y.H. Brown fat fuel utilization and thermogenesis. Trends in Endocrinology and Metabolism. 2014:168–177. doi: 10.1016/j.tem.2013.12.004. [DOI] [PMC free article] [PubMed] [Google Scholar]
- 5.Townsend K.L., Tseng Y.-H. Of mice and men: novel insights regarding constitutive and recruitable brown adipocytes. International Journal of Obesity Supplements. 2015;5(S1):S15–S20. doi: 10.1038/ijosup.2015.5. [DOI] [PMC free article] [PubMed] [Google Scholar]
- 6.Van Marken Lichtenbelt W.D., Vanhommerig J.W., Smulders N.M., Drossaerts J.M.A.F.L., Kemerink G.J., Bouvy N.D. Cold-activated brown adipose tissue in healthy men. New England Journal of Medicine. 2009;360(15):1500–1508. doi: 10.1056/NEJMoa0808718. [DOI] [PubMed] [Google Scholar]
- 7.Koksharova E., Ustyuzhanin D., Philippov Y., Mayorov A., Shestakova M., Shariya M. The relationship between Brown adipose tissue content in supraclavicular fat depots and insulin sensitivity in patients with type 2 diabetes mellitus and prediabetes. Diabetes Technology and Therapeutics. 2017;19(2):96–102. doi: 10.1089/dia.2016.0360. [DOI] [PMC free article] [PubMed] [Google Scholar]
- 8.Cousin B., Cinti S., Morroni M., Raimbault S., Ricquier D., Penicaud L. Occurrence of brown adipocytes in rat white adipose tissue: molecular and morphological characterization. Journal of Cell Science. 1992;103(4):931–942. doi: 10.1242/jcs.103.4.931. [DOI] [PubMed] [Google Scholar]
- 9.Guerra C., Koza R.A., Yamashita H., Walsh K., Kozak L.P. Emergence of brown adipocytes in white fat in mice is under genetic control effects on body weight and adiposity. Journal of Clinical Investigation. 1998;102(2):412–420. doi: 10.1172/JCI3155. [DOI] [PMC free article] [PubMed] [Google Scholar]
- 10.Himms-Hagen J., Melnyk A., Zingaretti M.C., Ceresi E., Barbatelli G., Cinti S. Multilocular fat cells in WAT of CL-316243-treated rats derive directly from white adipocytes. American Journal of Physiology - Cell Physiology. 2000;279(3 48–3) doi: 10.1152/ajpcell.2000.279.3.c670. [DOI] [PubMed] [Google Scholar]
- 11.Chevalier C., Stojanović O., Colin D.J., Suarez-Zamorano N., Tarallo V., Veyrat-Durebex C. Gut microbiota orchestrates energy homeostasis during cold. Cell. 2015;163(6):1360–1374. doi: 10.1016/j.cell.2015.11.004. [DOI] [PubMed] [Google Scholar]
- 12.Suárez-Zamorano N., Fabbiano S., Chevalier C., Stojanović O., Colin D.J., Stevanović A. Microbiota depletion promotes browning of white adipose tissue and reduces obesity. Nature Medicine. 2015;21(12):1497–1501. doi: 10.1038/nm.3994. [DOI] [PMC free article] [PubMed] [Google Scholar]
- 13.Fabbiano S., Suárez-Zamorano N., Rigo D., Veyrat-Durebex C., Stevanovic Dokic A., Colin D.J. Caloric restriction leads to browning of white adipose tissue through type 2 immune signaling. Cell Metabolism. 2016;24(3):434–446. doi: 10.1016/j.cmet.2016.07.023. [DOI] [PubMed] [Google Scholar]
- 14.Stanford K.I., Middelbeek R.J.W., Townsend K.L., An D., Nygaard E.B., Hitchcox K.M. Brown adipose tissue regulates glucose homeostasis and insulin sensitivity. Journal of Clinical Investigation. 2013;123(1):215–223. doi: 10.1172/JCI62308. [DOI] [PMC free article] [PubMed] [Google Scholar]
- 15.Emanuelli B., Vienberg S.G., Smyth G., Cheng C., Stanford K.I., Arumugam M. Interplay between FGF21 and insulin action in the liver regulates metabolism. Journal of Clinical Investigation. 2014;124(2):515–527. doi: 10.1172/JCI67353. [DOI] [PMC free article] [PubMed] [Google Scholar]
- 16.Hanssen M.J.W., Hoeks J., Brans B., Van Der Lans A.A.J.J., Schaart G., Van Den Driessche J.J. Short-term cold acclimation improves insulin sensitivity in patients with type 2 diabetes mellitus. Nature Medicine. 2015;21(8):863–865. doi: 10.1038/nm.3891. [DOI] [PubMed] [Google Scholar]
- 17.Mueller E. Understanding the variegation of fat: novel regulators of adipocyte differentiation and fat tissue biology. Biochimica et Biophysica Acta - Molecular Basis of Disease. 2014:352–357. doi: 10.1016/j.bbadis.2013.05.031. [DOI] [PubMed] [Google Scholar]
- 18.Wang W., Seale P. Control of brown and beige fat development. Nature Reviews Molecular Cell Biology. 2016:691–702. doi: 10.1038/nrm.2016.96. [DOI] [PMC free article] [PubMed] [Google Scholar]
- 19.Inagaki T., Sakai J., Kajimura S. Transcriptional and epigenetic control of brown and beige adipose cell fate and function. Nature Reviews Molecular Cell Biology. 2016:480–495. doi: 10.1038/nrm.2016.62. [DOI] [PMC free article] [PubMed] [Google Scholar]
- 20.Tanimura K., Suzuki T., Vargas D., Shibata H., Inagaki T. Epigenetic regulation of beige adipocyte fate by histone methylation. Endocrine Journal. 2019:115–125. doi: 10.1507/endocrj.EJ18-0442. [DOI] [PubMed] [Google Scholar]
- 21.Ohno H., Shinoda K., Ohyama K., Sharp L.Z., Kajimura S. EHMT1 controls brown adipose cell fate and thermogenesis through the PRDM16 complex. Nature. 2013;504(7478):163–167. doi: 10.1038/nature12652. [DOI] [PMC free article] [PubMed] [Google Scholar]
- 22.Sambeat A., Gulyaeva O., Dempersmier J., Tharp K.M., Stahl A., Paul S.M. LSD1 interacts with Zfp516 to promote UCP1 transcription and Brown fat program. Cell Reports. 2016;15(11):2536–2549. doi: 10.1016/j.celrep.2016.05.019. [DOI] [PMC free article] [PubMed] [Google Scholar]
- 23.Abe Y., Fujiwara Y., Takahashi H., Matsumura Y., Sawada T., Jiang S. Histone demethylase JMJD1A coordinates acute and chronic adaptation to cold stress via thermogenic phospho-switch. Nature Communications. 2018;9(1) doi: 10.1038/s41467-018-03868-8. [DOI] [PMC free article] [PubMed] [Google Scholar]
- 24.Ikeda K., Maretich P., Kajimura S. The common and distinct features of Brown and beige adipocytes. Trends in Endocrinology and Metabolism. 2018:191–200. doi: 10.1016/j.tem.2018.01.001. [DOI] [PMC free article] [PubMed] [Google Scholar]
- 25.Perdikari A., Leparc G.G., Balaz M., Pires N.D., Lidell M.E., Sun W. BATLAS: deconvoluting Brown adipose tissue. Cell Reports. 2018;25(3):784–797. doi: 10.1016/j.celrep.2018.09.044. e4. [DOI] [PubMed] [Google Scholar]
- 26.Lee Y.H., Petkova A.P., Mottillo E.P., Granneman J.G. In vivo identification of bipotential adipocyte progenitors recruited by β3-adrenoceptor activation and high-fat feeding. Cell Metabolism. 2012;15(4):480–491. doi: 10.1016/j.cmet.2012.03.009. [DOI] [PMC free article] [PubMed] [Google Scholar]
- 27.Wang Q.A., Tao C., Gupta R.K., Scherer P.E. Tracking adipogenesis during white adipose tissue development, expansion and regeneration. Nature Medicine. 2013;19(10):1338–1344. doi: 10.1038/nm.3324. [DOI] [PMC free article] [PubMed] [Google Scholar]
- 28.Rosenwald M., Perdikari A., Rülicke T., Wolfrum C. Bi-directional interconversion of brite and white adipocytes. Nature Cell Biology. 2013;15(6):659–667. doi: 10.1038/ncb2740. [DOI] [PubMed] [Google Scholar]
- 29.Long J.Z., Svensson K.J., Tsai L., Zeng X., Roh H.C., Kong X. A smooth muscle-like origin for beige adipocytes. Cell Metabolism. 2014;19(5):810–820. doi: 10.1016/j.cmet.2014.03.025. [DOI] [PMC free article] [PubMed] [Google Scholar]
- 30.Lee Y.H., Petkova A.P., Konkar A.A., Granneman J.G. Cellular origins of cold-induced brown adipocytes in adult mice. FASEB Journal. 2015;29(1):286–299. doi: 10.1096/fj.14-263038. [DOI] [PMC free article] [PubMed] [Google Scholar]
- 31.Kohno K., Izumi H., Uchiumi T., Ashizuka M., Kuwano M. The pleiotropic functions of the Y-box-binding protein, YB-1. BioEssays. 2003:691–698. doi: 10.1002/bies.10300. [DOI] [PubMed] [Google Scholar]
- 32.Park J.H., Kang H.J., Kang S.I., Lee J.E., Hur J., Ge K. A Multifunctional protein, EWS, is essential for early brown fat lineage determination. Developmental Cell. 2013;26(4):393–404. doi: 10.1016/j.devcel.2013.07.002. [DOI] [PMC free article] [PubMed] [Google Scholar]
- 33.Park J.H., Lee S.B. An essential role for Ewing sarcoma gene (EWS) in early white adipogenesis. Obesity. 2015;23(1):138–144. doi: 10.1002/oby.20934. [DOI] [PubMed] [Google Scholar]
- 34.Rabiee A., Schwämmle V., Sidoli S., Dai J., Rogowska-Wrzesinska A., Mandrup S. Nuclear phosphoproteome analysis of 3T3-L1 preadipocyte differentiation reveals system-wide phosphorylation of transcriptional regulators. Proteomics. 2017 doi: 10.1002/pmic.201600248. [DOI] [PubMed] [Google Scholar]
- 35.Käll L., Canterbury J.D., Weston J., Noble W.S., MacCoss M.J. Semi-supervised learning for peptide identification from shotgun proteomics datasets. Nature Methods. 2007 doi: 10.1038/nmeth1113. [DOI] [PubMed] [Google Scholar]
- 36.Tyanova S., Temu T., Sinitcyn P., Carlson A., Hein M.Y., Geiger T. The Perseus computational platform for comprehensive analysis of (prote)omics data. Nature Methods. 2016 doi: 10.1038/nmeth.3901. [DOI] [PubMed] [Google Scholar]
- 37.Schwämmle V., Jensen O.N. A simple and fast method to determine the parameters for fuzzy c-means cluster analysis. Bioinformatics. 2010;26(22):2841–2848. doi: 10.1093/bioinformatics/btq534. [DOI] [PubMed] [Google Scholar]
- 38.Fasshauer M., Klein J., Kriauciunas K.M., Ueki K., Benito M., Kahn C.R. Essential role of insulin receptor substrate 1 in differentiation of Brown adipocytes. Molecular and Cellular Biology. 2001;21(1):319–329. doi: 10.1128/mcb.21.1.319-329.2001. [DOI] [PMC free article] [PubMed] [Google Scholar]
- 39.Lundh M., Pluciñska K., Isidor M.S., Petersen P.S.S., Emanuelli B. Bidirectional manipulation of gene expression in adipocytes using CRISPRa and siRNA. Molecular Metabolism. 2017;6(10):1313–1320. doi: 10.1016/j.molmet.2017.07.001. [DOI] [PMC free article] [PubMed] [Google Scholar]
- 40.Xue R., Wan Y., Zhang S., Zhang Q., Ye H., Li Y. Role of bone morphogenetic protein 4 in the differentiation of brown fat-like adipocytes. American Journal of Physiology - Endocrinology and Metabolism. 2014 doi: 10.1152/ajpendo.00119.2013. [DOI] [PubMed] [Google Scholar]
- 41.Konermann S., Brigham M.D., Trevino A.E., Joung J., Abudayyeh O.O., Barcena C. Genome-scale transcriptional activation by an engineered CRISPR-Cas9 complex. Nature. 2015;517(7536):583–588. doi: 10.1038/nature14136. [DOI] [PMC free article] [PubMed] [Google Scholar]
- 42.Dobin A., Davis C.A., Schlesinger F., Drenkow J., Zaleski C., Jha S. STAR: Ultrafast universal RNA-seq aligner. Bioinformatics. 2013;29(1):15–21. doi: 10.1093/bioinformatics/bts635. [DOI] [PMC free article] [PubMed] [Google Scholar]
- 43.Liao Y., Smyth G.K., Shi W. FeatureCounts: an efficient general purpose program for assigning sequence reads to genomic features. Bioinformatics. 2014;30(7):923–930. doi: 10.1093/bioinformatics/btt656. [DOI] [PubMed] [Google Scholar]
- 44.Robinson M.D., McCarthy D.J., Smyth G.K. edgeR: a Bioconductor package for differential expression analysis of digital gene expression data. Bioinformatics. 2009;26(1):139–140. doi: 10.1093/bioinformatics/btp616. [DOI] [PMC free article] [PubMed] [Google Scholar]
- 45.Yu G., Wang L.G., Han Y., He Q.Y. ClusterProfiler: an R package for comparing biological themes among gene clusters. OMICS A Journal of Integrative Biology. 2012;16(5):284–287. doi: 10.1089/omi.2011.0118. [DOI] [PMC free article] [PubMed] [Google Scholar]
- 46.Szklarczyk D., Franceschini A., Wyder S., Forslund K., Heller D., Huerta-Cepas J. STRING v10: protein-protein interaction networks, integrated over the tree of life. Nucleic Acids Research. 2015;43(D1):D447–D452. doi: 10.1093/nar/gku1003. [DOI] [PMC free article] [PubMed] [Google Scholar]
- 47.Graumann P.L., Marahiel M.A. A superfamily of proteins that contain the cold-shock domain. Trends in Biochemical Sciences. 1998:286–290. doi: 10.1016/S0968-0004(98)01255-9. [DOI] [PubMed] [Google Scholar]
- 48.Mihailovich M., Militti C., Gabaldón T., Gebauer F. Eukaryotic cold shock domain proteins: highly versatile regulators of gene expression. BioEssays. 2010:109–118. doi: 10.1002/bies.200900122. [DOI] [PubMed] [Google Scholar]
- 49.Lindquist J.A., Mertens P.R. Cold shock proteins: from cellular mechanisms to pathophysiology and disease. Cell Communication and Signaling. 2018;16(1) doi: 10.1186/s12964-018-0274-6. [DOI] [PMC free article] [PubMed] [Google Scholar]
- 50.Xu D., Xu S., Kyaw A.M.M., Lim Y.C., Chia S.Y., Siang D.T.C. RNA binding protein Ybx2 regulates RNA stability during cold-induced brown fat activation. Diabetes. 2017;66(12):2987–3000. doi: 10.2337/db17-0655. [DOI] [PubMed] [Google Scholar]
- 51.Cheng H., Qi T., Zhang X., Kong Q., Min X., Mao Q. Deficiency of heat shock protein A12A promotes browning of white adipose tissues in mice. Biochimica et Biophysica Acta - Molecular Basis of Disease. 2019;1865(6):1451–1459. doi: 10.1016/j.bbadis.2019.02.017. [DOI] [PubMed] [Google Scholar]
- 52.Xue R., Wan Y., Zhang S., Zhang Q., Ye H., Li Y. Role of bone morphogenetic protein 4 in the differentiation of brown fat-like adipocytes. American Journal of Physiology - Endocrinology and Metabolism. 2014;306(4) doi: 10.1152/ajpendo.00119.2013. [DOI] [PubMed] [Google Scholar]
- 53.van der Stelt I., Hoevenaars F., Široká J., de Ronde L., Friedeckỳ D., Keijer J. Metabolic response of visceral white adipose tissue of obese mice exposed for 5 days to human room temperature compared to mouse thermoneutrality. Frontiers in Physiology. 2017;8(MAR) doi: 10.3389/fphys.2017.00179. [DOI] [PMC free article] [PubMed] [Google Scholar]
- 54.Rosell M., Kaforou M., Frontini A., Okolo A., Chan Y.W., Nikolopoulou E. Brown and white adipose tissues: intrinsic differences in gene expression and response to cold exposure in mice. American Journal of Physiology - Endocrinology and Metabolism. 2014;306(8) doi: 10.1152/ajpendo.00473.2013. [DOI] [PMC free article] [PubMed] [Google Scholar]
- 55.Peng J., Li Y., Wang X., Deng S., Holland J., Yates E. An hsp20-FBXO4 Axis regulates adipocyte function through modulating PPARγ ubiquitination. Cell Reports. 2018;23(12):3607–3620. doi: 10.1016/j.celrep.2018.05.065. [DOI] [PMC free article] [PubMed] [Google Scholar]
- 56.Wei P., Pan D., Mao C., Wang Y.-X. RNF34 is a cold-regulated E3 ubiquitin ligase for PGC-1 and modulates Brown fat cell metabolism. Molecular and Cellular Biology. 2012;32(2):266–275. doi: 10.1128/mcb.05674-11. [DOI] [PMC free article] [PubMed] [Google Scholar]
- 57.Chen Q., Huang L., Pan D., Zhu L.J., Wang Y.X. Cbx4 sumoylates Prdm16 to regulate adipose tissue thermogenesis. Cell Reports. 2018;22(11):2860–2872. doi: 10.1016/j.celrep.2018.02.057. [DOI] [PMC free article] [PubMed] [Google Scholar]
- 58.Lyabin D.N., Eliseeva I.A., Ovchinnikov L.P. YB-1 protein: functions and regulation. Wiley Interdisciplinary Reviews: RNA. 2014:95–110. doi: 10.1002/wrna.1200. [DOI] [PubMed] [Google Scholar]
- 59.Lim J.P., Shyamasundar S., Gunaratne J., Scully O.J., Matsumoto K., Bay B.H. YBX1 gene silencing inhibits migratory and invasive potential via CORO1C in breast cancer in vitro. BMC Cancer. 2017;17(1) doi: 10.1186/s12885-017-3187-7. [DOI] [PMC free article] [PubMed] [Google Scholar]
- 60.Somasekharan S.P., El-Naggar A., Leprivier G., Cheng H., Hajee S., Grunewald T.G.P. YB-1 regulates stress granule formation and tumor progression by translationally activating G3BP1. Journal of Cell Biology. 2015;208(7):913–929. doi: 10.1083/jcb.201411047. [DOI] [PMC free article] [PubMed] [Google Scholar]
- 61.Buerger F., Müller S., Ney N., Weiner J., Heiker J.T., Kallendrusch S. Depletion of Jmjd1c impairs adipogenesis in murine 3T3-L1 cells. Biochimica et Biophysica Acta - Molecular Basis of Disease. 2017;1863(7):1709–1717. doi: 10.1016/j.bbadis.2017.05.011. [DOI] [PubMed] [Google Scholar]
- 62.Lynch J.R., Salik B., Connerty P., Vick B., Leung H., Pijning A. JMJD1C-mediated metabolic dysregulation contributes to HOXA9-dependent leukemogenesis. Leukemia. 2019;33(6):1400–1410. doi: 10.1038/s41375-018-0354-z. [DOI] [PubMed] [Google Scholar]
- 63.Viscarra J.A., Wang Y., Nguyen H.P., Choi Y.G., Sul H.S. Histone demethylase JMJD1C is phosphorylated by mTOR to activate de novo lipogenesis. Nature Communications. 2020;11(1) doi: 10.1038/s41467-020-14617-1. [DOI] [PMC free article] [PubMed] [Google Scholar]
- 64.Sambeat A., Gulyaeva O., Dempersmier J., Sul H.S. Epigenetic regulation of the thermogenic adipose program. Trends in Endocrinology and Metabolism. 2017:19–31. doi: 10.1016/j.tem.2016.09.003. [DOI] [PMC free article] [PubMed] [Google Scholar]
- 65.Inagaki T., Tachibana M., Magoori K., Kudo H., Tanaka T., Okamura M. Obesity and metabolic syndrome in histone demethylase JHDM2a-deficient mice. Genes to Cells. 2009;14(8):991–1001. doi: 10.1111/j.1365-2443.2009.01326.x. [DOI] [PubMed] [Google Scholar]
- 66.Abe Y., Rozqie R., Matsumura Y., Kawamura T., Nakaki R., Tsurutani Y. JMJD1A is a signal-sensing scaffold that regulates acute chromatin dynamics via SWI/SNF association for thermogenesis. Nature Communications. 2015;6 doi: 10.1038/ncomms8052. [DOI] [PMC free article] [PubMed] [Google Scholar]
- 67.Zha L., Li F., Wu R., Artinian L., Rehder V., Yu L. The histone demethylase UTX promotes brown adipocyte thermogenic program via coordinated regulation of H3K27 demethylation and acetylation. Journal of Biological Chemistry. 2015;290(41):25151–25163. doi: 10.1074/jbc.M115.662650. [DOI] [PMC free article] [PubMed] [Google Scholar]
- 68.Zeng X., Jedrychowski M.P., Chen Y., Serag S., Lavery G.G., Gygi S.P. Lysine-specific demethylase 1 promotes brown adipose tissue thermogenesis via repressing glucocorticoid activation. Genes and Development. 2016;30(16):1822–1836. doi: 10.1101/gad.285312.116. [DOI] [PMC free article] [PubMed] [Google Scholar]
- 69.Duteil D., Tosic M., Willmann D., Georgiadi A., Kanouni T., Schüle R. Lsd1 prevents age-programed loss of beige adipocytes. Proceedings of the National Academy of Sciences of the United States of America. 2017;114(20):5265–5270. doi: 10.1073/pnas.1702641114. [DOI] [PMC free article] [PubMed] [Google Scholar]
- 70.Takase R., Hino S., Nagaoka K., Anan K., Kohrogi K., Araki H. Lysine-specific demethylase-2 is distinctively involved in brown and beige adipogenic differentiation. FASEB Journal. 2019;33(4):5300–5311. doi: 10.1096/fj.201801422RR. [DOI] [PMC free article] [PubMed] [Google Scholar]
- 71.Park H., He A., Tan M., Johnson J.M., Dean J.M., Pietka T.A. Peroxisome-derived lipids regulate adipose thermogenesis by mediating cold-induced mitochondrial fission. Journal of Clinical Investigation. 2019;129(2):694–711. doi: 10.1172/JCI120606. [DOI] [PMC free article] [PubMed] [Google Scholar]
- 72.Zhang X., Li S., Zhou Y., Su W., Ruan X., Wang B. Ablation of cytochrome P450 omega-hydroxylase 4A14 gene attenuates hepatic steatosis and fibrosis. Proceedings of the National Academy of Sciences of the United States of America. 2017;114(12):3181–3185. doi: 10.1073/pnas.1700172114. [DOI] [PMC free article] [PubMed] [Google Scholar]
- 73.Suresh P.S., Tsutsumi R., Venkatesh T. YBX1 at the crossroads of non-coding transcriptome, exosomal, and cytoplasmic granular signaling. European Journal of Cell Biology. 2018:163–167. doi: 10.1016/j.ejcb.2018.02.003. [DOI] [PubMed] [Google Scholar]
- 74.Shurtleff M.J., Temoche-Diaz M.M., Karfilis K.V., Ri S., Schekman R. Y-box protein 1 is required to sort microRNAs into exosomes in cells and in a cell-free reaction. ELife. 2016;5(AUGUST) doi: 10.7554/eLife.19276. [DOI] [PMC free article] [PubMed] [Google Scholar]
- 75.Shurtleff M.J., Yao J., Qin Y., Nottingham R.M., Temoche-Diaz M.M., Schekman R. Broad role for YBX1 in defining the small noncoding RNA composition of exosomes. Proceedings of the National Academy of Sciences of the United States of America. 2017;114(43):E8987–E8995. doi: 10.1073/pnas.1712108114. [DOI] [PMC free article] [PubMed] [Google Scholar]
- 76.Mori M.A., Ludwig R.G., Garcia-Martin R., Brandão B.B., Kahn C.R. Extracellular miRNAs: from biomarkers to mediators of physiology and disease. Cell Metabolism. 2019:656–673. doi: 10.1016/j.cmet.2019.07.011. [DOI] [PMC free article] [PubMed] [Google Scholar]
- 77.de Souza-Pinto N.C., Mason P.A., Hashiguchi K., Weissman L., Tian J., Guay D. Novel DNA mismatch-repair activity involving YB-1 in human mitochondria. DNA Repair. 2009;8(6):704–719. doi: 10.1016/j.dnarep.2009.01.021. [DOI] [PMC free article] [PubMed] [Google Scholar]
- 78.Matsumoto S., Uchiumi T., Tanamachi H., Saito T., Yagi M., Takazaki S. Ribonucleoprotein Y-box-binding protein-1 regulates mitochondrial oxidative phosphorylation (OXPHOS) protein expression after serum stimulation through binding to OXPHOS mRNA. Biochemical Journal. 2012;443(2):573–584. doi: 10.1042/BJ20111728. [DOI] [PubMed] [Google Scholar]
- 79.Eden E., Navon R., Steinfeld I., Lipson D., Yakhini Z. GOrilla: A tool for discovery and visualization of enriched GO terms in ranked gene lists. BMC Bioinformatics. 2009 doi: 10.1186/1471-2105-10-48. [DOI] [PMC free article] [PubMed] [Google Scholar]
- 80.Supek F., Bošnjak M., Škunca N., Šmuc T. Revigo summarizes and visualizes long lists of gene ontology terms. PLoS One. 2011 doi: 10.1371/journal.pone.0021800. [DOI] [PMC free article] [PubMed] [Google Scholar]
Associated Data
This section collects any data citations, data availability statements, or supplementary materials included in this article.
Supplementary Materials
Figure S1. Proteomic regulation by acute and chronic cold in scWAT (related toFigure 1). (A) Experimental workflow; the control and experimental mice groups were kept in a room set to 29 °C to acclimate to thermoneutrality for three weeks. The experimental mice were then moved to an incubator set to 5 °C and kept for 3, 8, or 24 h, 1 week, or 3 weeks before dissection. (B) R-squared correlation numbers shown on a multi-scatter plot indicating that the major parts of the browning program had been elicited after 1 week of cold induction. (C) Significantly regulated proteins from the fuzzy c-means clusters 1, 2, 4, and 7 (upregulated at 3–24 h) organized in known protein–protein interaction networks using STRING (Szklarczyk et al., 2015). Regulation of gene expression was the gene ontology with the highest enrichment using the selected protein list (represented in green). (D) Significantly regulated proteins from the fuzzy c-means clusters 2, 7, and 8 (upregulated at 1–3 weeks) organized in known protein–protein interaction networks using STRING. The oxidation/reduction molecular process was the gene ontology with the highest enrichment using the selected protein list (represented in green). Figure S2. YBX1 is a transcriptional regulator acutely upregulated in response to cold in scWAT (related toFigure 2). (A) STRING network representation of the acutely significantly regulated proteins associated with chromatin function. The line thickness indicates the strengths of confidence for interactions (using the STRING algorithm). YBX1 (marked with a green border) was closely associated with heterogeneous nuclear ribonucleoproteins and proteins involved in RNA splicing and processing. (B) Volcano plot of all of the chromatin-related proteins plotted using the log2-fold change (x axis) and -log2 t-test p value (y axis) of protein abundance ratios (3–24 h vs 0 h). (C) YBX1 protein abundance values from MS data represented as fold changes normalized to 0 h control. N = 4 replicates per condition and values are the mean ± SEM. ∗∗p < 0.001 analyzed by one-way ANOVA with Bonferroni's multiple comparisons test. (D) Histological analysis of scWAT from mice kept either on thermoneutrality (29 °C) or cold (5 °C) for 24 h. scWAT was stained with hematoxylin and eosin or YBX1 fluorescent antibody (red) together with DAPI (blue). Tissue autofluorescence is shown in white. Three mice per group are shown, and the scale bars represent 1000 μm. Figure S3. YBX1 is a regulator of early adipogenesis that also functions as a commitment factor in thermogenic adipocytes (related toFigure 3). (A–B) The efficiency of Ybx1 KD in proliferating WT-1 brown preadipocytes 2 days before the induction of differentiation (d2) is shown and the effects of KD on the differentiation into mature brown adipocytes was evaluated by the expression of Fabp4, Fasn, and Adipoq. (C) The effects of Ybx1 KD on d0 in WT-1 cells is shown on differentiation (assessed by Fabp4, Fasn, and Adipoq expression levels). (D–F) The efficiency and effects of siRNA-mediated KD of Ybx1 in differentiating brown adipocytes (d2) on differentiation (assessed by Fabp4, Fasn, and Adipoq expression levels) and on thermogenic gene expression (assessed by Ucp1, Ppargc1a, and Cidea levels) are shown. (G) The effects of Ybx1 KD on day 0 in C3H/10T1/2 cells is shown on differentiation (assessed by Fabp4, Fasn, and Adipoq expression levels). For all of the panels in this figure, n = 4 biological replicates were used and the values represent means ± SEM. ∗p < 0.05, ∗∗p < 0.01, and ∗∗∗p < 0.001 analyzed by 2-way ANOVA with Bonferroni's multiple comparisons. Figure S4. Effect of Ybx1 overexpression on cell proliferation, differentiation, mitochondrial DNA content, and mitochondrial function (related toFigure 4). C3H/10T1/2-CRISPRa-SAM cells were transfected with empty vector (EV) or vector delivering a single-guide RNA directed to the promoter regions of Pparg2 (P) or Ybx1 (Y) or in combination (PY). (A–B) Two days post-transfection, a proliferation assay (MTT assay) was performed in preadipocytes or confluent cells; 20% FBS or no FBS was included as positive and negative controls, respectively. (C–D) Gene expression analysis of differentiation markers Fasn, Fabp4, and Adipoq and Ucp1. Data are based on n = 3 biological replicates and the values are mean ± SEM. ∗p < 0.05, ∗∗p < 0.01, and ∗∗∗p < 0.001 analyzed by 2-way ANOVA; overall effects of the overexpression and differentiation day are shown for selected groups of interest (P vs EV; P vs PY). (E) C3H/10T1/2-CRISPRa-SAM cells were transfected before confluency with vectors delivering a single-guide RNA directed to the promoter regions of Pparg2 or Pparg2 + Ybx1. On day 6 of differentiation, the mitochondrial DNA content was assessed. Values are mean ± SEM. ∗p < 0.05 analyzed by the unpaired t-test. (F–G) C3H/10T1/2-CRISPRa-SAM cells were transfected before confluency with vectors delivering a single-guide RNA directed to the promoter regions of Pparg2 or Pparg2 + Ybx1. On day 6 of differentiation, the Mito stress test (oligomycin, FCCP, and rotenone/antimycin A) was performed in the Seahorse machine and calculations were conducted using the Seahorse report generator. Data are based on n = 3 biological replicates. Figure S5. Early changes in gene expression induced by Co-expression of Ybx1 with Pparg2 in differentiating C3H/10T1/2-SAM cells (related toFigure 5). (A) Heat map of fold changes (FC) induced by Pparg2-targeted (P) differentiation or additive effects by Ybx1 co-expression (PY). Clustering analysis identified 2 major clusters specific to either day 0 (non-differentiated cells) or days 2 and 4 (committed adipocytes). (B) Over-representation analysis using the Reactome Pathway database on clusters 1 and 2 confirming differentiation stage-specific gene clusters and enrichment in corresponding cellular processes such as cell cycle processes in cells harvested on day 0 (cluster 1) and metabolic processes in differentiated adipocytes on day 4 (cluster 2). (C) Relative abundance of differentiation-related genes such as Pparg, Adipoq, Cebpa, Fabp4, and Plin1 confirmed the lack of differences in differentiation levels of Pparg2 (P) or Pparg2 + Ybx1 (PY) over-expressing cells, together with induction of specific genes such as Jmjd1c, Fbxo33, Cyp4a14, and Hsd17b4 in Pparg2 + Ybx1 (PY) over-expressing cells compared to EV controls and Pparg2 over-expressing cells (P), respectively. Data are expressed as log2-fold changes based on CPMs with an FDR cut-off of 0.1. (D) The mRNA levels of Gpnmb, Hsd17b4, Fbxo33, Krt8, and Serpinb6b in scWAT from mice kept either at thermoneutrality (29 °C) or exposed to cold (5 °C) for 3 or 7 days. N = 3 replicates were used and values are the mean ± SEM. ∗p < 0.05 and ∗∗p < 0.001 analyzed by one-way ANOVA with Bonferroni's multiple comparisons test. Figure S6. Key pathways upregulated by Ybx1 to promote higher metabolic activity of beige adipocytes (related toFigure 5). CNET plot depicting the linkages of genes and biological concepts (GO terms) as a network. Log2-fold changes (PY vs P on d4) of gene expression within selected enrichments.
Table S1: TMT quantification of the proteome (related to Figure 1). The table includes the UniProt accession number of all of the quantified proteins with a brief description. The log2 transformed and normalized TMT quantification at the 6 time points is shown. The average and standard deviation was calculated for five biological replicates.
Table S2: Regulation of proteins in response to cold (related to Figure 1). The table includes the UniProt accession number of all of the regulated proteins with a brief description. The average and standard deviation was calculated for five biological replicates and parametric (ANOVA) and non-parametric (Kruskal-Wallis) statistical p values were used for statistics.
Table S3: Clustering of regulated proteins (related to Figure 1). Clustering performed with the fuzzy c-means algorithm developed by Schwämmle et al. (Schwämmle and Jensen, 2010) and the clustering membership's significance. This significant membership value was defined as “true” when the protein belonged to one cluster with a significantly higher membership compared to another cluster. Those marked as “false” were still associated with the cluster with the most similar centroids but potentially belonged to other clusters. To simplify, clusters of proteins upregulated and downregulated in response to acute and chronic cold exposure were pooled in the same column.
Table S4: Proteins involved in the regulation of gene expression were highly upregulated in response to acute cold exposure (related to Figure 2). The table provides the UniProt accession number, gene ID, and a brief description of 44 proteins known to be involved in regulating the gene expression identified in our MS dataset that were upregulated in response to acute cold exposure. The cluster number is provided to show the exact regulation pattern the proteins followed in response to cold exposure.
Table S5: Differential gene expression dataset (related to Figure 5). The Excel Workbook contained 28 data sheets with the results of differential gene expression (DGE) analysis. The first sheet called “README” contained the details, explanation of contrasts, and acronyms for each comparison. The remaining data sheets only contained the results of DGE analysis.
Table S6: Regulated biological processes in Pparg2 vs Pparg2+ Ybx1 cells in differentiating adipocytes (related to Figure 5). Gene set enrichment analysis (GSEA) identified differentially regulated (up/down) biological processes in Pparg2 vs Pparg2 + Ybx1 cells on different days (d0, d2, and d4) following induction of adipocyte differentiation. The table indicates the subset of genes contributing most to the GO term.
Table S7: List of primer sequences used for quantitative PCR-based gene expression analysis. The forward and reverse primer sequences are provided for each gene.
Data Availability Statement
All of the proteomics data from this study were submitted to the Chorus database (http://chorusproject.org) as project no. 1505. The RNA sequencing datasets generated during this study are available at GEO (accession number GSE149083).