

Abstract
A new coronavirus has been implicated as the causative agent of severe acute respiratory syndrome (SARS). We have used convalescent sera from several SARS patients to detect proteins in the culture supernatants from cells exposed to lavage another SARS patient. The most prominent protein in the supernatant was identified by matrix-assisted laser desorption/ionization time-of-flight mass spectrometry (MALDI-TOF MS) as a ∼46-kDa species. This was found to be a novel nucleocapsid protein that matched almost exactly one predicted by an open reading frame in the recently published nucleotide sequence of the same virus isolate (>96% coverage). A second viral protein corresponding to the predicted ∼139-kDa spike glycoprotein has also been examined by MALDI-TOF MS (42% coverage). After peptide N-glycosidase F digestion, 12 glycosylation sites in this protein were confirmed. The sugars attached to four of the sites were also identified. These results suggest that the nucleocapsid protein is a major immunogen that may be useful for early diagnostics, and that the spike glycoprotein may present a particularly attractive target for prophylactic intervention in combating SARS.
The recent clinical identification of a novel type of atypical pneumonia without a clearly defined etiology, together with epidemiological evidence of high transmissibility, have provoked the World Health Organization to issue a rare travel advisory. The new entity has been called severe acute respiratory syndrome (SARS)1 ; it apparently began in Guangdong province in China in November of 2002 and has since spread to Hong Kong, Singapore, Vietnam, Canada, the U.S., Taiwan, and several European countries.
The outbreak in Canada began in late February 2003 in a traveler returning from Hong Kong whose exposure was to the index case in the Hong Kong epidemic (a physician who had cared for SARS cases in Guangdong province in the People's Republic of China). The Canadian index case died 9 days after the disease onset, and a 43-year-old male relative became ill 2 days after exposure and died of the adult respiratory distress syndrome 15 days after the illness began (1). Subsequently, Canada has faced the largest SARS outbreak outside of Asia, with at least 351 probable or suspected cases and 27 deaths, mostly in the Toronto area (2, 3).
Samples from patients with suspected or probable SARS in Canada have been referred to the National Microbiology Laboratory (NML), Health Canada, for laboratory diagnostics. This laboratory, part of the Canadian Science Centre for Human and Animal Health, is Canada's national reference center for infectious diseases and houses the only Class 4 containment facilities in the country. NML has played an active role in an intensive international collaborative effort among 11 laboratories around the world that suggested a distinct coronavirus may be etiologically involved. In particular, the laboratory prepared the nucleotide samples for the first successful effort to determine the genome sequence for the coronavirus (4), a result soon confirmed by several other laboratories (see, for example, Ref. 5).
Nevertheless, the genome sequence merely provides a template for the construction of the viral proteins. Thus, an alternative strategy is to examine the proteins themselves, and mass spectrometry has proved to be an efficient tool for this purpose (6). The University of Manitoba time-of-flight mass spectrometry laboratory has already been active in characterizing viral proteins (7, 8, 9, 10, 11), so it was natural for NML to enlist the university laboratory (late in March) as a collaborator in the analysis of the SARS proteins. The first results of this collaboration are described below.
EXPERIMENTAL PROCEDURES
Preparation of the Primary Material at NML—
Clinical specimens obtained from the original case cluster were extensively investigated for the presence of bacterial and viral pathogens (1). Nasopharyngeal swab and bronchoalveolar lavage fluids from several of these patients were found to be positive by reverse transcription-PCR for human metapneumovirus and the novel coronavirus (1). Inoculation of the bronchoalveolar lavage fluid from the 43-year-old male patient in Vero E6 cells produced a strong cytopathic effect on day 4 after infection. The second passage of this viral isolate was further used to produce large quantities of the virus. Initially, this virus material was used to assess its antigenicity with convalescent serum samples from SARS patients. The convalescent sera that were previously found to be positive for antibodies to the virus by indirect immunofluorescence assay2 strongly reacted in Western blot with a ∼46-kDa protein (Fig. 1 A) similar in size to the nucleocapsid protein of coronaviruses (12).
Fig. 1.
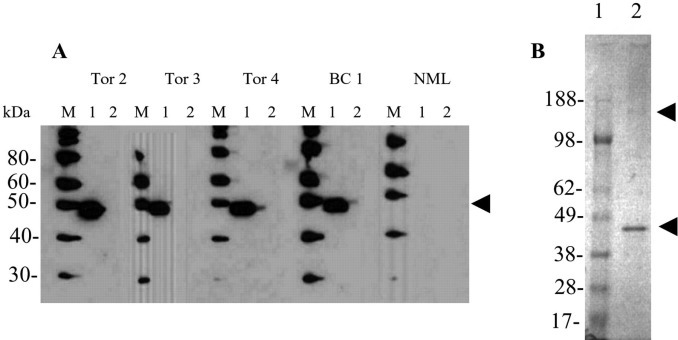
Analysis of proteins from a new coronavirus associated with SARS.A, Viral particles pelleted from the supernatant of vero E6 cells exposed to samples derived from patients with SARS (lane 1) or from mock-infected cells processed in a similar fashion (lane 2) were separated by SDS-PAGE and analyzed by Western blot with convalescent sera from SARS patients (Tor 2, Tor 3, Tor 4, and BC 1) or a control serum from a noninfected donor (NML). The sera from the patients, but not the control, reacted with a 44- to 48-kDa species present in the supernatants from the infected but not the mock-treated cultures (indicated by arrowhead). B, A virus sample similar to that described in A was fractionated on a sucrose gradient. The fraction containing immunoreactive material was separated on a 4–12% bis acrylamide gradient gel and stained with colloidal Coomasie blue. A prominent band with an apparent molecular mass of 44–48 kDa was observed along with much less intense band at ∼180 kDa (indicated by arrowheads). These bands were excised and used for the mass spectrometric studies described in this report.
In order to prepare this (and perhaps other SARS-related proteins) for proteolytic digestion, the virus was purified by 20–60% linear sucrose gradient. Western blotting of the gradient fractions showed that fraction 4 (density, 1.18g/cm3) reacted strongly with a convalescent serum from a SARS patient. This fraction was run on a Novex 4–12% Bis-Tris gel in 4-morpholinepropanesulfonic acid running buffer (Invitrogen), and stained with Coomassie blue (Fig. 1 B). Two bands were then excised from the gel (indicated by arrowheads), one containing the prominent ∼46-kDa protein and the other containing a much weaker protein band with an apparent mass of ∼180 kDa. These were transferred to the university laboratories for in-gel digestion with various proteolytic enzymes.
Proteolytic Digestions—
The excised protein bands were in-gel digested with one of three different enzymes (sequencing grade-modified trypsin (Promega, Madison, WI), Lys-C, or Asp-N (both from Roche Molecular Biochemicals)). Digestions were performed according to the procedure described by Shevchenko et al. (13) either in ordinary water or else in a 1:1 H2 16O:H2 18O mixture (14, 15, 16) prepared from 98% H2 18O (Isotec, Miamisburg, OH) and ordinary water. Unless otherwise noted, all other chemicals were purchased from Sigma.
The extracts containing the peptide mixture were lyophilized and resuspended in 5.5 μl of 0.5% trifluoroacetic acit in water, then 0.5 μl of the resulting sample was mixed 1:1 with 2,5-dihydroxybenzoic acid (150 mg/ml in water:acetonitrile 1:1) matrix solution and deposited on the gold surface of a matrix-assisted laser desorption/ionization (MALDI) target. The remaining 5 μl was separated into fractions by micro-high-performance liquid chromatography (μHPLC), and the individual fractions were deposited on a target for subsequent mass spectrometric analysis.
Chromatography—
Chromatographic separations were performed using an Agilent 1100 Series system (Agilent Technologies, Wilmington, DE). Deionized (18 mΩ) water and HPLC-grade acetonitrile were used for the preparation of eluents. Samples (5 μl) were injected onto a 150 μm × 150 mm column (Vydac 218 TP C18, 5μ; Grace Vydac, Hesperia, CA) and eluted with a linear gradient of 1–80% acetonitrile (0.1% trifluoroacetic acid) in 60 min. The column effluent (4 μl/min) was mixed on-line with dihydroxybenzoic acid matrix solution (0.5 μl/min) and deposited by a small computer-controlled robot onto a movable gold target at 1-min intervals (17). The vast majority of the tryptic fragments were eluted within 40 min under the HPLC condition used, so 40 fractions were normally collected.
Glycoprotein Analysis—
Our original intention was to postpone any detailed analysis of the higher mass protein to a subsequent investigation. Later, when we decided to include this effort in the present measurements, the only materials that we had available were two lyophilized samples from digests of the larger protein (∼180-kDa band), one from a tryptic digest and one from a Lys-C digest. The sample from the tryptic digest was separated by HPLC and used for analysis of the glycosylated peptides. The sample from the Lys-C digest was digested twice more, first by peptide N-glycosidase F (PNGase F; Roche Molecular Biochemicals) to remove the asparagine-linked glycosylation (18), then by trypsin to produce smaller fragments (both digestions in ordinary water).
TOF Mass Spectrometry—
The spots on the gold targets were analyzed individually, both by single mass spectrometry (MS) and by tandem mass spectrometry (MS/MS) in the Manitoba/Sciex prototype quadrupole/TOF (QqTOF) mass spectrometer (subsequent commercial model sold as QSTAR by Applied Biosystems/MDS Sciex, Foster City, CA) (19). In this instrument, ions are produced by irradiation of the target with photon pulses from a 20-Hz nitrogen laser (VSL 337ND, Spectra-Physics, Mountain View, CA) with 300 μJ energy per pulse. Orthogonal injection of ions from the quadrupole into the TOF section normally produce a mass resolving power 10,000 full-width half-maximum and accuracy within a few millidaltons in the TOF spectra in both MS and MS/MS modes, as long as the ion peak is reasonably intense.
RESULTS
Mass Spectra from Proteolytic Digests of the ∼46-kDa Protein—
Fig. 2 A shows the m/z spectrum of the mixture of peptides resulting from tryptic digestion of the ∼46-kDa protein in ordinary water, before HPLC fractionation. Note that Tx-y indicates a tryptic fragment containing amino acid residues x to y in Fig. 2 and in subsequent tables and discussion. A small region of this spectrum is expanded in Fig. 2 B, and an HPLC fraction containing some of the same ions is shown in Fig. 2 C. Here, the most intense ion in Fig. 2 B has moved to a different fraction, but some of the weaker ions are much more prominent. It is clear that individual peptide peaks are considerably easier to distinguish after HPLC separation; spectra of the fractions are dramatically simpler and have a signal-to-noise ratio improved by a factor ∼10 or more.
Fig. 2.
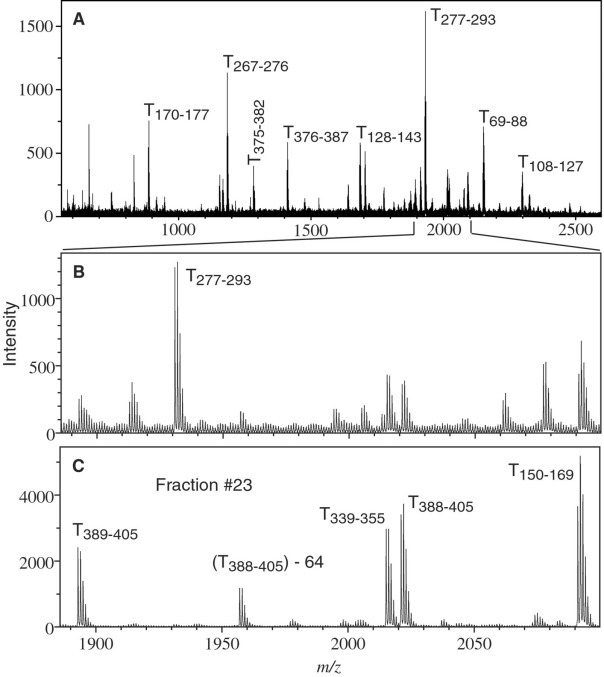
A, Single MS MALDI-QqTOF spectrum of the peptide mixture obtained from tryptic digestion of the 46-kDa protein prior to HPLC fractionation. B, Expanded view of a small section of the MALDI mass spectrum in A. C, The same section of the spectrum obtained from fraction 23, after HPLC separation of the mixture. The peak labels indicate the residue numbers corresponding to the intact protein; in one case loss of 64 Da is indicated. The intense peak corresponding to T277–293 in the mixture is absent in fraction 23 (it elutes in fraction 21), but several weaker peaks that are present, like T389–405, are significantly enhanced by the HPLC. The improvement helps to identify them and is essential for high mass accuracy and for subsequent MS/MS analysis. Measured and predicted masses for all the tryptic peptides can be found in Table II; Δm is less than 10 mDa in nearly every case.
Initial efforts to identify the protein (based on data base searching against the peptide fingerprint), failed to yield any significant matches, suggesting that it was a novel protein. De novo peptide sequencing was therefore undertaken in order to characterize it. For this purpose, samples were digested in the presence of a 50/50 mixture of ordinary water and H2 18O, as described above, because the addition of either 18O or 16O during enzymatic cleavage yields spectra containing both species and thus distinguishes fragments containing the C terminus from those containing the N terminus by their distinctive isotopic patterns (14, 15, 16). In order to determine the amino acid sequence of the proteolytic fragments, each clearly observed peptide ion was selected in turn as a parent by the mass-selecting quadrupole of the QqTOF instrument and subjected to collisionally induced dissociation in the collision cell. For example, the resulting daughter ion spectrum from the m/z = 2297 parent is shown in Fig. 3 , where the advantages of the 16O/18O addition for distinguishing the C- and N-terminal ions are clearly evident. The y ions, which contain the C terminus, all show the doublet structure superimposed on the usual isotopic pattern, whereas the b ions, containing the N terminus, have a normal pattern. A comparison between the measured m/z values and the masses calculated from the deduced sequence is given in Table I .
Fig. 3.
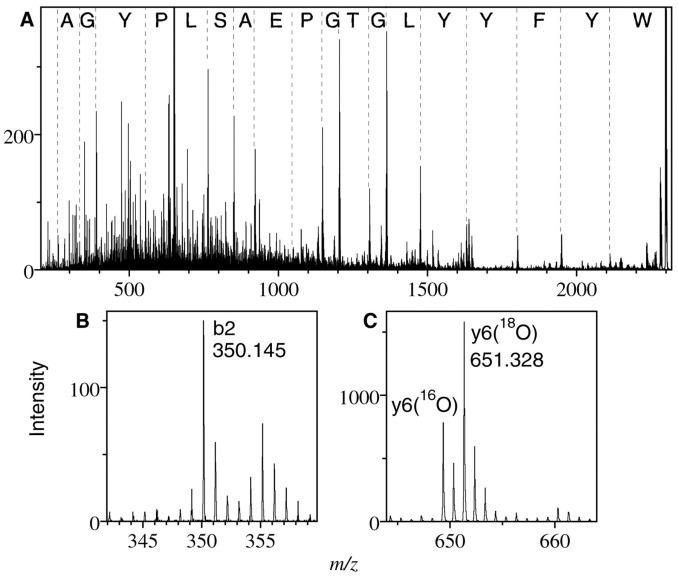
MS/MS spectrum of tryptic fragment of m/z 2297 after digestion in a 50/50 mixture of normal and 18O-labeled water. The complete spectrum is shown in A, with the amino acid sequence indicated between the y-series fragments. An example of a b-series fragment is shown in B, and of a y-series fragment in C. The signature isotopic pattern of fragments containing the C terminus is visible in C. The measured and predicted masses for all identified peaks are shown in Table I.
Table I.
Calculated and measured masses for b and y ions from MS/MS measurements of the 2297.092-Da tryptic fragment
| y-ion | m/z found | MH+ calculated | Δm (mDa) | Residue | Δm (mDa) | m/z found | MH+ calculated | b-ion |
|---|---|---|---|---|---|---|---|---|
| y1 | – | 147.113 | – | K | 2 | 2279.083 | 2279.081 | b20 |
| y2 | 261.138 | 261.156 | −18 | N | – | – | 2150.986 | b19 |
| y3 | 332.193 | 332.193 | 0 | A | – | – | 2036.943 | b18 |
| y4 | 389.197 | 389.215 | −18 | G | – | – | 1965.906 | b17 |
| y5 | 552.283 | 552.278 | 5 | Y | 0 | 1908.885 | 1908.885 | b16 |
| y6 | 649.328 | 649.331 | −3 | P | −13 | 1745.809 | 1745.822 | b15 |
| y7 | 762.413 | 762.415 | −2 | L | 21 | 1648.790 | 1648.769 | b14 |
| y8 | 849.438 | 849.447 | −9 | S | 8 | 1535.694 | 1535.685 | b13 |
| y9 | 920.478 | 920.484 | −6 | A | −15 | 1448.638 | 1448.653 | b12 |
| y10 | 1049.522 | 1049.526 | −4 | E | 19 | 1377.637 | 1377.616 | b11 |
| y11 | 1146.571 | 1146.579 | −8 | P | – | – | 1248.573 | b10 |
| y12 | 1203.592 | 1203.601 | −9 | G | −4 | 1151.516 | 1151.520 | b9 |
| y13 | 1304.636 | 1304.648 | −8 | T | −5 | 1094.494 | 1094.499 | b8 |
| y14 | 1361.654 | 1361.670 | −16 | G | 1 | 993.452 | 993.451 | b7 |
| y15 | 1474.739 | 1474.754 | −15 | L | −21 | 936.409 | 936.430 | b6 |
| y16 | 1637.818 | 1637.817 | 1 | Y | 11 | 823.357 | 823.346 | b5 |
| y17 | 1800.884 | 1800.881 | 3 | Y | 9 | 660.291 | 660.282 | b4 |
| y18 | 1947.970 | 1947.949 | 21 | F | 1 | 497.220 | 497.219 | b3 |
| y19 | 2111.022 | 2111.012 | 10 | Y | −5 | 350.145 | 350.150 | b2 |
| y20 | 2297.086 | 2297.092 | −6 | W | – | – | 187.087 | b1 |
Further examples are provided in the supplemental material. Fig. S1 shows the daughter ions from dissociation of the 1144-Da N-terminal peptide, indicating deletion of the N-terminal methionine and acetylation of the resulting N-terminal serine. Fig. S2 shows a comparison between HPLC-separated ions from tryptic and Lys-C digestions, respectively, showing alternate cleavages at adjacent lysines. Fig. S3 shows a spectrum of the parent ion containing the C terminus, the one C-terminal peptide that shows no doublet structure.
A comparison of experimental m/z values and masses calculated for the deduced sequences of all the peptides observed in tryptic digests is given in Table II . In both Tables I and II, most observed m/z values and the masses calculated for the deduced amino acid sequences agree within ∼10 mDa, lending credibility to the assignments; the anomalously high values observed for a few ions in Table I correspond to peaks of very low intensity.
Table II.
Measured m/z and calculated MH+ values of peptides found in tryptic digest of the 46-kDa protein
M* represents oxidized methionine residues; Ac-SDN...is the acetylated N-terminal of the protein; Q** represents the N-terminal Gln residues converted into pyro-Glu; and N*** represents an Asn residue converted into Asp due to deamidation
| m/z measured | MH+ calculated (Da) | Δm (mDa) | Residues start-end | Peptide sequence |
|---|---|---|---|---|
| 601.303 | 601.305 | −3 | 204–209 | GNSPAR |
| 601.322 | 601.331 | 1 | 103–107 | ELSPR |
| 698.357 | 698.358 | −1 | 144–149 | DHIGTR |
| 708.330 | 708.335 | −5 | 96–102 | GGDGKM*K |
| 711.333 | 711.331 | 2 | 294–299 | QGTDYK |
| 746.387 | 746.383 | 4 | 356–361 | HIDAYK |
| 749.354 | 749.354 | 0 | 178–185 | GGSQASSR |
| 805.378 | 805.380 | −2 | 196–203 | NSTPGSSR |
| 831.462 | 831.457 | 5 | 227–233 | LNQLESK |
| 876.452 | 876.461 | −9 | 101–107 | M*KELSPR |
| 886.401 | 886.406 | −5 | 170–177 | GFYAEGSR |
| 916.478 | 916.478 | 0 | 362–369 | TFPPTEPK |
| 928.543 | 928.546 | −3 | 348–355 | DNVILLNK |
| 946.513 | 946.511 | 2 | 62–68 | EELRFPR |
| 1105.548 | 1105.553 | −5 | 339–347 | LDDKDPQFK |
| 1144.493 | 1144.499 | −6 | 1–10 | Ac-SDNGPQSNQR |
| 1154.579 | 1154.580 | −1 | 376–385 | TDEAQPLPQR |
| 1166.557 | 1166.559 | −2 | 267–276 | Q**YNVTQAFGR |
| 1183.589 | 1183.586 | 3 | 267–276 | QYNVTQAFGR |
| 1202.610 | 1202.613 | −3 | 238–248 | GQQQQGQTVTK |
| 1282.678 | 1282.675 | 3 | 375–385 | KTDEAQPLPQR |
| 1330.698 | 1330.708 | −10 | 238–249 | GQQQQGQTVTKK |
| 1410.774 | 1410.771 | 3 | 376–387 | KKTDEAQPLPQR |
| 1611.698 | 1611.692 | 6 | 406–421 | QLQNSM*SGASADSTQA |
| 1684.895 | 1684.891 | 4 | 128–143 | EGIVWVATEGALNTPK |
| 1687.898 | 1687.905 | −7 | 210–226 | MASGGGETALALLLLDR |
| 1703.897 | 1703.900 | −3 | 210–226 | M*ASGGGETALALLLLDR |
| 1774.838 | 1774.836 | 2 | 278–293 | GPEQTQGNFGDQDLIR |
| 1850.833 | 1850.827 | 6 | 15–32 | ITFGGPTDSTDNNQNGGR |
| 1851.814 | 1850.811 | 3 | 15–32 | ITFGGPTDSTDNNQN***GGR |
| 1875.879 | 1875.879 | 0 | 389–405 | Q**PTVTLLPAADM*DDFSR |
| 1892.905 | 1892.906 | −1 | 389–405 | QPTVTLLPAADM*DDFSR |
| 1930.944 | 1930.937 | 7 | 277–293 | RGPEQTQGNFGDQDLIR |
| 2005.008 | 2005.006 | 2 | 388–405 | KQPTVTLLPAADMDDFSR |
| 2015.081 | 2015.081 | 0 | 339–355 | LDDKDPQFKDNVILLNK |
| 2021.005 | 2021.001 | 4 | 388–405 | KQPTVTLLPAADM*DDFSR |
| 2077.048 | 2077.043 | 5 | 320–338 | IGM*EVTPSGTWLTYHGAIK |
| 2091.126 | 2091.120 | −2 | 150–169 | NPNNNAATVLQLPQGTTLPK |
| 2151.002 | 2151.010 | 6 | 69–88 | GQGVPINTNSGPDDQIGYYR |
| 2252.062 | 2252.071 | −9 | 300–319 | HWPQIAQFAPSASAFFGMSR |
| 2297.078 | 2297.092 | −14 | 108–127 | WYFYYLGTGPEASLPYGANK |
| 2307.128 | 2307.111 | 17 | 69–89 | GQGVPINTNSGPDDQIGYYRR |
| 2324.187 | 2324.190 | −3 | 41–61 | RPQGLPNNTASWFTALTQHGK |
| 2516.325 | 2516.339 | −14 | 210–233 | M*ASGGGETALALLLLDRLNQLESK |
The MS and MS/MS measurements just described were applied first to the peptides resulting from tryptic digests of the gel band, listed in Table I, and then to the products of a Lys-C digest. BLAST searching (20, 21) of the total GenBank™ protein data base with these peptides was then undertaken in order to search for homology. The most definitive example was provided by the 2297-Da tryptic peptide. In that case, the highest rated results of the BLAST search are shown in Fig. 4 ; all are coronavirus nucleocapsid proteins, and all yield BLAST scores of 40 to 41, with E values of 0.003. Moreover, the highest rated hit in the BLAST search that is not a coronavirus protein (a bacterial protein, in this case) had a score of only 29 and a high E value of 9.4. Thus, the ∼46-kDa protein is clearly a coronavirus nucleocapsid protein; indeed, there is complete agreement between the first 10 residues and those found by BLAST in a region of the coronaviruses that is highly conserved. On the other hand, only three out of the next nine residues agree with any of the other viruses, so the SARS virus is significantly different from any of the other coronaviruses. BLAST searches with the other peptides led to similar conclusions; in particular, they strengthened the evidence for significant differences between the SARS coronavirus and any other coronavirus in the data base.
Fig. 4.
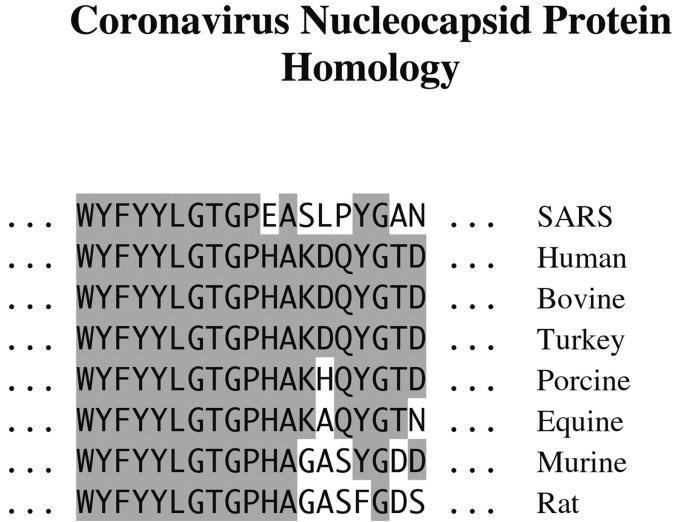
Comparison of the amino acid sequence of the 2297-Da peptide (deduced de novo from MS and MS/MS measurements) with the partly homologous regions of other coronaviruses. The shaded regions indicate areas of identity.
By April 12, these measurements had been carried out and most of them analyzed, yielding almost complete sequence information on the individual peptides, as summarized in Table II. The task of fitting together the peptides was not yet done, however, because there were still a number of ambiguities in their order. To sort out this problem, an Asp-N digestion had also been carried out (but not yet separated on the HPLC), and Glu-C and perhaps Arg-C digestions were planned as soon as sufficient material was available. However, these measurements turned out to be unnecessary, because at that stage a nucleotide sequence of infectious material (also prepared by NML), was obtained by a group at the Michael Smith Genome Centre in Vancouver (4) (GenBank™ accession number AY274119), soon followed by similar results from several other laboratories (see for example Ref. 5).
It soon became clear to us that the open reading frame identified by the Vancouver group as specifying the coronavirus nucleocapsid protein did in fact predict the amino acid sequence of the ∼46-kDa protein that we were analyzing, as might be expected from the BLAST homology reported above. Consequently, we were able to remove the remaining ambiguities in ordering the proteolytic fragments listed in Table II. A comparison of our results with the predicted sequence is shown in Fig. S4A; the mass spectral data cover more than 96% of the predicted sequence and include both C and N termini. The mass spectra also indicate removal of the N-terminal methionine and oxidation of all other methionines, as well as acetylation of the resulting N-terminal serine, as shown in Fig. S1. The N-terminal deletion and acetylation presumably occur as a result of post-translational modifications (22), which of course could not be predicted by the nucleotide data. Otherwise, our results confirm the predicted sequence (GenBank™ accession number AY274119), a result consistent with the samples being derived from the same infectious source at NML.
Mass Spectra from Proteolytic Digests of the Spike Protein—
In addition to the almost completely defined ∼46-kDa protein, we have partially characterized a protein that appeared as a very weak band at an apparent mass of ∼180 kDa in the gel separation (Fig. 1 B). Despite the low intensity, 39 peptides in the initial tryptic digest were found to belong to the ∼139-kDa “spike protein” predicted by the nucleotide sequence (GenBank™ accession number AY274119), and 36 of these were sufficiently intense for MS/MS measurements, which confirmed the identification (30% coverage). A summary of the data and the coverage for this protein is given in Table S1.
This protein is homologous to spike proteins in other coronaviruses, which contain a large number of potential glycosylation sites (NXT or NXS). Thus, they are usually assumed to be extensively glycosylated and to act as attachment proteins. Indeed, the predicted sequence of the spike protein of the SARS coronavirus contains 23 of these potential N-glycosylation sites, of which 17 are identified as likely sites by the Netglyc 1.0 server (available at www.cbs.dtu.dk/services/NetNGlyc). (O-glycosylation may also be possible, but has not been examined here.)
To investigate glycosylation in the spike protein, a tryptic digest was treated with PNGase F to remove the glycans, as described above. This step converts asparagine residues to aspartic acids, thus specifying the corresponding deglycosylated peptides through observation of their mass differences of 0.984 Da per deglycosylated site from the values calculated from the predicted amino acid sequence. This procedure identified nine glycopeptides from observation of their deglycosylated products (Table III ) and raised the sequence coverage to 42%. MS/MS measurements on the deglycosylated peptides confirmed the predicted single N-glycosylation sites and showed that T111–126, T316–333, and T1140–1163 had two glycosylation sites each (Table III). For example, PNGase digestion produced two distinct deglycosylated peptides for T111–126, with molecular ions at m/z 1758 and 1759. MS/MS measurements on the m/z 1758 ion revealed that the parent was glycosylated on Asn119 only, but similar measurements on the m/z 1759 ion showed that both Asn118 and Asn119 were glycosylated in this parent. Another example is presented in Fig. S5, which shows MS and MS/MS spectra of the deglycosylated peptide T222–232, although this experiment did not produce details on the exact nature and composition of the N-glycans. We note that in these measurements no peptides were observed containing possible sites that were not glycosylated, suggesting that some of the other sites may also be modified by glycosylation.
Table III.
Deglycosylated peptides found in PNGase F-treated tryptic digest of 139-kDa spike protein
Bold N symbols represent deglycosylated sites.
| Peptide | Sequence | Calc. [M+H]+ with no glycosylation | m/z measured after PNGase | Δm | No. of sites |
|---|---|---|---|---|---|
| T111–126 | SQSVIIINNSTNVVIR SQSVIIINNSTNVVIR | 1756.992 | 1757.973 1758.963 | 0.981 1.971 | 1 2 |
| T222–232 | LPLGINITNFR | 1257.732 | 1258.715 | 0.983 | 1 |
| T226–287 | YDENGTITDAV DCSQNPLAELK | 2453.114 | 2454.101 | 0.987 | 1 |
| T316–333 | FPNITNLCPF GEVFNATK | 2069.017 | 2071.001 | 1.984 | 2 |
| T778–796 | YFGGFNFSQ ILPDPLKPTK | 2169.138 | 2170.121 | 0.983 | 1 |
| T1056–1068 | NFTTAPAICHEGK | 1445.685 | 1446.672 | 0.987 | 1 |
| T1074–1089 | EGVFVFNG TSWFITQR | 1887.939 | 1888.931 | 0.992 | 1 |
| T1140–1163 | NHTSPDVDLGDI SGINASVVNIQK | 2493.259 | 2495.23 | 1.971 | 2 |
| T1174–1187 | NLNESLIDLQELGK | 1585.844 | 1586.823 | 0.979 | 1 |
The tryptic digest of the spike protein without PNGase F deglycosylation yielded spectra of four of these glycopeptides that were intense enough (barely) for detailed analysis, as summarized in Table IV . Here the relatively large Δm values for the carbohydrate residues originate from peak distortions due to the low intensity. Problems in T226–287 were especially bothersome; there several glycoforms (indicated by asterisks in Table IV) were detected but could not be measured accurately because of a combination of weak signal and overlap with the 18O peak resulting from the previous labeling of the C terminus (see “Experimental Procedures”). Microheterogeneity was observed in all four glycopeptides, and each glycoform was assigned an N-linked glycan composition. Two peptides, T222–232 and T778–796, were found to have high-mannose substitution MxNy, whereas the other two (T111–126 and T226–287) showed complex glycan structures MxNyGzF; (M, mannose; N, N-acetylglucosamine; G, galactose; F, fucose), similar to the pattern observed in the bovine coronavirus hemagglutinin protein (23). These compositions each encompass more than one isomeric structure; some examples are given in Fig. 5 D. We note that some observed glycoforms may result from in-source fragmentation, which could be reduced by the use of electrospray ionization on the QqTOF instrument (24, 25) rather than MALDI, although the results suggest that such fragmentation is not an important factor in the present case (see below).
Table IV.
Glycosylated peptides found in tryptic digest of 139-kDa spike protein without treatment with PNGase F
Peptide symbols: N, first glycosylation site; N, second glycosylation site. Carbohydrate composition symbols: M, mannose; F, fucose; G, galactose; N, N-acetylglucosamine. *, m/z values could not be determined accurately (see text). **, Δm, measured - calculated mass.
| Peptide | Sequence | Calc., [M+H]+m/z | m/z measured glycopeptide | Residual carbohydrate mass | Carbohydrate composition | Calculated carbohydrate mass | Δm** | MS/MS glycopeptide |
|---|---|---|---|---|---|---|---|---|
| T111–126 | SQSVIIIN | 1756.992 | 3201.514 | 1444.522 | M3N4F | 1444.534 | −0.012 | |
| NSTNVV | 3404.572 | 1647.580 | M3N5F | 1647.613 | −0.033 | ✓ | ||
| IR | 3525.669 | 1768.677 | M3N4G2F | 1768.640 | 0.037 | |||
| 3566.670 | 1809.678 | M3N5GF | 1809.666 | 0.012 | ||||
| 3607.682 | 1850.690 | M3N6F | 1850.693 | −0.003 | ||||
| 3728.687 | 1971.695 | M3N5G2F | 1971.719 | −0.024 | ||||
| 3769.678 | 2012.686 | M3N6GF | 2012.745 | −0.059 | ||||
| 3890.761 | 2133.769 | M3N5G3F | 2133.772 | −0.003 | ||||
| 3931.793 | 2174.801 | M3N6G2F | 2174.798 | 0.030 | ||||
| 4093.818 | 2336.826 | M3N6G3F | 2336.859 | −0.025 | ✓ | |||
| 4255.844 | 2498.852 | M3N6G4F | 2498.904 | 0.052 | ||||
| 4296.905 | 2539.913 | M3N7G3F | 2539.930 | −0.017 | ||||
| T222–232 | LPLGINI | 1257.732 | 2636.215 | 1378.483 | M6N2 | 1378.476 | 0.007 | |
| TNFR | 2798.26 | 1540.528 | M7N2 | 1540.528 | 0.000 | |||
| 2960.306 | 1702.574 | M8N2 | 1702.581 | −0.007 | ||||
| 3122.373 | 1864.641 | M9N2 | 1864.634 | 0.007 | ✓ | |||
| T226–287 | YDENGT | 2453.114 | 4100.666 | 1647.552 | M3N5F | 1647.613 | −0.061 | |
| ITDAVD | 4303.735 | 1850.621 | M3N6F | 1850.693 | 0.072 | ✓ | ||
| CSQNPL | 4427.1* | 1974.0 | M3N5FG2 | 1971.719 | ||||
| AELK | 4468.9* | 2015.8 | M3N6FG | 2012.745 | ||||
| 4589.1* | 2136.0 | M3N5G3F | 2133.772 | |||||
| 4792.2* | 2339.1 | M3N6G3F | 2336.859 | |||||
| 4953.9* | 2500.8 | M3N6G4F | 2498.904 | |||||
| T778–796 | YFGGFN | 2169.138 | 3385.59 | 1216.452 | M5N2 | 1216.423 | −0.029 | |
| FSQILPD | 3547.644 | 1378.506 | M6N2 | 1378.476 | −0.030 | |||
| PLKPTK | 3709.738 | 1540.600 | M7N2 | 1540.529 | −0.071 | ✓ | ||
| 3871.702 | 1702.564 | M8N2 | 1702.581 | 0.017 | ||||
Fig. 5.
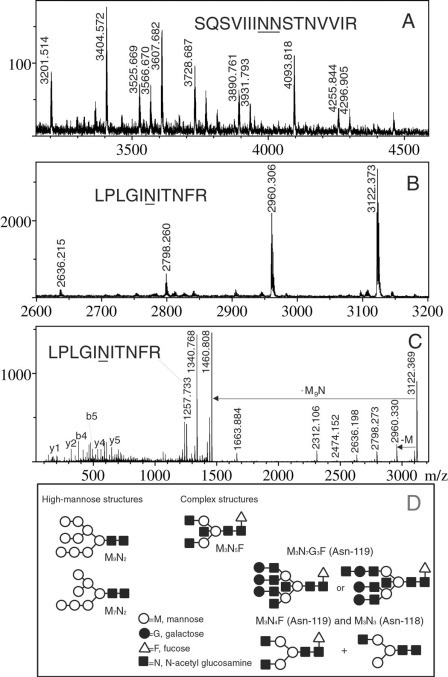
Single MS (A and B) and MS/MS (C) detection of glycosylated tryptic peptides of the 139-kDa spike protein. A, MS spectrum of HPLC fraction 21 of tryptic digest of the 139-kDa band. Labeled peaks are the monoisotopic [M+H]+ ions of glycosylated forms of T111–126 (see Table III). B, MS spectrum of HPLC fraction 25 showing glycosylated forms of T222–232. C, MS/MS spectra of the 3122.373-Da peak from B. D, Suggested high-mannose and complex N-glycan structures, emphasizing possible diglycosylation of T111–126.
Fig. 5 A shows the MALDI mass spectrum of the HPLC fraction containing glycosylated T111–126. This spectrum is interpreted in Table III as containing either one or two glycosylation sites; peaks between m/z 3000 and 3800 show one possible glycosylation site, because compositions allow only one trimannosyl core, but those higher than m/z 3800 possibly correspond to diglycosylated T111–126. Here it is likely that both Asn119 and Asn118 are glycosylated with complex structures, with fucosylation on only one of them, as illustrated by an example in Fig. 5 D. In Fig. 5 B, MS of the glycosylated T222–232 HPLC fraction clearly highlights the presence of high-mannose structures. Here the predominance of (Man)2(GlcNAc)9, the highest possible form of N-linked high-mannose oligosaccharide, suggests that there is little in-source fragmentation. Fig. 5 C is the tandem mass spectrum of T222–232 with a (Man)2(GlcNAc)9 attachment. This spectrum shows losses of one to five mannose residues, loss of the whole oligosaccharide moiety (m/z 1257.733), loss of the whole moiety minus one GlcNAc (m/z 1460.808), and loss of the carbohydrate residue via a cross-ring cleavage (m/z 1340.768). MS/MS analysis of m/z 3404.572, 3607.682, and 4093.818 ions confirmed the presence of complex glycan structures from observed losses of Gal-GlcNAc moieties (data not shown). MS/MS was also performed on glycoforms of T226–287 and T778–796, with results consistent with the suggested complex glycan compositions in Table IV (spectra not shown). All MS/MS spectra recorded in this study showed that the preferred fragmentation mode was loss of the entire oligosaccharide rather than loss of one residue at a time, which again argues against extensive in-source fragmentation.
Other candidate peptides were sought in their possible glycosylated forms but were not detected, perhaps because of the low amount of sample. Alternatively, they may not be detectable as positive ions at these low sample levels because of the presence of negatively charged sialic acids; it has been shown that sialylation has a detrimental effect on positive mode ionization, at least in the case of free N-linked oligosaccharides (26, 27, 28). Indeed, the several galactosylated complex oligosaccharide compositions found in this study suggest the undetected presence of sialic acid, because the latter compound attaches to terminal galactose in such structures.
The glycosylation study conducted here is only preliminary and will be followed by more detailed structural analyses involving glycan release, labeling, and MALDI and electrospray MS. A complementary experiment could also involve exoglycosidase digestions of HPLC fractions containing the glycopeptides. Stimson et al. (24) have already shown that detailed structural analysis of glycans may be conducted on low femtomole amounts of glycopeptides from murine prion proteins by a combination of exoglycosidases and electrospray MS.
DISCUSSION
The Nucleocapsid Protein N—
Comparison of deduced amino acid sequences of different coronavirus N proteins revealed only ∼32% identity between the SARS-related coronavirus and known viruses from the three coronavirus clusters. Correspondingly, the phylogenetic tree (29) of the N protein-deduced amino acid sequences indicated that the SARS-related virus is only distantly related to any of the other clusters (Fig. S4B). The evolutionary distance between the viruses, based on this phylogenetic tree analysis, makes it difficult to speculate about the origin of the SARS virus, although recent reports in the media have implicated various wild animals that are used for food in Guangdong, particularly the civet cat, whose genome was not in the data base.
Despite the striking heterogeneity of the SARS corona N protein when compared with other corona nucleoproteins, certain domains seem functionally conserved (30). The SR-rich region of SARS N protein resembles that of murine and bovine coronaviruses; in a short stretch of 36 residues (amino acids 176–212) it contains 14 serines and 7 arginines. The amino acid sequence in this region is highly variable among coronaviruses except for a core motif SRXX for which double or triple repeats are a distinguishable feature among all coronavirus N proteins. This region has been mapped as the RNA binding domain of the N protein. An intriguing feature of SARS N protein is that it contains five SRXX motifs (see shaded amino acid sequence in Fig. S4A); whether that will translate into much higher RNA binding activity remains to be seen. However, this finding supports the concept of a conserved function within the SR-rich domain.
The appearance of a shorter form of the N protein late in infection has been observed with transmissible gastroenteritis, mouse hepatitis virus, feline infections peritonitis virus, bovine coronavirus, avian infectious bronchitis virus, and turkey coronavirus (∼2 to 5 kDa less) in cell culture. It has been demonstrated that host cell caspases, which are activated during coronavirus infection, are responsible for this cleavage (31). A common caspase cleavage motif is present in all of the mentioned coronavirus N proteins. Furthermore, the accumulation of the shortened N protein form was correlated with a reduction in virus production by a factor of ∼100. These observations suggest that cleavage of viral nucleocapsid protein by host cell caspases could be a general mechanism by which infected cells eliminate coronaviruses. Interestingly, no caspase cleavage motif is present in the SARS-related coronavirus N protein.
The Spike Protein S—
The spike protein is a major target of the cellular immune response to coronaviruses and plays an important role in the initial stages of infection. It mediates the attachment of the virus to the cell surface receptors and induces the fusion of the viral and cellular membranes.
The importance of N-glycosylation of the attachment proteins has often been highlighted in virus-receptor interactions in several types of virus:
-
•
In influenza C and A viruses myxoviruses, Rosenthal et al. showed that N-glycosylation of the hemagglutinin-esterase-fusion proteins can have dramatic effects on immune escape, virulence, and interactions with cellular receptors (32). The hemagglutinin components have been shown to interact with sialic acid moieties on the receptors, and it is known that neuraminidase inhibitors inhibit the replication of influenza viruses A and B (33).
-
•
Hepatitis viruses have been shown to bud into the endoplasmic reticulum and depend on N-glycosylation of coat proteins to form infectious virus particles (34, 35). Dwek and his colleagues investigated the effect of deoxynojirimycin, an alpha-glucosidase inhibitor, and found that it blocks oligosaccharide processing after monoglucosylation of Asn sites. The glucosylated proteins were shown to misfold. Even at very low inhibitor concentration, viral titers dropped by nearly 100-fold (36). Studies in animals showed that deoxynojirimycin had a negligible effect on host glycosylation (37), and thus drugs such as this alpha-glucosidase inhibitor are seen as good candidates for treatment of hepatitis B. Hepatitis C virus may also respond to these inhibitors (38). However, similar studies using sugar inhibitors on HIV, which has many N-linked sites, showed less sensitivity to misglycosylation (39).
-
•
Rossen and coworkers modified the N-glycosylation characteristics of coronavirus spike proteins in cultured epithelial cells and found that N-glycans had an important impact on virus formation and behavior. For example, inhibition of spike N-glycosylation by tunamycin, which inhibits the synthesis of N-glycans, resulted in the synthesis of spikeless virions (40). The same authors also discussed the implications of N-glycosylation of hemagglutinin proteins of epithelial cell coronaviruses (40). We note, however, that the SARS-associated coronavirus genome sequence does not contain a gene encoding hemagglutinin or large genes derived from another virus or host cell (4), although is believed that host range, tissue tropism, and virulence of animal coronaviruses can be changed by mutating the S gene, thus modifying the S proteins (12, 41).
It has been shown that sialic acid plays important roles in host-receptor interactions. We therefore plan to study the exact compositions of spike N-linked glycans after detachment by PNGase, because the sialic acid content of a glycoprotein can be determined in an isolated oligosaccharide pool. The study of N-linked glycan structures by MS is well documented (see, for example, Ref. 42), and established methods are available to conduct such analyses.
Possible Therapeutic Applications—
The present studies provide the first description of the actual proteins derived from the novel coronavirus thought to be the etiologic agent of SARS. Similar to the pattern observed with animal coronaviruses (43), the 46-kDa nucleoprotein appears to be the major immunogenic antigen, as it was the only viral protein recognized by acute and early convalescent sera from several patients recovering from SARS. While the immune response to the nucleoprotein could serve as an early diagnostic marker for infection, it is unlikely that an immune response to this protein offers protection, because it is an internal protein and neutralizing antibodies are more likely to target the surface proteins (12). However, it has been shown for other coronaviruses that some antigenic peptides of the N protein can be recognized on the surface of infected cells by T cells (12).
The spike glycoprotein is certainly a surface protein, so it may offer an attractive target. Although no drugs with proven efficacy against coronaviruses are currently approved, potential targets exist for new drugs. For example, protease inhibitors could prevent processing of the RNA polymerase or cleavage of the viral S glycoprotein. Finding antibodies against the S glycoprotein or against the unidentified SARS coronavirus receptor are also possible routes to take), and the use of glycosylation inhibitors that have minimal effects on host cells would be an interesting approach (36). Very recently, an important contribution by Hilgenfeld et al. outlined a plan for drug design based on inhibition of the viral main proteinase, called Mpro or 3CLpro, which controls the activities of the coronavirus replication complex (44). Ideas for development of vaccines against SARS also include the use of killed or subunit vaccines containing the spike glycoprotein together with other viral proteins.
Why Analyze the Proteins?—
The application of de novo sequencing by MS provides an alternative to the usual genomic approach for protein identification. It has the advantage of distinguishing the actual proteins expressed from those that are simply hypothesized or predicted by the nucleotide sequence. It may also be useful to realize that questions of homology can be investigated by examining protein proteolytic fragments even in the complete absence of genome information. Indeed, the results of the BLAST search (Fig. 4), and the conclusion that the 47-kDa protein that NML had isolated was a nucleocapsid protein belonging to an extensively modified coronavirus, were reported at a meeting of the local participants in this investigation on April 3, 2003, more than a week before the nucleotide sequence became available.
Even when the nucleotide sequence is available, analysis of the proteins (which is much easier in that case), provides significant complementary information, particularly on post-translational modifications (22). The relatively minor modifications observed in the nucleocapsid protein are not particularly newsworthy, but we nevertheless believe that the result is useful in ruling out (probably) such modifications as an explanation of the unusual properties of the virus. However, glycosylation in the SARS spike protein, first investigated here, is more exciting; it is likely to play a key role in attachment of the virus to cell surface receptors, and therefore may have important therapeutic applications, as pointed out above.
Acknowledgments
We would like to thank the Canadian SARS study team, including Health Canada, as well as Canadian Public Health Laboratories and hospitals, for the specimens and collaboration. We thank Mihaela Antonovici, Victor Spicer, and James McNabb for invaluable technical assistance, and Ron Beavis, Steve Haber, and Alexandre Loboda for helpful discussions.
Footnotes
Published, MCP Papers in Press, May 29, 2003, DOI 10.1074/mcp.M300048-MCP200
- SARS
- severe acute respiratory syndrome
- NML
- National Microbiology Laboratory
- MALDI
- matrix-assisted laser desorption/ionization
- PNGase F
- peptide N-glycosidase F
- HPLC
- high-performance liquid chromatography
- MS
- mass spectrometry
- MS/MS
- tandem mass spectrometry
- QqTOF
- quadrupole/time-of-flight
- TOF
- time-of-flight
Y. Li, unpublished data.
Supplementary Material
REFERENCES
- 1.Poutanen S.M., Low D.E., Henry B., Finkelstein S., Rose D., Green K., Tellier R., Draker R., Adachi D., Ayers M., Chan A.K., Skowronski D.M., Salit I., Simor A.E., Slutsky A.S., Doyle P.W., Krajden M., Petric M., Brunham R.C., McGeer A.J., Canada National Microbiology Laboratory. the Canadian Severe Acute Respiratory Syndrome Study Team Identification of severe acute respiratory syndrome in Canada. N. Engl. J. Med. 2003;348:1995–2005. doi: 10.1056/NEJMoa030634. [DOI] [PubMed] [Google Scholar]
- 2.Booth C.M., Matukas L.M., Tomlinson G.A., Rachlis A.R., Rose D.B., Dwosh H.A., Walmsley S.L., Mazzulli T., Avendano M., Derkach P., Ephtimios I.E., Kitai I., Mederski B.D., Shadowitz S.B., Gold W.L., Hawryluck L.A., Rea E., Chenkin J.S., Cescon D.W., Poutanen S.M., Detsky A.S. Clinical features and short-term outcomes of 144 patients with SARS in the greater Toronto area. J. Am. Med. Assoc. May 6, 2003;289:2801–2809. doi: 10.1001/jama.289.21.JOC30885. [DOI] [PubMed] [Google Scholar]
- 3.Health Canada. Latest Canadian Numbers on SARS. http://www.hc-sc.gc.ca/english/protection/warnings/sars/sars_numbers.html (accessed May 26, 2003)
- 4.Marra M.A., Jones S.J., Astell C.R., Holt R.A., Brooks-Wilswon A., Butterfield Y.S., Khattra J., Asano J.K., Barber S.A., Chan S.Y., Cloutier A., Coughlin S.M., Freeman D., Girn N., Griffith O.L., Leach S.R., Mayo M., McDonald H., Montgomery S.B., Pandoh P.K., Petrescu A.S., Robertson A.G., Schein J.E., Siddiqui A., Smailus D.E., Stott J.M., Yang G.S., Plummer F., Andonov A., Artsob H., Bastien N., Bernard K., Booth T.F., Bowness D., Czub M., Drebot M., Fernando L., Flick R., Garbutt M., Gray M., Grolla A., Jones S., Feldmann H., Meyers A., Kabani A., Li Y., Normand S., Stroher U., Tipples G.A., Tyler S., Vogrig R., Ward D., Watson B., Brunham R.C., Krajden M., Petric M., Skowronski D.M., Upton C., Roper R.L. The genome sequence of the SARS-associated coronavirus. Science. May 1, 2003;300:1399–1404. doi: 10.1126/science.1085953. [DOI] [PubMed] [Google Scholar]
- 5.Rota P.A., Oberste M.S., Monroe S.S., Nix W.A., Campagnoli R., Icenogle J.P., Penaranda S., Bankamp B., Maher K., Chen M.H., Tong S., Tamin A., Lowe L., Frace M., DeRisi J.L., Chen Q., Wang D., Erdman D.D., Peret T.C., Burns C., Ksiazek T.G., Rollin P.E., Sanchez A., Liffick S., Holloway B., Limor J., McCaustland K., Olsen-Rasmussen M., Fouchier R., Gunther S., Osterhaus A.D., Drosten C., Pallansch M.A., Anderson L.J., Bellini W.J. Characterization of a novel coronavirus associated with severe acute respiratory syndrome. Science. May 1, 2003;300:1394–1399. doi: 10.1126/science.1085952. [DOI] [PubMed] [Google Scholar]
- 6.Thomas J.J., Bakhtiar R., R., Siuzdak G. Mass spectrometry in viral proteomics. Acc. Chem. Res. 2001;33:179–187. doi: 10.1021/ar9801200. [DOI] [PubMed] [Google Scholar]
- 7.Seifers D.L., Harvey T.L., Haber S., She Y.-M., Chernushevich I., Ens W., Standing K.G. Natural infection of sorghum by foxtail mosaic disease in Kansas. Plant Dis. 1999;83:905–912. doi: 10.1094/PDIS.1999.83.10.905. [DOI] [PubMed] [Google Scholar]
- 8.Seifers D.L., Salomon R., Marie-Jeanne V., Alliot B., Signoret P., Haber S., Loboda A., Ens W., She Y.-M., Standing K.G. Characterization of a novel potyvirus isolated from maize in Israel. Phytopathology. 2000;90:505–513. doi: 10.1094/PHYTO.2000.90.5.505. [DOI] [PubMed] [Google Scholar]
- 9.She Y.-M, Haber S., Seifers D.L., Loboda A., Chernushevich I., Perreault H., Ens W., Standing K.G. Determination of the complete amino acid sequence for the coat protein of brome mosaic virus by time-of-flight mass spectrometry. J. Biol. Chem. 2001;276:20039–20047. doi: 10.1074/jbc.M100189200. [DOI] [PubMed] [Google Scholar]
- 10.Swanson M.I., She Y.-M, Ens W., Brown E.G., Coombs K.M. Mammalian reovirus core protein micro 2 initiates at the first start codon and is acetylated. Rapid Commun. Mass Spectrom. 2002;16:2317–2324. doi: 10.1002/rcm.866. [DOI] [PubMed] [Google Scholar]
- 11.Mendez, I. I., She, Y. M., Ens, W., and Coombs, K. M. (2003) Digestion pattern of reovirus outer capsid protein σ3 determined by mass spectrometry. Virology, in press [DOI] [PMC free article] [PubMed]
- 12.Lai M.M.C., Holmes K.V. Fields Virology. 4th Ed. Lippincott Williams & Wilkins; Hagerstown, MD: 2001. pp. 1163–1185. [Google Scholar]
- 13.Shevchenko A., Wilm M., Vorm O., Mann M. Mass spectrometric sequencing of proteins from polyacrylamide gels. Anal. Chem. 1996;68:850–858. doi: 10.1021/ac950914h. [DOI] [PubMed] [Google Scholar]
- 14.Shevchenko A., Chernushevich I., Ens W., Standing K.G., Thomson B., Wilm M., Mann M. Rapid ‘de novo' peptide sequencing by a combination of nanoelectrospray, isotopic labeling and a quadrupole/time-of-flight mass spectrometer. Rapid Commun. Mass Spectrom. 1997;11:1015–1024. doi: 10.1002/(SICI)1097-0231(19970615)11:9<1015::AID-RCM958>3.0.CO;2-H. [DOI] [PubMed] [Google Scholar]
- 15.Stewart II, Thomson T., Figeys D. 18O labeling: A tool for proteomics. Rapid Commun. Mass Spectrom. 2001;15:2456–2465. doi: 10.1002/rcm.525. [DOI] [PubMed] [Google Scholar]
- 16.Yao X., Alfonso C., Fenselau C. Dissection of proteolytic 18O labeling: Endoprotease catalyzed 16O to 18O exchange of truncated peptide substrates. J. Proteome Res. 2003;2:147–152. doi: 10.1021/pr025572s. [DOI] [PubMed] [Google Scholar]
- 17.Krokhin O., Qian Y., McNabb J.R., Spicer V., Standing K.G., Ens W. American Society for Mass Spectrometry, 50th ASMS Conference on Mass Spectrometry and Allied Topics. American Society for Mass Spectrometry; Santa Fe, NM: 2002. An off-line interface between HPLC and orthogonal MALDI TOF. [Google Scholar]
- 18.Tarentino A.L., Gomez C.M., Plummer T.H., Jr. Deglycosylation of asparagine-linked glycans by peptide:N-glycosidase F. Biochemistry. 1985;24:4665–4671. doi: 10.1021/bi00338a028. [DOI] [PubMed] [Google Scholar]
- 19.Loboda A.V., Krutchinsky A.N., Bromirski M., Ens W., Standing K.G. A tandem quadrupole/time-of-flight mass spectrometer with a matrix-assisted laser desorption/ionization source: Design and performance. Rapid Commun. Mass Spectrom. 2000;14:1047–1057. doi: 10.1002/1097-0231(20000630)14:12<1047::AID-RCM990>3.0.CO;2-E. [DOI] [PubMed] [Google Scholar]
- 20.Altschul S.F., Stephen F., Madden T.L., Zhang Schaeffer, Miller J.W., Lipman D.J. Gapped BLAST and PSI-BLAST: A new generation of protein database search programs. Nucleic Acids Res. 1997;25:3389–3402. doi: 10.1093/nar/25.17.3389. [DOI] [PMC free article] [PubMed] [Google Scholar]
- 21.Shevchenko A., Loboda A., Sunyaev A., Shevchenko S., Bork A., Ens P.W., Standing K.G. Charting the proteomes of organisms with unsequenced genomes by MALDI-quadrupole time-of-flight mass spectrometry and BLAST homology searching. Anal. Chem. 2001;73:1917–1926. doi: 10.1021/ac0013709. [DOI] [PubMed] [Google Scholar]
- 22.Krishna R., Wold F. Posttranslational modifications. In: Angeletti R.H., editor. Proteins—Analysis and Design. Elsevier, Academic Press; San Diego, CA: 1998. pp. 121–206. [Google Scholar]
- 23.Hogue B.G., Brian D.A. Glycosylation of the bovine coronavirus hemagglutinin protein. Adv. Exp. Med. Biol. 1987;218:131–136. doi: 10.1007/978-1-4684-1280-2_15. [DOI] [PubMed] [Google Scholar]
- 24.Stimson E., Hope J., Chong A., Burlingame A.M. Site-specific characterization of the N-linked glycans of murine prion protein by high-performance liquid chromatography/electrospray mass spectrometry and exoglycosidase digestions. Biochemistry. 1999;38:4885–4895. doi: 10.1021/bi982330q. [DOI] [PubMed] [Google Scholar]
- 25.Chalkley R.J., Burlingame A.L. Identification of novel sites of O-N-acetylglucosamine modification of serum response factor using quadrupole time-of-flight mass spectrometry. Mol. Cell. Proteomics. 2003;2:182–190. doi: 10.1074/mcp.M300027-MCP200. [DOI] [PubMed] [Google Scholar]
- 26.Harvey D.J. Matrix-assisted laser desorption/ionization mass spectrometry of carbohydrates. Mass Spectrom. Rev. 1999;18:349–451. doi: 10.1002/(SICI)1098-2787(1999)18:6<349::AID-MAS1>3.0.CO;2-H. [DOI] [PubMed] [Google Scholar]
- 27.Raju T.S., Briggs J.B., Borge S.M., Jones A.J.M. . Species-specific variations in glycosylation of IgG: Evidence for the species-specific sialylation and branch-specific galactosylation and importance for engineering recombinant glycoprotein therapeutics. Glycobiology. 2000;10:477–486. doi: 10.1093/glycob/10.5.477. [DOI] [PubMed] [Google Scholar]
- 28.Saba J.A., Kunkel J.P., Jan D.C.H., Ens W.E., Standing K.G., Butler M., Jamieson J.C., Perreault H. A study of immunoglobulin G glycosylation in monoclonal and polyclonal species by electrospray and matrix-assisted laser desorption/ionization mass spectrometry. Anal. Biochem. 2002;305:16–31. doi: 10.1006/abio.2002.5651. [DOI] [PubMed] [Google Scholar]
- 29.Thompson J.D., Higgins D.G., Gibson T.J. CLUSTAL W: Improving the sensitivity of progressive multiple sequence alignment through sequence weighting, position-specific gap penalties, and weight matrix choice. Nucleic Acids Res. 1994;22:4673–4680. doi: 10.1093/nar/22.22.4673. [DOI] [PMC free article] [PubMed] [Google Scholar]
- 30.Nelson G.W., Stohlman S.A., Tahara S.M. High affinity interaction between nucleocapsid protein and leader/intergenic sequence of mouse hepatitis virus RNA. J. Gen. Virol. 2000;81:181–188. doi: 10.1099/0022-1317-81-1-181. [DOI] [PubMed] [Google Scholar]
- 31.Eleouet J.F., Slee E.A., Saurini F., Castagne N., Poncet D., Garrido C., Solary E, Martin S.J. The viral nucleocapsid protein of transmissible gastroenteritis coronavirus (TGEV) is cleaved by caspase-6 and -7 during TGEV-induced apoptosis. J. Virol. 2000;74:3975–3983. doi: 10.1128/jvi.74.9.3975-3983.2000. [DOI] [PMC free article] [PubMed] [Google Scholar]
- 32.Rosenthal P.B., Zhang X., Formanowski F., Fitz W., Wong C.H., Meier-Ewert H., Skehel J.J., Wiley D.C. Structure of the haemagglutinin-esterase-fusion glycoprotein of influenza C virus. Nature. 1998;396:92–96. doi: 10.1038/23974. [DOI] [PMC free article] [PubMed] [Google Scholar]
- 33.Oxford J.S., Bossuyt S., Balasingam S., Mann A., Novelli P., Lambkin R. Treatment of epidemic and pandemic influenza with neuraminidase and M2 proton channel inhibitors. Clin. Microbiol. Infect. 2003;9:1–14. doi: 10.1046/j.1469-0691.2003.00564.x. [DOI] [PubMed] [Google Scholar]
- 34.Lu X., Mehta A., Dwek R., Butters T., Block T. Evidence that N-linked glycosylation is necessary for hepatitis B virus secretion. Virology. 1995;213:660–665. doi: 10.1006/viro.1995.0038. [DOI] [PubMed] [Google Scholar]
- 35.Mehta A., Block T.M., Dwek R.A. The role of N-glycosylation in the secretion of hepatitis B virus. Adv. Exp. Med. Biol. 1998;435:195–205. doi: 10.1007/978-1-4615-5383-0_19. [DOI] [PubMed] [Google Scholar]
- 36.Mehta A., Rudd P.M., Block T.M., Dwek R.A. A strategy for anti-viral intervention: the use of alpha-glycosidase inhibitors to prevent chaperone-mediated folding of viral envelope glycoproteins. Biochem. Soc. Trans. 1997;25:1188–1193. doi: 10.1042/bst0251188. [DOI] [PubMed] [Google Scholar]
- 37.Freeze H.H., Westphal V.C. Balancing N-linked glycosylation to avoid disease. Biochimie. 2001;83:791–799. doi: 10.1016/s0300-9084(01)01292-5. [DOI] [PubMed] [Google Scholar]
- 38.Ziztzmann N., Mehta A.S., Carrouee S., Butters T.D., Platt F.M., McCauley J., Blumberg B.S., Dwek R.A., Block T.M. Imino sugars inhibit the formation and secretion of bovine diarrhea virus, a pestivirus model of hepatitis C virus: Implications for the development of broad spectrum anti-hepatitis virus agents. Proc. Natl. Acad. Sci. U. S. A. 1999;96:11878–11882. doi: 10.1073/pnas.96.21.11878. [DOI] [PMC free article] [PubMed] [Google Scholar]
- 39.Mehta A., Zitzmann N., Rudd P.M., Block T.M., Dwek R.A. Alpha-glucosidase inhibitors as potential broad-based anti-viral agents. FEBS Lett. 1998;430:17–22. doi: 10.1016/s0014-5793(98)00525-0. [DOI] [PubMed] [Google Scholar]
- 40.Rossen J.W., de Beer R., Godeke G.J., Raamsman M.J., Horzinek M.C., Vennema H., Rottier P.J. The viral spike protein is not involved in the polarized sorting of coronaviruses in epithelial cells. J. Virol. 1998;72:497–503. doi: 10.1128/jvi.72.1.497-503.1998. [DOI] [PMC free article] [PubMed] [Google Scholar]
- 41.Peiris J.S.M., Lai S.T., Poon L.L.M., Guan Y., Yam L.Y.C., Lim W., Nicholls J., Yee W.K.S., Yan W.W., Cheung M.T., Cheng V.C.C., Chan K.H., Tsang D.N.C., Yung R.W.H., Ng T.N., Yuen K.Y. SARS study group. Coronavirus as a possible cause of severe acute respiratory syndrome. Lancet. 2003;361:1319–1325. doi: 10.1016/S0140-6736(03)13077-2. [DOI] [PMC free article] [PubMed] [Google Scholar]
- 42.Harvey D.J. Identification of protein-bound carbohydrates by mass spectrometry. Proteomics. 2001;1:311–328. doi: 10.1002/1615-9861(200102)1:2<311::AID-PROT311>3.0.CO;2-J. [DOI] [PubMed] [Google Scholar]
- 43.Elia G., Decaro N., Tinelli A., Martella V., Pratelli A., Buonavoglia C. Evaluation of antibody response to canine coronavirus infection in dogs by Western blotting analysis. New Microbiol. 2002;25:275–280. [PubMed] [Google Scholar]
- 44.Anand, K., Ziebuhr, J., Wadhwani, P., Mesters, J. R., and Hilgenfeld, R. (May 13, 2003) Coronavirus main proteinase (3CLpro) structure: Basis for design of anti-SARS drugs. Science 10.1126/science.1085658 [DOI] [PubMed]
Associated Data
This section collects any data citations, data availability statements, or supplementary materials included in this article.