

Abstract
The gene expression program underlying the specification of human cell types is of fundamental interest. We generated human cell atlases of gene expression and chromatin accessibility in fetal tissues. For gene expression, we applied three-level combinatorial indexing to >110 samples representing 15 organs, profiling ~4 million single cells. We leveraged the literature and other atlases to identify and annotate hundreds of cell types and subtypes, both within and across tissues. Our analyses focus on organ-specific specializations of broadly distributed cell types (e.g. blood, endothelial, epithelial), sites of fetal erythropoiesis (which surprisingly included the adrenal gland) and integration with mouse developmental atlases (e.g. conserved specification of blood cells). These data comprise a rich resource for the exploration of in vivo human gene expression in diverse tissues and cell types.
One Sentence Summary:
We report a human cell atlas of fetal gene expression spanning 15 organs.
To date, most investigations of human development have been anatomical or histological (1–3). However, it is clear that variation in the genetic and molecular programs unfolding within cells during development can cause disease. For example, the vast majority of Mendelian disorders have a major developmental component (4). More common and often devastating developmental conditions to which genetic factors substantially contribute include congenital heart defects, other birth defects, intellectual disability, and autism (5).
Several challenges have historically limited the study of developing human tissues at the molecular level. First, access to human embryonic and fetal tissues is limited. Second, even when available, the tissues are usually fixed and nucleic acids degraded. Third, until recently, most molecular studies of complex tissues have been confounded by cell type heterogeneity. For these reasons, contemporary knowledge of the molecular basis of in vivo human development mostly derives from a combination of human genetics (in particular, of Mendelian disorders), in vivo investigations of model organisms (in particular, of the mouse), and in vitro studies of differentiating human cell lines (in particular, of embryonic or induced pluripotent stem cells), rather than direct investigations of developing human tissues.
A reference human cell atlas based on developing tissues could serve as the foundation for a systematic effort to better understand the molecular and cellular events that give rise to all rare and common disorders of development, which collectively account for a major proportion of pediatric morbidity and mortality (6, 7). Furthermore, although pioneering cell atlases have already been reported for many adult human organs (8, 9), developing tissues may provide better opportunities to study the in vivo emergence and differentiation of human cell types. Relative to embryonic and fetal tissues, adult tissues are dominated by differentiated cells, and many cell states are not represented. By better resolving cell types and their trajectories, single cell atlases generated from developing tissues could broadly inform our basic understanding of human biology, as well as strategies for cell reprogramming and cell therapy.
As one step towards a comprehensive cell atlas of human development (10), we set out to generate single cell atlases of both gene expression and chromatin accessibility using diverse human tissues obtained during midgestation (DESCARTES = DEvelopmental Single Cell Atlas of gene RegulaTion and ExpreSion; descartes.brotmanbaty.org). For gene expression, we applied three-level single cell combinatorial indexing (sci-RNA-seq3) (11) to 121 fetal tissues representing 15 organs, altogether profiling gene expression in 5 million cells (Fig. 1A; Table S1). We also measured chromatin accessibility in 1.6 million cells from the same organs, using an overlapping set of samples (12). The profiled organs span diverse systems. However some systems were not accessible; bone marrow, bone, gonads, and skin are most notably absent.
Figure 1. Data generation and identifying cell types across 15 human organs.
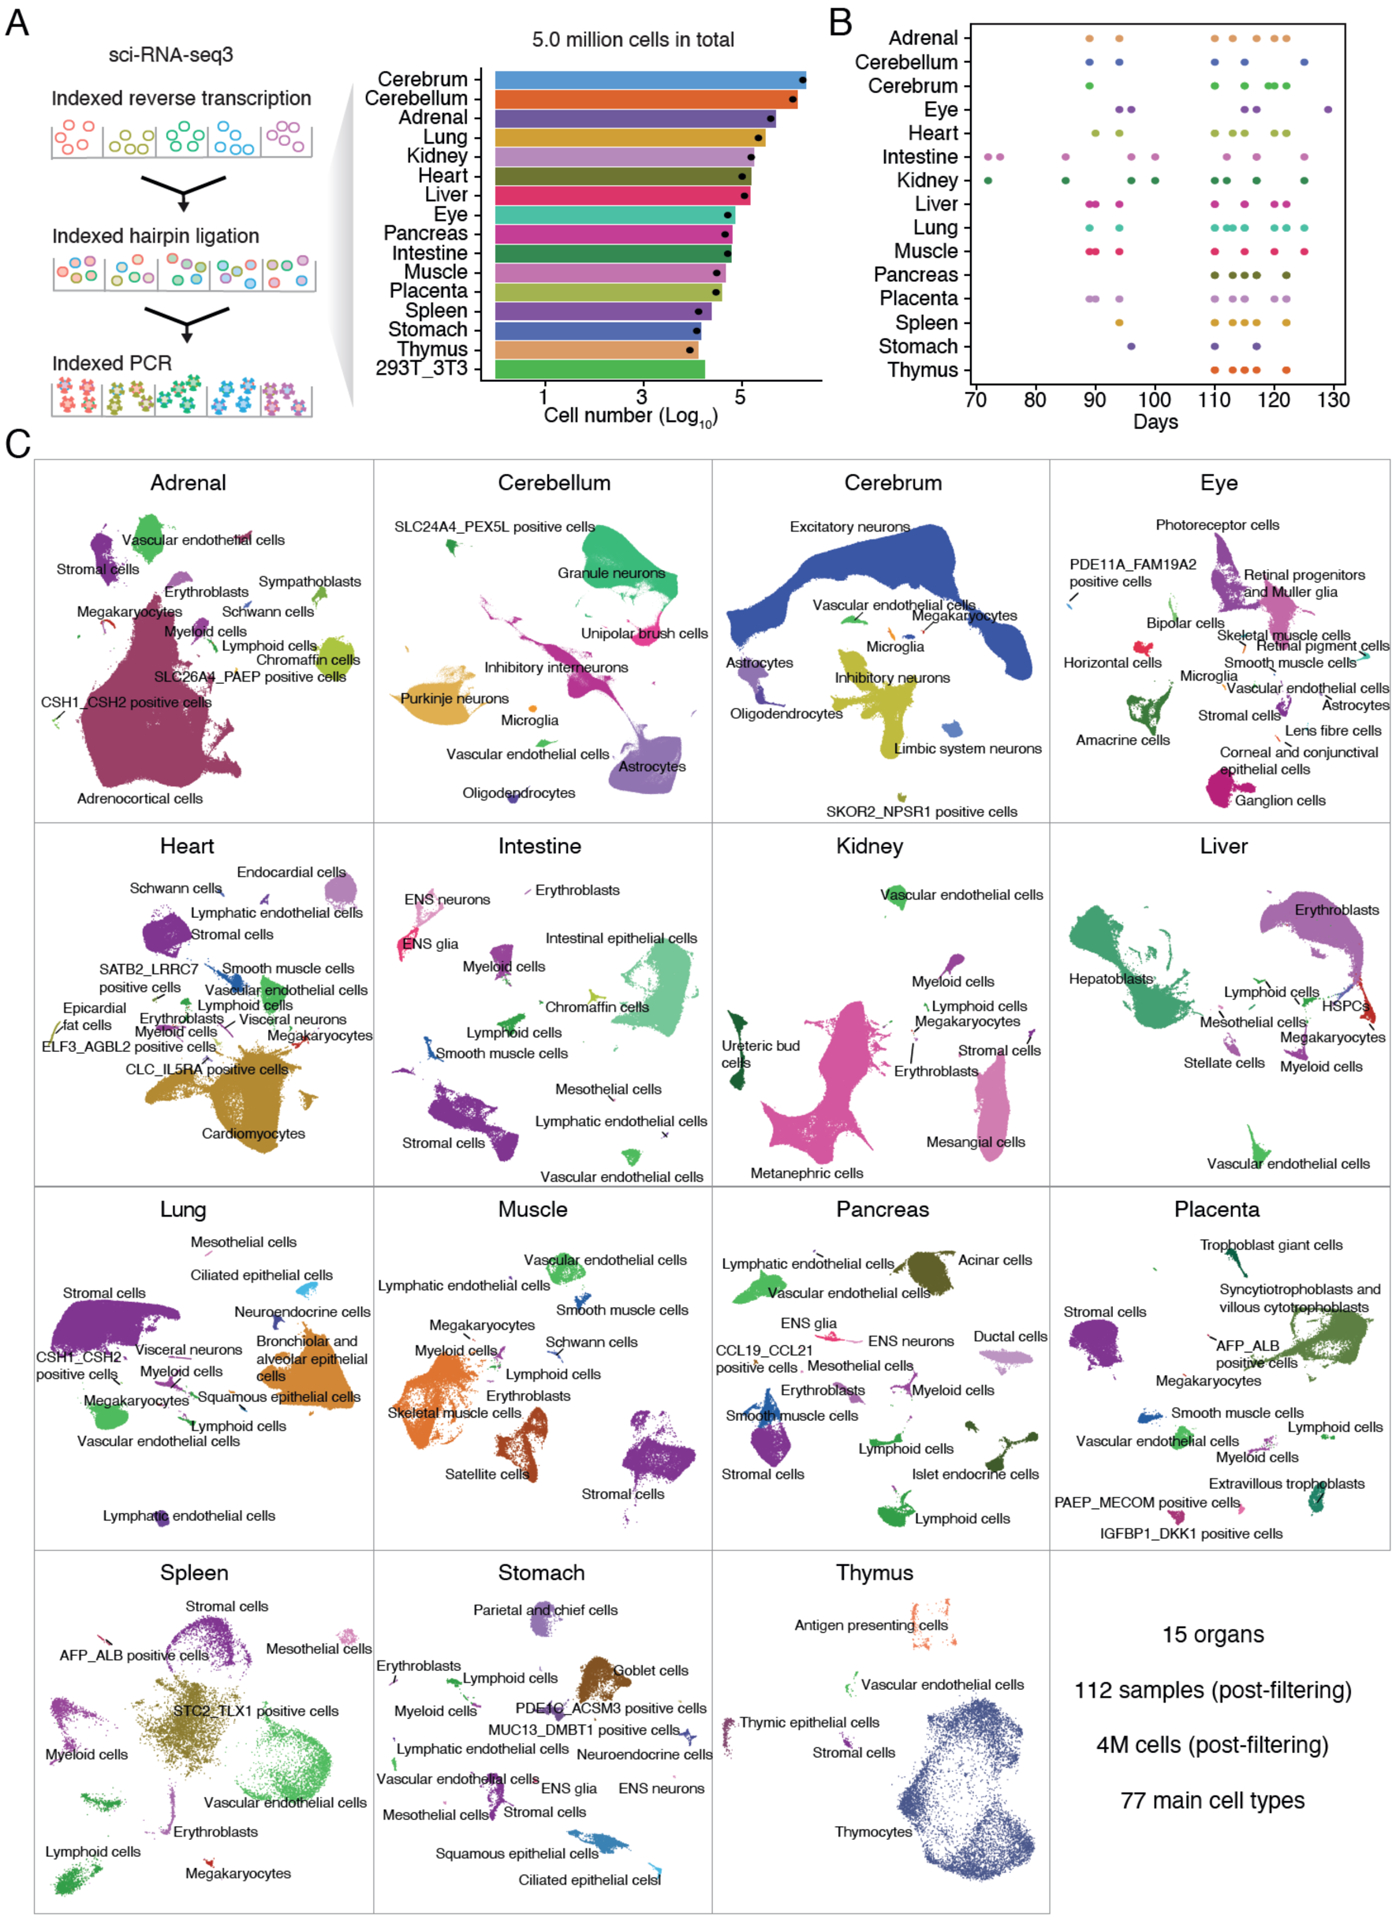
(A) Project workflow (left) and barplot (right) showing the number of cells profiled per organ on a log10 scale. Dots indicate the number of cells remaining for downstream analysis after QC filtering procedures. (B) Barplot showing the distribution of estimated post-conceptual ages for tissue samples corresponding to each organ. (C) After filtering against low-quality cells and doublet-enriched clusters, 4 million single cell gene expression profiles were subjected to UMAP visualization and Louvain clustering with Monocle 3 on a per-organ basis. Clusters were initially annotated on a per-organ basis as well, utilizing recent organ-specific cell atlas efforts, which yielded 172 main cell types (colors and labels). Because many cell type annotations appear in multiple organs (e.g. vascular endothelial cells), we consolidated these to 77 main cell types.
Tissues were obtained from 28 fetuses ranging from 72–129 days in estimated post-conceptual age. We applied a method for extracting nuclei directly from cryopreserved tissues that works across a variety of tissue types and produces homogenates suitable for both sci-RNA-seq3 and sci-ATAC-seq3 (12). For most organs, extracted nuclei were fixed with paraformaldehyde. For renal and digestive organs where RNases and proteases are abundant, we used fixed cells rather than nuclei, which increased cell and mRNA recovery (13). For each experiment, nuclei or cells from a given tissue were deposited to different wells, such that the first index of sci-RNA-seq3 protocol also identified the source. As a batch control for experiments on nuclei, we spiked a mixture of human HEK293T and mouse NIH/3T3 nuclei, or nuclei from a common sentinel tissue (trisomy 21 cerebrum), into one or several wells. As a batch control for experiments on cells, we spiked cells derived from a tissue (pancreas) into one or several wells.
We sequenced sci-RNA-seq3 libraries from 7 experiments across 7 Illumina NovaSeq™ 6000 sequencer runs, altogether generating 68.6 billion raw reads. Processing data as described previously (11), we recovered 4,979,593 single cell gene expression profiles (UMI > 250) (File S1–3). Single cell transcriptomes from human-mouse control wells were overwhelmingly species-coherent (~5% collisions) (Fig. S1A). Uniform manifold approximation and projection (UMAP) (14) of nuclei or cells from the sentinel tissues indicated that cell type differences dominated over inter-experimental batch effects (Fig. S1B–C). Integrated analysis (15) of nuclei and cells from the common pancreatic tissue also resulted in highly overlapping distributions (Fig. S1D).
We profiled a median of 72,241 cells or nuclei per organ (Fig. 1A; max 2,005,512 (cerebrum); min 12,611 (thymus)). Despite shallow sequencing (~14,000 raw reads per cell) relative to other large-scale scRNA-seq atlases (16–19), we recovered a comparable number of UMIs per cell or nucleus (median 863 UMIs and 524 genes not including cultured cells; Fig. S1E). As expected, nuclei exhibited a higher proportion of UMIs mapping to introns than cells (56% for nuclei; 45% for cells; p < 2.2e-16, two-sided Wilcoxon rank sum test). We henceforth use “cells” to refer to both cells and nuclei unless otherwise stated.
Tissues were readily identified as deriving from a male (n=14) or female (n=14) by sex-specific gene expression (Fig. S1F). Each of the 15 organs was represented by multiple samples (median 8) including at least two of each sex (Fig. S1G), and over a range of estimated post-conceptual ages (Fig. 1B). “Pseudo-bulk” transcriptomes clustered by organ rather than individual or experiment (Fig. S1H; File S4–5). About half of expressed, protein-coding transcripts were differentially expressed across pseudo-bulk transcriptomes (11,766 of 20,033; FDR of 5%; Table S2).
We applied Scrublet (20) to detect 6.4% likely doublet cells, corresponding to a doublet estimate of 12.6% including both within-cluster and between-cluster doublets (Fig. S1I). We then applied a scalable strategy that we previously developed (11) to remove low-quality cells, doublet-enriched clusters and the spiked-in HEK293T and NIH/3T3 cells. All analyses below focus on the 4,062,980 human single cell gene expression profiles, derived from 112 fetal tissue samples, that remained after this filtering step.
Identification and annotation of 77 main cell types
Using Monocle 3 (11), we subjected single cell gene expression profiles to UMAP visualization and Louvain clustering on a per-organ basis. Altogether, we initially identified and annotated 172 cell types based on cell type-specific marker gene expression (16, 21–84) (Fig. 1C; Table S3; File S6–7). Collapsing common annotations across tissues, these reduced to 77 main cell types, 54 of which were observed in only a single organ (e.g. Purkinje neurons in cerebellum), and 23 in multiple organs (e.g. vascular endothelial cells in every organ). There were 15 cell types that we were unable to annotate during our manual, organ-by-organ review (the subset named by pairs of markers in Fig. 1C); these are discussed further below and in (85). These 77 main cell types were represented by a median of 4,829 cells, and ranged from 1,258,818 cells (excitatory neurons in the cerebrum) to only 68 cells (SLC26A4+, PAEP+ positive cells in the adrenal gland) (Fig. S2A). Each main cell type was observed in multiple individuals (median 9; Fig. S2B). We recovered nearly all major cell types identified by previous atlasing efforts directed at the same organs, despite differences with respect to species, stage of development and technology (16, 23, 28, 33, 35, 51, 69, 72, 86–88). We identified a median of 12 main cell types per organ, ranging from 5 (thymus) to 16 (eye, heart and stomach). We did not observe a correlation between the number of profiled cells and the number of identified cell types (Spearman ρ = −0.10, p = 0.74).
On average, we identified 11 marker genes per main cell type (min 0, max 294; defined as differentially expressed genes with at least 5-fold difference between first and second ranked cell type with respect to expression; FDR of 5%; Fig. S2C; Table S4). There were several cell types that lacked marker genes at this threshold due to highly related cell types in other organs (e.g. enteric glia vs. Schwann cells). For this reason, we also report sets of “within-tissue marker genes”, determined by the same procedure but on an organ-by-organ basis (average 147 markers per cell type; min 12, max 778; Fig. S2D; Table S5). An interactive website facilitates the exploration of these data by tissue, cell type, or gene (descartes.brotmanbaty.org).
Although canonical markers were generally observed and indeed critical for our annotation process, to our knowledge, the vast majority of observed markers have not been identified in prior studies. For example, OLR1, SIGLEC10 and noncoding RNA RP11–480C22.1 are amongst the strongest markers of microglia, together with more established microglial markers such as CLEC7A (89), TLR7 (90), and CCL3 (91). As anticipated, given that these tissues are undergoing development, many of the 77 main cell types include states progressing from precursors to one or several terminally differentiated cell types. For example, cerebral excitatory neurons exhibited a continuous trajectory from PAX6+ neuronal progenitors to NEUROD6+ differentiating neurons (92) to SLC17A7+ mature neurons (93) (Fig. S2E–F). In the liver, hepatic progenitors (DLK1+, KRT8+, KRT18+) (94, 95) exhibited a continuous trajectory to functional hepatoblasts (SLC22A25+, ACSS2+, ASS1+) (Fig. S2G–H) (96–98). In contrast with mouse organogenesis, wherein the maturation of the transcriptional program is tightly coupled to developmental time (11), cell state trajectories were inconsistently correlated with estimated post-conceptual ages in these data (Fig. S2I–J). A potential explanation is that gene expression is markedly more dynamic during embryonic than fetal development. However, it is also possible that inaccuracies in the estimated post-conceptual ages confound our resolution.
In addition to these manual annotations of cell types, we also generated semi-automated classifiers for each organ using Garnett (99). The Garnett classifiers were generated agnostic of previous clustering with marker genes separately compiled from the literature (99). Classifications by Garnett were concordant with manual classifications (Fig. S3A). Using the Garnett models trained on these data, we were able to accurately classify cell types from other single cell datasets, including data generated with different methods as well as from adult organs. When we applied the classifier for pancreas to inDrop single cell RNA-seq data (100), Garnett correctly annotated 82% of the cells (cluster-extended; 11% incorrect, 8% unclassified) (Fig S3B). These models can broadly be used for the automated cell type classification of single cell data from diverse organs (Fig. S3C; descartes.brotmanbaty.org ).
We next evaluated the specificity of our main cell types by intra-dataset cross-validation with an SVM classifier (101). In this framework, high cross-validation precision/recall values indicate that cells derived from a given cluster can robustly be reassigned to that cluster; we thus use high F1 scores as a proxy for identifying cell clusters as valid “types”, at least in the setting of the tissue in which they were identified. We first evaluated this approach on the kidney. As expected, annotated kidney cell types have much higher specificity scores (median 0.99) than control cell types in which cell labels are permuted before cross-validation (median 0.17) (Figs. 2A (leftmost panel only); 2B (left panel only); S4A; Table S3).
Figure 2. Identification of cell subtypes.
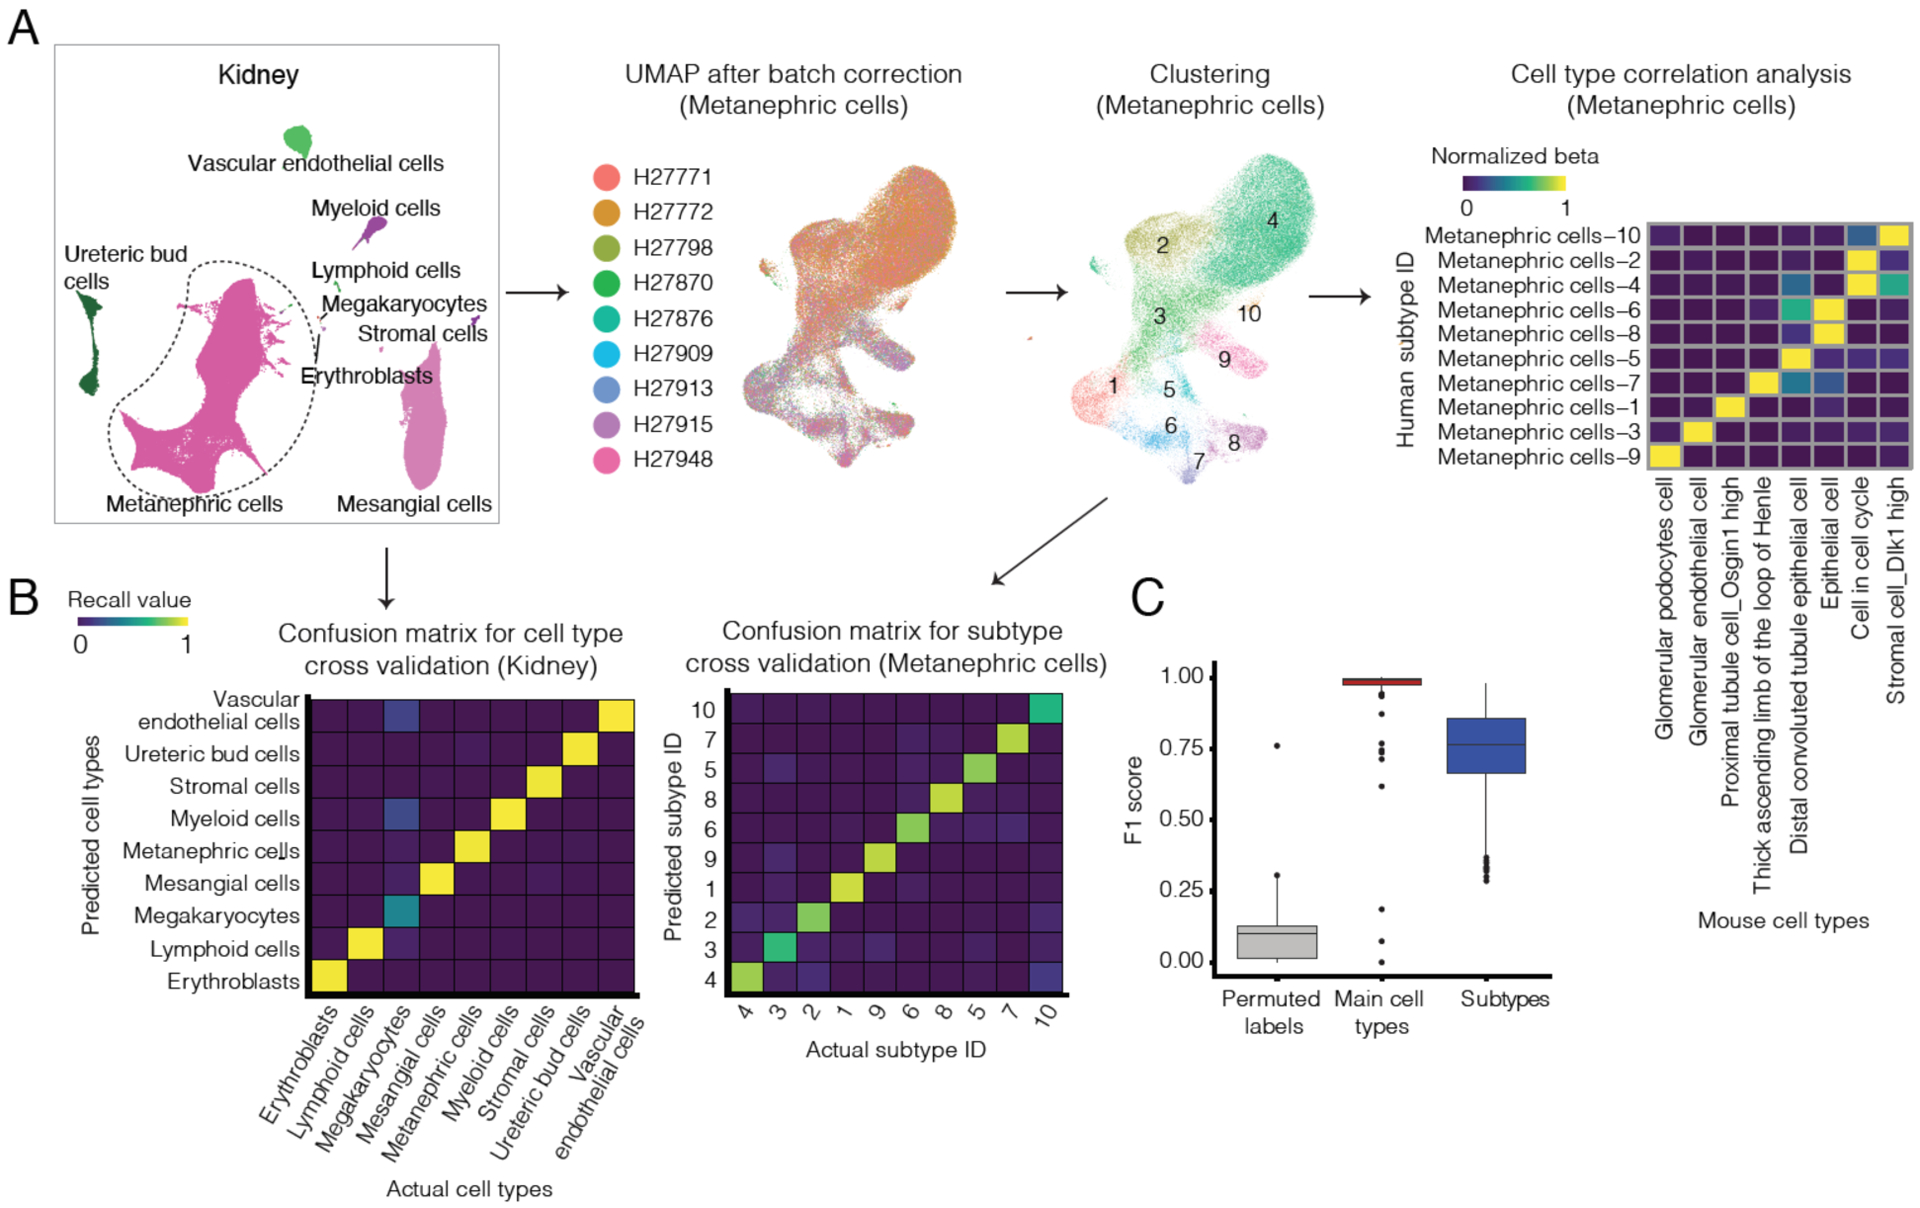
(A) Pipeline for cell subtype identification. Briefly, on a tissue-by-tissue basis, we subjected each main cell type with >1,000 cells to batch correction (102), UMAP visualization and Louvain clustering. Clusters with similar transcriptomes were merged by an automated procedure. Briefly, we applied an intra-dataset cross validation approach (101) to evaluate their specificity and iteratively merged similar clusters. We then compared putative human cell subtypes identified in our data (rows) against annotated mouse cell types from the corresponding tissues (16) (columns) by cell type correlation analysis. Colors correspond to beta values, normalized by the maximum beta value per row. All MCA cell types with a beta of a matched human cell type > 0.01, that is also the maximum beta for that human cell type, are shown for the kidney metanephric cells. (B) Confusion matrix for intra-dataset cell type cross-validation with an SVM classifier for main cell types (left) and metanephric subtypes (right) in the kidney. 2,000 cells (or all cells for cell types with less than 2,000 cells profiled) are randomly sampled for each cell type or subtype before cross-validation analysis. (C) Box plot showing the cell specificity score (F1 score) distribution for permuted controls, main cell types and subtypes, from intra-dataset cross validation.
We then applied this approach to cells from each organ. Once again, annotated main cell types exhibited much higher specificity scores than permuted cell types (Figs. 2C; S4B; median 0.99 vs. 0.10, p-value < 2.2e-16, two-sided Wilcoxon rank sum test). Despite smaller numbers of cells, most of the 15 initially unannotated cell types also exhibited high specificity scores (median 0.98). The exceptions are probably better described as subtypes of other cell types (discussed further below and in (85)). We also applied this method to the consolidated set of 77 main cell types (i.e. rather than organ-by-organ) with similar results (Fig. S4C).
Automated preliminary annotation of cell subtypes
To identify cell subtypes, we performed unsupervised clustering on main cell types with >1,000 cells in any given tissue. For each main cell type in each tissue, we first applied batch correction (102) followed by dimensionality reduction and Louvain clustering (Fig. 2A). After merging clusters that were not readily distinguishable by the intra-dataset cross-validation procedure described above, a total of 657 cell subtypes were identified across the 15 tissues, with a median of 824 cells in each. All subtypes were composed of cells contributed by at least two individuals (median 7). Unsurprisingly given the procedure used for merging clusters, these subtypes have higher specificity scores than permuted controls (median 0.77 vs. 0.13, p-value < 2.2e-16, two-sided Wilcoxon rank sum test; Fig. 2C).
We next sought to leverage existing mouse cell atlases to annotate these human subtypes in an automated fashion. With a cell type cross-matching method that we previously developed (11), we could match 605 of 606 (99%) human cell subtypes to at least one cell type in corresponding fetal and/or adult tissues from the mouse cell atlas (MCA) (16) (specificity score beta > 0.01, the same threshold that we used to align against MCA previously; 51 adrenal subtypes excluded because corresponding MCA tissue not available) (Table S6; Fig. S5–8). In addition, 77 of 148 (52%) cerebral or cerebellar subtypes matched to at least one adult cell type from the mouse brain cell atlas (MBCA) (Fig. S9) (50).
Despite the species difference, many human cell subtypes matched 1:1 with mouse cell types. For example, diverse epithelial subtypes in the human kidney matched 1:1 with annotated MCA cell types (Fig. 2A), while diverse neuronal subtypes in the human cerebrum matched 1:1 with annotated MBCA cell types (Fig. S9). Of note, although there were many sets of human subtypes that matched a single MCA or MBCA cell type (e.g. hepatoblasts in Fig. S5; oligodendrocytes in Fig. S9), these likely reflect bonafide heterogeneity as evidenced by their specificity scores (Fig. 2C). Additional work is necessary to annotate such subtypes with greater granularity.
Integration across tissues and investigation of initially unannotated cell types
We next sought to integrate data and compare cell types across all 15 organs. To mitigate the effects of gross differences in sampling, we randomly sampled 5,000 cells per cell type per organ (or in cases where less than 5,000 cells of a given cell type were represented in a given organ, all cells were taken), and performed UMAP visualization (Figs. 3A; S10A). As expected, cell types represented in multiple organs, as well as developmentally related cell types, tended to colocalize. Many surface proteins (4,565 of 5,480), secreted proteins (2,491 of 2,933), transcription factors (1,715 of 1,984) and noncoding RNAs (3,130 of 10,695) were differentially expressed across the 77 main cell types (FDR of 0.05; Fig. 3B; Table S4; descartes.brotmanbaty.org). The expression patterns of noncoding RNAs were notably sufficient to separate cell types into developmentally coherent groups (Fig. S10B–C).
Figure 3. Integrated visualization of cell types across all profiled tissues.
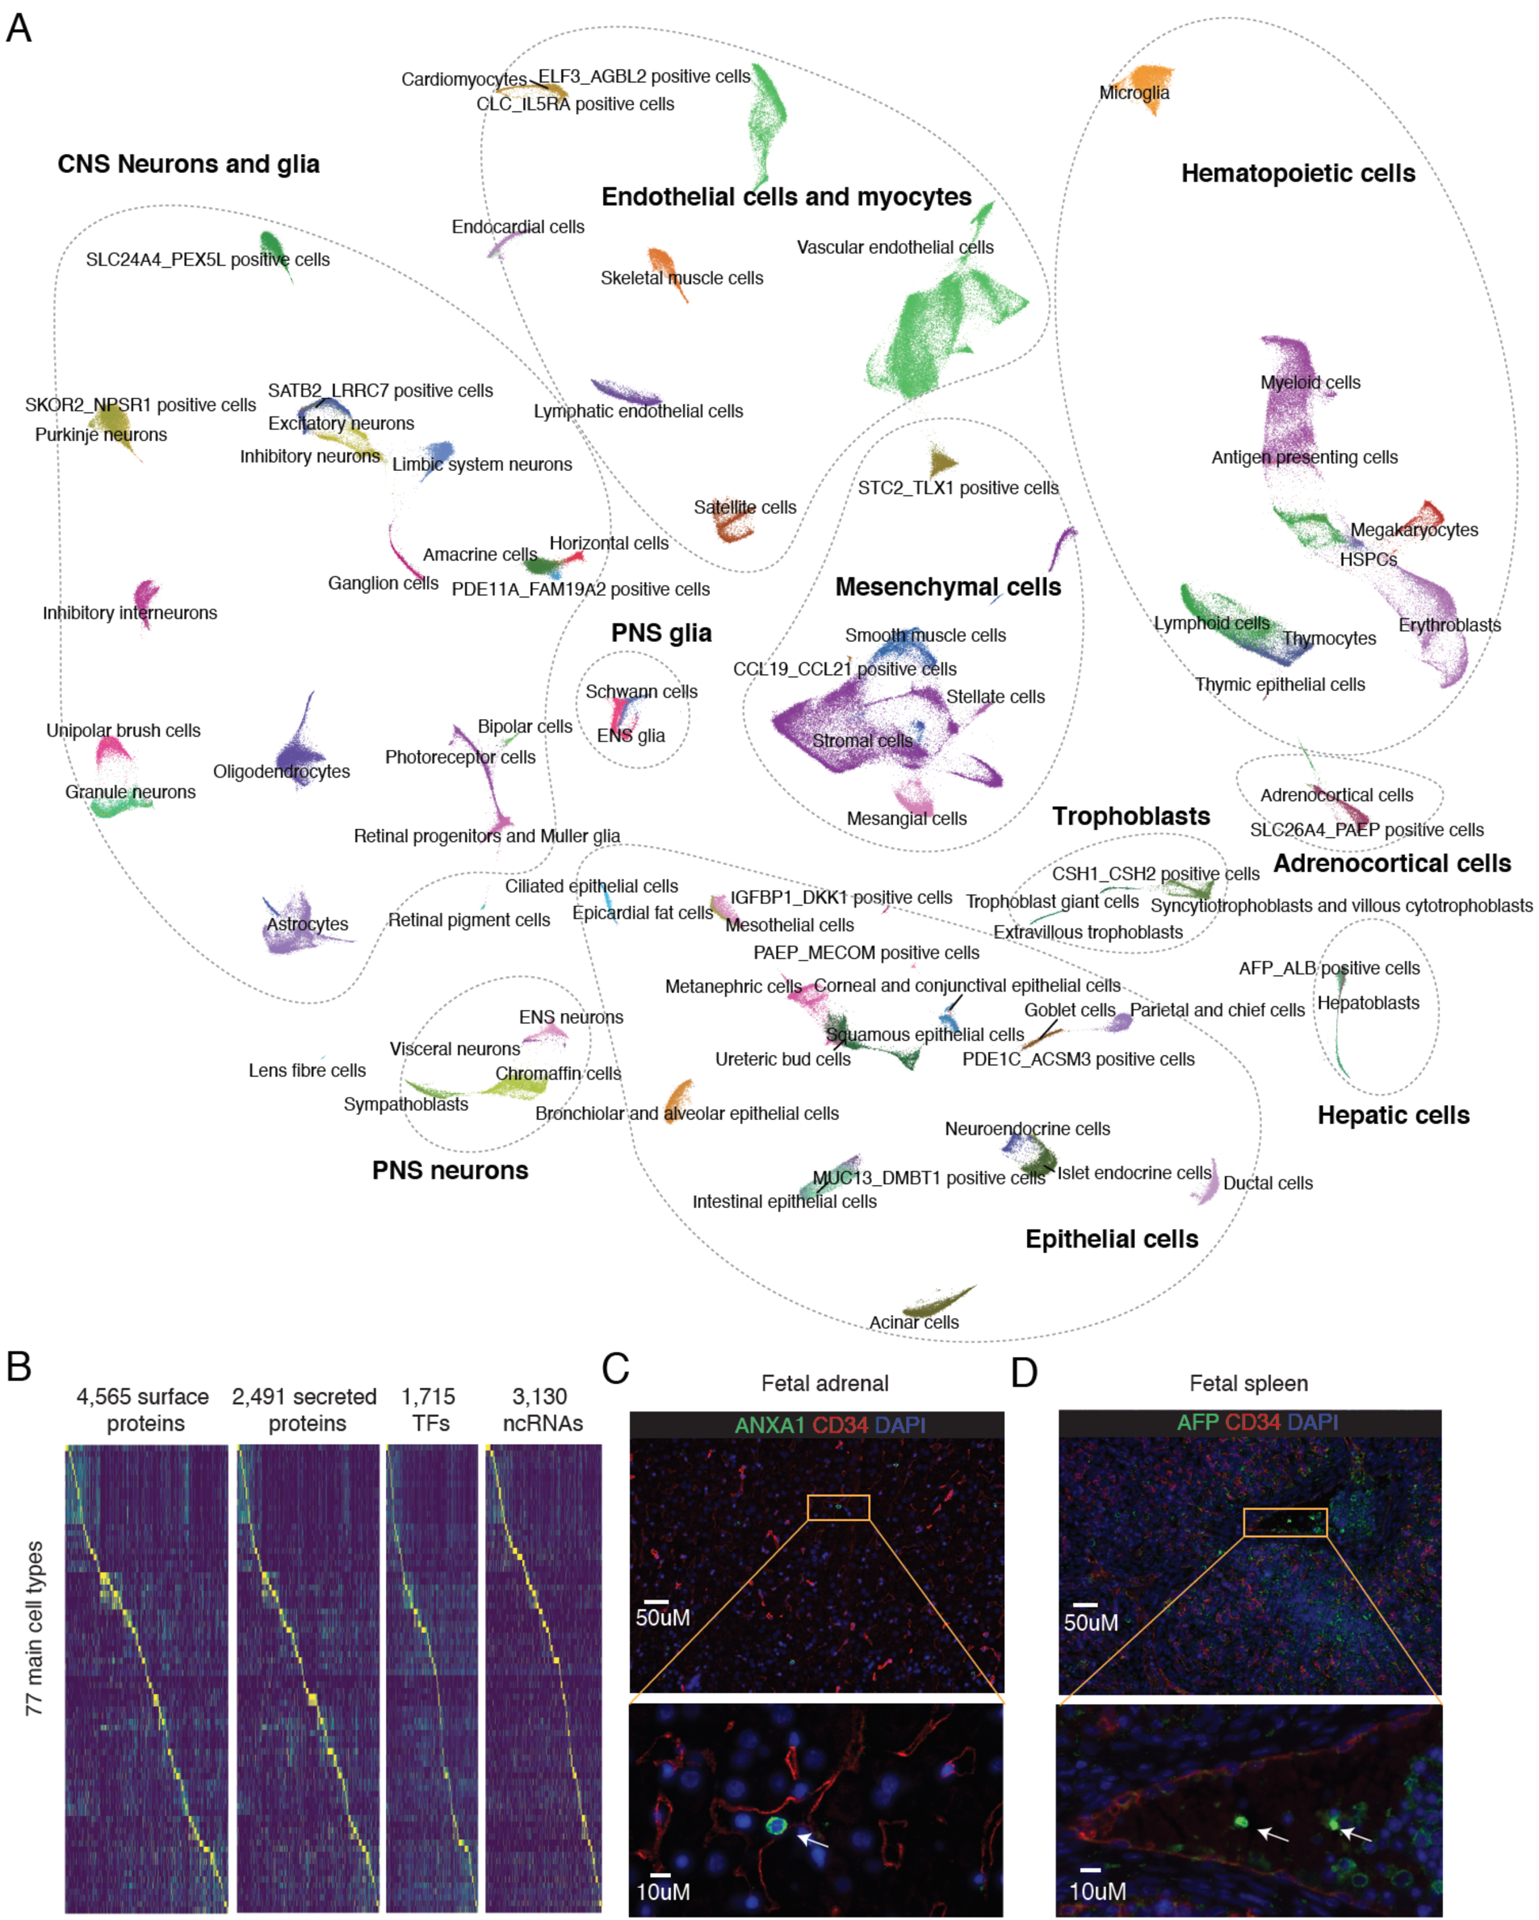
(A) From each organ, we sampled 5,000 cells from each cell type (or all cells for cell types with fewer than 5,000 cells in a given organ). These were subjected to UMAP visualization on the basis of the top differentially expressed genes across cell types within each organ. Here they are colored by cell type labels, with colors as in Fig. 1C. In Fig. S10A, the same UMAP visualization is colored by tissue-of-origin. (B) Heatmap showing the relative expression of surface and secreted protein-coding genes, non-coding RNAs, and TFs (columns) in 77 main cell types (rows). UMI counts for genes are scaled for library size, log-transformed, and then mapped to Z scores and capped to [0, 3]. (C-D) Representative fluorescence microscopy of human fetal adrenal (C) or spleen (D) tissue, staining for for endothelium (CD34+), CSH1+, CSH2+ cells (ANXA1+; labeled by arrowhead) (C) or AFP+, ALB+ cells (AFP+ and labeled by arrowhead) (D). Nuclei are stained with blue DAPI. Bottom panels correspond to inset zooms. Scale bars, 50 μm (top) and 10 μm (bottom).
As noted above, there were 15 cell types that we were unable to annotate during our manual, organ-by-organ review (the subset named by pairs of markers in Fig. 1C). To shed light on these, we examined their distribution in the global UMAP (Fig. 3A), whether they matched to annotated cell types in MCA or MBCA (Figs. S5–9), their distribution across tissues derived from different individuals (Fig. S11A), and their potential for maternal origin (Fig. S11B).
These further analyses enabled us to annotate 8 of the 15 (85). For example, rare CSH1+, CSH2+ cells in the lung and adrenal gland (two of the most deeply profiled organs) are highly similar to placental trophoblasts, e.g. expressing high levels of placental lactogen, chorionic gonadotropin, and aromatase (Fig. 3A; (85)). AFP+, ALB+ cells in the placenta and spleen resemble hepatoblasts, e.g. expressing high levels of serum albumin, alpha fetoprotein, and apolipoproteins (Fig. 3A; (85)); at least in the placenta, similar hepatoblast-like, AFP+, ALB+ cells were observed in the mouse (Fig. S5). Followup immunostaining studies supported the presence of these trophoblast-like and hepatoblast-like cells in the adrenal gland and spleen, respectively (Fig. 3C–D; S12). Given that these cell types are rarely but recurrently observed in several organs, they potentially correspond to circulating trophoblasts and circulating hepatoblasts.
In males, both IGFBP1+, DKK1+ and PAEP+, MECOM+ cells in the placenta expressed appreciable levels of XIST or TSIX (Fig. 12B); upon further review of markers, these correspond to maternal decidualized stromal cells and maternal endometrial epithelial cells, respectively. This conclusion is supported by maternal genotypes in the corresponding cell types in chromatin accessibility data (12).
Several additional cell types were annotated through strong matches to MCA or MBCA (Fig. S13) or through their position in the global UMAP coupled with additional literature review (Fig. 3A; (85)); these include STC2+, TLX1+ cells, which are abundant in the spleen and express genes associated with mesenchymal precursor or stem cells (103–105). Of the remaining 7 initially unannotated cell types, 4 would likely better be classified as subtypes (and correspondingly, these tended to have lower specificity scores), while 3 have high specificity scores but remain ambiguous (85).
Characterization of blood lineage development across organs
The nature of this dataset creates an opportunity to systematically investigate organ-specific differences in gene expression within broadly distributed cell types, e.g. blood cells. We re-clustered 103,766 cells, derived from all 15 organs, that corresponded to hematopoietic cell types (Fig. 4A). We then performed Louvain clustering and further annotated fine-grained blood cell types, in some cases identifying very rare cell types (Fig. 4B). For example, myeloid cells separate into microglia, macrophages and diverse dendritic cell subtypes (CD1C+, S100A9+, CLEC9A+ and pDCs) (106). The microglial cluster primarily derives from brain tissues, and is well separated from macrophages, consistent with their distinct developmental trajectories (107). Lymphoid cells clustered into several groups including B cells, NK cells, ILC 3 cells, and T cells, the latter including the thymopoiesis trajectory. We also recovered very rare cell types such as plasma cells (139 cells, mostly in placenta and comprising 0.1% of all blood cells or 0.003% of the full dataset) and TRAF1+ APCs (189 cells, mostly in thymus and heart and comprising 0.2% of all blood cells or 0.005% of the full dataset).
Figure 4. Identification and characterization of blood cell subtypes and developmental trajectories.
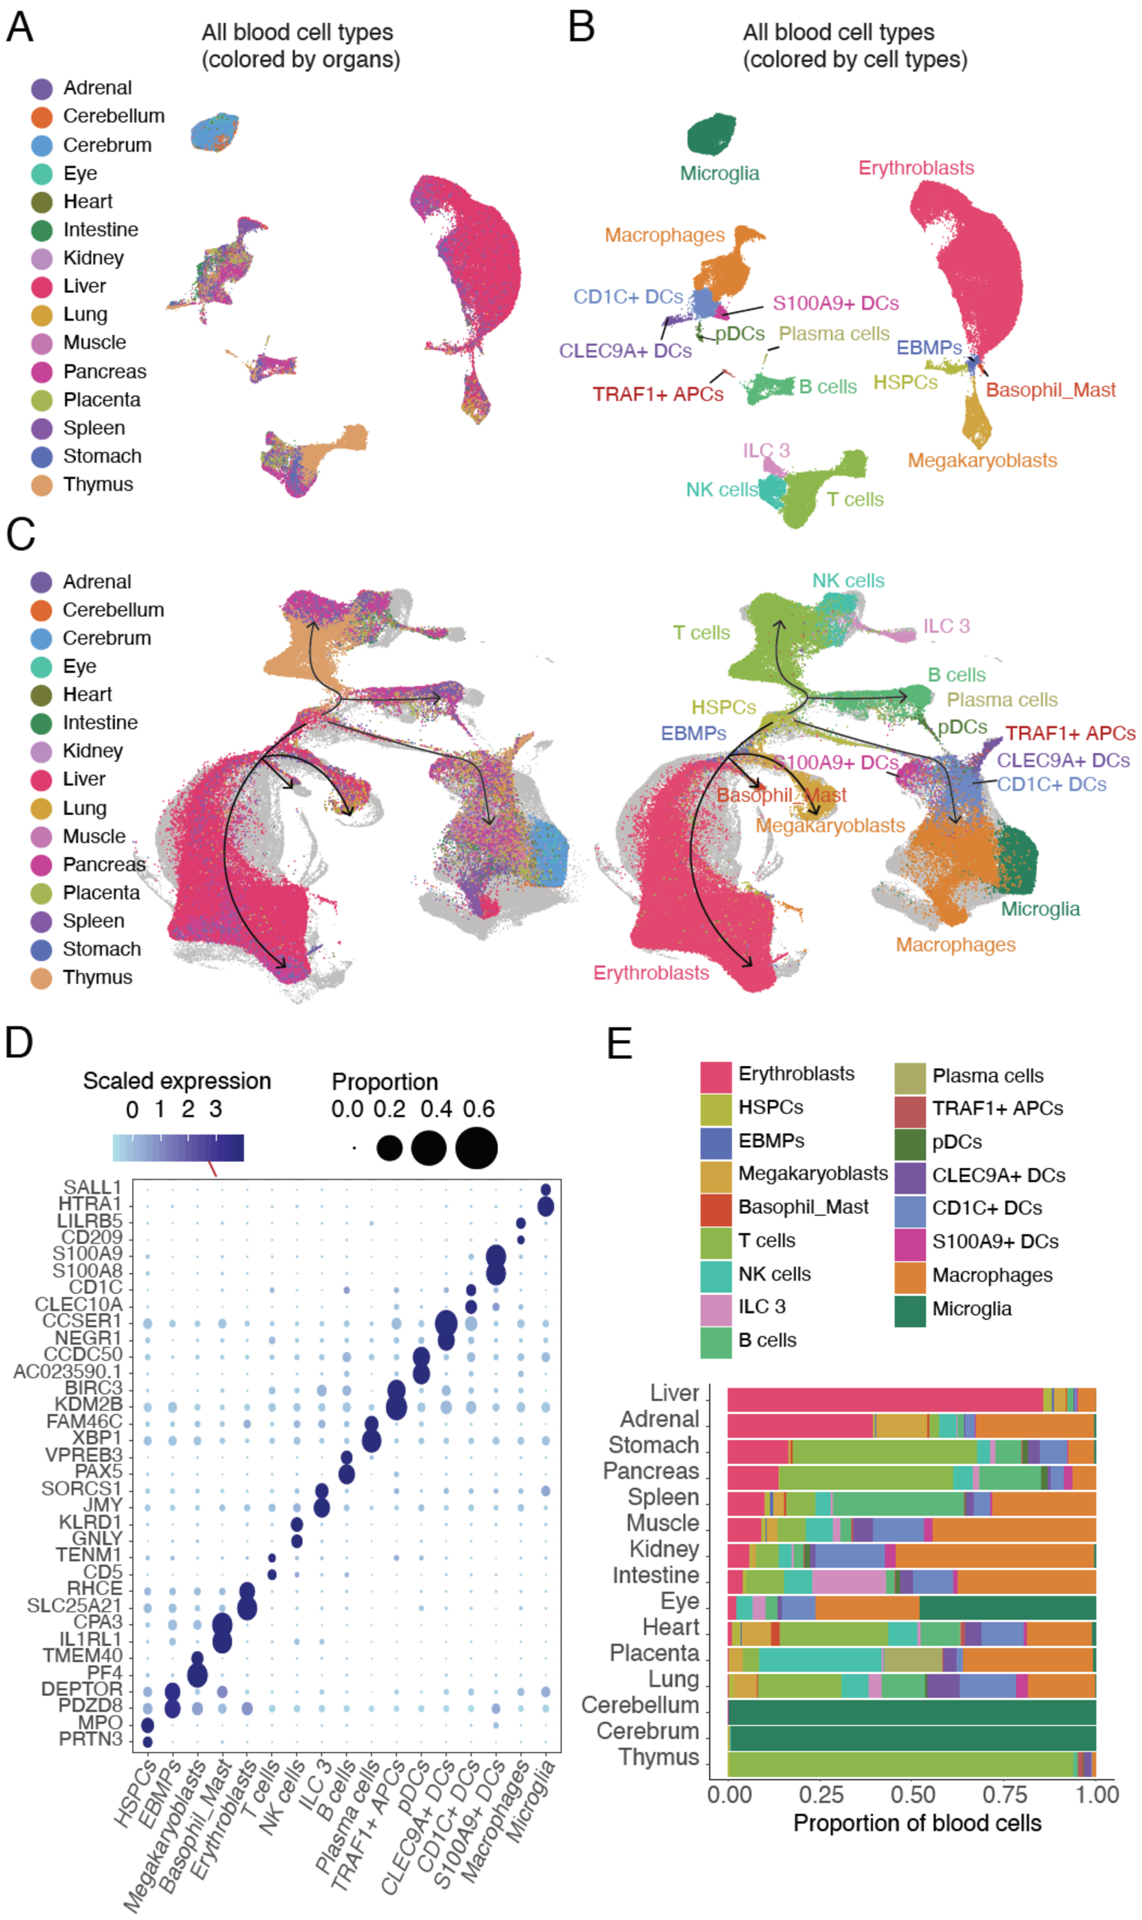
(A-B) UMAP visualization and marker-based annotation of blood cell types colored by organ type (A) and cell type (B). (C) UMAP visualization of blood cells, integrating across all profiled organs of this study and an scRNA-seq atlas of blood cells from human fetal liver (108). Cells from (108) are colored in light grey, while cells from our study are colored by tissue of origin (left) or blood cell types (right). Black arrows indicate inferred cell state transition directions from HSPCs to all main blood lineages. (D) Dotplot showing expression of two selected marker genes per cell type. The size of the dot encodes the % of cells within a cell type in which that marker was detected, and its color encodes the average expression level. (E) Barplot showing the estimated fraction of cells per organ derived from each of the 17 annotated blood cell types.
To validate these annotations, we integrated fetal blood cells from all organs with an scRNA-seq atlas of blood cells from the fetal liver (108) (Figs. 4C, left; S14A). Despite different methods, corresponding cell types from two datasets were highly overlapping; this was also the case upon integration analysis with another scRNA-seq dataset of 1,231 human embryonic blood cells (109)(Fig. S14B). Of note, some extremely rare cell types identified through CD45+ FACS enrichment (e.g. VCAM1+ EI macrophages, monocyte precursors, neutrophil-myeloid progenitors) were not annotated in our data. On the other hand, we capture fetal blood cells derived from tissues other than the liver, e.g. microglia in the brain; T and B cells in the thymus and spleen, respectively. Furthermore, as they span multiple organs, we are better able to capture cell state transition paths from hematopoietic stem/progenitor cells (HSPCs) to lymphoid cells than a single organ study (Fig. 4C, right).
Although gene expression markers for different immune cell types have been extensively studied, these may be limited by their definition via a restricted set of organs or cell types. Indeed, here we find that many conventional immune cell markers were expressed in multiple cell types. For example, conventional markers for T cells (110–112) were also expressed in macrophages and dendritic cells (CD4) or NK cells (CD8A), consistent with other studies (113) (Fig. S14C). We computed pan-organ cell type-specific markers across 14 blood cell types (Fig. 4D; Table S7). From this we observed that T cells specifically expressed CD8B and CD5 (114) as expected, but also TENM1 (Figs. 4D; S14C). ILC 3 cells, whose annotation was determined on the basis of their expression of RORC (115) and KIT (116), were more specifically marked by SORCS1 and JMY (Figs. 4D; S14C). These and other markers identified by pan-organ analysis may be useful for labeling and purifying specific blood cell types.
As expected, different organs showed varied proportions of blood cells (Fig. 4E). For example, the liver contained the highest proportion of erythroblasts, consistent with its role as the primary site of fetal erythropoiesis (117), while T cells were enriched in the thymus and B cells in the spleen. Nearly all blood cells recovered from the cerebellum and cerebrum were microglia. The tissue distribution of ILC 3 cells as well as subtypes of dendritic cells was captured as well (Figs. 4E; S14D). Pan-organ analysis also enabled the identification of rare cell populations in specific organs. We identified rare HSPCs in the liver, but also rare cells that are transcriptionally similar to HSPCs in the lung, spleen, thymus, heart, intestine, adrenal gland and other organs (Fig. S15). Sub-clustering analyses showed that HSPCs outside of the liver, as well as a subset of liver HSPCs, expressed differentiation markers such as LYZ (118), ACTG1 (119) and ANK1 (120), while most liver HSPCs expressed MECOM and NRIP1, both required for the maintenance and function of normal quiescent HSPCs (121, 122) (Fig. S15).
Focusing on erythropoiesis, we observed a continuous trajectory from HSPCs to an intermediate cell type, Erythroid-Basophil-Megakaryocyte biased Progenitors (EBMP), which then split to erythroid, basophilic and megakaryocytic trajectories (Fig. 5A; Table S8), consistent with a recent study of mouse fetal liver (123, 124). This consistency was despite differences in species (human vs. mouse), techniques (sci-RNA-seq3 vs. 10x) and tissues (pan-organ vs. liver-only). With unsupervised clustering and adopting terminology from that study (123), we further partitioned the continuum of erythroid states into three stages: early erythroid progenitors (EEPs; marked by SLC16A9 and FAM178B), committed erythroid progenitors (CEPs; marked by KIF18B and KIF15), and cells in the erythroid terminal differentiation state (ETDs; marked by TMCC2 and HBB) (Fig. 5B). Early and late stages of megakaryocytic cells were also readily identified (Fig. 5A–B).
Figure 5. Identification and characterization of erythropoiesis and macrophage differentiation in adrenal gland.
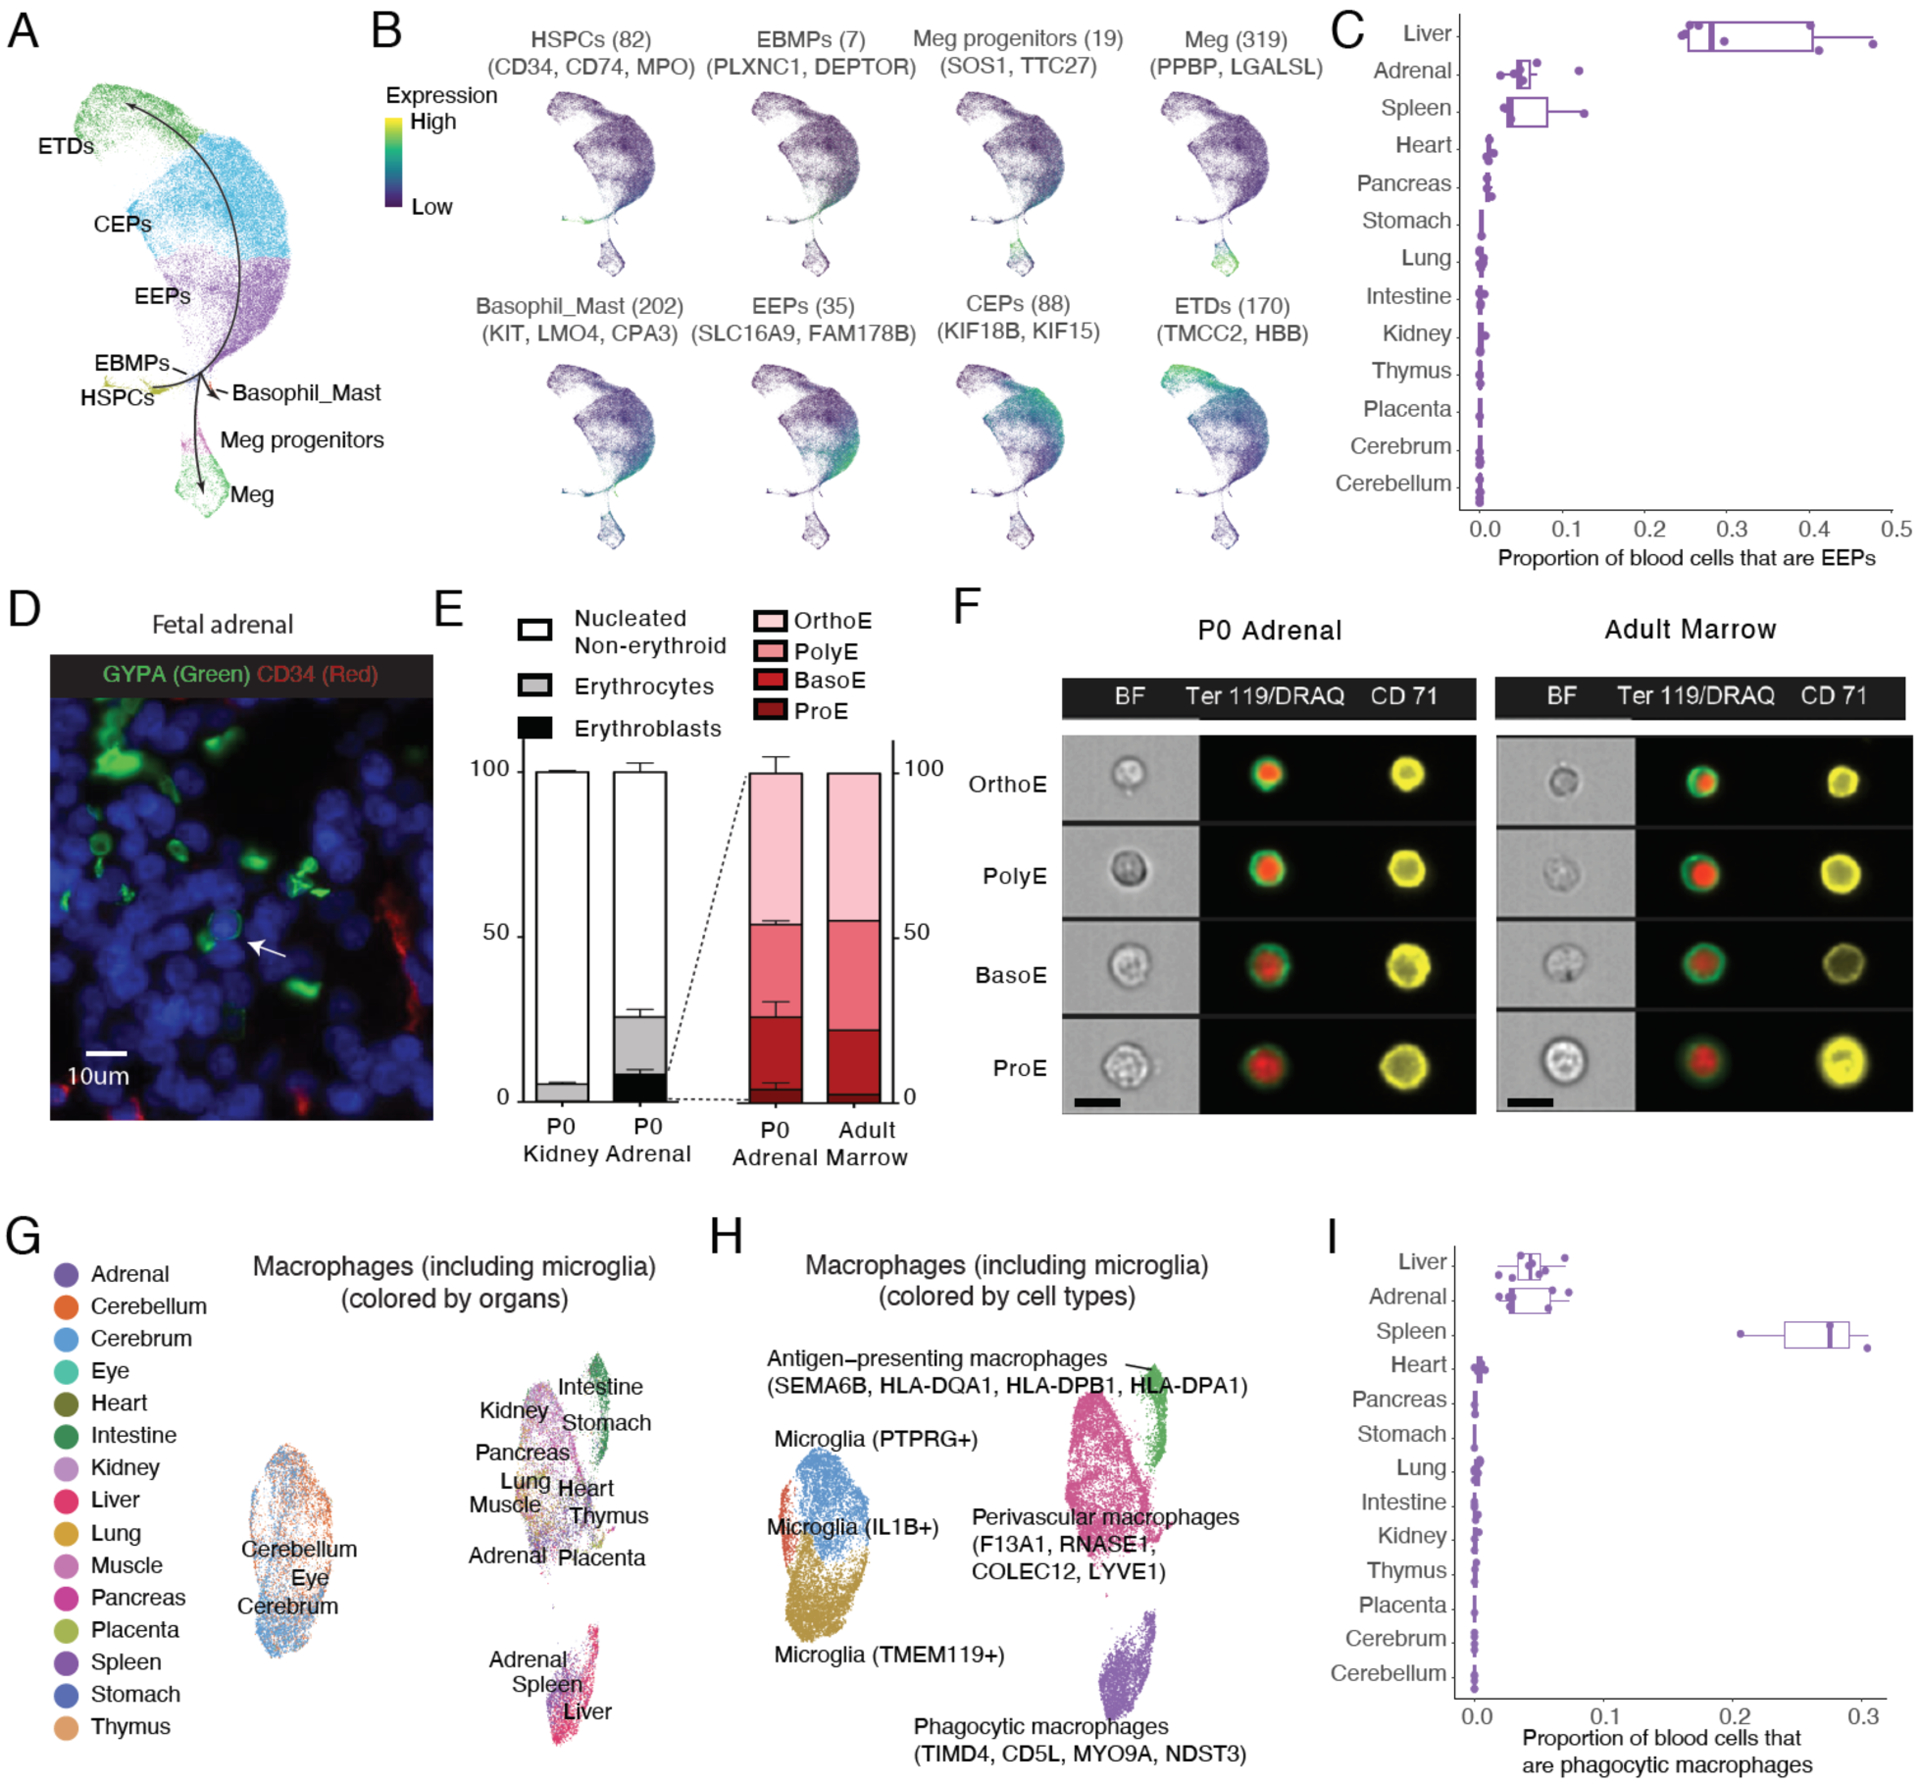
(A) Zoomed view of the erythropoiesis trajectory portion of Fig. 4B, colored by erythroid or megakaryocyte subtype. Black arrows show trajectory directionalities defined by (123). (B) Plots similar to (A), colored by the normalized expression of cell type-specific genes (FDR of 0.05 and over 2-fold expression difference between first and second ranked cell type), with the number of cell type-specific genes used and names of top few genes shown. UMI counts for these genes are scaled for library size, log-transformed, aggregated and then mapped to Z scores. (C) Point and box plot showing the proportion of blood cells that are EEPs for individual samples of different organs. Samples with low recovery of blood cells (<= 200) are excluded. (D) Representative fluorescence microscopy of human fetal adrenal tissue, staining for endothelium (CD34+) and erythroblasts (nucleated and GYPA+); nuclei stained with blue DAPI. The arrow indicates an GYPA+ erythroblast outside a CD34+ blood vessel. Scale bars, 10 μm. (E) Left: percentage of dissociated kidney and adrenal glands from newborn (P0) mice composed of enucleated erythrocytes and maturing erythroblasts. Right: distribution of maturing erythroblasts (proerythroblasts, ProE; basophilic erythroblasts, BasoE; polychromatophilic erythroblasts, PolyE; and orthochromatic erythroblasts, OrthoE) in the adrenal gland at P0 and in adult bone marrow. Error bars represent mean + SEM, n=3. (F) Representative images of maturing erythroblasts in the P0 adrenal gland and the adult bone marrow. Size bar = 10 μm. (G-H) UMAP visualization and marker-based annotation of macrophage subtypes colored by organ type (G) and subtype name (H). (I) Point and box plot showing the proportion of blood cells that are phagocytic macrophages for individual samples of different organs. Samples with low recovery of blood cells (<= 200) are excluded.
As expected given their established role in fetal erythropoiesis, a portion of blood cells in the liver and spleen corresponded to EEPs, CEPs and megakaryocyte progenitors (125). Of note, we also observed EEPs, CEPs and megakaryocyte progenitors in the adrenal gland, in every sample studied (Figs. 5C; S16A). Because we do not observe cell types that are more common in the liver and spleen, trivial contamination during recovery of adrenal glands is an unlikely explanation. While occasional islands of extramedullary hematopoiesis have been observed in the adrenal glands of human embryos (126, 127), the consistency across individuals led us to further investigate whether the adrenal glands may serve as a normal site of erythropoiesis in mammals. Immunohistochemical analysis of human fetal adrenal tissues showed nucleated GYPA+ cells outside CD34+ blood vessels (Fig. 5D; S16B). We further used imaging flow cytometry to visualize and enumerate maturing erythroid precursors and enucleated erythrocytes (128) in the perinatal period of the mouse. Approximately 8% of viable dissociated cells from the adrenal gland consisted of maturing erythroblasts, compared to 0.2% in the kidney (Fig. 5E). Also consistent with the adrenal gland being a site of ongoing erythropoiesis, its distribution of immature to mature erythroblasts matched closely with that of the bone marrow of adult mice (Fig. 5E–F).
Macrophages were even more widely distributed. We collated all macrophages, together with microglia from the brain, and subjected them to UMAP visualization and Louvain clustering, independent of other cell types (Figs. 5G–H; S16C; Table S9). Interestingly, microglia were divided into three sub-clusters, one of which, marked by IL1B and TNFRSF10D, likely represents activated microglia expressing pro-inflammatory cytokines involved in the normal development of the nervous system (129, 130). The other microglial clusters were marked by expression of TMEM119 and CX3CR1 (131) (more common in cerebrum) or PTPRG and CDC14B (132) (more common in cerebellum).
The macrophages outside the brain clustered into three major groups (Figs. 5G–H; S16C; Table S9): 1) antigen-presenting macrophages, found mostly in GI tract organs (intestine and stomach) and marked by high expression of antigen-presenting (e.g. HLA-DPB1, HLA-DQA1) and inflammatory activation (e.g. AHR (133)) genes; 2) perivascular macrophages, found in most organs, with specific expression of markers such as F13A1 (134) and COLEC12 (135), as well as novel markers such as RNASE1 and LYVE1. 3) phagocytic macrophages, enriched in the liver, spleen and adrenal gland (Fig. 5I), with specific expression of markers such as CD5L (136), TIMD4 (137) and VCAM1 (138). Phagocytic macrophages are critical for removing the pyrenocytes (the so-called ‘extruded nucleus’) following enucleation of late-stage erythroblasts to form reticulocytes; their observation in the adrenal gland is consistent with its aforementioned potential role as an additional site of normal fetal erythropoiesis.
Further below, we leverage integration with a mouse atlas of organogenesis (11) to investigate the conserved program of blood cell specification and developmental origins of microglia and macrophages.
Characterization of endothelial and epithelial cells across organs
As a second analysis of a single class of cells across many organs, we reclustered 89,291 endothelial cells (ECs) that correspond to vascular endothelium (VECs), lymphatic endothelium (LECs) or endocardium. These three groups readily separated from one another, and VECs further clustered, at least to some degree, by organ (Fig. S17A–C). That organ-specific differences are more readily detected than differences between arteries, capillaries and veins, is consistent with previous cell atlases of the adult mouse (16, 28). We performed an integrative analysis of ECs from human fetal (this study) and mouse adult (139) tissues (Fig. S17D–E). Both human and mouse ECs separated first by vascular vs. lymphatic vs. endocardial, and then by organ. VECs from the same tissue were generally clustered together despite differences with respect to species, developmental stage and technique. Conserved markers of organ-specific ECs were readily identified (Fig. S17F) (140).
Differential gene expression analysis identified 700 markers that are specifically expressed in a subset of ECs (FDR of 0.05, over 2-fold expression difference between first and second ranked cluster) (Fig. S17G; Table S10). About one-third of these encoded membrane proteins, many of which appeared to correspond to potential specialized functions (12, 141–143). In agreement observations in mouse (139), brain ECs specifically expressed gene sets involved in amino acid transport (q-value = 5.6e-10) and carboxylic acid transport (q-value = 4.2e-8); lung ECs specifically expressed gene sets involved in cAMP (q-value = 8.2e-3) and cyclic nucleotide (q-value = 1.4e-2) catabolism, and vascular ECs from the GI tract, heart and muscle specifically expressed gene sets involved in stem cell differentiation (q-value = 3.7e-2). Potentially underlying these differences, human fetal ECs expressed distinct sets of TFs (Fig. S17H). For example, LECs specifically expressed TBX1, brain VECs specifically expressed FOXQ1 and FOXF2, and liver VECs specifically expressed DAB2, all consistent with observations in mice (139, 144, 145).
As a third analysis of a broadly distributed type of cell, we reclustered 282,262 epithelial cells, derived from all organs, and subjected these to UMAP visualization (Fig. S18A–B). While some epithelial cell types were highly organ-specific, e.g. acinar (pancreas) and alveolar cells (lung), epithelial cells with similar functions generally clustered together (Fig. S18C).
Within epithelial cells, two neuroendocrine cell clusters were identified (Fig. S18C). The simpler of these corresponded to adrenal chromaffin cells and was marked by the specific expression of HMX1 (NKX-5–3), a TF involved in sympathetic neuron diversification (146). The other cluster comprised neuroendocrine cells from multiple organs (stomach, intestine, pancreas, lung) and was marked by specific expression of NKX2–2, a TF with a key role in pancreatic islet and enteroendocrine differentiation (147). We performed further analysis on the latter group, identifying five subsets (Fig. S18D–F): 1) pancreatic islet beta cells, marked by insulin expression; 2) pancreatic islet alpha/gamma cells, marked by pancreatic polypeptide and glucagon expression; 3) pancreatic islet delta cells, marked by somatostatin expression; 4) pulmonary neuroendocrine cells (PNECs), marked by expression of ASCL1 and NKX2–1, both TFs with key roles in specifying this lineage in the lung (148, 149); and 5) enteroendocrine cells. Enteroendocrine cells further comprised several subsets including NEUROG-expressing pancreatic islet epsilon progenitors (150, 151), TPH1-expressing enterochromaffin cells in both the stomach and intestine (152), gastrin- or cholecystokinin-expressing G/L/K/I cells (152). Finally, we observed ghrelin-expressing enteroendocrine progenitors in the stomach and intestine (151, 153), but also ghrelin-expressing endocrine cells in the developing lung (154) (Fig. S18F). The diverse functions of neuroendocrine cells are closely linked with their secreted proteins; we identified 1,086 secreted protein-coding genes differentially expressed across neuroendocrine cells (FDR of 0.05) (Fig. S18G; Table S11). For example, PNECs showed specific expression of trefoil factor 3, involved in mucosal protection and lung ciliated cell differentiation (155), gastrin-releasing peptide, which stimulates gastrin release from G cells in the stomach (156), and SCGB3A2, a surfactant associated with lung development (157).
As an illustrative example of how these data can be used to explore cell trajectories, we further investigated the path of epithelial cell diversification leading to renal tubule cells. Combining and reclustering ureteric bud and metanephric cells, we identified both progenitor and terminal renal epithelial cell types, with differentiation paths that are highly consistent with a recent study of the human fetal kidney (158) (Fig. S19A). By differential gene expression analysis, we further identified TFs potentially regulating their specification (Fig. S19B; Table S12). For example, nephron progenitors in the metanephric trajectory specifically expressed high levels of mesenchyme and meis homeobox genes (MEOX1, MEIS1, MEIS2) (159), while podocytes specifically expressed MAFB and TCF21/POD1 (160, 161). As another example, HNF4A was specifically expressed in proximal tubule cells; a mutation of this gene causes Fanconi renotubular syndrome, a disease that specifically affects the proximal tubule, and HNF4A was recently shown to be required for formation of the proximal tubule in mice (162).
Integration of human and mouse developmental atlases
The transition from embryonic to fetal development is of considerable interest, but access to human embryonic tissues is even more limited than fetal tissues. To again leverage the mouse, we sought to integrate these human fetal data with a mouse organogenesis cell atlas (MOCA), for which we previously profiled 2 million cells from undissected embryos spanning E9.5 to E13.5 (11). For context, this window corresponds to days 22–44 of human development (163, 164), while the tissues studied here are estimated to derive from days 72–129.
First, we compared the 77 main cell types defined here against the developmental trajectories of organogenesis defined by MOCA via cell type cross-matching method (11). Most human cell types strongly matched to a single major mouse trajectory and sub-trajectory (Fig. S20; Tables S13–14). These generally corresponded to expectation, although a few discrepancies facilitated important corrections to MOCA (see Figs. S20–21 legends). Many human cell types and mouse trajectories that lacked strong 1:1 matches (summed NNLS regression coefficients < 0.6) corresponded to tissues excluded in the other dataset (e.g. mouse placenta; human skin and gonads). Other ambiguities probably follow from the gap between the developmental windows studied (e.g. adrenal cell types), rarity (e.g. bipolar cells) and/or complex developmental relationships (e.g. fetal cell types that derive from multiple embryonic trajectories).
Second, we sought to directly co-embed human and mouse cells together. In brief, we sampled 100,000 mouse embryonic cells from MOCA (randomly) and ~65,000 human fetal cells (max 1,000 cells from each of 77 cell types) and subjected these to integrated analysis (15). The distribution of mouse cells in the resulting UMAP visualization was similar to our global analysis of MOCA (Figs. 6A–C; S21–S23) (11). Furthermore, despite the species difference, human fetal cells were overwhelmingly distributed in a manner that respected developmental relationships between cell types. For example, human fetal endothelial, hematopoietic, hepatic, epithelial and mesenchymal cells all mapped to the corresponding mouse embryonic trajectories (Fig. 6B; S21). Within each major trajectory, mouse cells order by successive time point (11), while human fetal cells appear to project from the last (E13.5) mouse embryonic time point (Fig. 6C). At the sub-trajectory level, seniscal mappings include human fetal intestinal epithelial cells emanating from the mouse midgut/hindgut sub-trajectory; human fetal parietal and chief cells (stomach) and acinar and ductal cells (pancreas) emanating from the mouse foregut epithelial sub-trajectory; human fetal bronchiolar and alveolar epithelial cells emanating from the mouse lung epithelial trajectory; human fetal ureteric bud and metanephric cells emerging separately from the mouse embryonic renal epithelial trajectory; and many others (Figs. S21–23).
Figure 6. Integration of human fetal and mouse embryonic cell atlases.
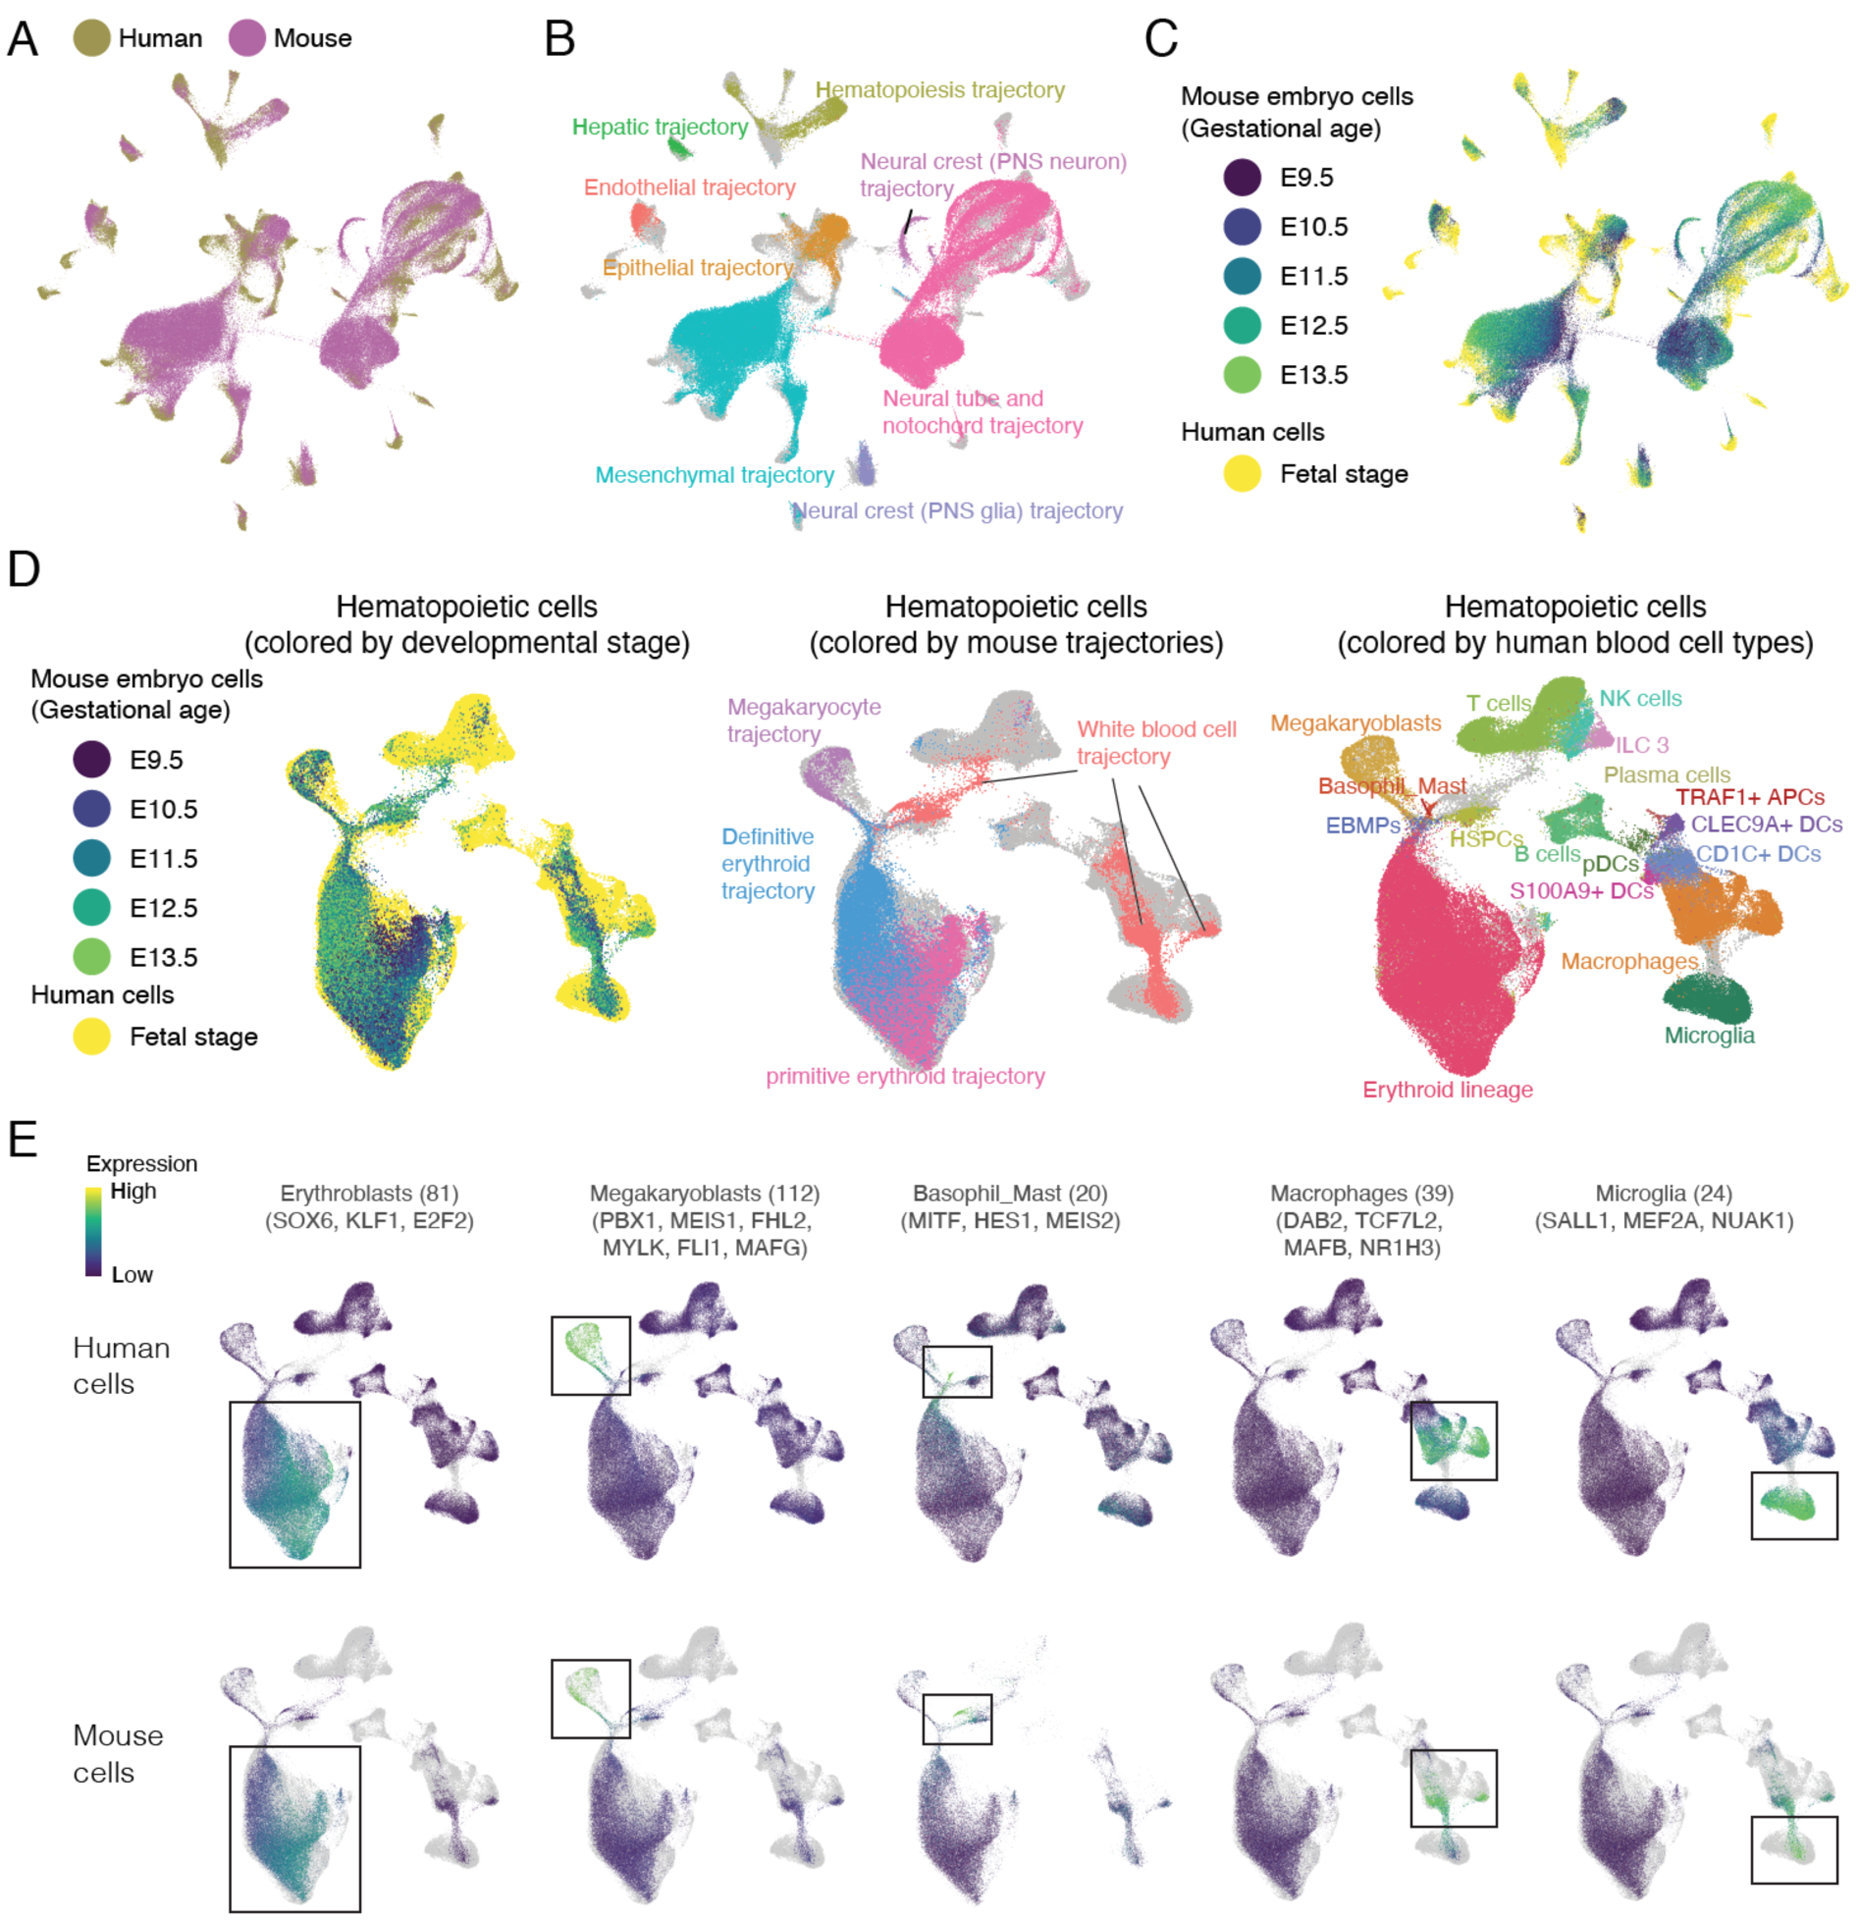
(A-C) After downsampling as described in the text, we applied Seurat (15) to jointly analyze human fetal and mouse embryonic cells (11). (A) Cells are colored by source species. (B) Mouse cells are colored by the identity of the main mouse embryonic trajectory (11). Human cells are colored in grey. (C) Cells are colored by source and development stage. Within each major trajectory and as previously (11), mouse cells order by successive time points, and human fetal cells appear to project from the last (E13.5) mouse embryonic time point. (D) We applied Seurat (15) to jointly analyze 103,766 human and 40,606 mouse hematopoietic cells. The same UMAP visualization is shown in all panels. Left: Cells are colored by source and development stage. Middle: Mouse cells are colored by the identity of mouse sub-trajectory (11). Human cells are colored in grey. Right: Human cells are colored according to annotations from Fig. 4B. Mouse cells are colored in grey. (E) Plot similar to (D), colored by the normalized expression of human-mouse conserved cell type-specific genes, with their number listed and top TFs named. UMI counts for these genes are scaled for library size, log-transformed, aggregated and then mapped to Z scores.
However, there were also a few surprises. For example, although CNS neurons mapped to the neural tube trajectory and ENS glia and Schwann cells to PNS glial trajectories, some neural crest derivatives including ENS neurons, visceral neurons, sympathoblasts and chromaffin cells clustered separately from the corresponding mouse embryonic trajectories (Figs. S21–23), potentially due to excessive differences between the developmental stages or between the species. Human fetal astrocytes clustered with the mouse embryonic neural epithelial trajectory (mouse astrocytes do not develop until E18.5 (165)). Human fetal oligodendrocytes overlap a rare mouse embryonic sub-trajectory (Pdgfra+ glia) that in retrospect is more likely to correspond to oligodendrocyte precursors (Olig1+, Olig2+, Brinp3+) (166, 167), and calls into question our previous annotation of a different Olig1+ sub-trajectory as oligodendrocyte precursors (11). These and other unexpected relationships merit further investigation.
To assess relationships between mouse embryonic and human fetal cells in greater detail, we applied the same strategy to extracted cells from the hematopoietic (Figs. 6D; S24), endothelial (Fig. S25) and epithelial (Fig. S26) trajectories. In these visualizations, we observe examples of the organ-resolved human data deconvoluting the “whole embryo” mouse data into more fine-grained subsets. For example, subsets of the mouse “white blood cell” embryonic sub-trajectory (11) map to specific human blood cell types such as HSPCs, microglia, macrophages (liver and spleen), macrophages (other organs) and DCs (Fig. 6D). These subsets were further validated by the expression of related blood cell markers (Fig. S24C) and annotated based on their human k-nearest-neighbours (k = 3) in the co-embedding (Fig. S24D).
Out of 1,087 human fetal blood cell type specific gene markers that are also differentially expressed across mouse blood cell types, 337 genes were differentially expressed (FDR of 0.05) in the same cell type (Fig. 6E; Table S15; for comparison, only 12 genes intersected after permutations of labels). 28 of these 337 conserved markers were TFs, 24 of which have been previously reported to be involved in early blood cell differentiation or maintenance for target cell types, e.g. HLF as a critical regulator of HSPCs quiescence (168), MITF as driving mast cell differentiation (169), PAX5 as a master regulator of B cell development (170), and SOX6 as enhancing the differentiation of erythroid progenitors (171). However, 4 of the 28 conserved marker TFs have not been previously characterized in the relevant context -- NR1D2 in IL 3 cells, TCF7L2 in macrophages, FHL2 in megakaryoblasts, and NUAK1 in microglia.
In this same analysis, human fetal macrophage and microglia form distinct clusters, but are connected by a subset of mouse cells from the white blood cell trajectory (Fig. 6D), consistent with previous studies showing that both cell types differentiate from yolk sac progenitors (172). To explore this further, we extracted and reanalyzed 4,327 mouse embryonic microglia and macrophages via unsupervised trajectory analysis (173). We observed three smooth cell differentiation trajectories from a common progenitor to microglia in the brain, phagocytic macrophages (TIMD4+, CD5L+; mostly in liver, spleen, adrenal), and perivascular macrophages (F13A1+, LYVE1+; widely distributed) (Fig. S27A; Fig. 5). The directionality of progression through pseudotime along each macrophage trajectory was consistent with real developmental time (Fig. S27B). 1,412 genes, including 111 TFs, were differentially expressed in the three macrophage branches (Table S16). For example, the microglial trajectory showed elevated expression of BACH2 and RUNX3 as well as known microglial regulators SALL1 (174) and MEF2A (174, 175), perivascular macrophages of DAB2, and TCF7L2, phagocytic macrophages of MAFB and NR1H3 (Fig. S27C). Overall, these analyses illustrate how fetal annotations can be used to identify and characterize progenitors of specific lineages at developmental time points where they may be difficult to resolve on their own, even across species.
Discussion
Two centuries after the formulation of the cell theory -- the assertion that all living things consist of cells and that the cell is the most basic unit of life (176) -- we are on the cusp of cataloging and characterizing all cell types that constitute a human body, both in health and disease. To this end, the field of single cell biology is progressing at an astonishing rate, propelled by a synergy between new technologies and new computational methods to make sense of the data produced by those technologies. In the past few years alone, this synergy has enabled compelling and informative single cell atlases of many human organs as well as of entire model organisms (11, 51, 69, 108, 153, 177–183).
Human development is a remarkable process that begins with a fertilized zygote and proceeds through a germinal stage followed by embryogenesis. By the end of the tenth week, the embryo has acquired its basic form, and is termed a fetus. For the following thirty weeks, all organs continue to grow and mature, with diverse terminally differentiated cell types arising from their progenitors. Although the germinal and embryogenesis stages have been intensively profiled with single cell methods in humans or mice (11, 181, 182), it has been more challenging to profile the fetal stage. Although several single cell studies of human fetal development recently appeared (153, 183–185), these are restricted to individual organs or cell lineages, and fail to obtain a comprehensive view.
In this study, together with (12), we set out to generate single cell atlases of gene expression and chromatin accessibility using diverse tissues obtained during human fetal development. From 15 distinct organs, we successfully profiled gene expression in ~4 million single cells and chromatin accessibility in ~800,000 single cells. Important limitations of these datasets include non-uniform sampling (i.e. more cells profiled in some organs than others), missing tissues (most notably, bone marrow, skin, bone, gonads), relatively low sequencing depth and the sparsity of single cell molecular profiles. Nonetheless, we notably identified hundreds of cell types and subtypes that are supported by both a framework for quantifying specificity as well as by matching nearly all of them to cell types or subtypes from published mouse atlases.
In contrast with organ-specific studies, the diversity of tissues profiled here enabled cross-tissue comparisons of broadly distributed cell types. We emphasize that our process for annotating cell types benefited tremendously from the myriad single cell atlases of specific human organs or other mammals that have been generated to date (8, 9, 11, 16, 28, 50, 108, 139). Of course, decisions in the annotation process can be subjective (e.g. over- vs. under-clustering), and both cell type and subtype annotations made here should be considered preliminary and subject to revision.
The apparent hematopoiesis that we observe in the fetal adrenal gland is consistent with the fact that the adrenal gland, along with many other organs (e.g. spleen, liver, and lymph nodes), can serve as a site of extramedullary hematopoiesis in adults with pathologic conditions that lead to an increased demand for blood cell production, particularly hemoglobinopathies (186, 187). While occasional islands of extramedullary hematopoiesis have been seen in the adrenal glands of human embryos (126, 127), our findings both in the human and mouse provide quantitative evidence that the adrenal gland serves as a normal, albeit minor, site of erythropoiesis during a developmental window that overlaps with the transition of hematopoiesis from the liver to the marrow.
An additional surprise, at least to us, was the ease with which we were able to integrate single cell profiles from mouse organogenesis and human fetal development, given that these represent different stages of mammalian development not to mention our separation from mice by >100 million years of evolution. The relatively straightforward alignment of the datasets highlights the extent of evolutionary constraint on the molecular programs of individual cell types, and furthermore lends support to long-standing use of the mouse as a powerful model system for studying human development.
Looking forward, we envision that the somewhat narrow window of midgestational human development studied here will be complemented by additional atlases of earlier and later timepoints (e.g. embryonic, adult), as well as similarly comprehensive profiling and integration of data from model organisms. The continued development and application of methods for ascertaining gene expression and chromatin accessibility in concert with spatial, epigenetic, proteomic, lineage history, and other information, will necessary to obtain a comprehensive view of temporal unfolding of human cell type diversity that begins at the single cell zygote.
To date, investigations of human development have largely been indirect, with key molecular factors nominated by human genetics and then investigated in model organisms and/or in vitro systems. Knowledge of the in vivo landscape of gene expression and regulation has been limited. In filling part of this gap, we hope that this atlas will enable a better understanding of the molecular and cellular basis of both rare and common disorders of human development, while also informing the path to successful therapies.
Online Materials and methods
A more detailed version of materials and methods is provided with the supplementary materials.
sci-RNA-seq3
A more detailed version of the full sci-RNA-seq3 workflow is available on protocols.io (http://dx.doi.org/10.17504/protocols.io.9yih7ue) and in the supplementary materials.
Preparation of nuclei
Human fetal tissues (89 to 125 days estimated post-conceptual age) were obtained by the UW Birth Defects Research Laboratory (BDRL) under a protocol approved by the University of Washington Institutional Review Board. Tissues of interest were isolated and rinsed in 1X HBSS. Dried tissue was snap frozen in liquid nitrogen, manually pulverized on dry ice with a chilled hammer, aliquoted, and stored at −80°C until further processing. A subset of these aliquots were used for sci-RNA-seq3, and others for sci-ATAC-seq3, as described in the companion paper. For RNA-seq, nuclei from tissues and control cell lines were lysed in the cell lysis buffer and fixed with ice-cold 4% paraformaldehyde (EMS, 15–4-100) based on the published sci-RNA-seq3 protocol (11). For human cell extraction in renal and digestive organs (kidney, pancreas, intestine, and stomach) and paraformaldehyde fixation, we followed the procedure described in (13).
Immunohistochemistry
Fetal tissues were fixed in formalin and embedded in paraffin. Sections of 4–5 μm thickness were cut and placed on Superfrost Plus slides (12–550-17, FisherBrand). For Immunohistochemistry, sections were subjected to heat mediated antigen retrieval (pH6.0) followed by blocking with normal serum. Primary antibodies were incubated overnight at 4°C. The primary antibody we used: GYPA (R&D, MAB1228, 1:250), CD34 (R&D, AF7227, 1:250), CD34 (Novus, NBP2–32933, 1:250), ANXA1 (R&D, AF3770, 1:500), TNFRS10C (R&D, MAB6301, 1:500), AFP (Novus, NBP1–76275, 1:400), ALB (R&D, MAB1455, 1:10K), AHSG (R&D, AF1184, 1:400), and APOA1 (R&D, MAB36641, 1:250). Species and subtype-appropriate fluorescent dye-labelled secondary antibodies were used (Alexa Fluor 488 and 594, 1:400, Jackson ImmunoResearch Lab) or biotinylated secondary antibody were used followed by ABC Elite Systems (PK-6100, Vector Lab) for DAB chromogen staining.
sci-RNA-seq3 library construction and sequencing
The paraformaldehyde fixed nuclei were processed similarly to the published sci-RNA-seq3 protocol (11). For paraformaldehyde fixed cells, frozen fixed cells were thawed on 37°C water bath, spun down at 500xg for 5 min, and incubated with 500ul PBSI (1 × PBS, pH 7.4, 1% BSA, 1% SuperRnaseIn) including 0.2% Triton X-100 for 3min on ice. Cells were pelleted and resuspended in 500ul nuclease free water including 1% SuperRnaseIn. 3ml 0.1N HCl were added into the cells for 5min incubation on ice (17). 3.5ml Tris-HCl (pH = 8.0) and 35ul 10% Triton X-100 were added into cells to neutralize HCl. Cells were pelleted and washed with 1ml PBSR. Cells were pelleted and resuspended in 100ul PBSI. The following steps were similar with the sci-RNA-seq3 protocol (with paraformaldehyde fixed nuclei) with slight modifications: (1) We distributed 20,000 fixed cells (instead of 80,000 nuclei) per well for reverse transcription. (2) We replaced all nuclei wash buffer in following steps with PBSI. (3) All nuclei dilution buffer were replaced with PBS + 1% BSA.
Processing of sequencing reads
Read alignment and gene count matrix generation for the single cell RNA-seq was performed using the pipeline that we developed for sci-RNA-seq3 (11) with minor modifications: Duplicates were removed using the unique molecular identifier (UMI) sequence (ED < 2, including insertions and deletions), reverse transcription (RT) index, hairpin ligation adaptor index and read 2 end-coordinate.
After the single cell gene count matrix was generated, cells with fewer than 250 UMIs were filtered out. Each cell was assigned to its original human fetal sample based on the RT barcode. Reads mapping to each fetus individual were aggregated to generate “pseudobulk RNA-seq” datasets. For sex assignments, we counted reads mapping to female-specific non-coding RNA (TSIX and XIST) or chrY genes (except genes TBL1Y, RP11–424G14.1, NLGN4Y, AC010084.1, CD24P4, PCDH11Y, and TTTY14, which are detected in both males and females). Fetuses were readily separated into females (more reads mapping to TSIX and XIST than chrY genes) and males (more reads mapping to chrY genes than TSIX and XIST).
Clustering analysis of pseudobulk transcriptomes was done with Monocle 3/alpha (11). Briefly, an aggregated gene expression matrix was constructed as described above for human fetal organs from each individual. Samples with over 5,000 total UMIs were selected. The dimensionality of the data was reduced by PCA (10 components), first on the top 500 most highly dispersed genes and then with UMAP (max_components = 2, n_neighbors = 10, min_dist = 0.5, metric = ‘cosine’).
Cell filtering, clustering and marker gene identification
For the detection of potential doublet cells and doublet-derived subclusters from each organ, we used an iterative clustering strategy as shown before (11). For data visualization, cells labeled as doublets (by scrublet/v0.1 pipeline (189)) or from doublet-derived subclusters were filtered out. For each cell, we only retain protein-coding genes, lincRNA genes and pseudogenes. Genes expressed in less than 10 cells and cells expressing less than 100 genes were further filtered out. The downstream dimension reduction and clustering analysis were done by Monocle 3/alpha with similar settings (11). Clusters were assigned to known cell types based on cell type-specific markers (Table S3). We found the above Scrublet and iterative clustering based approach is limited in marking cell doublets between abundant cell clusters and rare cell clusters (e.g. less than 1% of total cell population). To further remove such doublet cells, we took the cell clusters identified by Monocle 3 and first computed differentially expressed genes across cell clusters (within-organ) with the differentialGeneTest() function of Monocle 3. We then selected a gene set combining the top ten gene markers for each cell cluster (ordered by q-value and fold expression difference between first and second ranked cell cluster). Cells from each main cell cluster were selected for dimension reduction by PCA (10 components) first on the selected gene set of top cluster specific gene markers, and then by UMAP (max_components = 2, n_neighbors = 50, min_dist = 0.1, metric = ‘cosine’), followed by clustering identification using the density peak clustering algorithm implemented in Monocle 3 (rho_thresh = 5, delta_thresh = 0.2 for most clustering analysis). Subclusters showing low expression of target cell cluster specific markers and enriched expression of non-target cell cluster specific markers were annotated as doublets derived subclusters and filtered out in visualization and downstream analysis. Differentially expressed genes across cell types (within-organ) were re-computed with the differentialGeneTest() function of Monocle 3 after removing all doublets or cells from doublet-derived subclusters.
Adjudication of the 15 initially unannotated cell types
As noted in the main text, our first round of annotation was performed on a tissue-by-tissue basis by comparing observed cell types to those expected from prior knowledge of the same tissue. In general, we recovered all or nearly all main cell types identified by previous atlasing efforts directed at the same organs, despite differences with respect to species, stage of development and/or technology. In addition, we identified 15 cell types that we did not at least initially expect to observe in a given tissue. We labeled these based on the top enriched differentially expressed gene markers within that tissue, e.g. CSH1_CSH2 positive cells. Subsequent to the initial round of annotation, we reexamined these 15 cell types based on their distribution in the global UMAP, whether they matched annotated cell types in mouse atlases, their distribution across tissues derived from different individuals, and their potential for maternal origin. Our updated interpretations are summarized in the supplementary material.
Clustering analysis of cells across organs
For clustering analysis of 77 main cell types across 15 organs, we sampled 5,000 cells from each cell type (or all cells for cell types with fewer than 5,000 cells in a given organ). The dimensionality of the data was reduced first by PCA (50 components) on the gene set combining top cell type-specific gene markers identified above (Table S5, qval = 0) and then with UMAP (max_components = 2, n_neighbors = 50, min_dist = 0.1, metric = ‘cosine’). Differentially expressed genes across cell types were identified with the differentialGeneTest() function of Monocle 3. For annotating cell type-specific gene features, we intersected the cell type-specific genes identified above with the predicted secreted and membrane protein coding gene sets from the Human Protein Atlas (190), as well as the TF set annotated in the “motifAnnotations_hgnc” data from package RcisTarget/v1.2.1 (191).
For clustering analysis of blood cell across 15 organs, we extracted all blood cells corresponding to annotated clusters of myeloid cells, lymphoid cells, thymocytes, megakaryocytes, microglia, antigen presenting cells, erythroblasts, and hematopoietic stem/progenitor cells. The dimensionality of the data was reduced first by PCA (40 components) on the expression of a gene set combining the top 3,000 blood cell type-specific gene markers (Table S5, only genes specifically expressed in at least one blood cell type were selected (q-value < 0.05, fold expression difference between first and second ranked cell cluster > 2) and ordered by median qval across organs) and then with UMAP (max_components = 2, n_neighbors = 50, min_dist = 0.1, metric = ‘cosine’). Cell clusters were identified using the Louvain algorithm implemented in Monocle 3 (louvain_res = 1e-04). Clusters were assigned to known cell types based on cell type-specific markers. We then co-embedded the human fetal blood cells and a scRNA-seq atlas of blood cells from the fetal liver (108), using the Seurat v3 integration method (FindAnchors and IntegrateData) (15) with a chosen dimensionality of 30 on the top 3,000 highly variable genes with shared gene names in both datasets.
We then applied a similar analysis strategy as above for clustering analysis of endothelial or epithelial cells across organs. For endothelial cells, we first extracted cells corresponding to annotated clusters of vascular endothelial cells, lymphatic endothelial cells and endocardial cells across organs. The dimensionality of the data was reduced first by PCA (30 components) on the gene set combining top 1,000 endothelial cell type-specific gene markers identified above (Table S5, only genes specifically expressed in at least one endothelial cell type were selected (q-value < 0.05, fold expression difference between first and second ranked cell cluster > 2) and ordered by median qval across organs) and then with UMAP with the same parameters used for blood cells. Cell clusters were identified using the Louvain algorithm implemented in Monocle 3 (louvain_res = 1e-04), and then annotated based on the tissue origin of endothelial cells. For epithelial cells, we first extracted cells from the epithelial cell cluster in Fig. S4B, followed by dimension reduction first by PCA (50 components) first on the top 5,000 most highly dispersed genes and then with UMAP (max_components = 2, n_neighbors = 50, min_dist = 0.1, metric = ‘cosine’). For validating the tissue specific endothelial cells, we then co-embedded the human fetal endothelial cells and a scRNA-seq atlas of endothelial cells from mouse adult tissues (140), using the Seurat v3 integration method (FindAnchors and IntegrateData)(15) with a chosen dimensionality of 30 on the top 3,000 highly variable genes with shared gene names in both datasets.
Intra-dataset cross-validation analysis
For cells from each organ, we randomly sampled up to 2,000 cells from each main cell type. We then followed the same process (101). Briefly, we combined all sampled cells from each organ and evaluated cell type specificity by applying a 5-fold cross-validation to the dataset, with a support vector machine (SVM) classifier (with linear kernel). Whole transcriptome was used in cell type prediction. We then computed the cross-validation F-1 value as cell type specificity score. As control, we randomly permuted the cell type labels, followed by the same analysis pipeline. For cell type specificity analysis across all organs, we applied the same analysis strategy to the full dataset after sampling up to 2,000 cells of each main cell type.
Sub-clustering analysis
For each main cell type (with over 1,000 cells) in each organ, we applied Harmony/v1.0 for batch correction and dimension reduction (102). Briefly, the dimensionality of the data was reduced by PCA (30 components, or 10 components for cell types with less than 5,000 cells) first on the top 3,000 (or 1,000 for cell types with less than 5,000 cells) most highly variable genes, followed by batch correction on sample ID. Cell clusters were identified using the Louvain algorithm implemented in Seurat/v3.1.4 (15) (resolution = 0.5). We then applied the intra-dataset cross-validation approach to evaluate the specificity of sub-clusters within each main cell type. For every sub-cluster pair, A and B, we computed the number of A cells mislabeled as B cells in cross-validation analysis with the true dataset (mislabeled cell number: n) or the permuted dataset (mislabeled cell number: m). A large n value suggests the two sub-clusters are not well separated by the full transcriptome. We thus iteratively merged similar sub-cluster pairs (n > m), and identified a total of 657 subtypes across 15 organs. The intra-dataset cross validation approach was applied to evaluating subtype specificity within each main cell type in each organ. To annotate the identity of subtypes, we applied the same cell type correlation analysis strategy described in (11) to compare cell subtypes from this study to cell types of the same organ from the Microwell-seq based Mouse Cell Atlas (MCA) (16). A similar comparison was performed for all subtypes from the brain against cell types annotated in a recent mouse brain atlas (MBCA) (50).
Validating erythropoiesis in the adrenal tissues from newborn mice
Adrenals and kidneys were harvested from CD1 Swiss albino mice (Charles River) on the day of birth (P0), and bone marrow cells were flushed from the femurs of the dams. Solid tissues were dissociated using collagenase and stained for imaging flow cytometry using the markers Ter119 (AF488), CD117 (PE-CF594), CD71 (PE), CD45 (EF450), and DRAQ5. Gating of maturing erythroblast populations was performed using published methods (128) and analyzed with IDEAS (Luminex) software.
Comparison of human and mouse developmental atlases
We first applied a slightly modified version of the strategy described in (11) to identify correlated cell types between this human fetal cell atlas and the mouse organogenesis cell atlas (MOCA) (11). As a different approach, we co-embedded the human fetal cell atlas and the mouse organogenesis cell atlas (MOCA) (11) using the Seurat v3 integration method (FindAnchors and IntegrateData) (15) with a chosen dimensionality of 30 on the top 3,000 highly variable genes with shared gene names in both human and mouse. We first integrated 65,000 human fetal cells (up to 1,000 cells randomly sampled from each of 77 cell types) and 100,000 mouse embryonic cells (randomly sampled from MOCA) with default parameters. We then applied the same integrative analysis strategy to extracted human and mouse cells from the hematopoietic, endothelial and epithelial trajectories.
For the co-embedded human and mouse hematopoietic cells, we annotated each mouse cell based on its k nearest neighbours of human cells. We chose a small k value (k = 3) such that rare cell types were also annotated. Differentially expressed genes across mouse hematopoietic cells were computed with the differentialGeneTest() function of Monocle 3/alpha.
Pseudotemporal ordering of mouse macrophage/microglia cells was done with Monocle 3/alpha with the reduction method of “DDRTree”. Briefly, the top 3 principal components on the top 500 highly variable genes were used to construct the DDRTree pseudotime trajectory with UMI number per cell as a covariate (param.gamma = 120, norm_method = “log”, residualModelFormulaStr = “~ sm.ns(Total_mRNAs, df = 3)”). The cells are separated into three branch trajectories in the DDRTree space. Differentially expressed genes across the three branches were computed with the differentialGeneTest() function of Monocle 3/alpha. We then clustered cells with k means clustering (k = 10) and computed the average development time for each cluster. The progenitor cell group was annotated based on the lowest average development time and appeared at the center of the three branches. Each cell was assigned a pseudotime value based on its distance from the progenitor cells.
Using the Garnett models trained on this human cell atlas for cell type classification
The R package Garnett for Monocle 3 (version 0.2.9) was used to generate cell type classifiers for each of the 15 tissues. Marker genes for each cell type were assembled from literature searches by author HAP, and models were trained using train_cell_classifier using default parameters and the gene database org.Hs.eg.db (version 3.10.0). Models were trained on the entirety of each tissue dataset with the exception of cerebrum, where 100,000 cells were randomly sampled for training for computational efficiency. To compare cell type assignments to those obtained via manual annotation by author JC (i.e. the 77 main cell types), we applied the function classifiy_cells using the trained models with the following non-default parameters: cluster_extend = TRUE, cluster_extend_max_frac_incorrect = 0.25, cluster_extend_max_frac_unknown = 0.95. Garnett cell type assignments that matched the cell type assignment from manual annotation were considered ‘correct’ with the following exceptions: Garnett classification of “Chromaffin cells” was considered correct when manual annotation was “Sympathoblasts”, Garnett classification of “B cells” or “T cells” was considered correct when manual annotation was “Lymphoid cells”, Garnett classification of “Cap mesenchyme cells”, “Collecting duct cells”, “Distal tubule cells”, “Loop of Henle cells”, “Proximal tubule cells”, and “Podocytes” were considered correct when manual annotation was “Metanephric cells”, Garnett classification of “Ureter cells” and “Collecting duct cells” were considered correct when manual annotation was “Ureteric bud cells”, Garnett classification of “Pancreatic Alpha cells”, “Pancreatic Beta cells”, and “Pancreatic Delta cells” was considered correct when manual annotation was “Islet endocrine cells”, Garnett classification of “D cells” was considered correct with manual annotation of “Neuroendocrine cells”.
To test the applicability of Garnett trained models to future data, we applied the pancreas model to human adult pancreas scRNA-seq data from reference (100). The model was applied using the function classify_cells with the same parameters as above. When compared cell type assignments to those provided by the authors, we considered the following cell types to be equivalent: acinar, Acinar cells; ductal, Ductal cells; endothelial, Endothelial cells; mast, Myeloid cells; macrophage, Myeloid cells; schwann, Glia; alpha, Pancreatic Alpha cells; beta, Pancreatic Beta cells; delta, Pancreatic Delta cells; activated_stellate, Pancreatic stellate cells; quiescent_stellate, Pancreatic stellate cells; t_cell, T cells.
Supplementary Material
Acknowledgements:
We thank past and present members of the Shendure and Trapnell labs, A. Adey, the BBI Advanced Technology Lab, and the UW Birth Defects Research Lab. We thank C. Spurrell and D. Ahrendsen for reviewing the sci-RNA-seq3 protocol. All methods for making the transposase complexes are described in (188) and Tn5 transposase is available from Lucigen; however, Illumina will provide transposase complexes in response to reasonable requests from the scientific community subject to a material transfer agreement.
Funding: M.S. was supported by grants from the Deutsche Forschungsgemeinschaft (SP1532/3-1, 4-1 and 5-1). Aspects of this work were supported by funding from the Brotman Baty Institute for Precision Medicine, the Paul G. Allen Frontiers Foundation (Allen Discovery Center grant to JS and CT), and the NIH (DK119285 to JP; HD000836 to IAG). JS is an investigator of the Howard Hughes Medical Institute.
Footnotes
Competing interests: F.Z. and F.J.S. declare competing financial interests in the form of stock ownership and paid employment by Illumina, Inc. J.S. has competing financial interests (paid consulting and/or equity) with Guardant Health, Maze Therapeutics, Camp4 Therapeutics, Nanostring, Phase Genomics, Adaptive Biotechnologies, and Stratos Genomics. One or more embodiments of one or more patents and patent applications filed by Illumina and UW may encompass the methods, reagents, and data disclosed in this manuscript.
Data and materials availability: A detailed version of the sci-RNA-seq3 protocol is available on protocols.io (http://dx.doi.org/10.17504/protocols.io.9yih7ue). A demultiplexing script and tutorial are provided on Zenodo at https://doi.org/10.5281/zenodo.4013713. Raw data are provided at dbGaP (accession number phs002003.v1.p1). Supplementary Files S1–S7 and Table S5 are provided at GEO (GSE156793, token for reviewer: qvepsequtxqhdsb). Garnett models generated from these data are also posted to our website where they can broadly be used for the automated cell type classification of single cell data from diverse organs. An interactive version of the full dataset facilitates the exploration of these data by tissue, cell type or gene (descartes.brotmanbaty.org).
References
- 1.de Bakker BS, de Jong KH, Hagoort J, de Bree K, Besselink CT, de Kanter FEC, Veldhuis T, Bais B, Schildmeijer R, Ruijter JM, Oostra R-J, Christoffels VM, Moorman AFM, An interactive three-dimensional digital atlas and quantitative database of human development. Science. 354 (2016), doi: 10.1126/science.aag0053. [DOI] [PubMed] [Google Scholar]
- 2.Yamada S, Samtani RR, Lee ES, Lockett E, Uwabe C, Shiota K, Anderson SA, Lo CW, Developmental atlas of the early first trimester human embryo. Dev. Dyn 239, 1585–1595 (2010). [DOI] [PMC free article] [PubMed] [Google Scholar]
- 3.Jirasek JE, An Atlas of the Human Embryo and Fetus: A Photographic Review of Human Prenatal Development (CRC Press, 2000). [Google Scholar]
- 4.McKusick VA, Mendelian Inheritance in Man and its online version, OMIM. Am. J. Hum. Genet 80, 588–604 (2007). [DOI] [PMC free article] [PubMed] [Google Scholar]
- 5.Mefford HC, Batshaw ML, Hoffman EP, Genomics, intellectual disability, and autism. N. Engl. J. Med 366, 733–743 (2012). [DOI] [PMC free article] [PubMed] [Google Scholar]
- 6.McCandless SE, Brunger JW, Cassidy SB, The burden of genetic disease on inpatient care in a children’s hospital. Am. J. Hum. Genet 74, 121–127 (2004). [DOI] [PMC free article] [PubMed] [Google Scholar]
- 7.Wojcik MH, Schwartz TS, Yamin I, Edward HL, Genetti CA, Towne MC, Agrawal PB, Genetic disorders and mortality in infancy and early childhood: delayed diagnoses and missed opportunities. Genet. Med 20, 1396–1404 (2018). [DOI] [PMC free article] [PubMed] [Google Scholar]
- 8.Darmanis S, Sloan SA, Zhang Y, Enge M, Caneda C, Shuer LM, Hayden Gephart MG, Barres BA, Quake SR, A survey of human brain transcriptome diversity at the single cell level. Proc. Natl. Acad. Sci. U. S. A 112, 7285–7290 (2015). [DOI] [PMC free article] [PubMed] [Google Scholar]
- 9.Madissoon E, Wilbrey-Clark A, Miragaia RJ, Saeb-Parsy K, Mahbubani KT, Georgakopoulos N, Harding P, Polanski K, Huang N, Nowicki-Osuch K, Fitzgerald RC, Loudon KW, Ferdinand JR, Clatworthy MR, Tsingene A, van Dongen S, Dabrowska M, Patel M, Stubbington MJT, Teichmann SA, Stegle O, Meyer KB, scRNA-seq assessment of the human lung, spleen, and esophagus tissue stability after cold preservation. Genome Biol 21, 1 (2019). [DOI] [PMC free article] [PubMed] [Google Scholar]
- 10.Behjati S, Lindsay S, Teichmann SA, Haniffa M, Mapping human development at single-cell resolution. Development 145 (2018), doi: 10.1242/dev.152561. [DOI] [PubMed] [Google Scholar]
- 11.Cao J, Spielmann M, Qiu X, Huang X, Ibrahim DM, Hill AJ, Zhang F, Mundlos S, Christiansen L, Steemers FJ, Trapnell C, Shendure J, The single-cell transcriptional landscape of mammalian organogenesis. Nature 566, 496–502 (2019). [DOI] [PMC free article] [PubMed] [Google Scholar]
- 12.A Human Atlas Of Chromatin Accessibility During Development. Science (2020). [Google Scholar]
- 13.Thomsen ER, Mich JK, Yao Z, Hodge RD, Doyle AM, Jang S, Shehata SI, Nelson AM, Shapovalova NV, Levi BP, Ramanathan S, Fixed single-cell transcriptomic characterization of human radial glial diversity. Nat. Methods. 13, 87–93 (2016). [DOI] [PMC free article] [PubMed] [Google Scholar]
- 14.McInnes L, Healy J, Saul N, Großberger L, UMAP: Uniform Manifold Approximation and Projection. Journal of Open Source Software. 3 (2018), p. 861. [Google Scholar]
- 15.Stuart T, Butler A, Hoffman P, Hafemeister C, Papalexi E, Mauck WM, Hao Y, Stoeckius M, Smibert P, Satija R, Comprehensive Integration of Single-Cell Data. Cell. 177 (2019), pp. 1888–1902.e21. [DOI] [PMC free article] [PubMed] [Google Scholar]
- 16.Han X, Wang R, Zhou Y, Fei L, Sun H, Lai S, Saadatpour A, Zhou Z, Chen H, Ye F, Huang D, Xu Y, Huang W, Jiang M, Jiang X, Mao J, Chen Y, Lu C, Xie J, Fang Q, Wang Y, Yue R, Li T, Huang H, Orkin SH, Yuan G-C, Chen M, Guo G, Mapping the Mouse Cell Atlas by Microwell-Seq. Cell 173, 1307 (2018). [DOI] [PubMed] [Google Scholar]
- 17.Rosenberg AB, Roco CM, Muscat RA, Kuchina A, Sample P, Yao Z, Graybuck LT, Peeler DJ, Mukherjee S, Chen W, Pun SH, Sellers DL, Tasic B, Seelig G, Single-cell profiling of the developing mouse brain and spinal cord with split-pool barcoding. Science. 360, 176–182 (2018). [DOI] [PMC free article] [PubMed] [Google Scholar]
- 18.Cao J, Packer JS, Ramani V, Cusanovich DA, Huynh C, Daza R, Qiu X, Lee C, Furlan SN, Steemers FJ, Adey A, Waterston RH, Trapnell C, Shendure J, Comprehensive single-cell transcriptional profiling of a multicellular organism. Science 357, 661–667 (2017). [DOI] [PMC free article] [PubMed] [Google Scholar]
- 19.Plass M, Solana J, Wolf FA, Ayoub S, Misios A, Glažar P, Obermayer B, Theis FJ, Kocks C, Rajewsky N, Cell type atlas and lineage tree of a whole complex animal by single-cell transcriptomics. Science. 360 (2018), doi: 10.1126/science.aaq1723. [DOI] [PubMed] [Google Scholar]
- 20.Wolock SL, Lopez R, Klein AM, Scrublet: Computational Identification of Cell Doublets in Single-Cell Transcriptomic Data. Cell Syst 8, 281–291.e9 (2019). [DOI] [PMC free article] [PubMed] [Google Scholar]
- 21.Stelzer G, Rosen N, Plaschkes I, Zimmerman S, Twik M, Fishilevich S, Stein TI, Nudel R, Lieder I, Mazor Y, Kaplan S, Dahary D, Warshawsky D, Guan-Golan Y, Kohn A, Rappaport N, Safran M, Lancet D, The GeneCards Suite: From Gene Data Mining to Disease Genome Sequence Analyses. Curr. Protoc. Bioinformatics. 54, 1.30.1–1.30.33 (2016). [DOI] [PubMed] [Google Scholar]
- 22.in Catecholamines: Basic and Clinical Frontiers (Pergamon, 1979), pp. 794–796. [Google Scholar]
- 23.Lu Y, Yi W, Wu Q, Zhong S, Zuo Z, Zhao F, Zhang M, Tsai N, Zhuo Y, He S, Zhang J, Duan X, Wang X, Xue T, Single-cell RNA-seq analysis maps the development of human fetal retina. bioRxiv (2018), p. 423830. [Google Scholar]
- 24.The UniProt Consortium, UniProt: the universal protein knowledgebase. Nucleic Acids Res 45, D158–D169 (2017). [DOI] [PMC free article] [PubMed] [Google Scholar]
- 25.Gene_Cryab (2020), (available at https://www.ncbi.nlm.nih.gov/gene/12955).
- 26.Wiki_CRYBB3 (2020), (available at https://en.wikipedia.org/wiki/CRYBB3).
- 27.Wiki of Keratin 12, (available at https://en.wikipedia.org/wiki/Keratin_12).
- 28.Tabula Muris Consortium, Overall coordination, Logistical coordination, Organ collection and processing, Library preparation and sequencing, Computational data analysis, Cell type annotation, Writing group, Supplemental text writing group, Principal investigators, Single-cell transcriptomics of 20 mouse organs creates a Tabula Muris. Nature 562, 367–372 (2018). [DOI] [PMC free article] [PubMed] [Google Scholar]
- 29.Kim BR, Van de Laar E, Cabanero M, Tarumi S, Hasenoeder S, Wang D, Virtanen C, Suzuki T, Bandarchi B, Sakashita S, Pham NA, Lee S, Keshavjee S, Waddell TK, Tsao M-S, Moghal N, SOX2 and PI3K Cooperate to Induce and Stabilize a Squamous-Committed Stem Cell Injury State during Lung Squamous Cell Carcinoma Pathogenesis. PLoS Biol 14, e1002581 (2016). [DOI] [PMC free article] [PubMed] [Google Scholar]
- 30.Dauger S, Pattyn A, Lofaso F, Gaultier C, Goridis C, Gallego J, Brunet J-F, Phox2b controls the development of peripheral chemoreceptors and afferent visceral pathways. Development 130, 6635–6642 (2003). [DOI] [PubMed] [Google Scholar]
- 31.Jackson DG, Prevo R, Clasper S, Banerji S, LYVE-1, the lymphatic system and tumor lymphangiogenesis. Trends Immunol 22, 317–321 (2001). [DOI] [PubMed] [Google Scholar]
- 32.Rinkevich Y, Mori T, Sahoo D, Xu P-X, Bermingham JR Jr, Weissman IL, Identification and prospective isolation of a mesothelial precursor lineage giving rise to smooth muscle cells and fibroblasts for mammalian internal organs, and their vasculature. Nat. Cell Biol 14, 1251–1260 (2012). [DOI] [PMC free article] [PubMed] [Google Scholar]
- 33.Cui Y, Zheng Y, Liu X, Yan L, Fan X, Yong J, Hu Y, Dong J, Li Q, Wu X, Gao S, Li J, Wen L, Qiao J, Tang F, Single-Cell Transcriptome Analysis Maps the Developmental Track of the Human Heart. Cell Rep 26, 1934–1950.e5 (2019). [DOI] [PubMed] [Google Scholar]
- 34.Shy ME, Hobson G, Jain M, Boespflug-Tanguy O, Garbern J, Sperle K, Li W, Gow A, Rodriguez D, Bertini E, Mancias P, Krajewski K, Lewis R, Kamholz J, Schwann cell expression of PLP1 but not DM20 is necessary to prevent neuropathy. Ann. Neurol 53, 354–365 (2003). [DOI] [PMC free article] [PubMed] [Google Scholar]
- 35.Suryawanshi H, Morozov P, Straus A, Sahasrabudhe N, Max KEA, Garzia A, Kustagi M, Tuschl T, Williams Z, A single-cell survey of the human first-trimester placenta and decidua. Sci Adv 4, eaau4788 (2018). [DOI] [PMC free article] [PubMed] [Google Scholar]
- 36.Thorngate FE, Strockbine PA, Erickson SK, Williams DL, Altered adrenal gland cholesterol metabolism in the apoE-deficient mouse. J. Lipid Res 43, 1920–1926 (2002). [DOI] [PubMed] [Google Scholar]
- 37.Furlan A, Dyachuk V, Kastriti ME, Calvo-Enrique L, Abdo H, Hadjab S, Chontorotzea T, Akkuratova N, Usoskin D, Kamenev D, Petersen J, Sunadome K, Memic F, Marklund U, Fried K, Topilko P, Lallemend F, Kharchenko PV, Ernfors P, Adameyko I, Multipotent peripheral glial cells generate neuroendocrine cells of the adrenal medulla. Science 357 (2017), doi: 10.1126/science.aal3753. [DOI] [PMC free article] [PubMed] [Google Scholar]
- 38.Fomin ME, Beyer AI, Muench MO, Human fetal liver cultures support multiple cell lineages that can engraft immunodeficient mice. Open Biol 7 (2017), doi: 10.1098/rsob.170108. [DOI] [PMC free article] [PubMed] [Google Scholar]
- 39.Matsuoka S, Ebihara Y, Xu M, Ishii T, Sugiyama D, Yoshino H, Ueda T, Manabe A, Tanaka R, Ikeda Y, Nakahata T, Tsuji K, CD34 expression on long-term repopulating hematopoietic stem cells changes during developmental stages. Blood 97, 419–425 (2001). [DOI] [PubMed] [Google Scholar]
- 40.Miller JD, Lankford SM, Adler KB, Brody AR, Mesenchymal stem cells require MARCKS protein for directed chemotaxis in vitro. Am. J. Respir. Cell Mol. Biol 43, 253–258 (2010). [DOI] [PMC free article] [PubMed] [Google Scholar]
- 41.Dijk F, Bergen AAB, Kamphuis W, GAP-43 expression is upregulated in retinal ganglion cells after ischemia/reperfusion-induced damage. Exp. Eye Res 84, 858–867 (2007). [DOI] [PubMed] [Google Scholar]
- 42.de M. Guimarães RP, Landeira BS, Coelho DM, Golbert DCF, Silveira MS, Linden R, de Melo Reis RA, Costa MR, Evidence of Müller Glia Conversion Into Retina Ganglion Cells Using Neurogenin2. Front. Cell. Neurosci 12, 410 (2018). [DOI] [PMC free article] [PubMed] [Google Scholar]
- 43.Poché RA, Kwan KM, Raven MA, Furuta Y, Reese BE, Behringer RR, Lim1 is essential for the correct laminar positioning of retinal horizontal cells. J. Neurosci 27, 14099–14107 (2007). [DOI] [PMC free article] [PubMed] [Google Scholar]
- 44.Ruzycki PA, Zhang X, Chen S, CRX directs photoreceptor differentiation by accelerating chromatin remodeling at specific target sites. Epigenetics Chromatin 11, 42 (2018). [DOI] [PMC free article] [PubMed] [Google Scholar]
- 45.Shi Z, Trenholm S, Zhu M, Buddingh S, Star EN, Awatramani GB, Chow RL, Vsx1 regulates terminal differentiation of type 7 ON bipolar cells. J. Neurosci 31, 13118–13127 (2011). [DOI] [PMC free article] [PubMed] [Google Scholar]
- 46.Sofroniew MV, Vinters HV, Astrocytes: biology and pathology. Acta Neuropathol 119, 7–35 (2010). [DOI] [PMC free article] [PubMed] [Google Scholar]
- 47.Beleggia F, Li Y, Fan J, Elcioğlu NH, Toker E, Wieland T, Maumenee IH, Akarsu NA, Meitinger T, Strom TM, Lang R, Wollnik B, CRIM1 haploinsufficiency causes defects in eye development in human and mouse. Hum. Mol. Genet 24, 2267–2273 (2015). [DOI] [PMC free article] [PubMed] [Google Scholar]
- 48.Jaworski CJ, Aryankalayil-John M, Campos MM, Fariss RN, Rowsey J, Agarwalla N, Reid TW, Dushku N, Cox CA, Carper D, Wistow G, Expression analysis of human pterygium shows a predominance of conjunctival and limbal markers and genes associated with cell migration. Mol. Vis 15, 2421–2434 (2009). [PMC free article] [PubMed] [Google Scholar]
- 49.Rétaux S, Rogard M, Bach I, Failli V, Besson MJ, Lhx9: a novel LIM-homeodomain gene expressed in the developing forebrain. J. Neurosci 19, 783–793 (1999). [DOI] [PMC free article] [PubMed] [Google Scholar]
- 50.Zeisel A, Hochgerner H, Lönnerberg P, Johnsson A, Memic F, van der Zwan J, Häring M, Braun E, Borm LE, La Manno G, Codeluppi S, Furlan A, Lee K, Skene N, Harris KD, Hjerling-Leffler J, Arenas E, Ernfors P, Marklund U, Linnarsson S, Molecular Architecture of the Mouse Nervous System. Cell 174, 999–1014.e22 (2018). [DOI] [PMC free article] [PubMed] [Google Scholar]
- 51.Menon R, Otto EA, Kokoruda A, Zhou J, Zhang Z, Yoon E, Chen Y-C, Troyanskaya O, Spence JR, Kretzler M, Cebrián C, Single-cell analysis of progenitor cell dynamics and lineage specification in the human fetal kidney. Development 145 (2018), doi: 10.1242/dev.164038. [DOI] [PMC free article] [PubMed] [Google Scholar]
- 52.Ben Khelifa M, Coutton C, Zouari R, Karaouzène T, Rendu J, Bidart M, Yassine S, Pierre V, Delaroche J, Hennebicq S, Grunwald D, Escalier D, Pernet-Gallay K, Jouk P-S, Thierry-Mieg N, Touré A, Arnoult C, Ray PF, Mutations in DNAH1, which encodes an inner arm heavy chain dynein, lead to male infertility from multiple morphological abnormalities of the sperm flagella. Am. J. Hum. Genet 94, 95–104 (2014). [DOI] [PMC free article] [PubMed] [Google Scholar]
- 53.He H, Li S, Hong Y, Zou H, Chen H, Ding F, Wan Y, Liu Z, Krüppel-like Factor 4 Promotes Esophageal Squamous Cell Carcinoma Differentiation by Up-regulating Keratin 13 Expression. J. Biol. Chem 290, 13567–13577 (2015). [DOI] [PMC free article] [PubMed] [Google Scholar]
- 54.Pan Y, Wang W-D, Yago T, Transcriptional regulation of podoplanin expression by Prox1 in lymphatic endothelial cells. Microvasc. Res 94, 96–102 (2014). [DOI] [PubMed] [Google Scholar]
- 55.Hopfer U, Fukai N, Hopfer H, Wolf G, Joyce N, Li E, Olsen BR, Targeted disruption of Col8a1 and Col8a2 genes in mice leads to anterior segment abnormalities in the eye. FASEB J 19, 1232–1244 (2005). [DOI] [PubMed] [Google Scholar]
- 56.Vento-Tormo R, Efremova M, Botting RA, Turco MY, Vento-Tormo M, Meyer KB, Park J-E, Stephenson E, Polański K, Goncalves A, Gardner L, Holmqvist S, Henriksson J, Zou A, Sharkey AM, Millar B, Innes B, Wood L, Wilbrey-Clark A, Payne RP, Ivarsson MA, Lisgo S, Filby A, Rowitch DH, Bulmer JN, Wright GJ, Stubbington MJT, Haniffa M, Moffett A, Teichmann SA, Single-cell reconstruction of the early maternal-fetal interface in humans. Nature 563, 347–353 (2018). [DOI] [PMC free article] [PubMed] [Google Scholar]
- 57.Gomez-Sanchez JA, Carty L, Iruarrizaga-Lejarreta M, Palomo-Irigoyen M, Varela-Rey M, Griffith M, Hantke J, Macias-Camara N, Azkargorta M, Aurrekoetxea I, De Juan VG, Jefferies HBJ, Aspichueta P, Elortza F, Aransay AM, Martínez-Chantar ML, Baas F, Mato JM, Mirsky R, Woodhoo A, Jessen KR, Schwann cell autophagy, myelinophagy, initiates myelin clearance from injured nerves. J. Cell Biol 210, 153–168 (2015). [DOI] [PMC free article] [PubMed] [Google Scholar]
- 58.Hoekstra M, Van Eck M, HDL is redundant for adrenal steroidogenesis in LDLR knockout mice with a human-like lipoprotein profile. J. Lipid Res 57, 631–637 (2016). [DOI] [PMC free article] [PubMed] [Google Scholar]
- 59.Huber K, Karch N, Ernsberger U, Goridis C, Unsicker K, The role of Phox2B in chromaffin cell development. Dev. Biol 279, 501–508 (2005). [DOI] [PubMed] [Google Scholar]
- 60.Pei X, Who is hematopoietic stem cell: CD34+ or CD34-? Int. J. Hematol 70, 213–215 (1999). [PubMed] [Google Scholar]
- 61.Lavoie JR, Creskey MM, Muradia G, Bell GI, Sherman SE, Gao J, Stewart DJ, Cyr TD, Hess DA, Rosu-Myles M, Brief Report: Elastin Microfibril Interface 1 and Integrin-Linked Protein Kinase Are Novel Markers of Islet Regenerative Function in Human Multipotent Mesenchymal Stromal Cells. Stem Cells 34, 2249–2255 (2016). [DOI] [PubMed] [Google Scholar]
- 62.Wall DS, Mears AJ, McNeill B, Mazerolle C, Thurig S, Wang Y, Kageyama R, Wallace VA, Progenitor cell proliferation in the retina is dependent on Notch-independent Sonic hedgehog/Hes1 activity. J. Cell Biol 184, 101–112 (2009). [DOI] [PMC free article] [PubMed] [Google Scholar]
- 63.Wu F, Kaczynski TJ, Sethuramanujam S, Li R, Jain V, Slaughter M, Mu X, Two transcription factors, Pou4f2 and Isl1, are sufficient to specify the retinal ganglion cell fate. Proc. Natl. Acad. Sci. U. S. A 112, E1559–68 (2015). [DOI] [PMC free article] [PubMed] [Google Scholar]
- 64.Balasubramanian R, Bui A, Dong X, Gan L, Lhx9 Is Required for the Development of Retinal Nitric Oxide-Synthesizing Amacrine Cell Subtype. Mol. Neurobiol 55, 2922–2933 (2018). [DOI] [PMC free article] [PubMed] [Google Scholar]
- 65.Wu F, Li R, Umino Y, Kaczynski TJ, Sapkota D, Li S, Xiang M, Fliesler SJ, Sherry DM, Gannon M, Solessio E, Mu X, Onecut1 is essential for horizontal cell genesis and retinal integrity. J. Neurosci 33, 13053–65, 13065a (2013). [DOI] [PMC free article] [PubMed] [Google Scholar]
- 66.Vitorino M, Jusuf PR, Maurus D, Kimura Y, Higashijima S-I, Harris WA, Vsx2 in the zebrafish retina: restricted lineages through derepression. Neural Dev 4, 14 (2009). [DOI] [PMC free article] [PubMed] [Google Scholar]
- 67.Kolandaivelu S, Ramamurthy V, AIPL1 protein and its indispensable role in cone photoreceptor function and survival. Adv. Exp. Med. Biol 801, 43–48 (2014). [DOI] [PubMed] [Google Scholar]
- 68.Holtman IR, Raj DD, Miller JA, Schaafsma W, Yin Z, Brouwer N, Wes PD, Möller T, Orre M, Kamphuis W, Hol EM, Boddeke EWGM, Eggen BJL, Induction of a common microglia gene expression signature by aging and neurodegenerative conditions: a co-expression meta-analysis. Acta Neuropathol Commun 3, 31 (2015). [DOI] [PMC free article] [PubMed] [Google Scholar]
- 69.Zhong S, Zhang S, Fan X, Wu Q, Yan L, Dong J, Zhang H, Li L, Sun L, Pan N, Xu X, Tang F, Zhang J, Qiao J, Wang X, A single-cell RNA-seq survey of the developmental landscape of the human prefrontal cortex. Nature 555, 524–528 (2018). [DOI] [PubMed] [Google Scholar]
- 70.Lee M, Yoon J, Song H, Lee B, Lam DT, Yoon J, Baek K, Clevers H, Jeong Y, Tcf7l2 plays crucial roles in forebrain development through regulation of thalamic and habenular neuron identity and connectivity. Dev. Biol 424, 62–76 (2017). [DOI] [PubMed] [Google Scholar]
- 71.Holzschuh J, Barrallo-Gimeno A, Ettl A-K, Durr K, Knapik EW, Driever W, Noradrenergic neurons in the zebrafish hindbrain are induced by retinoic acid and require tfap2a for expression of the neurotransmitter phenotype. Development 130, 5741–5754 (2003). [DOI] [PubMed] [Google Scholar]
- 72.Carter RA, Bihannic L, Rosencrance C, Hadley JL, Tong Y, Phoenix TN, Natarajan S, Easton J, Northcott PA, Gawad C, A Single-Cell Transcriptional Atlas of the Developing Murine Cerebellum. Curr. Biol 28, 2910–2920.e2 (2018). [DOI] [PubMed] [Google Scholar]
- 73.Park J, Shrestha R, Qiu C, Kondo A, Huang S, Werth M, Li M, Barasch J, Suszták K, Single-cell transcriptomics of the mouse kidney reveals potential cellular targets of kidney disease. Science 360, 758–763 (2018). [DOI] [PMC free article] [PubMed] [Google Scholar]
- 74.Madsen J, Nielsen O, Tornøe I, Thim L, Holmskov U, Tissue localization of human trefoil factors 1, 2, and 3. J. Histochem. Cytochem 55, 505–513 (2007). [DOI] [PubMed] [Google Scholar]
- 75.Zhang P, Yang M, Zhang Y, Xiao S, Lai X, Tan A, Du S, Li S, Dissecting the Single-Cell Transcriptome Network Underlying Gastric Premalignant Lesions and Early Gastric Cancer. Cell Rep 27, 1934–1947.e5 (2019). [DOI] [PubMed] [Google Scholar]
- 76.Griggs TF, Bochkov YA, Basnet S, Pasic TR, Brockman-Schneider RA, Palmenberg AC, Gern JE, Rhinovirus C targets ciliated airway epithelial cells. Respir. Res 18, 84 (2017). [DOI] [PMC free article] [PubMed] [Google Scholar]
- 77.Reyfman PA, Walter JM, Joshi N, Anekalla KR, McQuattie-Pimentel AC, Chiu S, Fernandez R, Akbarpour M, Chen C-I, Ren Z, Verma R, Abdala-Valencia H, Nam K, Chi M, Han S, Gonzalez-Gonzalez FJ, Soberanes S, Watanabe S, Williams KJN, Flozak AS, Nicholson TT, Morgan VK, Winter DR, Hinchcliff M, Hrusch CL, Guzy RD, Bonham CA, Sperling AI, Bag R, Hamanaka RB, Mutlu GM, Yeldandi AV, Marshall SA, Shilatifard A, Amaral LAN, Perlman H, Sznajder JI, Argento AC, Gillespie CT, Dematte J, Jain M, Singer BD, Ridge KM, Lam AP, Bharat A, Bhorade SM, Gottardi CJ, Budinger GRS, Misharin AV, Single-Cell Transcriptomic Analysis of Human Lung Provides Insights into the Pathobiology of Pulmonary Fibrosis. Am. J. Respir. Crit. Care Med 199, 1517–1536 (2019). [DOI] [PMC free article] [PubMed] [Google Scholar]
- 78.Brierley SM, Hibberd TJ, Spencer NJ, Spinal Afferent Innervation of the Colon and Rectum. Front. Cell. Neurosci 12, 467 (2018). [DOI] [PMC free article] [PubMed] [Google Scholar]
- 79.Liu Y, Fan X, Wang R, Lu X, Dang Y-L, Wang H, Lin H-Y, Zhu C, Ge H, Cross JC, Wang H, Single-cell RNA-seq reveals the diversity of trophoblast subtypes and patterns of differentiation in the human placenta. Cell Res 28, 819–832 (2018). [DOI] [PMC free article] [PubMed] [Google Scholar]
- 80.Zammit PS, Relaix F, Nagata Y, Ruiz AP, Collins CA, Partridge TA, Beauchamp JR, Pax7 and myogenic progression in skeletal muscle satellite cells. J. Cell Sci 119, 1824–1832 (2006). [DOI] [PubMed] [Google Scholar]
- 81.Schöneberg T, Meister J, Knierim AB, Schulz A, The G protein-coupled receptor GPR34 - The past 20 years of a grownup. Pharmacol. Ther 189, 71–88 (2018). [DOI] [PubMed] [Google Scholar]
- 82.Mallika C, Guo Q, Li JYH, Gbx2 is essential for maintaining thalamic neuron identity and repressing habenular characters in the developing thalamus. Dev. Biol 407, 26–39 (2015). [DOI] [PMC free article] [PubMed] [Google Scholar]
- 83.Cao J, Cusanovich DA, Ramani V, Aghamirzaie D, Pliner HA, Hill AJ, Daza RM, McFaline-Figueroa JL, Packer JS, Christiansen L, Steemers FJ, Adey AC, Trapnell C, Shendure J, Joint profiling of chromatin accessibility and gene expression in thousands of single cells. Science 361, 1380–1385 (2018). [DOI] [PMC free article] [PubMed] [Google Scholar]
- 84.Pepe-Mooney BJ, Dill MT, Alemany A, Ordovas-Montanes J, Matsushita Y, Rao A, Sen A, Miyazaki M, Anakk S, Dawson PA, Ono N, Shalek AK, van Oudenaarden A, Camargo FD, Single-Cell Analysis of the Liver Epithelium Reveals Dynamic Heterogeneity and an Essential Role for YAP in Homeostasis and Regeneration. Cell Stem Cell 25, 23–38.e8 (2019). [DOI] [PMC free article] [PubMed] [Google Scholar]
- 85.SUPPLEMENTARY MATERIALS.
- 86.Reyfman PA, Walter JM, Joshi N, Anekalla KR, McQuattie-Pimentel AC, Chiu S, Fernandez R, Akbarpour M, Chen C-I, Ren Z, Verma R, Abdala-Valencia H, Nam K, Chi M, Han S, Gonzalez-Gonzalez FJ, Soberanes S, Watanabe S, Williams KJN, Flozak AS, Nicholson TT, Morgan VK, Hrusch CL, Guzy RD, Bonham CA, Sperling AI, Bag R, Hamanaka RB, Mutlu GM, Yeldandi AV, Marshall SA, Shilatifard A, Amaral LAN, Perlman H, Sznajder JI, Winter DR, Hinchcliff M, Christine Argento A, Gillespie CT, Dematte JD, Jain M, Singer BD, Ridge KM, Gottardi CJ, Lam AP, Bharat A, Bhorade SM, Scott Budinger GR, Misharin AV, Single-Cell Transcriptomic Analysis of Human Lung Reveals Complex Multicellular Changes During Pulmonary Fibrosis, , doi: 10.1101/296608. [DOI] [PMC free article] [PubMed] [Google Scholar]
- 87.Haber AL, Biton M, Rogel N, Herbst RH, Shekhar K, Smillie C, Burgin G, Delorey TM, Howitt MR, Katz Y, Tirosh I, Beyaz S, Dionne D, Zhang M, Raychowdhury R, Garrett WS, Rozenblatt-Rosen O, Shi HN, Yilmaz O, Xavier RJ, Regev A, A single-cell survey of the small intestinal epithelium. Nature 551, 333–339 (2017). [DOI] [PMC free article] [PubMed] [Google Scholar]
- 88.MacParland SA, Liu JC, Ma X-Z, Innes BT, Bartczak AM, Gage BK, Manuel J, Khuu N, Echeverri J, Linares I, Gupta R, Cheng ML, Liu LY, Camat D, Chung SW, Seliga RK, Shao Z, Lee E, Ogawa S, Ogawa M, Wilson MD, Fish JE, Selzner M, Ghanekar A, Grant D, Greig P, Sapisochin G, Selzner N, Winegarden N, Adeyi O, Keller G, Bader GD, McGilvray ID, Single cell RNA sequencing of human liver reveals distinct intrahepatic macrophage populations. Nat. Commun 9, 4383 (2018). [DOI] [PMC free article] [PubMed] [Google Scholar]
- 89.Krasemann S, Madore C, Cialic R, Baufeld C, Calcagno N, El Fatimy R, Beckers L, O’Loughlin E, Xu Y, Fanek Z, Greco DJ, Smith ST, Tweet G, Humulock Z, Zrzavy T, Conde-Sanroman P, Gacias M, Weng Z, Chen H, Tjon E, Mazaheri F, Hartmann K, Madi A, Ulrich JD, Glatzel M, Worthmann A, Heeren J, Budnik B, Lemere C, Ikezu T, Heppner FL, Litvak V, Holtzman DM, Lassmann H, Weiner HL, Ochando J, Haass C, Butovsky O, The TREM2-APOE Pathway Drives the Transcriptional Phenotype of Dysfunctional Microglia in Neurodegenerative Diseases. Immunity 47, 566–581.e9 (2017). [DOI] [PMC free article] [PubMed] [Google Scholar]
- 90.Kielian T, Toll-like receptors in central nervous system glial inflammation and homeostasis. J. Neurosci. Res 83, 711–730 (2006). [DOI] [PMC free article] [PubMed] [Google Scholar]
- 91.Kohno H, Maeda T, Perusek L, Pearlman E, Maeda A, CCL3 production by microglial cells modulates disease severity in murine models of retinal degeneration. J. Immunol 192, 3816–3827 (2014). [DOI] [PMC free article] [PubMed] [Google Scholar]
- 92.Uittenbogaard M, Baxter KK, Chiaramello A, NeuroD6 Genomic Signature Bridging Neuronal Differentiation to Survival via the Molecular Chaperone Network. J. Neurosci. Res 88, 33 (2010). [DOI] [PMC free article] [PubMed] [Google Scholar]
- 93.Kodama T, Guerrero S, Shin M, Moghadam S, Faulstich M, du Lac S, Neuronal Classification and Marker Gene Identification via Single-Cell Expression Profiling of Brainstem Vestibular Neurons Subserving Cerebellar Learning. J. Neurosci 32, 7819 (2012). [DOI] [PMC free article] [PubMed] [Google Scholar]
- 94.Yanai H, Nakamura K, Hijioka S, Kamei A, Ikari T, Ishikawa Y, Shinozaki E, Mizunuma N, Hatake K, Miyajima A, Dlk-1, a cell surface antigen on foetal hepatic stem/progenitor cells, is expressed in hepatocellular, colon, pancreas and breast carcinomas at a high frequency. J. Biochem 148, 85–92 (2010). [DOI] [PubMed] [Google Scholar]
- 95.Zhao D, Chen S, Cai J, Guo Y, Song Z, Che J, Liu C, Wu C, Ding M, Deng H, Derivation and characterization of hepatic progenitor cells from human embryonic stem cells. PLoS One 4, e6468 (2009). [DOI] [PMC free article] [PubMed] [Google Scholar]
- 96.Mutlu-Albayrak H, Bene J, Oflaz MB, Tanyalçın T, Çaksen H, Melegh B, Identification of SLC22A5 Gene Mutation in a Family with Carnitine Uptake Defect. Case Rep. Genet 2015, 259627 (2015). [DOI] [PMC free article] [PubMed] [Google Scholar]
- 97.Huang Z, Zhang M, Plec AA, Estill SJ, Cai L, Repa JJ, McKnight SL, Tu BP, ACSS2 promotes systemic fat storage and utilization through selective regulation of genes involved in lipid metabolism. Proc. Natl. Acad. Sci. U. S. A 115, E9499–E9506 (2018). [DOI] [PMC free article] [PubMed] [Google Scholar]
- 98.Nagamani SCS, Erez A, A metabolic link between the urea cycle and cancer cell proliferation. Mol Cell Oncol 3, e1127314 (2016). [DOI] [PMC free article] [PubMed] [Google Scholar]
- 99.Pliner HA, Shendure J, Trapnell C, Supervised classification enables rapid annotation of cell atlases. Nat. Methods 16, 983–986 (2019). [DOI] [PMC free article] [PubMed] [Google Scholar]
- 100.Baron M, Veres A, Wolock SL, Faust AL, Gaujoux R, Vetere A, Ryu JH, Wagner BK, Shen-Orr SS, Klein AM, Melton DA, Yanai I, A Single-Cell Transcriptomic Map of the Human and Mouse Pancreas Reveals Inter- and Intra-cell Population Structure. Cell Syst 3, 346–360.e4 (2016). [DOI] [PMC free article] [PubMed] [Google Scholar]
- 101.Abdelaal T, Michielsen L, Cats D, Hoogduin D, Mei H, Reinders MJT, Mahfouz A, A comparison of automatic cell identification methods for single-cell RNA sequencing data. Genome Biol 20, 194 (2019). [DOI] [PMC free article] [PubMed] [Google Scholar]
- 102.Korsunsky I, Millard N, Fan J, Slowikowski K, Zhang F, Wei K, Baglaenko Y, Brenner M, Loh P-R, Raychaudhuri S, Fast, sensitive and accurate integration of single-cell data with Harmony. Nat. Methods 16, 1289–1296 (2019). [DOI] [PMC free article] [PubMed] [Google Scholar]
- 103.Castagnaro L, Lenti E, Maruzzelli S, Spinardi L, Migliori E, Farinello D, Sitia G, Harrelson Z, Evans SM, Guidotti LG, Harvey RP, Brendolan A, Nkx2–5(+)islet1(+) mesenchymal precursors generate distinct spleen stromal cell subsets and participate in restoring stromal network integrity. Immunity 38, 782–791 (2013). [DOI] [PMC free article] [PubMed] [Google Scholar]
- 104.Oda A, Tezuka T, Ueno Y, Hosoda S, Amemiya Y, Notsu C, Kasahara T, Nishiyama C, Goitsuka R, Niche-induced extramedullary hematopoiesis in the spleen is regulated by the transcription factor Tlx1. Sci. Rep 8, 8308 (2018). [DOI] [PMC free article] [PubMed] [Google Scholar]
- 105.Kim P-H, Na S-S, Lee B, Kim J-H, Cho J-Y, Stanniocalcin 2 enhances mesenchymal stem cell survival by suppressing oxidative stress. BMB Rep 48, 702–707 (2015). [DOI] [PMC free article] [PubMed] [Google Scholar]
- 106.Villani A-C, Satija R, Reynolds G, Sarkizova S, Shekhar K, Fletcher J, Griesbeck M, Butler A, Zheng S, Lazo S, Jardine L, Dixon D, Stephenson E, Nilsson E, Grundberg I, McDonald D, Filby A, Li W, De Jager PL, Rozenblatt-Rosen O, Lane AA, Haniffa M, Regev A, Hacohen N, Single-cell RNA-seq reveals new types of human blood dendritic cells, monocytes, and progenitors. Science 356 (2017), doi: 10.1126/science.aah4573. [DOI] [PMC free article] [PubMed] [Google Scholar]
- 107.Epelman S, Lavine KJ, Randolph GJ, Origin and Functions of Tissue Macrophages. Immunity 41 (2014), pp. 21–35. [DOI] [PMC free article] [PubMed] [Google Scholar]
- 108.Popescu D-M, Botting RA, Stephenson E, Green K, Webb S, Jardine L, Calderbank EF, Polanski K, Goh I, Efremova M, Acres M, Maunder D, Vegh P, Gitton Y, Park J-E, Vento-Tormo R, Miao Z, Dixon D, Rowell R, McDonald D, Fletcher J, Poyner E, Reynolds G, Mather M, Moldovan C, Mamanova L, Greig F, Young MD, Meyer KB, Lisgo S, Bacardit J, Fuller A, Millar B, Innes B, Lindsay S, Stubbington MJT, Kowalczyk MS, Li B, Ashenberg O, Tabaka M, Dionne D, Tickle TL, Slyper M, Rozenblatt-Rosen O, Filby A, Carey P, Villani A-C, Roy A, Regev A, Chédotal A, Roberts I, Göttgens B, Behjati S, Laurenti E, Teichmann SA, Haniffa M, Decoding human fetal liver haematopoiesis. Nature 574, 365–371 (2019). [DOI] [PMC free article] [PubMed] [Google Scholar]
- 109.Bian Z, Gong Y, Huang T, Lee CZW, Bian L, Bai Z, Shi H, Zeng Y, Liu C, He J, Zhou J, Li X, Li Z, Ni Y, Ma C, Cui L, Zhang R, Chan JKY, Ng LG, Lan Y, Ginhoux F, Liu B, Deciphering human macrophage development at single-cell resolution. Nature 582, 571–576 (2020). [DOI] [PubMed] [Google Scholar]
- 110.Immune cell markers (BD), (available at http://www.bdbiosciences.com/us/s/cdmarkers).
- 111.Immune cell markers (proteintech), (available at https://www.ptglab.com/products/featured-products/markers-for-immune-cells/).
- 112.Immune cell marker (Invitrogen eBioscience), (available at https://www.thermofisher.com/us/en/home/life-science/cell-analysis/cell-analysis-learning-center/cell-analysis-resource-library/ebioscience-resources/human-cd-other-cellular-antigens.html).
- 113.Kitchen S, Krutzik S, Levin B, Rezek V, Kitchen C, Zack J, Ligation of CD4 on human blood monocytes triggers macrophage differentiation (158.8). The Journal of Immunology 186, 158.8–158.8 (2011). [Google Scholar]
- 114.Domingues RG, Lago-Baldaia I, Pereira-Castro I, Fachini JM, Oliveira L, Drpic D, Lopes N, Henriques T, Neilson JR, Carmo AM, Moreira A, CD5 expression is regulated during human T-cell activation by alternative polyadenylation, PTBP1, and miR-204. Eur. J. Immunol 46, 1490–1503 (2016). [DOI] [PMC free article] [PubMed] [Google Scholar]
- 115.Melo-Gonzalez F, Hepworth MR, Functional and phenotypic heterogeneity of group 3 innate lymphoid cells. Immunology 150, 265–275 (2017). [DOI] [PMC free article] [PubMed] [Google Scholar]
- 116.Nagasawa M, Heesters BA, Kradolfer CMA, Krabbendam L, Martinez-Gonzalez I, de Bruijn MJW, Golebski K, Hendriks RW, Stadhouders R, Spits H, Bal SM, KLRG1 and NKp46 discriminate subpopulations of human CD117CRTH2 ILCs biased toward ILC2 or ILC3. J. Exp. Med 216, 1762–1776 (2019). [DOI] [PMC free article] [PubMed] [Google Scholar]
- 117.Dzierzak E, Philipsen S, Erythropoiesis: Development and Differentiation. Cold Spring Harbor Perspectives in Medicine 3 (2013), pp. a011601–a011601. [DOI] [PMC free article] [PubMed] [Google Scholar]
- 118.Kobayashi I, Kondo M, Yamamori S, Kobayashi-Sun J, Taniguchi M, Kanemaru K, Katakura F, Traver D, Enrichment of hematopoietic stem/progenitor cells in the zebrafish kidney. Sci. Rep 9, 14205 (2019). [DOI] [PMC free article] [PubMed] [Google Scholar]
- 119.Knudsen KJ, Rehn M, Hasemann MS, Rapin N, Bagger FO, Ohlsson E, Willer A, Frank A-K, Søndergaard E, Jendholm J, Thorén L, Lee J, Rak J, Theilgaard-Mönch K, Porse BT, ERG promotes the maintenance of hematopoietic stem cells by restricting their differentiation. Genes Dev 29, 1915–1929 (2015). [DOI] [PMC free article] [PubMed] [Google Scholar]
- 120.Psaila B, Barkas N, Iskander D, Roy A, Anderson S, Ashley N, Caputo VS, Lichtenberg J, Loaiza S, Bodine DM, Karadimitris A, Mead AJ, Roberts I, Single-cell profiling of human megakaryocyte-erythroid progenitors identifies distinct megakaryocyte and erythroid differentiation pathways. Genome Biol 17, 83 (2016). [DOI] [PMC free article] [PubMed] [Google Scholar]
- 121.Kataoka K, Sato T, Yoshimi A, Goyama S, Tsuruta T, Kobayashi H, Shimabe M, Arai S, Nakagawa M, Imai Y, Kumano K, Kumagai K, Kubota N, Kadowaki T, Kurokawa M, Evi1 is essential for hematopoietic stem cell self-renewal, and its expression marks hematopoietic cells with long-term multilineage repopulating activity. J. Exp. Med 208, 2403–2416 (2011). [DOI] [PMC free article] [PubMed] [Google Scholar]
- 122.Lapierre M, Castet-Nicolas A, Gitenay D, Jalaguier S, Teyssier C, Bret C, Cartron G, Moreaux J, Cavaillès V, Expression and role of RIP140/NRIP1 in chronic lymphocytic leukemia. J. Hematol. Oncol 8, 20 (2015). [DOI] [PMC free article] [PubMed] [Google Scholar]
- 123.Tusi BK, Wolock SL, Weinreb C, Hwang Y, Hidalgo D, Zilionis R, Waisman A, Huh JR, Klein AM, Socolovsky M, Population Snapshots Predict Early Hematopoietic and Erythroid Hierarchies. Nature 555, 54 (2018). [DOI] [PMC free article] [PubMed] [Google Scholar]
- 124.Pellin D, Loperfido M, Baricordi C, Wolock SL, Montepeloso A, Weinberg OK, Biffi A, Klein AM, Biasco L, A comprehensive single cell transcriptional landscape of human hematopoietic progenitors. Nat. Commun 10, 2395 (2019). [DOI] [PMC free article] [PubMed] [Google Scholar]
- 125.Yumine A, Fraser ST, Sugiyama D, Regulation of the embryonic erythropoietic niche: a future perspective. Blood Res 52, 10–17 (2017). [DOI] [PMC free article] [PubMed] [Google Scholar]
- 126.Ernst LM, Ruchelli ED, Huff DS, Color Atlas of Fetal and Neonatal Histology (Springer Science & Business Media, 2011). [Google Scholar]
- 127.Gardner LI, Adrenal function in the premature and newborn. Pediatrics 17, 414–417 (1956). [PubMed] [Google Scholar]
- 128.Kalfa T, McGrath KE, Analysis of Erythropoiesis Using Imaging Flow Cytometry. Methods Mol. Biol 1698, 175–192 (2018). [DOI] [PubMed] [Google Scholar]
- 129.Merrill JE, Tumor necrosis factor alpha, interleukin 1 and related cytokines in brain development: normal and pathological. Dev. Neurosci 14, 1–10 (1992). [DOI] [PubMed] [Google Scholar]
- 130.Park S-Y, Kang M-J, Han J-S, Interleukin-1 beta promotes neuronal differentiation through the Wnt5a/RhoA/JNK pathway in cortical neural precursor cells. Mol. Brain 11, 39 (2018). [DOI] [PMC free article] [PubMed] [Google Scholar]
- 131.Ormel PR, Vieira de Sá R, van Bodegraven EJ, Karst H, Harschnitz O, Sneeboer MAM, Johansen LE, van Dijk RE, Scheefhals N, Berdenis van Berlekom A, Ribes Martínez E, Kling S, MacGillavry HD, van den Berg LH, Kahn RS, Hol EM, de Witte LD, Pasterkamp RJ, Microglia innately develop within cerebral organoids. Nat. Commun 9, 4167 (2018). [DOI] [PMC free article] [PubMed] [Google Scholar]
- 132.Pais TF, Szegő ÉM, Marques O, Miller-Fleming L, Antas P, Guerreiro P, de Oliveira RM, Kasapoglu B, Outeiro TF, The NAD-dependent deacetylase sirtuin 2 is a suppressor of microglial activation and brain inflammation. EMBO J 32, 2603 (2013). [DOI] [PMC free article] [PubMed] [Google Scholar]
- 133.Zhu J, Luo L, Tian L, Yin S, Ma X, Cheng S, Tang W, Yu J, Ma W, Zhou X, Fan X, Yang X, Yan J, Xu X, Lv C, Liang H, Aryl Hydrocarbon Receptor Promotes IL-10 Expression in Inflammatory Macrophages Through Src-STAT3 Signaling Pathway. Front. Immunol 9, 2033 (2018). [DOI] [PMC free article] [PubMed] [Google Scholar]
- 134.Lapenna A, De Palma M, Lewis CE, Perivascular macrophages in health and disease. Nat. Rev. Immunol 18, 689–702 (2018). [DOI] [PubMed] [Google Scholar]
- 135.Hu H, Hao J, Yao H, Chang Q, Li R, Zhang X, Liang Z, Prenatal diagnosis of de novo partial trisomy 18p and partial monosomy 18q recurrent in a family with fatal aortic coarctation. Gene 517 (2013), pp. 132–136. [DOI] [PubMed] [Google Scholar]
- 136.Sanjurjo L, Amézaga N, Aran G, Naranjo-Gómez M, Arias L, Armengol C, Borràs FE, Sarrias M-R, The human CD5L/AIM-CD36 axis: A novel autophagy inducer in macrophages that modulates inflammatory responses. Autophagy 11, 487 (2015). [DOI] [PMC free article] [PubMed] [Google Scholar]
- 137.Zigmond E, Samia-Grinberg S, Pasmanik-Chor M, Brazowski E, Shibolet O, Halpern Z, Varol C, Infiltrating Monocyte-Derived Macrophages and Resident Kupffer Cells Display Different Ontogeny and Functions in Acute Liver Injury. The Journal of Immunology 193, 344–353 (2014). [DOI] [PubMed] [Google Scholar]
- 138.Dutta P, Hoyer FF, Grigoryeva LS, Sager HB, Leuschner F, Courties G, Borodovsky A, Novobrantseva T, Ruda VM, Fitzgerald K, Iwamoto Y, Wojtkiewicz G, Sun Y, Da Silva N, Libby P, Anderson DG, Swirski FK, Weissleder R, Nahrendorf M, Macrophages retain hematopoietic stem cells in the spleen via VCAM-1. J. Exp. Med 212, 497–512 (2015). [DOI] [PMC free article] [PubMed] [Google Scholar]
- 139.Kalucka J, de Rooij LPMH, Goveia J, Rohlenova K, Dumas SJ, Meta E, Conchinha NV, Taverna F, Teuwen L-A, Veys K, García-Caballero M, Khan S, Geldhof V, Sokol L, Chen R, Treps L, Borri M, de Zeeuw P, Dubois C, Karakach TK, Falkenberg KD, Parys M, Yin X, Vinckier S, Du Y, Fenton RA, Schoonjans L, Dewerchin M, Eelen G, Thienpont B, Lin L, Bolund L, Li X, Luo Y, Carmeliet P, Single-Cell Transcriptome Atlas of Murine Endothelial Cells. Cell 180, 764–779.e20 (2020). [DOI] [PubMed] [Google Scholar]
- 140.Kalucka J, de Rooij LPMH, Goveia J, Rohlenova K, Dumas SJ, Meta E, Conchinha NV, Taverna F, Teuwen L-A, Veys K, García-Caballero M, Khan S, Geldhof V, Sokol L, Chen R, Treps L, Borri M, de Zeeuw P, Dubois C, Karakach TK, Falkenberg KD, Parys M, Yin X, Vinckier S, Du Y, Fenton RA, Schoonjans L, Dewerchin M, Eelen G, Thienpont B, Lin L, Bolund L, Li X, Luo Y, Carmeliet P, Single-Cell Transcriptome Atlas of Murine Endothelial Cells. Cell 180, 764–779.e20 (2020). [DOI] [PubMed] [Google Scholar]
- 141.Gannon KP, McKey SE, Stec DE, Drummond HA, Altered myogenic vasoconstriction and regulation of whole kidney blood flow in the ASIC2 knockout mouse. American Journal of Physiology - Renal Physiology 308, F339 (2015). [DOI] [PMC free article] [PubMed] [Google Scholar]
- 142.Lian X, Beer-Hammer S, König GM, Kostenis E, Nürnberg B, Gollasch M, RXFP1 Receptor Activation by Relaxin-2 Induces Vascular Relaxation in Mice via a Gαi2-Protein/PI3Kß/γ/Nitric Oxide-Coupled Pathway. Front. Physiol 9 (2018), doi: 10.3389/fphys.2018.01234. [DOI] [PMC free article] [PubMed] [Google Scholar]
- 143.Andreone BJ, Chow BW, Tata A, Lacoste B, Ben-Zvi A, Bullock K, Deik AA, Ginty DD, Clish CB, Gu C, Blood-Brain Barrier Permeability Is Regulated by Lipid Transport-Dependent Suppression of Caveolae-Mediated Transcytosis. Neuron 94, 581–594.e5 (2017). [DOI] [PMC free article] [PubMed] [Google Scholar]
- 144.Chen L, Mupo A, Huynh T, Cioffi S, Woods M, Jin C, McKeehan W, Thompson-Snipes L, Baldini A, Illingworth E, Tbx1 regulates Vegfr3 and is required for lymphatic vessel development. J. Cell Biol 189, 417–424 (2010). [DOI] [PMC free article] [PubMed] [Google Scholar]
- 145.Tao W, Moore R, Meng Y, Smith ER, Xu X-X, Endocytic adaptors Arh and Dab2 control homeostasis of circulatory cholesterol. J. Lipid Res 57, 809–817 (2016). [DOI] [PMC free article] [PubMed] [Google Scholar]
- 146.Furlan A, Lübke M, Adameyko I, Lallemend F, Ernfors P, The transcription factor Hmx1 and growth factor receptor activities control sympathetic neurons diversification. EMBO J 32, 1613–1625 (2013). [DOI] [PMC free article] [PubMed] [Google Scholar]
- 147.Wang Y-C, Gallego-Arteche E, Iezza G, Yuan X, Matli MR, Choo S-P, Zuraek MB, Gogia R, Lynn FC, German MS, Bergsland EK, Donner DB, Warren RS, Nakakura EK, Homeodomain transcription factor NKX2.2 functions in immature cells to control enteroendocrine differentiation and is expressed in gastrointestinal neuroendocrine tumors. Endocr. Relat. Cancer 16, 267–279 (2009). [DOI] [PubMed] [Google Scholar]
- 148.Kobayashi Y, Tata PR, Pulmonary Neuroendocrine Cells: Sensors and Sentinels of the Lung. Dev. Cell 45 (2018), pp. 425–426. [DOI] [PubMed] [Google Scholar]
- 149.Li C, Li A, Xing Y, Li M, Chan B, Ouyang R, Taketo MM, Kucherlapati R, Borok Z, Minoo P, Apc deficiency alters pulmonary epithelial cell fate and inhibits Nkx2.1 via triggering TGF-beta signaling. Dev. Biol 378, 13–24 (2013). [DOI] [PMC free article] [PubMed] [Google Scholar]
- 150.Churchill AJ, Gutiérrez GD, Singer RA, Lorberbaum DS, Fischer KA, Sussel L, Genetic evidence that Nkx2.2 acts primarily downstream of Neurog3 in pancreatic endocrine lineage development. Elife 6 (2017), doi: 10.7554/eLife.20010. [DOI] [PMC free article] [PubMed] [Google Scholar]
- 151.Arnes L, Hill JT, Gross S, Magnuson MA, Sussel L, Ghrelin Expression in the Mouse Pancreas Defines a Unique Multipotent Progenitor Population. PLoS One 7 (2012), doi: 10.1371/journal.pone.0052026. [DOI] [PMC free article] [PubMed] [Google Scholar]
- 152.Gribble FM, Reimann F, Enteroendocrine Cells: Chemosensors in the Intestinal Epithelium. Annu. Rev. Physiol 78, 277–299 (2016). [DOI] [PubMed] [Google Scholar]
- 153.Ramond C, Beydag-Tasöz BS, Azad A, van de Bunt M, Petersen MBK, Beer NL, Glaser N, Berthault C, Gloyn AL, Hansson M, McCarthy MI, Honoré C, Grapin-Botton A, Scharfmann R, Understanding human fetal pancreas development using subpopulation sorting, RNA sequencing and single-cell profiling. Development 145 (2018), doi: 10.1242/dev.165480. [DOI] [PMC free article] [PubMed] [Google Scholar]
- 154.Volante M, Fulcheri E, Allìa E, Cerrato M, Pucci A, Papotti M, Ghrelin expression in fetal, infant, and adult human lung. J. Histochem. Cytochem 50, 1013–1021 (2002). [DOI] [PubMed] [Google Scholar]
- 155.LeSimple P, van Seuningen I, Buisine M-P, Copin M-C, Hinz M, Hoffmann W, Hajj R, Brody SL, Coraux C, Puchelle E, Trefoil factor family 3 peptide promotes human airway epithelial ciliated cell differentiation. Am. J. Respir. Cell Mol. Biol 36, 296–303 (2007). [DOI] [PubMed] [Google Scholar]
- 156.Taché Y, Marki W, Rivier J, Vale W, Brown M, Central nervous system inhibition of gastric secretion in the rat by gastrin-releasing peptide, a mammalian bombesin. Gastroenterology 81, 298–302 (1981). [PubMed] [Google Scholar]
- 157.Kurotani R, Tomita T, Yang Q, Carlson BA, Chen C, Kimura S, Role of secretoglobin 3A2 in lung development. Am. J. Respir. Crit. Care Med 178, 389–398 (2008). [DOI] [PMC free article] [PubMed] [Google Scholar]
- 158.Hochane M, van den Berg PR, Fan X, Bérenger-Currias N, Adegeest E, Bialecka M, Nieveen M, Menschaart M, Chuva SM de Sousa Lopes, S. Semrau, Single-cell transcriptomics reveals gene expression dynamics of human fetal kidney development. PLoS Biol 17, e3000152 (2019). [DOI] [PMC free article] [PubMed] [Google Scholar]
- 159.Dekel B, Metsuyanim S, Schmidt-Ott KM, Fridman E, Jacob-Hirsch J, Simon A, Pinthus J, Mor Y, Barasch J, Amariglio N, Reisner Y, Kaminski N, Rechavi G, Multiple imprinted and stemness genes provide a link between normal and tumor progenitor cells of the developing human kidney. Cancer Res 66, 6040–6049 (2006). [DOI] [PubMed] [Google Scholar]
- 160.Moriguchi T, Hamada M, Morito N, Terunuma T, Hasegawa K, Zhang C, Yokomizo T, Esaki R, Kuroda E, Yoh K, Kudo T, Nagata M, Greaves DR, Engel JD, Yamamoto M, Takahashi S, MafB is essential for renal development and F4/80 expression in macrophages. Mol. Cell. Biol 26, 5715–5727 (2006). [DOI] [PMC free article] [PubMed] [Google Scholar]
- 161.Maezawa Y, Onay T, Scott RP, Keir LS, Dimke H, Li C, Eremina V, Maezawa Y, Jeansson M, Shan J, Binnie M, Lewin M, Ghosh A, Miner JH, Vainio SJ, Quaggin SE, Loss of the podocyte-expressed transcription factor Tcf21/Pod1 results in podocyte differentiation defects and FSGS. J. Am. Soc. Nephrol 25, 2459–2470 (2014). [DOI] [PMC free article] [PubMed] [Google Scholar]
- 162.Marable SS, Chung E, Adam M, Potter SS, Park J-S, Hnf4a deletion in the mouse kidney phenocopies Fanconi renotubular syndrome. JCI Insight 3 (2018), doi: 10.1172/jci.insight.97497. [DOI] [PMC free article] [PubMed] [Google Scholar]
- 163.O’Rahilly R, Early human development and the chief sources of information on staged human embryos. Eur. J. Obstet. Gynecol. Reprod. Biol 9, 273–280 (1979). [DOI] [PubMed] [Google Scholar]
- 164.Theiler K, The House Mouse: Atlas of Embryonic Development (Springer Science & Business Media, 2013). [Google Scholar]
- 165.Reemst K, Noctor SC, Lucassen PJ, Hol EM, The Indispensable Roles of Microglia and Astrocytes during Brain Development. Front. Hum. Neurosci 10, 566 (2016). [DOI] [PMC free article] [PubMed] [Google Scholar]
- 166.Dai J, Bercury KK, Ahrendsen JT, Macklin WB, Olig1 function is required for oligodendrocyte differentiation in the mouse brain. J. Neurosci 35, 4386–4402 (2015). [DOI] [PMC free article] [PubMed] [Google Scholar]
- 167.See J, Zhang X, Eraydin N, Mun S-B, Mamontov P, Golden JA, Grinspan JB, Oligodendrocyte maturation is inhibited by bone morphogenetic protein. Mol. Cell. Neurosci 26, 481–492 (2004). [DOI] [PubMed] [Google Scholar]
- 168.Komorowska K, Doyle A, Wahlestedt M, Subramaniam A, Debnath S, Chen J, Soneji S, Van Handel B, Mikkola HKA, Miharada K, Bryder D, Larsson J, Magnusson M, Hepatic Leukemia Factor Maintains Quiescence of Hematopoietic Stem Cells and Protects the Stem Cell Pool during Regeneration. Cell Rep 21, 3514–3523 (2017). [DOI] [PubMed] [Google Scholar]
- 169.Huang H, Li Y, Liu B, Transcriptional regulation of mast cell and basophil lineage commitment. Semin. Immunopathol 38, 539–548 (2016). [DOI] [PMC free article] [PubMed] [Google Scholar]
- 170.Medvedovic J, Ebert A, Tagoh H, Busslinger M, Pax5: a master regulator of B cell development and leukemogenesis. Adv. Immunol 111, 179–206 (2011). [DOI] [PubMed] [Google Scholar]
- 171.Cantù C, Ierardi R, Alborelli I, Fugazza C, Cassinelli L, Piconese S, Bosè F, Ottolenghi S, Ferrari G, Ronchi A, Sox6 enhances erythroid differentiation in human erythroid progenitors. Blood 117, 3669–3679 (2011). [DOI] [PubMed] [Google Scholar]
- 172.Lavin Y, Mortha A, Rahman A, Merad M, Regulation of macrophage development and function in peripheral tissues. Nat. Rev. Immunol 15, 731–744 (2015). [DOI] [PMC free article] [PubMed] [Google Scholar]
- 173.Qiu X, Mao Q, Tang Y, Wang L, Chawla R, Pliner HA, Trapnell C, Reversed graph embedding resolves complex single-cell trajectories. Nat. Methods 14, 979–982 (2017). [DOI] [PMC free article] [PubMed] [Google Scholar]
- 174.Buttgereit A, Lelios I, Yu X, Vrohlings M, Krakoski NR, Gautier EL, Nishinakamura R, Becher B, Greter M, Sall1 is a transcriptional regulator defining microglia identity and function. Nat. Immunol 17, 1397–1406 (2016). [DOI] [PubMed] [Google Scholar]
- 175.Holtman IR, Skola D, Glass CK, Transcriptional control of microglia phenotypes in health and disease. J. Clin. Invest 127, 3220–3229 (2017). [DOI] [PMC free article] [PubMed] [Google Scholar]
- 176.Mazzarello P, A unifying concept: the history of cell theory. Nat. Cell Biol 1, E13–5 (1999). [DOI] [PubMed] [Google Scholar]
- 177.Asp M, Giacomello S, Larsson L, Wu C, Fürth D, Qian X, Wärdell E, Custodio J, Reimegård J, Salmén F, Österholm C, Ståhl PL, Sundström E, Åkesson E, Bergmann O, Bienko M, Månsson-Broberg A, Nilsson M, Sylvén C, Lundeberg J, A Spatiotemporal Organ-Wide Gene Expression and Cell Atlas of the Developing Human Heart. Cell 179, 1647–1660.e19 (2019). [DOI] [PubMed] [Google Scholar]
- 178.Wagner DE, Weinreb C, Collins ZM, Briggs JA, Megason SG, Klein AM, Single-cell mapping of gene expression landscapes and lineage in the zebrafish embryo. Science 360, 981–987 (2018). [DOI] [PMC free article] [PubMed] [Google Scholar]
- 179.Briggs JA, Weinreb C, Wagner DE, Megason S, Peshkin L, Kirschner MW, Klein AM, The dynamics of gene expression in vertebrate embryogenesis at single-cell resolution. Science 360 (2018), doi: 10.1126/science.aar5780. [DOI] [PMC free article] [PubMed] [Google Scholar]
- 180.Karaiskos N, Wahle P, Alles J, Boltengagen A, Ayoub S, Kipar C, Kocks C, Rajewsky N, Zinzen RP, The embryo at single-cell transcriptome resolution. Science 358, 194–199 (2017). [DOI] [PubMed] [Google Scholar]
- 181.Blakeley P, Fogarty NME, Del Valle I, Wamaitha SE, Hu TX, Elder K, Snell P, Christie L, Robson P, Niakan KK, Defining the three cell lineages of the human blastocyst by single-cell RNA-seq. Development 142, 3613 (2015). [DOI] [PMC free article] [PubMed] [Google Scholar]
- 182.Pijuan-Sala B, Griffiths JA, Guibentif C, Hiscock TW, Jawaid W, Calero-Nieto FJ, Mulas C, Ibarra-Soria X, Tyser RCV, Ho DLL, Reik W, Srinivas S, Simons BD, Nichols J, Marioni JC, Göttgens B, A single-cell molecular map of mouse gastrulation and early organogenesis. Nature 566, 490–495 (2019). [DOI] [PMC free article] [PubMed] [Google Scholar]
- 183.Wang P, Chen Y, Yong J, Cui Y, Wang R, Wen L, Qiao J, Tang F, Dissecting the Global Dynamic Molecular Profiles of Human Fetal Kidney Development by Single-Cell RNA Sequencing. Cell Rep 24, 3554–3567.e3 (2018). [DOI] [PubMed] [Google Scholar]
- 184.Segal JM, Kent D, Wesche DJ, Ng SS, Serra M, Oulès B, Kar G, Emerton G, Blackford SJI, Darmanis S, Miquel R, Luong TV, Yamamoto R, Bonham A, Jassem W, Heaton N, Vigilante A, King A, Sancho R, Teichmann S, Quake SR, Nakauchi H, Rashid ST, Single cell analysis of human foetal liver captures the transcriptional profile of hepatobiliary hybrid progenitors. Nat. Commun 10, 3350 (2019). [DOI] [PMC free article] [PubMed] [Google Scholar]
- 185.Gao S, Yan L, Wang R, Li J, Yong J, Zhou X, Wei Y, Wu X, Wang X, Fan X, Yan J, Zhi X, Gao Y, Guo H, Jin X, Wang W, Mao Y, Wang F, Wen L, Fu W, Ge H, Qiao J, Tang F, Tracing the temporal-spatial transcriptome landscapes of the human fetal digestive tract using single-cell RNA-sequencing. Nat. Cell Biol 20, 721–734 (2018). [DOI] [PubMed] [Google Scholar]
- 186.Banerji JS, Kumar RM, Devasia A, Extramedullary hematopoiesis in the adrenal: Case report and review of literature. Can. Urol. Assoc. J 7, E436–8 (2013). [DOI] [PMC free article] [PubMed] [Google Scholar]
- 187.Al-Thani H, Al-Sulaiti M, El-Mabrok G, Tabeb A, El-Menyar A, Adrenal extramedullary hematopoiesis associated with beta-thalassemia trait in an adult woman: a case report and review of literature. Int. J. Surg. Case Rep 24, 83–87 (2016). [DOI] [PMC free article] [PubMed] [Google Scholar]
- 188.Amini S, Pushkarev D, Christiansen L, Kostem E, Royce T, Turk C, Pignatelli N, Adey A, Kitzman JO, Vijayan K, Ronaghi M, Shendure J, Gunderson KL, Steemers FJ, Haplotype-resolved whole-genome sequencing by contiguity-preserving transposition and combinatorial indexing. Nat. Genet 46, 1343–1349 (2014). [DOI] [PMC free article] [PubMed] [Google Scholar]
- 189.Wolock SL, Lopez R, Klein AM, Scrublet: computational identification of cell doublets in single-cell transcriptomic data (2018), , doi: 10.1101/357368. [DOI] [PMC free article] [PubMed]
- 190.Thul PJ, Lindskog C, The human protein atlas: A spatial map of the human proteome. Protein Sci 27, 233–244 (2018). [DOI] [PMC free article] [PubMed] [Google Scholar]
- 191.Aibar S, González-Blas CB, Moerman T, Huynh-Thu VA, Imrichova H, Hulselmans G, Rambow F, Marine J-C, Geurts P, Aerts J, van den Oord J, Atak ZK, Wouters J, Aerts S, SCENIC: single-cell regulatory network inference and clustering. Nat. Methods 14, 1083–1086 (2017). [DOI] [PMC free article] [PubMed] [Google Scholar]
- 192.Buenrostro JD, Giresi PG, Zaba LC, Chang HY, Greenleaf WJ, Transposition of native chromatin for fast and sensitive epigenomic profiling of open chromatin, DNA-binding proteins and nucleosome position. Nat. Methods 10, 1213–1218 (2013). [DOI] [PMC free article] [PubMed] [Google Scholar]
- 193.Renaud G, Stenzel U, Maricic T, Wiebe V, Kelso J, deML: robust demultiplexing of Illumina sequences using a likelihood-based approach. Bioinformatics 31, 770–772 (2015). [DOI] [PMC free article] [PubMed] [Google Scholar]
- 194.Dobin A, Davis CA, Schlesinger F, Drenkow J, Zaleski C, Jha S, Batut P, Chaisson M, Gingeras TR, STAR: ultrafast universal RNA-seq aligner. Bioinformatics 29, 15–21 (2013). [DOI] [PMC free article] [PubMed] [Google Scholar]
- 195.Anders S, Pyl PT, Huber W, HTSeq--a Python framework to work with high-throughput sequencing data. Bioinformatics, btu638 (2014). [DOI] [PMC free article] [PubMed] [Google Scholar]
- 196.Zheng GXY, Terry JM, Belgrader P, Ryvkin P, Bent ZW, Wilson R, Ziraldo SB, Wheeler TD, McDermott GP, Zhu J, Gregory MT, Shuga J, Montesclaros L, Underwood JG, Masquelier DA, Nishimura SY, Schnall-Levin M, Wyatt PW, Hindson CM, Bharadwaj R, Wong A, Ness KD, Beppu LW, Deeg HJ, McFarland C, Loeb KR, Valente WJ, Ericson NG, Stevens EA, Radich JP, Mikkelsen TS, Hindson BJ, Bielas JH, Massively parallel digital transcriptional profiling of single cells. Nat. Commun 8, 14049 (2017). [DOI] [PMC free article] [PubMed] [Google Scholar]
- 197.Wolf FA, Angerer P, Theis FJ, SCANPY: large-scale single-cell gene expression data analysis. Genome Biol 19, 15 (2018). [DOI] [PMC free article] [PubMed] [Google Scholar]
- 198.Janssen SF, Gorgels TGMF, Bossers K, Ten Brink JB, Essing AHW, Nagtegaal M, van der Spek PJ, Jansonius NM, Bergen AAB, Gene expression and functional annotation of the human ciliary body epithelia. PLoS One 7, e44973 (2012). [DOI] [PMC free article] [PubMed] [Google Scholar]
- 199.Lorenzi L, Döring C, Rausch T, Benes V, Lonardi S, Bugatti M, Campo E, Cabeçadas J, Simonitsch-Klupp I, Borges A, Mehta J, Agostinelli C, Pileri SA, Facchetti F, Hansmann M-L, Hartmann S, Identification of novel follicular dendritic cell sarcoma markers, FDCSP and SRGN, by whole transcriptome sequencing. Oncotarget 8, 16463–16472 (2017). [DOI] [PMC free article] [PubMed] [Google Scholar]
- 200.Kubin T, Pöling J, Kostin S, Gajawada P, Hein S, Rees W, Wietelmann A, Tanaka M, Lörchner H, Schimanski S, Szibor M, Warnecke H, Braun T, Oncostatin M is a major mediator of cardiomyocyte dedifferentiation and remodeling. Cell Stem Cell 9, 420–432 (2011). [DOI] [PubMed] [Google Scholar]
- 201.Lee C-L, Lam KKW, Vijayan M, Koistinen H, Seppala M, Ng EHY, Yeung WSB, Chiu PCN, The Pleiotropic Effect of Glycodelin-A in Early Pregnancy. Am. J. Reprod. Immunol 75, 290–297 (2016). [DOI] [PubMed] [Google Scholar]
- 202.Grone BP, Maruska KP, Three Distinct Glutamate Decarboxylase Genes in Vertebrates. Sci. Rep 6, 30507 (2016). [DOI] [PMC free article] [PubMed] [Google Scholar]
- 203.Pérez-Otaño I, Larsen RS, Wesseling JF, Emerging roles of GluN3-containing NMDA receptors in the CNS. Nat. Rev. Neurosci 17, 623–635 (2016). [DOI] [PubMed] [Google Scholar]
- 204.Xiao J, Lu X, Chen X, Zou Y, Liu A, Li W, He B, He S, Chen Q, Eight potential biomarkers for distinguishing between lung adenocarcinoma and squamous cell carcinoma. Oncotarget 8, 71759–71771 (2017). [DOI] [PMC free article] [PubMed] [Google Scholar]
- 205.Bonastre E, Brambilla E, Sanchez-Cespedes M, Cell adhesion and polarity in squamous cell carcinoma of the lung. J. Pathol 238, 606–616 (2016). [DOI] [PubMed] [Google Scholar]
- 206.Georgy SR, Cangkrama M, Srivastava S, Partridge D, Auden A, Dworkin S, McLean CA, Jane SM, Darido C, Identification of a Novel Proto-oncogenic Network in Head and Neck Squamous Cell Carcinoma. J. Natl. Cancer Inst 107 (2015), doi: 10.1093/jnci/djv152. [DOI] [PMC free article] [PubMed] [Google Scholar]
Associated Data
This section collects any data citations, data availability statements, or supplementary materials included in this article.