Abstract
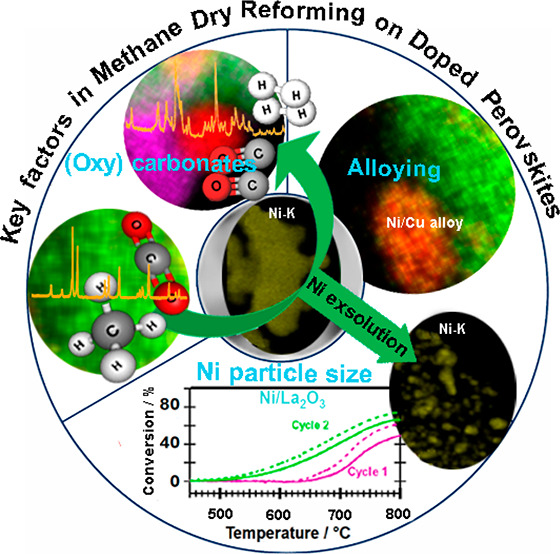
The influence of A- and/or B-site doping of Ruddlesden–Popper perovskite materials on the crystal structure, stability, and dry reforming of methane (DRM) reactivity of specific A2BO4 phases (A = La, Ba; B = Cu, Ni) has been evaluated by a combination of catalytic experiments, in situ X-ray diffraction, X-ray absorption spectroscopy (XAS), X-ray photoelectron spectroscopy (XPS), and aberration-corrected electron microscopy. At room temperature, B-site doping of La2NiO4 with Cu stabilizes the orthorhombic structure (Fmmm) of the perovskite, while A-site doping with Ba yields a tetragonal space group (I4/mmm). We observed the orthorhombic-to-tetragonal transformation above 170 °C for La2Ni0.9Cu0.1O4 and La2Ni0.8Cu0.2O4, slightly higher than for undoped La2NiO4. Loss of oxygen in interstitial sites of the tetragonal structure causes further structure transformations for all samples before decomposition in the temperature range of 400 °C–600 °C. Controlled in situ decomposition of the parent or A/B-site doped perovskite structures in a DRM mixture (CH4:CO2 = 1:1) in all cases yields an active phase consisting of exsolved nanocrystalline metallic Ni particles in contact with hexagonal La2O3 and a mixture of (oxy)carbonate phases (hexagonal and monoclinic La2O2CO3, BaCO3). Differences in the catalytic activity evolve because of (i) the in situ formation of Ni–Cu alloy phases (in a composition of >7:1 = Ni:Cu) for La2Ni0.9Cu0.1O4, La2Ni0.8Cu0.2O4, and La1.8Ba0.2Ni0.9Cu0.1O4, (ii) the resulting Ni particle size and amount of exsolved Ni, and (iii) the inherently different reactivity of the present (oxy)carbonate species. Based on the onset temperature of catalytic DRM activity, the latter decreases in the order of La2Ni0.9Cu0.1O4 ∼ La2Ni0.8Cu0.2O4 ≥ La1.8Ba0.2Ni0.9Cu0.1O4 > La2NiO4 > La1.8Ba0.2NiO4. Simple A-site doped La1.8Ba0.2NiO4 is essentially DRM inactive. The Ni particle size can be efficiently influenced by introducing Ba into the A site of the respective Ruddlesden–Popper structures, allowing us to control the Ni particle size between 10 nm and 30 nm both for simple B-site and A-site doped structures. Hence, it is possible to steer both the extent of the metal-oxide-(oxy)carbonate interface and its chemical composition and reactivity. Counteracting the limitation of the larger Ni particle size, the activity can, however, be improved by additional Cu-doping on the B-site, enhancing the carbon reactivity. Exemplified for the La2NiO4 based systems, we show how the delicate antagonistic balance of doping with Cu (rendering the La2NiO4 structure less stable and suppressing coking by efficiently removing surface carbon) and Ba (rendering the La2NiO4 structure more stable and forming unreactive surface or interfacial carbonates) can be used to tailor prospective DRM-active catalysts.
Keywords: in situ decomposition; perovskite; Ruddlesden−Popper phase; in situ X-ray diffraction, copper; phase transformation
1. Introduction
The anthropogenically induced climate change and the greenhouse effect the most important challenges mankind faces nowadays, releasing billions of tons of carbon dioxide and methane annually.1 To potentially reduce such emissions, dry reforming of methane (DRM), that is, the simultaneous utilization of both CO2 and CH4, is a particularly rewarding pathway to convert two harmful climate gases at the same time to H2 and CO.2−20 This so-called “syngas” mixture can subsequently be used for the synthesis of other useful fuels or chemicals, for example, via the Fischer–Tropsch reaction or for methanol production.21 Typically used catalysts involve noble metals, Ni or Ni alloys.1,6,7,9−12,16,22−25 Recently, activated carbon has also been investigated.26 Apart from the inherent economical issues concerning the use of noble metals, one particular challenge is connected to the deactivation and long-term stability of especially Ni-containing catalysts by coke formation.27 In the search for alternative catalyst materials, a new class of prospective compounds based on perovskite and perovskite-related structures has evolved.18,19,22,23,28,29 Perovskites, with the general formula ABO3 (A usually being a lanthanide, alkaline, or earth alkaline metal ion with a valency of 2 or 3; B being a transition metal ion with a valency of 3 or 4), are often used as catalyst precursor materials that are converted into the active phase by a reductive treatment in hydrogen, triggering the partial or complete decomposition of the parent perovskite structure and the formation of a metal-oxide-system, or in-case of in situ DRM activation, of an oxide-(oxy)carbonate system, consisting of small nm-sized metal particles attached to the oxide- or (oxy)carbonate matrix.18,19,22,28 One particularly rewarding perovskite entity is the archetypical system LaNiO3, which has already shown very promising coking properties.18,19,22−24
Specifically, the active phase resulting from LaNiO3 has been reported to be formed via reductive decomposition and the creation of highly dispersed Ni particles in contact with and hexagonal La2O3 and/or distinct oxycarbonate phases18,22 In a nutshell, the current understanding of catalytic DRM operation is a bifunctional synergistic action of both metal (mostly Ni,18,22,30,31 but e.g., also Pd32) for methane activation and oxide (e.g., La2O3 in case of perovskite precursors) for CO2 activation. It is currently controversially discussed whether spillover effects or special interfacial sites represent the active phase. The common structural denominator of all prospective catalyst materials, encompassing not only perovskite-related structures but also (oxy)carbides or alloy/intermetallic compounds is the presence of a selected precursor structure, which via in situ decomposition in the DRM mixture yields the active metal/oxide material. The latter can be present as Ni/La2O3/La2O2CO3 (in the case of LaNiO3-based perovskites18,22,30,31), Ni/Mo2C(WC) (in case of carbide materials33) or Pd/ZrO2 (in case of Pd–Zr alloys/intermetallic compound precursors32).
Readdressing the particular importance of perovskites, intermediate perovskite-related structures found during this activation process, such as the Ruddlesden–Popper phase La2NiO4, also exhibit similar beneficial properties.19,25 The common reactivity-steering denominator of all systems is the possibility to influence the structural breakdown of the perovskites by deliberate A- and B-site doping. In general, it is assumed that B-site doping has a greater effect, as it allows the reduction of the B-site cation to usually highly dispersed exsolved B metal particles.30 This has been especially also highlighted for LaNiO3 and La2NiO4.18,19,23−25
One inherent problem in the characterization of the active phase of these perovskite materials in DRM catalysis refers to the usual two-step mechanism in its formation: a prereduction step in hydrogen is usually carried out before the DRM run is performed over the reduced (i.e., metal-oxide) system.18,22 This problem is overcome by recent recognition that decomposition/activation can also be achieved operando by annealing directly in the DRM mixture–leading to different size distributions of the exsolved metal particles and, thus, different extents of interfaces and reactivity patterns.19,31 Nevertheless, despite the benefits of direct decomposition, in situ and operando characterization of the active state is clearly underrepresented in the literature. For La-based perovskites, this is a particular pity, as during DRM, the CO2-activated species apparently is La2O2CO3, reversibly formed as a function of the gas atmosphere and partial pressure by the reaction of La2O3 with CO2 and decomposed by the reaction of La2O2CO3 with deposited carbon to La2O3 and CO, respectively.34
To reveal the influence of doping on the reactivity of selected Ruddlesden–Popper perovskite systems and to assess general principles in reactivity steering, we deliberately synthesized A- and B-site doped La2NiO4 structures by an autoignition method and subjected them to catalytic reactivity measurements in the DRM reaction. As an A-side dopant, Ba was selected to potentially control the surface basicity of the perovskite entity and to eventually steer the reactivity of the interfacial (oxy)carbonate species, which are presumed to be most crucial for self-regeneration.35 To potentially enhance the coking resistance, Cu (in various compositions) was added as B-side dopant. As the most complex entity, simultaneous A- and B-side doped La2NiO4 was prepared. Hence, four doped La2NiO4 samples (apart from pure La2NiO4) were analyzed: La1.8Ba0.2NiO4, La2Ni0.9Cu0.1O4, La2Ni0.8Cu0.2O4, and La1.8Ba0.2Ni0.9Cu0.1O4. We opted to study the corresponding Ruddlesden–Popper phases in favor of LaNiO3 because the latter, especially in doped samples, is structurally unstable toward La2NiO4 upon synthesis and subsequent annealing.25,36,37 To directly establish reactivity–structure relationships, we carried out the decomposition of the respective perovskites in the DRM reaction mixture and also analyzed the corresponding structural changes by synchrotron-based in situ X-ray diffraction. Besides the determination of structural changes of the catalysts, the in situ synchrotron XRD experiments allow us also to follow the chemical expansion38,39 of each catalyst, being crucial for its respective catalytic behavior. Bulk and surface structural and elemental changes occurring during decomposition were also monitored by X-ray absorption spectroscopy (XAS), X-ray photoelectron spectroscopy (XPS), aberration-corrected electron microscopy, and energy-dispersive X-ray spectroscopy imaging of selected catalyst states during DRM.
2. Experimental Section
2.1. Synthesis of the Materials
All samples were synthesized following a dedicated autoignition method.40 As a first step, an aqueous solution using stoichiometric amounts of La(NO3)3·6H2O, Ni(NO3)2·6H2O, Ba(NO3)2, and Cu(NO3)2·3H2O. Subsequently, glycine was added to the solution in a molar ratio of 1 with respect to NO3–:NH2– to form glycine–metal complexes and to induce a homogeneous distribution of all ions. All solutions containing Cu2+ exhibited a blue color due to the presence of glycinate–copper complexes, whereas all other exhibited a greenish color. Excess water was removed upon heating the solution at 80 °C for 2 h. The resulting viscous liquid was heated to 250 °C, causing self-ignition at 1200 °C and the formation of stoichiometric amounts of metal oxides and residual carbon from glycine. Annealing at 900 °C for 12 h forms the Ruddlesden–Popper La2–xBaxNi1–yCuyO4 perovskite structures, as evidenced by ex situ XRD (Figure 1 and Table 1).
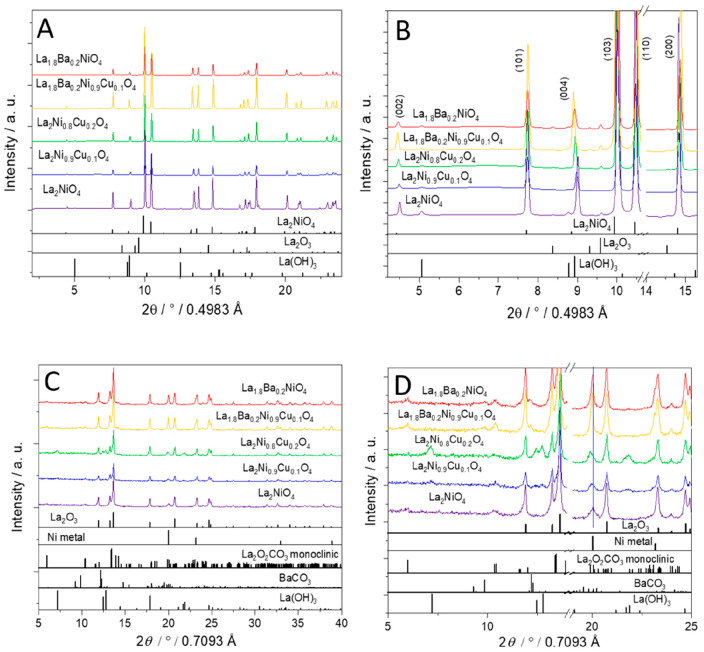
Figure 1.
Panels A and B: Ex situ collected PXRD patterns of the initial doped La2NiO4 Ruddlesden–Popper materials. The lower panel indicates the phase assignment to the respective reference structures. Panels B focus on a narrower 2θ window for closer analysis. Panels C and D: Similar analysis of the five spent doped La2NiO4 Ruddlesden–Popper materials after a catalytic DRM (CO2:CH4:He = 1:1:3) runs in a total gas flow of 100 mL min–1 up to 800 °C for a total time of 2 h.
Table 1. Summary of Structural Parameters Extracted from Powder XRD Patterns by Rietveld Refinement for All Initial Samples Using the Orthorhombic Fmmm and tetragonal I4/mmm Space Groups.
| sample | parameters | Fmmm | I4/mmm |
|---|---|---|---|
| La2NiO4 | a (Å) | 5.4579(2) | 3.86119(4) |
| b (Å) | 5.4631(2) | 3.86119(4) | |
| c (Å) | 12.6874(2) | 12.6876(2) | |
| V (Å3) | 378.30(2) | 189.16(1) | |
| orthorhombicity δ × 10–4 | 4.8 | 0 | |
| Rwp | 3.9 | 4.8 | |
| Rp | 2.9 | 3.5 | |
| RB | 3.1 | 3.9 | |
| La2Ni0.9Cu0.1O4 | a (Å) | 5.4555(3) | 3.85987(5) |
| b (Å) | 5.4619(3) | 3.85987(5) | |
| c (Å) | 12.7339(3) | 12.7339(3) | |
| V (Å3) | 379.44(3) | 189.72(1) | |
| orthorhombicity δ × 10–4 | 5.9 | 0 | |
| Rwp | 2.4 | 2.8 | |
| Rp | 2.0 | 2.2 | |
| RB | 1.7 | 2.1 | |
| La2Ni0.8Cu0.2O4 | a (Å) | 5.4463(2) | 3.8535(1) |
| b (Å) | 5.4531(2) | 3.8535(1) | |
| c (Å) | 12.7768(4) | 12.7768(3) | |
| V (Å3) | 379.45(3) | 189.73(1) | |
| orthorhombicity δ × 10–4 | 6.2 | 0 | |
| Rwp | 2.7 | 3.1 | |
| Rp | 2.1 | 2.3 | |
| RB | 2.1 | 2.3 | |
| La1.8Ba0.2NiO4 | a (Å) | 5.4495(7) | 3.8540(2) |
| b (Å) | 5.4509(7) | 3.8540(2) | |
| c (Å) | 12.7977(5) | 12.7976(6) | |
| V (Å3) | 380.15(7) | 190.09(2) | |
| orthorhombicity δ × 10–4 | 1.3 | 0 | |
| Rwp | 3.9 | 3.4 | |
| Rp | 2.4 | 2.3 | |
| RB | 3.2 | 3.0 | |
| La1.8Ba0.2Ni0.9Cu0.1O4 | a (Å) | 5.4423(5) | 3.84885(8) |
| b (Å) | 5.4438(5) | 3.84885(8) | |
| c (Å) | 12.8398(3) | 12.8397(2) | |
| V (Å3) | 380.40(5) | 190.203(7) | |
| orthorhombicity δ × 10–4 | 1.4 | 0 | |
| Rwp | 4.2 | 3.8 | |
| Rp | 2.9 | 2.7 | |
| RB | 3.2 | 2.9 |
2.2. Catalytic Measurements in DRM
The performance of the catalysts with respect to DRM activity was tested in a home-built fixed-bed flow tubular quartz reactor (inner diameter = 7 mm, outer diameter = 9 mm, catalyst bed length: 2.5 cm). Catalyst powder (50 mg) was used for each reaction and uniformly distributed over the catalyst bed length using thoroughly degassed quartz wool. Each gas required for DRM (CH4:CO2:He = 1:1:3 ratio) was injected through a corresponding mass flow controller (MKS). Helium acts both as a carrier gas and as a heat conductor. Heating was performed by using a Linn High Term furnace up to 800 °C at a fixed rate of 10 °C min–1. The heating process was controlled by a S-type Pt/PtRh thermocouple placed in close vicinity to the sample. The output gas was continuously extracted through a capillary and analyzed by a quadrupole mass spectrometer mounted in cross-beam geometry (Balzers QMA 125). We especially emphasize here that because of the bifunctional operating mechanism of DRM catalysts, normalization of the catalytic activity solely to the surface area of the exsolved Ni particles would grossly overestimate the role of Ni and is therefore not considered (i.e., calculating metal surface-based turnover frequencies is not meaningful during in situ activation). Hence, a qualitative picture of the effect of the structure and composition of doped La2NiO4 catalyst precursors on the methane dry reforming reactivity is derived from temperature-programmed DRM experiments, focusing on onset temperatures of catalytic activity, conversion (%), and H2/CO product ratios. With respect to activity, the relative catalytic behavior is compared on the basis of conversion vs T plots.
2.3. Structural, Morphological, and Elemental Characterization
The specific surface area of all samples prior to catalysis was assessed by BET surface quantification via nitrogen adsorption in a QuadraSorb Station 4 apparatus (Quantachrome, U.S.A.). BET surface area was obtained from 5 point measurements recorded at 77 K after degassing the samples in vacuo for 10 h at 200 °C. As shown in Table S1, BET areas of the samples are varied between 2.2 and 4.5 m2 g–1.
Ex situ powder X-ray diffraction (PXRD) was carried out using a STOE stadi P powder diffractometer in transmission geometry and Mo Kα1 radiation (λ = 0.7093 Å). A focusing Ge(111) primary beam monochromator, as well as a linear position sensitive detector system was employed. Corresponding in situ synchtrotron-based PXRD experiments have been conducted in DRM mixtures at beamline 12.2.2, Advanced Light Source (ALS) at Berkeley National Laboratory. The diffraction patterns were measured in angle-dispersive transmission mode with a focused 25 keV monochromatic beam (λ = 0.4984 Å/30 μm spot size). The powders were heated in a 0.7 mm outer diameter quartz capillary under quasi flowing conditions (CH4:CO2:He = 1:1:3). The gases were injected through a 0.5 mm outer diameter tungsten tube. Heating was performed using a SiC furnace with an infrared light source up to 800 °C at a rate of 10 °C min–1. The patterns were recorded by a PerkinElmer flat panel detector (XRD 1621, dark image, and strain correction).41,42 Rietveld refinement was performed using the FULLPROF program.43 The profile function 7 (Thompson–Cox–Hastings pseudo-Voigt convoluted with axial divergence asymmetry function)44 was used in all refinements. The resolution function of the diffractometers was obtained from the structure refinement of a LaB6 standard. The weight fraction Wi of the ith phase in n mixture of crystalline phases is calculated by Rietveld refinement according to45
where Si is the refined scale factor of the phase, Zi is the number of formula units per unit cell, Mi is the molecular mass of the formula unit, Vi is the refined unit cell volume, and ti is the Brindley particle absorption contrast factor.46 The sum of the weight fractions is constrained to 100% by assuming that the samples contain negligible amounts of amorphous phases.
Structural and morphological characterization has been further performed by transmission electron microscopy (TEM) using two setups: TEM measurements were done using a FEI Tecnai F20 S-TWIN analytical high-resolution microscope operated at 200 kV and located at the USTEM, Vienna. For EDX experiments, a windowless Apollo XLTW silicon drift detector was employed with the elemental analysis based on the automated Cliff-Lorimer method.47 Aberration-corrected electron microscopy has been performed at the Ernst-Ruska Center for Microscopy and Spectroscopy with Electrons at FZ Jülich. Sample morphology, geometry, and electron diffraction patterns were additionally studied using a Tecnai G2 F20 microscope at 200 kV. Diffraction patterns were obtained with a camera length of 175 mm for all samples. A Gatan UltraScan 1000P (2k × 2k) charge-coupled digital (CCD) camera is used as a detector for TEM bright-field imaging. Additionally, a Gatan Tridiem 863P postcolumn image filter (GIF) is installed for electron energy loss spectroscopy (EELS). All aberration-corrected high-resolution transmission electron microscopy experiments were conducted using FEI Titan 80–300 TEM and STEM microscopes operated at 300 kV. Information limits (TEM) of below 90 pm at 300 kV48 and <200 pm (at 300 kV; STEM)49 are obtained.
X-ray absorption measurements were carried out with a novel self-developed wavelength-dispersive spectrometer in von Hámos geometry.50,51 The spectrometer is equipped with a microfocus X-ray tube, a curved Highly Annealed Pyrolytic Graphite mosaic crystal and a hybrid photon counting CMOS detector with 512 × 1030 pixel and a pixel size of 75 μm × 75 μm. The tube was operated with a high voltage of 16 kV and a current of 300 μA. As the Ni reference, a 2 μm Ni foil was used. All other references and samples were in powder form and prepared as wax-pellets (mixed with Hoechst Wax C), due to its lower concentration of Ni. The blending of the sample and reference sample with Hoechst Wax was necessary to achieve pellets with an adequate thickness for stability. After wax and sample material were stirred in a mortar to get a homogeneous mixture, a pellet with a 13 mm diameter was pressed by using a hydraulic pellet press with force up to 6 tons for not longer than 60 s. Since the samples were measured in transmission mode, the absorption spectrum is acquired by measuring once with and once without the sample. The measurement time for each sample varied from 8 h to 10 h depending on the thickness of the prepared sample. All references and samples were constantly moved during the measurements to minimize the effects of local thickness inhomogeneity. The beam size on the samples is around 3 mm × 3 mm. The gathered spectral range is covering the Ni K absorption edge at 8332 eV. Normalization of the spectra, as well as linear combination fitting (LCF), was done by using the XAS analyzing and processing software ATHENA which is part of the Demeter software package.52
Surface characterization was performed using X-ray photoelectron spectroscopy (XPS) on a Thermo Scientific MultiLab 2000 spectrometer, equipped with a monochromatic Al Kα X-ray source (E = 1486 eV) and an Alpha 110 hemispherical analyzer. The base pressure lies in 10–10 mbar range, and charging of the sample upon measurement is compensated by a flood gun supplying electrons with a kinetic energy of 6 eV. The used pass energy was 20 eV. High-resolution spectra in the relevant La 3d, Ni 2p, and Ni 3p regions have been collected and used for qualitative and quantitative analysis. The latter, with respect to Ni, has been exclusively performed using Ni 3p due to the strong overlap of the La 3d and Ni 2p peaks. After background subtraction using a Shirley-type function, deconvolution of the Ni 3p peak into Ni3+, Ni2+, and metallic Ni components was done, obeying the spin–orbit coupling of the individual Ni 3p1/2 and Ni 3p3/2 peaks for each relevant component.
3. Results and Discussion
3.1. Stability and Decomposition of Doped Perovskites in the DRM Mixture: Benchmark States before and after DRM
A short note on the naming of the catalysts is appropriate at this point: The formulas (e.g., La1.8Ba0.2NiO4), in essence, refer to the initial catalyst precursor materials. Although the active phases, formed by the controlled decomposition of the Ruddlesden–Popper structures, are only inadequately described by the above formulas, we will keep the respective naming for the sake of simplicity also for the decomposed materials. Figure 1A,B summarizes the joint ex situ PXRD structural characterization for all A- and B-side doped perovskites before the catalytic DRM run up to 800 °C. The perovskite La2NiO4 structure is clearly present for all Ruddlesden–Popper phases in the initial states. La2NiO4 can, in principle, crystallize either in tetragonal (space groups: I4/mmm and P42/ncm) or orthorhombic (space groups: Bmab and Fmmm) structures.53−55 Space groups discrimination is possible by the appreciation of an orthorhombic distortion leading to peak splitting or appearance of superstructure reflections exclusively allowed in the orthorhombic symmetry. If the orthorhombic distortion is very small (i.e., the difference between the a and b parameters is very small), anisotropic broadening can be observed in some XRD peaks instead of their splitting. Figure 1A,B reveals that all peaks in the XRD patterns can be indexed in the tetragonal structure (PDF card #00-076-0055), with small shifts of the (004) and (200) reflections to lower and higher 2θ angles, respectively, in the case of Cu and Ba doping. These shifts suggest an increase in the lattice parameter c, but a decrease in the a and b parameters of the tetragonal lattice. A close inspection of the XRD patterns reveals anisotropic broadening of reflections in some samples, which may be due to the orthorhombic symmetry of these materials. Therefore, we performed structural refinement of the five samples using the two reported structures (i.e., tetragonal I4/mmm and orthorhombic Fmmm). Comparing the convergence factors Rwp, Rp and RB (Table 1), obtained from structure refinement of the diffraction data, revealed that undoped La2NiO4 and exclusively Cu-doped La2NiO4 (e.g., La2Ni0.9Cu0.1O4 and La2Ni0.8Cu0.2O4) prefer to adapt an orthorhombic structure (Fmmm), while Ba-doped La2NiO4 (e.g., La1.8Ba0.2NiO4 and La1.8Ba0.2Ni0.9Cu0.1O4) exhibit a tetragonal structure (I4/mmm). The results are corroborated by the very low orthorhombicity factor δ [i.e., δ = (a – b)/(a + b), with a and b representing in-plane orthorhombic lattice parameters] of Ba-doped La2NiO4 samples (δ ≤ 1.4 × 10⁻⁴), suggesting a higher symmetry, for example, of a tetragonal lattice type. These results are consistent with previous works reporting that undoped La2NiO4 and La2Ni1–xCuxO4 (x < 0.2) perovskites exhibit an orthorhombic lattice (Fmmm), while La2–xBaxNiO4 (x ≤ 1.0) crystallize in the tetragonal I4/mmm structure.54−57 Very small amounts (less than 1 wt.%) of hexagonal La2O3 and La(OH)3 phases were detected in all initial samples. In situ PXRD experiments showed that the La(OH)3 phase transforms first to LaOOH (PDF card #00-077-2349) and subsequently to La2O3 before the decomposition of the perovskite starts. La2O3 remains stable during the DRM run and before the final breakdown of the perovskite structure. As confirmed in Table 1, slight deviations in the lattice parameters of the doped samples from the parent La2NiO4 structure suggest the successful introduction of Ni and Ba ions in the perovskite lattice. Tang et al.57 showed that substitution of larger Ba2+ for smaller La3+ [r (Ba2+) = 1.47 Å, r (La3+) = 1.216 Å; all cations are 9-fold coordinated]57 into the perovskite lattice leads to an increase in the c parameter. On the contrary, a decrease in the a parameter could be observed because of the partial oxidation of larger Ni2+ to smaller Ni3+ ions [r (Ni2+) = 0.69 Å, r (Ni3+) = 0.6 Å and 0.56 Å for high and low spin, respectively. All cations are 6-fold coordinated]58 to compensate the charge difference resulting from Ba2+ substitution. The presence of Ni3+ in the doped samples is confirmed by XANES and XPS characterizations, as discussed in section 3.3. The substitution of Ni2+ by Cu2+ increases the length of the apical bonds of the [(Ni/Cu)O6] octahedra along the c-axis to exceed the equatorial ones along the ab direction due to the Jahn–Teller effect of Cu2+ with an electronic configuration of d9.56 Therefore, the c parameter increases with Cu substitution, while the a and b parameters decrease.
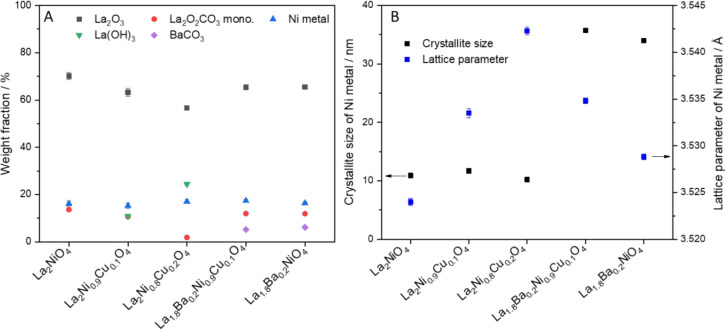
After the respective catalytic DRM (CO2:CH4:He = 1:1:3) runs in a total gas flow of 100 mL min–1 for 2 h (Figure 1C,D), clear signs of total decomposition of the Ruddlesden–Popper phase are visible. Phase mixtures of Ni metal (PDF card #00-004-0850), hexagonal La2O3 (PDF card #00-005-0602), monoclinic La2O2CO3 (PDF card #00-048-1113), La(OH)3 (PDF card #00-036-1481), and BaCO3 (PDF card #00-78-2057) (for the A-site doped samples) are a common structural leading theme for all studied samples. A more detailed analysis of the phase composition results in the lattice parameter and Ni crystallite size obtained from Rietveld refinement of the diffraction data (Figure 2). Whereas the phase composition, as judged by the weight fraction of the participating structures, appears more or less unaltered (with the exception of La(OH)3 formation for the B-site doped perovskites and the presence of BaCO3 for the A-site doped ones), pronounced differences appear in the lattice parameter upon introduction of Cu into the B site and the resulting Ni crystallite size difference between the A-site doped and the corresponding undoped or B-site doped samples. As expected, the lattice parameter of Ni increases slightly upon the introduction of Cu due to the formation of Ni–Cu alloy. The compositions of the formed Ni–Cu alloy, which are determined from the lattice parameter according to Vegard’s law,59 are Ni0.89Cu0.11, Ni0.80Cu0.20, and Ni0.88Cu0.12 for La2Ni0.9Cu0.1O4, La2Ni0.8Cu0.2O4, and La1.8Ba0.2Ni0.9Cu0.1O4, respectively. These are in good agreement with the Ni/Cu ratios used in the synthesis of the perovskites. Whereas the introduction of Cu has no apparent effect on the Ni metal crystallite size, adding Ba to the A site increases the Ni crystallite size by a factor of at least 3, from around 10 nm to more than 30 nm. Qualitatively, the patterns before subjecting the samples to DRM and the Ni crystallite sizes of pure and B-site substituted La2NiO4 after the DRM run resemble those reported in literature.19,25 The comparison after the catalytic DRM run is less straightforward because literature usually reports structures after a prereduction step and subsequent DRM treatment at temperatures T ≥ 700 °C. After prereduction, usually a mixture of metallic Ni and La2O3 results, which then transforms to metallic Ni and hexagonal/monoclinic La2O2CO3 after prolonged DRM treatments at reaction times t > 5 h. Temperatures below T = 750 °C cause only partial decomposition of La2NiO4.18 This might explain the difference to the data shown in Figure 1, which correspond to treatments after 2 h.
Figure 2.
Weight fractions (Panel A), crystallite size and lattice parameters of the exsolved metallic Ni particles (Panel B) extracted from Rietveld refinement of the ex situ PXRD patterns of the five spent doped La2NiO4 Ruddlesden–Popper materials after one DRM cycle (CO2:CH4:He = 1:1:3) in a total gas flow of 100 mL min–1 up to 800 °C for a total time of 2 h.
As for the structural trends apart from Ni crystallite size and the lattice parameter, we note that with increasing the amount of Cu, the final oxy-carbonate amount decreases, and the amount of La(OH)3 increases. We might anticipate interfacial stabilization of the (oxy)carbonate species by Ni and, vice versa, stabilization of La(OH)3 through Cu at the (inter)metallic surface. This is at least in part backed up by the in situ XRD experiments, which show a very low amount of (oxy)carbonate species after catalysis for La2Ni0.8Cu0.2O4.
In Figure 3 and Figures S1–S5, the complementary ex situ TEM analysis of three representative samples is shown (Figure 3 - La2Ni0.9Cu0.1O4, Figure S1 - La1.8Ba0.2NiO4 and Figure S2 - La1.8Ba0.2Ni0.9Cu0.1O4, Figure S3 - overview images, Figure S4 - SAED patterns, Figure S5 - Fast Fourier Transform (FFT)-filtered HRTEM image of La2Ni0.9Cu0.1O4 and La1.8Ba0.2Ni0.9Cu0.1O4 in the initial state). The common feature of all catalysts is the more or less uniform elemental distribution of all constituting elements without agglomeration of species and the corroboration of the successful synthesis of the structures in the initial state (some inhomogeneity is present for Ba, cf. Figures S1 and S2). Taking La2Ni0.9Cu0.1O4 as one representative example (Figure 3), the oxide grain size is found between 500 nm and 2 μm (as derived from Figure S3). In the spent catalyst after one DRM cycle at 800 °C for 2 h (Figure 3, lower panel), oxygen and lanthanum are still uniformly distributed, in contrast to Ni and Cu. The latter directly confirms the decomposition of the Ruddlesden–Popper structure and the exsolution of Ni and the formation of small Ni (or Ni/Cu in the case of B-site doped phases) particles after one catalytic DRM cycle. Most of the Ni particles are found at typical diameters between 10 nm and 30 nm, and due to the match of the Ni–K and Cu–K intensities, the formation of a Ni–Cu alloy phase is likely. Some agglomerated Ni(Cu) particles are also shown. The Ni particle sizes of B-site substituted La2NiO4 after the DRM run agrees with those reported in literature.25
Figure 3.
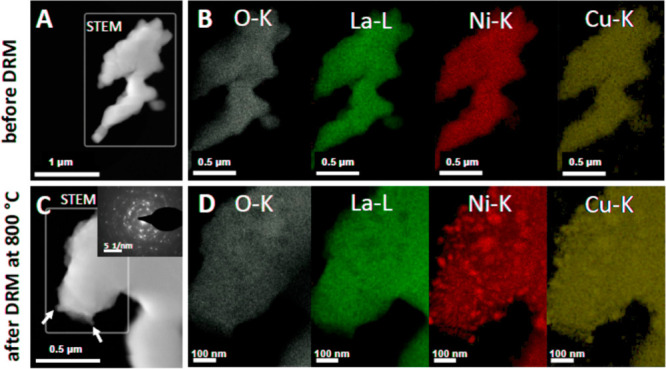
Electron microscopy analysis of La2Ni0.9Cu0.1O4 in the initial and spent state after one DRM cycle (CO2:CH4:He = 1:1:3) in a total gas flow of 100 mL min–1 up to 800 °C for a total time of 2 h. Panels A and C: HAADF images, Panels B and D: EDX analysis of the O–K, La-L, Cu–K, and Ni–K intensities. Some exsolved Ni particles are marked by arrows in Panel C.
In parallel to the decomposition, the formation of hexagonal La2O3, as well as hexagonal La2O2CO3 and monoclinic La2O2CO3, is also prevalent. HRTEM analysis corroborates the PXRD results on a local scale and confirms a mixture of Ni/NiCu alloy phases, hexagonal La2O3, and monoclinic (and locally also hexagonal) La2O2CO3. To discriminate between different phases, representative lattice fringes have been Fourier-filtered and accordingly color-coded in Figure 4A,B
Figure 4.
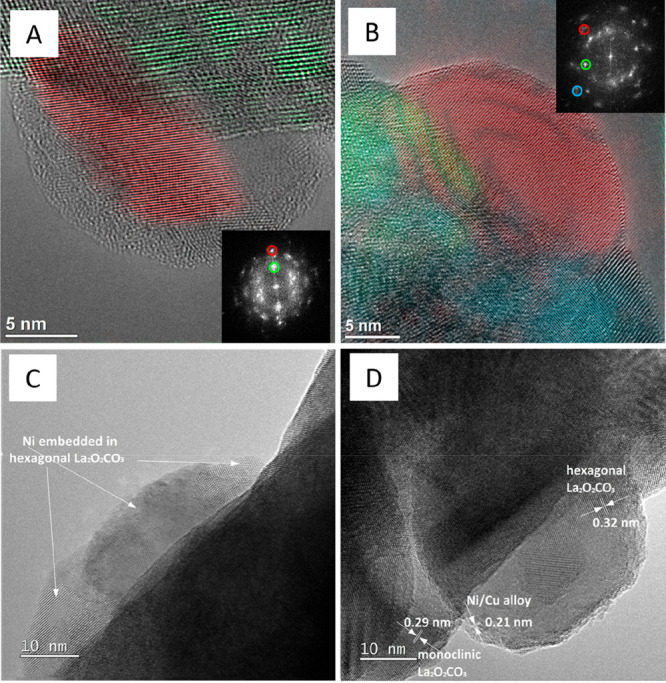
Aberration-corrected high-resolution electron microscopy images of La2Ni0.9Cu0.1O4 (Panel A and C) and La1.8Ba0.2Ni0.9Cu0.1O4 (Panel B and D) in the spent state after one DRM cycle (CO2:CH4:He = 1:1:3) in a total gas flow of 100 mL min–1 at 800 °C for 2 h. Representative lattice fringes of relevant individual structures and phases have been color-coded. Color codes: Panel A – red: NiCu (200), green: hexagonal La2O2CO3 (002); Panel B – red: NiCu (111), green: hexagonal La2O2CO3 (202), blue: hexagonal La2O3 (011). The respective FFT patterns used for color-coding are shown as insets. The lattice fringes in Panels C and D correspond to hexagonal La2O2CO3 (102), NiCu (111), and monoclinic La2O2CO3 (023).
A particularly important question, especially for prospective DRM catalysts is connected to the coking resistance. The latter has been reported to be especially improved for Cu-doped Ni-containing perovskite materials.60 As discussed above, we suspect alloy formation between Cu and Ni based on ex situ XRD measurements and their stoichiometry has been determined from the lattice parameter using Vegard’s law, also confirmed by HRTEM and EDX analysis. Figure 5, for La2Ni0.9Cu0.1O4 and La1.8Ba0.2Ni0.9Cu0.1O4, reveal that B-site doping with Cu (irrespective of eventual A-site doping with Ba) always causes the formation of Ni–Cu particles with an approximate nominal composition between Ni7Cu (La2Ni0.9Cu0.1O4, Figure 5B) and Ni9Cu (La1.8Ba0.2Ni0.9Cu0.1O4, right and left particle in Figure 5D,F) as evidenced by locally resolved EDX mapping. Hence, very Ni-rich alloys are encountered almost in the same nominal overall bulk composition as after synthesis. In the remaining parent Ruddlesden–Popper phase (right area in Figure 5B), the nominal composition between Cu and Ni is almost 1:1, corroborating the drastic local loss of Ni by exsolution. Although the according data is not provided in the literature, estimations from XRD shifts for similar compositions indicate alloys with a nominal Ni:Cu composition of <1:1.25Table 2 summarizes the full quantitative analysis by EDX of representative samples. In essence, the composition of all catalysts before and after the catalytic DRM runs remains constant.
Figure 5.
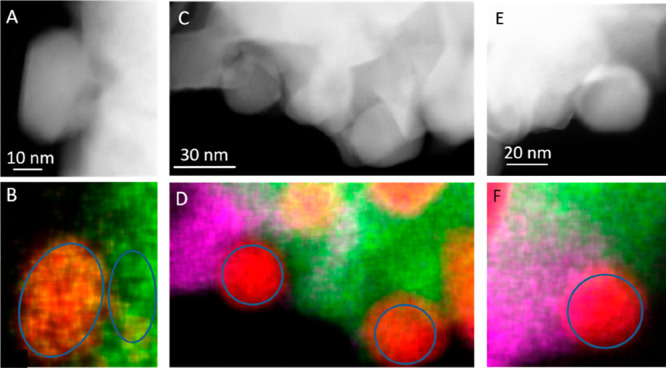
Panel A and B: HAADF image and EDX analysis of spent La2Ni0.9Cu0.1O4 (Ni–K (red), Cu–K (yellow), and La-L (green) after one DRM cycle (CO2:CH4:He = 1:1:3) in a total gas flow of 100 mL min–1 up to 800 °C for a total time of 2 h. Panels C/D and E/F show HAADF images and EDX maps of different spots on spent La1.8Ba0.2Ni0.9Cu0.1O4. (Ni–K (red), Cu–K (yellow), La–L (green), and Ba–L (magenta)). The areas that have been used for quantitative analysis are encircled.
Table 2. Full Quantitative EDX Analysis of La2NiO4, La2Ni0.9Cu0.1O4, and La1.8Ba0.2Ni0.9Cu0.1O4 in the Initial and Spent Catalyst Statea.
| DRM | sample | La-L at.-% | Ni–K at.-% | O–K at.-% | Cu–K at.-% | Ba-L at.-% | total at.-% |
|---|---|---|---|---|---|---|---|
| before | LaNiO3 | 17.87 ± 1.61 | 15.61 ± 2.82 | 66.51 ± 3.21 | - | - | 100 |
| after | LaNiO3 | 23.31 ± 3.41 | 18.42 ± 3.83 | 58.26 ± 6.33 | - | - | 100 |
| before | La2NiO4 | 30.09 ± 4.73 | 15.16 ± 2.76 | 54.74 ± 7.29 | - | - | 100 |
| after | La2NiO4 | 21.64 ± 3.18 | 11.59 ± 2.23 | 66.75 ± 5.27 | - | - | 100 |
| before | La2Ni0.9Cu0.1O4 | 27.36 ± 2.07 | 14.42 ± 4.49 | 56.63 ± 5.13 | 1.57 ± 1.26 | - | 100 |
| after | La2Ni0.9Cu0.1O4 | 21.84 ± 2.19 | 10.7 ± 1.42 | 65.26 ± 3.56 | 2.19 ± 0.43 | - | 100 |
| before | La1.8Ba0.2Ni0.9Cu0.1O4 | 24.66 ± 3.25 | 12.07 ± 2.53 | 60.6 ± 4.29 | 2.66 ± 0.66 | 0b | 100 |
| after | La1.8Ba0.2Ni0.9Cu0.1O4 | 23.34 ± 4.02 | 12.47 ± 2.48 | 62.36 ± 6.67 | 1.80 ± 0.30 | 0b | 100 |
For the sake of comparability, the EDX data of the archetypical LaNiO3 system is also shown.
Ba could not be quantified directly using this method due to the strong overlap of the Ba-L edge with that of La-L. This means that La-L is slightly overestimated, but still within the error margin of the method.
3.2. Dynamic Structural Response during DRM Monitored by In Situ Powder X-ray Diffraction
In this section, the structural and phase changes occurring during a catalytic DRM run are jointly discussed for all four relevant Ruddlesden–Popper precatalysts to correlate the changes to the catalytic patterns discussed in section 3.3 but also to the ex situ-determined states after the factual DRM run. As the benchmark states before and after the DRM run have been already highlighted in section 3.1, the goal in this section is to characterize the dynamic structural response of the materials to the DRM mixture in the temperature range between 25 °C and 800 °C and also upon an isothermal treatment to mimick the catalytic experiments as closely as possible. The discussion and analysis will be split in a qualitative and quantitative part for each sample. For the summarized sample composition in the initial and the spent catalyst state, we generally refer to Table 3. As representative examples, we show the full analysis for La2Ni0.8Cu0.2O4 and the simultaneously A- and B-site substituted La1.8Ba0.2Ni0.9Cu0.1O4 phase in the main manuscript. For all other samples, including the undoped La2NiO4 material, the qualitative and quantitative analysis is highlighted in the Supporting Information Figures S6–S10.
Table 3. Summary of Weight Fractions Extracted from PXRD Patterns by Rietveld Refinement for All Initial Samples, as well as for the Recovered Ones after the In Situ PXRD Experiments and after the DRM Treatment.
| sample/weight fraction (%) | LaNi2O4 | La2O3 | La(OH)3 | La2O2CO3 hex. | La2O2CO3 mono. | Ni metal | BaCO3 | |
|---|---|---|---|---|---|---|---|---|
| La2Ni0.9Cu0.1O4 | initial | 98.9(0.9) | 0.2(0.1) | 0.9(0.3) | - | - | - | - |
| recovered from in situ experiment | 99.2(0.8) | 0.2(0.2) | - | - | 0.6(0.2) | - | - | |
| recovered from DRM experiment | - | 63.2(1.6) | 10.8(0.8) | - | 10.7(1.0) | 15.3(1.2) | - | |
| La2Ni0.8Cu0.2O4 | initial | 98.6(0.8) | 0.5(0.2) | 0.9(0.2) | - | - | - | - |
| recovered from in situ experiment | - | 73.3(0.8) | - | 1.3(0.3) | 5.8(0.7) | 19.6(0.7) | - | |
| recovered from DRM experiment | - | 56.7(0.9) | 24.4(0.7) | - | 1.8(0.3) | 17.1(0.3) | - | |
| La1.8Ba0.2NiO4 | initial | 97.3(1.3) | 1.8(0.2) | 0.9(0.2) | - | - | - | - |
| recovered from in situ experiment | 97.7(1.4) | 0.9(0.2) | - | 0.7(0.2) | 0.5(0.2) | 0.2(0.1) | - | |
| recovered from DRM experiment | - | 65.6(0.9) | - | - | 11.9(0.6) | 16.4(0.6) | 6.1(0.4) | |
| La1.8Ba0.2Ni0.9Cu0.1O4 | initial | 98.6(0.6) | 0.8(0.1) | 0.6(0.1) | - | - | - | - |
| recovered from in situ experiment | - | 28.6(0.5) | - | 13.6(0.4) | 40.0(0.7) | 17.8(0.5) | - | |
| recovered from DRM experiment | - | 65.4(0.9) | - | - | 12.0(0.6) | 17.4(0.6) | 5.2(0.4) | |
One particular issue entangled with the effect of the structure and composition of doped La2NiO4 catalyst precursors on the methane dry reforming reactivity is the already well-known orthorhombic–tetragonal phase transformation for La2NiO4 occurring at around 150 °C and the loss of the interstitial oxygen from the tetragonal structure above 450 °C upon annealing.38,39,53 As the onset temperature of these two phase transformations has been suspected to be a function of the gas atmosphere,61 a dependence on the doping level is therefore likely, potentially also affecting the catalytic performance.
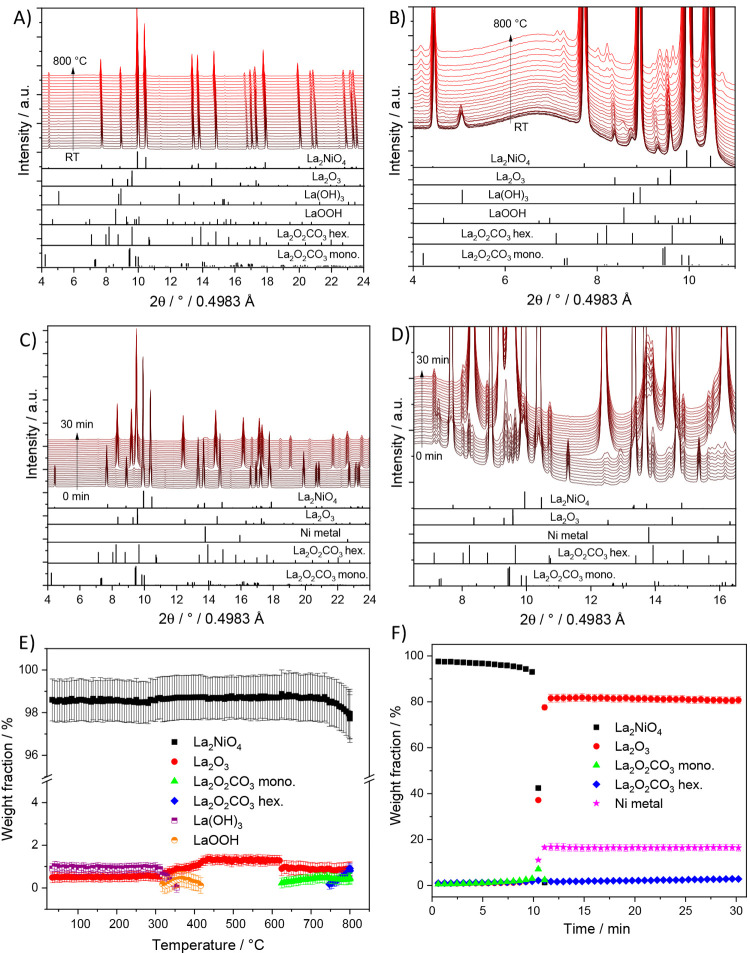
As shown in Figure 6, we observe several consecutive phase changes during heating La2Ni0.8Cu0.2O4 catalyst under DRM conditions. The minor La(OH)3 phase existing in the initial sample transforms first to the intermediate LaOOH phase at 320 °C and then both phases irreversibly transform into La2O3 before the decomposition of the perovskite starts. The monoclinic La2O2CO3 phase forms first at 625 °C due to the reaction between CO2 and La2O3 that is already present as a minor phase in the catalyst. The amount of monoclinic La2O2CO3 increases up to 750 °C to a maximum amount of ∼10 wt.%, above which intertransformation into hexagonal La2O2CO3 takes place (Figure 6C,D). In parallel, the parent La2Ni0.8Cu0.2O4 perovskite remains largely stable up to 750 °C before partial decomposition into La2O3, Ni, and a Ni–Cu alloy phase starts. After isothermal heating at 800 °C for 20 min, full decomposition of La2Ni0.8Cu0.2O4 into metallic Ni, a NiCu alloy phase, hexagonal La2O3, and minimal amounts of hexagonal and monoclinic La2O2CO3 takes place within a very short period of time. The recovered sample after in situ XRD is characterized by 73.7 wt.% hexagonal La2O3, but very little monoclinic (5.8 wt.%) and hexagonal (1.3 wt.%) La2O2CO3, as well as 19.6 wt.% metallic Ni. Compared with the ex situ structural state after the catalytic DRM experiment (ex situ final state composition in Figure 2, left panel), the amount of La2O3 is higher, and La(OH)3 is practically absent. The partial transformation of La2O3 to La(OH)3 in the ex situ sample might be at least partially caused by contact to ambient moisture,62 which was not the case for the in situ sample (analyzed directly after cooling under dry conditions). Otherwise, the phase composition is comparable. In summary, the carbonation in this Cu-doped sample is present, but yet not very pronounced.
Figure 6.
Panel A: In situ collected XRD patterns of La2Ni0.8Cu0.2O4 during heating up to 800 °C under DRM conditions. Panel C: In situ collected XRD patterns of La2Ni0.8Cu0.2O4 during holding at 800 °C for 30 min under DRM conditions. Panels B and D focus on a narrower 2θ windows for closer analysis. The lower panels indicate the phase assignment to the respective reference structures. Panel E and F: Weight fractions of different crystalline phases formed during DRM as a function of temperature (E) and time at 800 °C (F) obtained by Rietveld refinement of the in situ collected XRD patterns of La2Ni0.8Cu0.2O4.
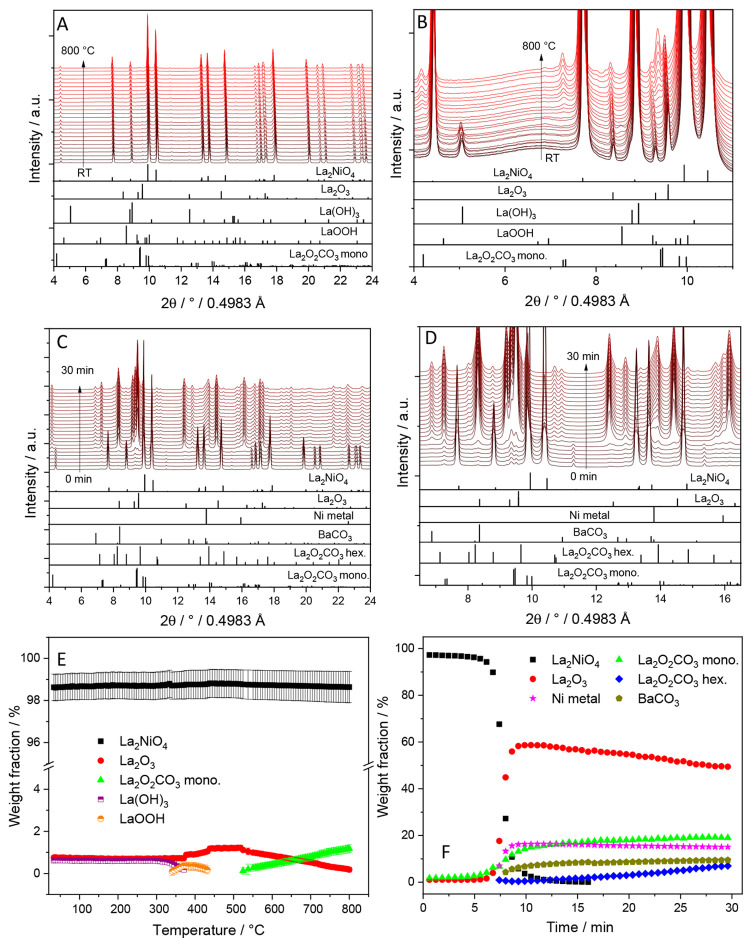
A similar course of phase decomposition has been observed on La1.8Ba0.2Ni0.9Cu0.1O4, although it exhibits a different starting structure (i.e., tetragonal). Obviously, the introduction of Ba stabilizes the tetragonal structure also at elevated temperatures. As shown in Figure 7, the overall course of decomposition, including the appearance of specific phases, is qualitatively comparable to La2Ni0.8Cu0.2O4, although the decomposition temperature of La1.8Ba0.2Ni0.9Cu0.1O4 is shifted to 800 °C. A higher decomposition temperature is likely to influence the nucleation- and growth kinetics of the exsolved Ni0 species toward larger and fewer nuclei, which can explain the observed larger Ni particle size. Another particular difference is the very efficient carbonation process, as judged by the phase composition of 10 wt.% monoclinic La2O2CO3 and 20 wt.% hexagonal La2O2CO3 in the recovered sample, the remainder being Ni metal (10 wt.%) and BaCO3 (10 wt.%). Thus, the carbonation process is very efficient in this case. Note that LaOOH and La(OH)3 again appear as intermediate phases upon heating, but decompose to hexagonal La2O3 well before catalytic DRM activity is observed. Thus, they appear of minor importance in determining the effects of structure and composition of doped La2NiO4 precursors on the DRM reactivity.
Figure 7.
Panel A: In situ collected XRD patterns of La1.8Ba0.2Ni0.9Cu0.1O4 during heating up to 800 °C under DRM conditions. Panel C: In situ collected XRD patterns of La1.8Ba0.2Ni0.9Cu0.1O4 during holding at 800 °C for 30 min under DRM conditions. Panels B and D focus on a narrower 2Θ windows for closer analysis. The lower panels indicate the phase assignment to the respective reference structures. Panel E and F: Weight fractions of different crystalline phases formed during DRM as a function of temperature (E) and time at 800 °C (F) obtained by Rietveld refinement of the in situ collected XRD patterns of La1.8Ba0.2Ni0.9Cu0.1O4.
The La1.8Ba0.2NiO4 material highlighted in Figure S6 is structurally stable over the entire temperature range. Minimal Ni exsolution starts at temperatures slightly below 800 °C and continues on a low level upon holding the temperature for 60 min at 800 °C (corresponding to ∼0.1 wt.%). In parallel, the formation of hexagonal La2O3 and both hexagonal and monoclinic La2O2CO3 is observed. Monoclinic La2O2CO3 starts to be formed around 500 °C, proceeding at a constant slow rate up to 800 °C, finally reaching about 0.8(0.2) wt.%. In the isothermal period at 800 °C, intertransformation of the two polymorphic forms of La2O2CO3 occurs, forming hexagonal La2O2CO3 directly from the associated monoclinic modification. The data suggest that this oxycarbonate formation directly arises from La2O3 present as a minor stray structure at the surface or at interfaces of the initial sample and that the La1.8Ba0.2NiO4 bulk structure is in essence stable. Compared with undoped La2NiO4, apparently, the introduction of Ba2+ effectively stabilizes the parent perovskite structure. In total, the amount of exsolved metallic Ni corresponds to ∼0.2 wt.% in the spent sample, suggesting an exsolution process limited to surface-near regions.
These observations are of more general interest for all catalysts, where decomposition into nanoparticles in contact with a specific oxide support is performed to generate the active phase. This particularly also refers to perovskite and perovskite-related materials that are specifically selected because of their structural metastability toward decomposition into the active phase. The outlined results indicate that apart from the inherent thermodynamical metastability, also the control of the exsolution kinetics plays a crucial role. As it is suspected that in particular Ni particles in contact with La2O2CO3 (as the regenerative active CO2-captivating species) are active species during DRM, we might infer that the especially the delicate antagonistic balance of doping with Ba2+ on the A-site (enhancing the basicity and eventually stabilizing the perovskite lattice toward decomposition) and doping with Cu2+ on the B-site (enhancing the reducibility of the structure and triggering the early exsolution of Ni, as well as the full decomposition of the parent La2NiO4 structure) appears as a key parameter in the controlled decomposition of La1.8Ba0.2Ni0.9Cu0.1O4.
To evaluate the extent of the Ni-oxide-(oxy)carbonate interface, Figure 8 details the evolution of the metallic Ni or NiCu crystallite size for two representative doped perovskite samples during the respective isothermal period. Being immediately obvious, B-site doping with Cu without Ba at the A-site results in much smaller Ni/NiCu crystallite sizes (around 5 nm at the end of the isothermal period), compared with those observed after treating La1.8Ba0.2Ni0.9Cu0.1O4 under similar experimental conditions. In that case, the Ni crystallite sizes appear almost doubled at around 10 nm. The differences to the Ni crystallite sizes obtained after DRM by ex situ analysis appear basically due to the different extent of the isothermal period (120 min vs 30 min for the in situ XRD experiments), although the qualitative trend is exactly the same. As a potential explanation for the catalytic results of the exclusively Ba-doped sample discussed below, we note that we have proven by in situ XRD that the Ba-containing sample exhibits around 0.2 wt.% Ni after exsolution compared with the Ba-free sample exhibiting around 20 wt.%. The Ni crystallite size of the Ba-free sample is also smaller but exhibits more metallic Ni. This is a two-factor improvement compared with the Ba-containing sample: more metallic Ni and a smaller Ni crystallite size (increasing the surface area) both contribute to an increased DRM activity. This finding is also confirmed by measuring the BET surface area of the catalysts before and after DRM. As shown in Table S1, the BET surface area of all catalysts are slightly increased after DRM (i.e., after the formation of metallic Ni), except for La1.8Ba0.2NiO4 catalyst showing a decrease in the BET surface area after decomposition.
Figure 8.
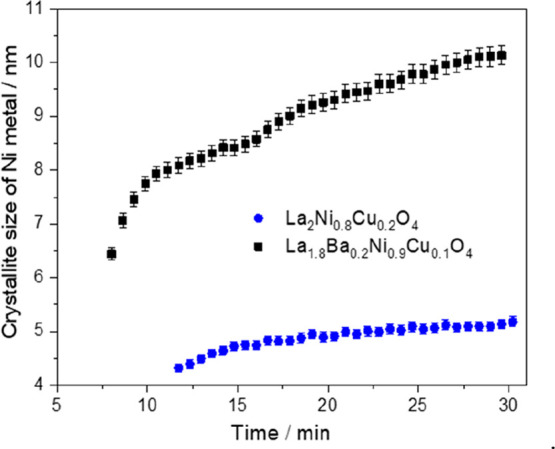
Crystallite size of Ni/NiCu metal formed during DRM at 800 °C as a function of time obtained by Rietveld refinement of the in situ collected XRD patterns of La2Ni0.8Cu0.2O4 and La1.8Ba0.2Ni0.9Cu0.1O4 samples.
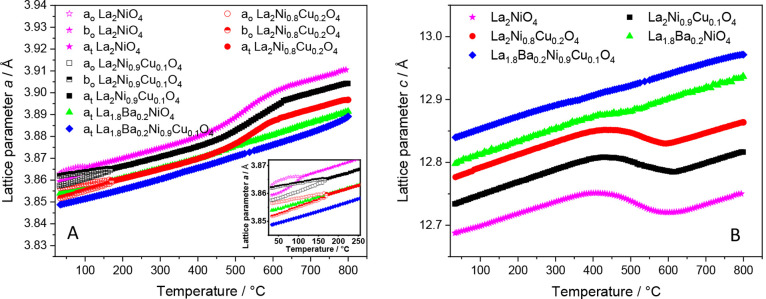
The tetragonal I4/mmm structure of our catalysts can be distinguished from the low-temperature orthorhombic Fmmm structure by the change in the broadening of some XRD peaks. In consequence, this change in peak broadening will cause a remarkable change in the cell parameters a and b at the transition temperature. Similarly, the loss of oxygen from interstitial sites or chemical expansion of the catalyst at high temperatures is evident from the evolution of the lattice parameters and the unit cell volume. Therefore, for a more detailed analysis, Figure 9 (and Figure S10) highlights a comparative assessment of the evolution of the cell parameters a, b, and c with temperature for the four catalyst samples as well as undoped La2NiO4. ao, bo, as well as at and bt refer to the lattice parameter of the orthorhombic and tetragonal structures, respectively, where at = bt, but ao ≠ bo.
Figure 9.
Evolution of the lattice parameters a and c of all doped La2NiO4 samples as a function of reaction temperature. ao, bo, as well as at and bt refer to the lattice parameter of the orthorhombic and tetragonal structures, respectively, where at = bt, but ao ≠ bo.
As discussed above, undoped La2NiO4 and Cu-doped La2NiO4 (e.g., La2Ni0.9Cu0.1O4 and La2Ni0.8Cu0.2O4) exhibit an orthorhombic Fmmm structure, while Ba-doped La2NiO4 (e.g., La1.8Ba0.2NiO4 and La1.8Ba0.2Ni0.9Cu0.1O4) adopt the tetragonal I4/mmm structure at room temperature. Upon heating, the cell parameters a and b of the orthorhombic La2NiO4, La2Ni0.9Cu0.1O4, and La2Ni0.8Cu0.2O4 materials (converted through a √2a arelationship to tetragonal cell) converge at 125 °C, 170 °C, and 175 °C, respectively, indicating the orthorhombic-to-tetragonal transformation. This result agrees with previous in situ neutron diffraction studies reported the irreversible orthorhombic-to-tetragonal transformation of undoped La2NiO4 at about 150 °C.53,55 Our experiments showed that introducing Cu in the B site to reach a nominal composition of La2Ni0.8Cu0.2O4 reveals that the orthorhombic-tetragonal transformation is inhibited up to 175 °C, inferring a hindering influence of a higher Cu amount on the onset of phase transformation. This might be explained by the increase in reducibility upon the introduction of larger amounts of Cu, thus supporting the formation of a tetragonal oxygen-depleted phases at higher temperatures. A similar situation prevails for a lower Cu content of La2Ni0.9Cu0.1O4. With a further increase in the temperature, there is a clear chemical expansion observed for pure and exclusive Cu-doped La2NiO4 in the temperature range of 450 °C–650 °C. This expansion is accompanied by a decrease in the c parameter and an increase in the a parameter, which can be explained by the loss of excess oxygen occupying the interstitial sites located in the La–O plane in the ab direction of the tetragonal lattice. The loss of these interstitial oxygen leads to a compression along the c direction and an expansion in the ab direction.54,55 In contrast, Ba doping reduces the chemical expansion due to the increase in the oxidation state of Ni from +2 to +3, as well as due to the reduction of the amount of interstitial oxygen in the initial tetragonal structure at room temperature. Although it appears as some sort of chemical expansion, we might link the observed expansion to the loss of interstitial oxygen from the tetragonal lattice, as the expansion is clearly absent for the Ba-doped samples that do not show the transformation. It is now confirmed, as it was earlier suspected for pure La2NiO4,52 that the decomposition of the doped La2NiO4 samples, in fact, is preceded by the orthorhombic-to-tetragonal transformation followed by another structural transformation because of the loss of interstitial oxygen from the tetragonal lattice, and the breakdown rather starts from the progressively oxygen-depleted tetragonal structure.
3.3. Influence of Doping on the Catalytic Behavior in DRM: Key Factors Steering the Reactivity
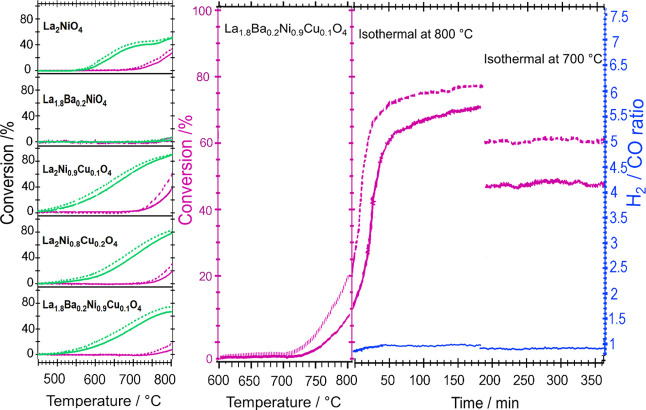
The catalytic profiles of all relevant samples, including undoped La2NiO4, are jointly summarized in Figure 10. For all samples, we have conducted two sequential DRM cycles up to 800 °C, including a cooling down phase to 25 °C before the second cycle. The two consecutive cycles have been conducted to follow the development of the catalytic activity during the decomposition of the Ruddlesden–Popper structure, as well as to assess the activity of the resulting metal-oxide system, which is formed after the completion of the first DRM cycle. All samples show at least some DRM activity, with A-site substituted La1.8Ba0.2NiO4 clearly exhibiting the worst behavior. For this particular sample, hardly any activity is observed even at the highest reaction temperatures, which is explained by the generally lower amount of exsolved Ni and the comparatively larger Ni crystallite size, alongside the particular stabilization by Ba. DRM activity of the undoped La2NiO4 material in the first cycle is observed at around 700 °C, and this onset temperature is shifted to somewhat higher temperatures for both the B-site doped La2Ni0.9Cu0.1O4 (720 °C) and La2Ni0.8Cu0.2O4 (740 °C) as well as the A-site and B-site doped La1.8Ba0.2Ni0.9Cu0.1O4 sample (740 °C). Conducting a second DRM cycle exclusively results in a significant lowering of the catalytic light-off temperatures by at least 100 °C, depending on the individual catalyst. Doping on the B site (even if Ba is simultaneously present at the A site) is thereby clearly beneficial as judged by the light-off temperatures of undoped La2NiO4. Qualitively, the catalytic profiles of the second cycles are comparable between La2Ni0.9Cu0.1O4, La2Ni0.8Cu0.2O4, and La1.8Ba0.2Ni0.9Cu0.1O4, although the exclusively B-site doped structures exhibit somewhat smaller light-off temperatures (450 °C vs 500 °C for La1.8Ba0.2Ni0.9Cu0.1O4).
Figure 10.
Methane dry reforming profiles (1st (magenta) and 2nd (green) cycle) on La1.8Ba0.2NiO4, La2Ni0.9Cu0.1O4 and La2Ni0.8Cu0.2O4, La1.8Ba0.2Ni0.9Cu0.1O4 and undoped La2NiO4 (all Panel A). Panel B: Heating up to 800 °C, followed by prolonged stability tests on La1.8Ba0.2Ni0.9Cu0.1O4 at 800 and 700 °C for 3 h each (left axis, magenta color), respectively, as well as the evolution of the H2/CO ratio (right axis, blue color). Heating was carried out in a 1:1 DRM mixture (CO2:CH4:He = 1:1:3) in a total gas flow of 100 mL min–1 and a heating ramp of 10 °C min–1 from room temperature to 800 °C. 50 mg of catalyst has been used for each experiment. The respective conversion of the educt gases is shown in the diagram: CO2 (broken lines) and CH4 (full lines).
For La1.8Ba0.2Ni0.9Cu0.1O4, we also conducted prolonged isothermal reactions at 800 °C (3 h) and subsequently, after lowering the temperature, also for 3 h at 700 °C. During the isothermal treatment at 800 °C, the catalyst is still self-activating. At 700 °C, the activity remains stable over the entire isothermal period (Figure 10B). The stable conversion of CO2 and CH4 over these isothermal periods points to the lack of formation of deactivating surface carbon and to the absence of substantial metal particle sintering. Surface carbon formation does not necessarily deactivate the catalyst and, for some systems, is a necessary intermediate of reaction.27,63 Previously shown in situ XRD data (cf. Figures 6, 7, and S6–S8) and microscopy data (Figures 3–5 and S1–S4) also support the claim of the absence of graphitic carbon formation under DRM conditions. Figure 8 shows a minor increase of the Ni crystallite size with time on stream for the La2Ni0.8Cu0.2O4 and La1.8Ba0.2Ni0.9Cu0.1O4 samples. The H2/CO ratios, monitored during the isothermal periods (Figure 10B, blue color, right axis) are close to unity at all reaction temperatures and reaction times. Two points are noteworthy: the comparatively discussed catalytic profiles of the respective first cycles indicate already that the pathway of decomposition of the differently doped materials is clearly different, corroborating the XRD results. The resulting active phase, in all cases, a Ni/La2O3/La2O2CO3 composite material with a more or less extended metal-oxide-(oxy)carbonate interface is, thus, formed differently. Second, once the active interface is established during the first runs, the second DRM cycles are comparable, with minor differences due to different doping on the A and/or B site–resulting from different Ni crystallite sizes and extents of the Ni/La2O3/La2O2CO3 interfaces (cf. Figure 8).
To gain more insights into the influence of structural chemistry and surface area of the catalysts on their catalytic behaviors, the four catalysts were characterized by XRD, XPS, BET, and XANES techniques before and after DRM experiments. Figure S11 shows ex situ collected PXRD patterns of the four Ruddlesden–Popper materials before and after a catalytic DRM (CO2:CH4:He = 1:1:3) runs in a total gas flow of 100 mL min–1 at different conditions. XRD results reveal that a slight decomposition of La2Ni0.8Cu0.2O4 and La1.8Ba0.2Ni0.9Cu0.1O4 into La2O3, metallic Ni, and monoclinic La2O2CO3 phases is observed upon heating the catalysts at 770 °C under DRM conditions. The full decomposition of the catalysts takes place after heating at 800 °C for 30 min, except for the La1.8Ba0.2NiO4 that is partially stable even after 90 min, which agrees with the results of in situ XRD experiments. Hexagonal La2O2CO3 is formed in all catalysts after prolonged DRM treatments at reaction times t > 1 h. These results confirm those of in situ XRD experiments that reveal the formation of active Ni/La2O3/La2O2CO3 materials at 800 °C under catalytic DRM conditions.
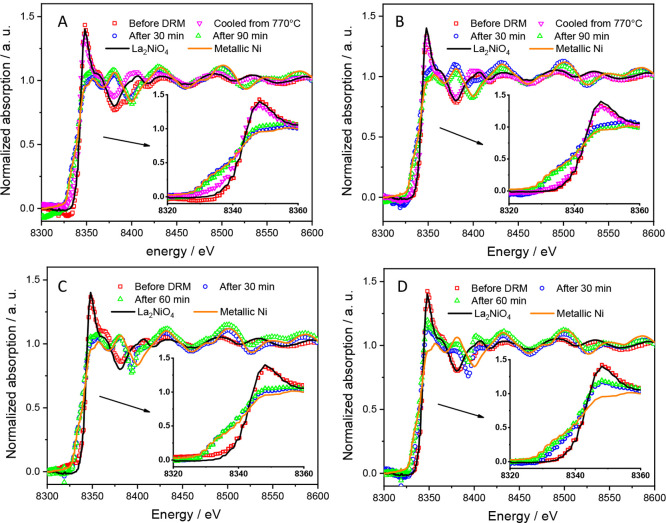
The chemical and oxidation state of Ni in the catalysts were further investigated by X-ray absorption characterizations. Figure S12 shows the normalized Ni K-edge X-ray absorption near-edge structure (XANES) of pure and doped La2NiO4 Ruddlesden–Popper materials as well as reference materials (NiO and LaNiO3). The characteristic features observed in the XANES spectra of all the materials are consistent with previous works.64 The relative shift in the position of the main adsorption edge, which is attributed to 1s → 3p transitions, gives information about the average oxidation state of transition elements because of the high sensitivity of outer p-orbitals to chemical changes.65,66 The K-edge position for pure and doped La2NiO4 samples locates between those of NiO and LaNiO3 standards, indicating the presence of both Ni2+ and Ni3+ cations in all La2NiO4 samples. These results can be explained by the accommodation of excess oxygen in the interstitial sites of La2NiO4 lattice and/or the charge compensation due to the Ba and Cu doping. As shown in Figure 11, the Ni K-edge shifts to lower energies upon heating the La2Ni0.8Cu0.2O4 and La1.8Ba0.2Ni0.9Cu0.1O4 catalysts at 770 °C under catalytic DRM conditions, suggesting the partial reduction of Ni3+/Ni2+ cations and formation of metallic Ni. As displayed in Figure S13, the linear combination fitting (LCF) of normalized Ni K-edge XANES spectra of La2Ni0.8Cu0.2O4 and La1.8Ba0.2Ni0.9Cu0.1O4 with those of reference materials confirm the exsolution of metallic Ni at 770 °C. The weight ratio Ni/La2NiO4 in La2Ni0.8Cu0.2O4 and La1.8Ba0.2Ni0.9Cu0.1O4 samples heated at 770 °C is found to be 0.25 and 0.15, respectively, indicating the suppression of perovskite decomposition by Ba doping. Moreover, the XANES spectra of La2Ni0.8Cu0.2O4, La2Ni0.9Cu0.1O4, and La1.8Ba0.2Ni0.9Cu0.1O4 samples heated at 800 °C for t ≥ 30 min can be fitted with that of metallic Ni reference, pointing out that the decomposition of the Ruddlesden–Popper materials is complete after 30 min under catalytic DRM conditions. In contrast, the decomposition of La1.8Ba0.2NiO4 materials is not complete by heating at 800 °C for 90 min as their XANES spectra can be fitted by combining the spectra of both Ni and La2NiO4 references. These are in good agreement with XRD results (Figure S11).
Figure 11.
Normalized Ni K-edge X-ray absorption near-edge structure (XANES) of La2Ni0.8Cu0.2O4 (A), La1.8Ba0.2Ni0.9Cu0.1O4 (B), La2Ni0.9Cu0.1O4 (C), and La1.8Ba0.2NiO4 (D) Ruddlesden–Popper materials before and after one catalytic DRM cycle in a total gas flow of 100 mL min–1 at different conditions. The spectra are compared with those of the reference materials (Ni and La2NiO4).
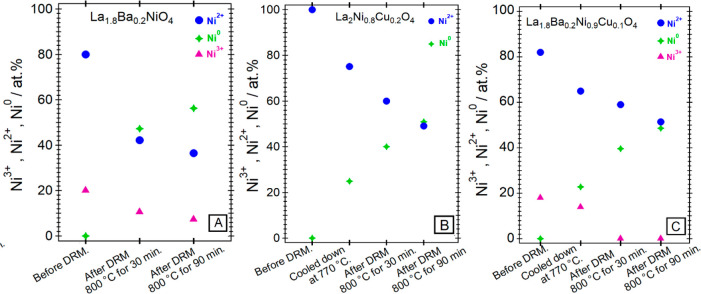
Figure 12 and Table 4 highlight the complementary surface chemical characterization by XPS. We have performed the XPS analysis for three representative catalysts, La2Ni0.8Cu0.2O4, La1.8Ba0.2Ni0.9Cu0.1O4 and La1.8Ba0.2NiO4 at selected spots on the DRM reaction axis to follow the individual chemical states of the constituting elements: before DRM, quenched at 770 °C during the onset of catalytic activity (cf. Figure 10), after 30 min at 800 °C and after 90 min at 800 °C. The XRD diffraction patterns of all states are shown in Figure S11, alongside the deconvoluted Ni 3p peaks in Figure S14. The quantification (in at.%) of different Ni species in the samples is shown in Table 4. Figure 12 highlights the evolution of the individual Ni species for La1.8Ba0.2Ni0.9Cu0.1O4, La2Ni0.8Cu0.2O4, and La1.8Ba0.2NiO4. For the former, both Ni3+ component (as expected from the Ba doping, corroborating the XANES analysis) and Ni2+ before the DRM reaction are clearly visible. A Ni0 component arises already after quenching at 770 °C, as expected from the onset of catalytic activity. Correspondingly, the oxidized Ni species decrease as a function of treatment. The presence of the Ni2+ species even after full decomposition of the parent Ruddlesden–Popper phase is due to the postoxidation of the exsolved Ni particles upon the transfer to the XPS spectrometer. As already indicated by both XANES and XRD analysis, A-site substituted La1.8Ba0.2NiO4 appears much more stable compared to the A/B-substituted and the exclusively B-site substituted structure, and accordingly, the amount of Ni3+ during the DRM treatment remains higher.
Figure 12.
Evolution of the individual Ni surface species as a function of DRM treatment. Panel A: La1.8Ba0.2NiO4, Panel B: La2Ni0.8Cu0.2O4, Panel C: La1.8Ba0.2Ni0.9Cu0.1O4. Analysis is based on the deconvolution profiles of Figure S14 and the values highlighted in Table 4.
Table 4. Full XPS Quantification in at.% of All Studied Catalysts after Selected DRM Treatments Based on the Deconvolution Profiles of Figure S14.
| La1.8Ba0.2NiO4 |
La2Ni0.8Cu0.2O4 |
La1.8Ba0.2Ni0.9Cu0.1O4 |
|||||||
|---|---|---|---|---|---|---|---|---|---|
| XPS fitting data (atom %) of Ni 3p region for catalysts | 3p 3/2 (Ni3+) | 3p 3/2 (Ni2+) | 3p 3/2 (Ni0) | 3p 3/2 (Ni3+) | 3p 3/2 (Ni2+) | 3p 3/2 (Ni0) | 3p 3/2 (Ni3+) | 3p 3/2 (Ni2+) | 3p 3/2 (Ni0) |
| before DRM | 19.99 | 80.01 | 0 | 0 | 100 | 0 | 18.03 | 81.97 | 0 |
| cooled down at 770 °C | - | - | - | 0 | 75.12 | 24.88 | 13.92 | 63.28 | 22.8 |
| after keeping at 800 °C for 30 min | 10.55 | 42.18 | 47.27 | 0 | 60 | 40 | 0 | 60.45 | 39.55 |
| after keeping at 800 °C for 90 min | 7.29 | 36.46 | 56.25 | 0 | 49.11 | 50.89 | 0 | 51.44 | 48.56 |
The exsolution of metallic Ni nanoparticles from doped La2NiO4 Ruddlesden–Popper materials can also be confirmed by BET surface area. As listed in Table S1, the BET surface area of La2Ni0.8Cu0.2O4, La2Ni0.9Cu0.1O4, and La1.8Ba0.2Ni0.9Cu0.1O4 samples increases after heating at 800 °C under catalytic DRM conditions for t ≥ 1 h due to the formation Ni nanoparticles on the surface of the catalyst. In contrast, BET surface area of La1.8Ba0.2NiO4 catalyst is slightly decreased because of the particle sintering and incomplete decomposition of the perovskite.
4. Conclusions
Exemplified for the La2NiO4 system, we have shown the complex interplay of different key parameters that govern the structural integrity and associated DRM activity of different A- and B-site doped Ruddlesden–Popper perovskite materials. Doping directly affects the phase transformation from orthorhombic-to-tetragonal La2NiO4: introduction of Ba to the A site effectively stabilizes the tetragonal structure from room temperature up to 800 °C. Undoped and Cu-doped samples show different extents of transformation to the tetragonal phase in the temperature region from 25 °C to 200 °C and markedly lowered decomposition temperatures toward Ni0. As a direct correlation to the observed Ni0 particle size after decomposition of the perovskite, A site doping with Ba also leads to much larger particles. We suggest that the nucleation- and growth kinetics of Ni0 are shifted toward these larger particles because of the elevated decomposition temperatures due to bulk structure stabilization by Ba. Naturally, this also directly affects the extent of the so-formed, supposedly DRM-active Ni–La2O3-(oxy)carbonate interface. The detailed sequence of transformation and decomposition steps as a function of temperature is a strong function of the catalyst precursor and, therefore, is directly linked to the surface, interface and bulk properties of the final catalyst.
Apart from the apparently different Ni particle size, the bulk structure composition of all in situ decomposed samples is similar, although with different weights in the composition mixture. In due course, the differences in catalytic activity between the undoped and differently doped La2NiO4 materials are also a strong function of doping. Exclusive A-site doping with Ba essentially suppresses catalytic activity due to two factors: a large Ni particle size (hence, a decreased extent of metal-oxide-(oxy)carbonate interface) and a generally lower amount of exsolved Ni. Potentially, also the formation of very stable Ba-related carbonate species is detrimental for a high activity. As can be derived from the TEM results, additional highly thermally stable BaCO3–Ni0 interfaces are generated, with most likely rather poor CO2-activation properties. Cu-doping, however, enhances the catalytic DRM activity at lower temperatures in comparison to undoped La2NiO4 by partial alloying with Ni while at the same time keeping the Ni(Cu) particle size small. The introduction of Cu apparently also allows overcoming the limitations of simple A-site doping with Ba by steering the carbonation tendency and distribution of reactive oxycarbonate species. Moreover, we suggest that the exsolved Cu-modified Ni0 particles feature a combination of reduced carbon solubility and modulation of the bond strength of reactive C-species. The resulting improved coking properties—due to suppressed graphene/graphite nucleation and growth—may be combined with enhanced reactivity of carbon atoms at the phase boundary, contributing to the observed superior catalytic properties.
Acknowledgments
S.P. acknowledges funding from the Austrian Science Fund (FWF) within the SFB project F4503–N16 “Functional Oxide Surfaces and Interfaces” and the DACH project I2877–N34. The work was performed within the framework of the research platform “Materials- and Nanoscience” and the special Ph.D. program “Reactivity and Catalysis” at the University of Innsbruck. The authors further thank the Advanced Light Source (which is supported by the Director, Office of Science, Office of Basic Energy Sciences, of the U.S. Department of Energy under Contract No. DE-AC02-05CH11231), where in situ XRD measurements were conducted at beamline 12.2.2 in the framework of the AP program ALS-08865. The authors would also like to thank Christina Eichenauer for nitrogen sorption measurements.
Supporting Information Available
The Supporting Information is available free of charge at https://pubs.acs.org/doi/10.1021/acscatal.0c04290.
Additional electron microscopy (TEM overview images, selected area electron diffraction patterns, aberration-corrected high-resolution images) and in situ X-ray diffraction measurements and data evaluation, BET and XPS analysis (PDF)
The authors declare no competing financial interest.
Supplementary Material
References
- Global Carbon Project of Future Earth. Surge in Methane Emissions Threatens Efforts To Slow Climate Change. See the following:https://phys.org/news/.
- Muraza O.; Galadima A. A Review On Coke Management During Dry Reforming Of Methane. Int. J. Energy Res. 2015, 39, 1196–1216. 10.1002/er.3295. [DOI] [Google Scholar]
- Usman M.; Wan Daud W. M. A.; Abbas H. F. Dry Reforming Of Methane: Influence Of Process Parameters - A Review. Renewable Sustainable Energy Rev. 2015, 45, 710–744. 10.1016/j.rser.2015.02.026. [DOI] [Google Scholar]
- Mondal K.; Sasmal S.; Badgandi S.; Chowdhury D. R.; Nair V. Dry Reforming Of Methane To Syngas: A Potential Alternative Process For Value Added Chemicals - A Techno-Economic Perspective. Environ. Sci. Pollut. Res. 2016, 23, 22267–22273. 10.1007/s11356-016-6310-4. [DOI] [PubMed] [Google Scholar]
- Er-Rbib H.; Bouallou C.; Werkoff F. Dry Reforming Of Methane-Review Of Feasibility Studies. Chem. Engin. Trans. 2012, 29, 163–168. 10.3303/CET1229028. [DOI] [Google Scholar]
- Edwards J. H.; Maitra A. M. The Chemistry Of Methane Reforming With Carbon Dioxide And Its Current And Potential Applications. Fuel Process. Technol. 1995, 42, 269–289. 10.1016/0378-3820(94)00105-3. [DOI] [Google Scholar]
- Dębek R.; Zubek K.; Motak M.; Da Costa P.; Grzybek T. Effect Of Nickel Incorporation Into Hydrotalcite-Based Catalyst Systems For Dry Reforming Of Methane. Res. Chem. Intermed. 2015, 41, 9485–9495. 10.1007/s11164-015-1973-x. [DOI] [Google Scholar]
- Al-Fatesh A. Suppression Of Carbon Formation In CH4 – CO2 Reforming By Addition Of Sr Into Bimetallic Ni–Co/γ-Al2O3 Catalyst. J. King Saud Univ. Eng. Sci. 2015, 27, 101–107. 10.1016/j.jksues.2013.09.006. [DOI] [Google Scholar]
- Ruckenstein E.; Hu Y. H. Carbon Dioxide Reforming of Methane Over Nickel/Alkaline Earth Metal Oxide Catalysts. Appl. Catal., A 1995, 133, 149–161. 10.1016/0926-860X(95)00201-4. [DOI] [Google Scholar]
- Hao Z.; Zhu Q.; Jiang Z.; Hou B.; Li H. Characterization Of Aerogel Ni/Al2O3 Catalysts And Investigation On Their Stability For CH4-CO2 Reforming In A Fluidized Bed. Fuel Process. Technol. 2009, 90, 113–121. 10.1016/j.fuproc.2008.08.004. [DOI] [Google Scholar]
- Lucredio A. F.; Assaf J. M.; Assaf E. M. Methane Conversion Reactions On Ni Catalysts Promoted With Rh: Influence of Support. Appl. Catal., A 2011, 400, 156–165. 10.1016/j.apcata.2011.04.035. [DOI] [Google Scholar]
- Gould T. D.; Montemore M. M.; Lubers A. M.; Ellis L. D.; Weimer A. W.; Falconer J. L.; Medlin J. W. Enhanced Dry Reforming Of Methane On Ni And Ni-Pt Catalysts Synthesized By Atomic Layer Deposition. Appl. Catal., A 2015, 492, 107–116. 10.1016/j.apcata.2014.11.037. [DOI] [Google Scholar]
- Kang K. M.; Kim H. W.; Shim Il.W.; Kwak H. Y. Catalytic Test Of Supported Ni Catalysts With Core/Shell Structure For Dry Reforming Of Methane. Fuel Process. Technol. 2011, 92, 1236–1243. 10.1016/j.fuproc.2011.02.007. [DOI] [Google Scholar]
- Crnivec I. G.; Djinovic P.; Erjavec B.; Pintar A. Effect Of Synthesis Parameter On Morphology And Activity Of Bimetallic Catalysts For CH4-CO2 Reforming. Chem. Eng. J. 2012, 207–208, 299–307. 10.1016/j.cej.2012.06.107. [DOI] [Google Scholar]
- Zhang X.; Lee C. S. M.; Michel D.; Mingos P.; Hayward D. O. Carbon Dioxide Reforming Of Methane With Pt Catalyst Using Microwave Electric Heating. Catal. Lett. 2003, 88, 129–139. 10.1023/A:1024049403422. [DOI] [Google Scholar]
- Nagaoka K.; Okamura M.; Aika K. I. Titania Supported Ruthenium As A Coking Resistant Catalyst For High Pressure Dry Reforming Of Methane. Catal. Commun. 2001, 2, 255–260. 10.1016/S1566-7367(01)00043-7. [DOI] [Google Scholar]
- Juan J. J.; Roman-Martınez M. C.; Illan-Gomez M. J. Nickel Catalyst Activation In The Carbon Dioxide Reforming Of Methane: Effect Of Pretreatments. Appl. Catal., A 2009, 355, 27–32. 10.1016/j.apcata.2008.10.058. [DOI] [Google Scholar]
- Batiot-Dupeyrat C.; Valderrama G.; Meneses A.; Martinez F.; Barrault J.; Tatibouët J. Pulse Study Of CO2 Reforming of Methane Over LaNiO3. Appl. Catal., A 2003, 248, 143–151. 10.1016/S0926-860X(03)00155-8. [DOI] [Google Scholar]
- Sierra Gallego G.; Mondragón F.; Tatibouët J.-M.; Barrault J.; Batiot-Dupeyrat C. Carbon Dioxide Reforming Of Methane Over La2NiO4 As Catalyst Precursor - Characterization Of Carbon Deposition. Catal. Today 2008, 133–135, 200–209. 10.1016/j.cattod.2007.12.075. [DOI] [Google Scholar]
- Wender I. Reactions Of Synthesis Gas. Fuel Process. Technol. 1996, 48, 189–297. 10.1016/S0378-3820(96)01048-X. [DOI] [Google Scholar]
- Jager B. Developments In Fischer–Tropsch Technology. Stud. Surf. Sci. Catal. 1997, 107, 219–224. 10.1016/S0167-2991(97)80338-2. [DOI] [Google Scholar]
- Kühl S.; Düdder H.; Girgsdies F.; Kähler K.; Muhler M.; Behrens M. Perovskites As Precursors For Ni/La2O3 Catalysts In The Dry Reforming Of Methane: Synthesis By Constant pH Co-Precipitation, Reduction Mechanism And Effect Of Ru-Doping. Z. Anorg. Allg. Chem. 2017, 643, 1088–1095. 10.1002/zaac.201700141. [DOI] [Google Scholar]
- Moradi G. R.; Khosravian F.; Rahmanzadeh M. Effects Of Partial Substitution Of Ni By Cu In LaNiO3 Perovskite Catalyst For Dry Methane Reforming. Chin. J. Catal. 2012, 33, 797–801. 10.1016/S1872-2067(11)60378-1. [DOI] [Google Scholar]
- Touahra F.; Rabahi A.; Chebout R.; Boudjemaa A.; Lerari D.; Sehailia M.; Halliche D.; Bachari K. Enhanced Catalytic Behaviour Of Surface Dispersed Nickel On LaCuO3 Perovskite In The Production Of Syngas: An Expedient Approach To Carbon Resistance During CO2 Reforming Of Methane. Int. J. Hydrogen Energy 2016, 41, 2477–2486. 10.1016/j.ijhydene.2015.12.062. [DOI] [Google Scholar]
- Wang M.; Zhao T.; Li M.; Wang H. Perovskite La2(NiCu)O4 Catalyst Precursors For Dry Reforming of Methane: Effects of Cu-Substitution On Carbon Resistance. RSC Adv. 2017, 7, 41847–41854. 10.1039/C7RA08422F. [DOI] [Google Scholar]
- Fidalgo B.; Menendez A. Carbon Materials as Catalysts for Decomposition and CO2 Reforming of Methane: A Review. Chin. J. Catal. 2011, 32, 207–216. 10.1016/S1872-2067(10)60166-0. [DOI] [Google Scholar]
- Gili A.; et al. Surface Carbon As A Reactive Intermediate In Dry Reforming Of Methane To Syngas On A 5% Ni/MnO Catalyst. ACS Catal. 2018, 8, 8739–8750. 10.1021/acscatal.8b01820. [DOI] [Google Scholar]
- Fierro J. Surface Properties Of LaNiO3: Kinetic Studies Of Reduction And Of Oxygen Adsorption. J. Catal. 1985, 93, 83–91. 10.1016/0021-9517(85)90153-8. [DOI] [Google Scholar]
- Sagar T. V.; Padmakar D.; Lingaiah N.; Rama Rao K. S.; Reddy I. A. K.; Sai Prasad P. S. Syngas Production By CO2 Reforming of Methane On LaNixAl1–xO3 Perovskite Catalysts: Influence Of Method Of Preparation. J. Chem. Sci. 2017, 129, 1787–1794. 10.1007/s12039-017-1359-2. [DOI] [Google Scholar]
- Royer S.; Duprez D.; Can F.; Courtois X.; Batiot-Dupeyrat C.; Laassiri S.; Alamdari H. Perovskites As Substitutes of Noble Metals for Heterogeneous Catalysis: Dream or Reality. Chem. Rev. 2014, 114, 10292–10368. 10.1021/cr500032a. [DOI] [PubMed] [Google Scholar]
- Bonmassar N.; Bekheet M.; Schlicker L.; Gili A.; Gurlo A.; Doran A.; Gao Y.; Heggen M.; Bernardi J.; Klötzer B.; Penner S. In Situ - Determined Catalytically Active State of LaNiO3 in Methane Dry Reforming. ACS Catal. 2020, 10, 1102–1112. 10.1021/acscatal.9b03687. [DOI] [Google Scholar]
- Köpfle N.; Götsch T.; Grünbacher M.; Carbonio E.; Hävecker M.; Knop-Gericke A.; Schlicker L.; Doran A.; Kober D.; Gurlo A.; Penner S.; Klötzer B. Zirconium-Assisted Activation of Palladium To Boost Syngas Production by Methane Dry Reforming. Angew. Chem., Int. Ed. 2018, 57, 14613–14618. 10.1002/anie.201807463. [DOI] [PMC free article] [PubMed] [Google Scholar]
- Yao Z.; Jiang J.; Zhao Y.; Luan F.; Zhu J.; Shi Y.; Gao H.; Wang H. Insights Into The Deactivation Mechanism Of Metal Carbide Catalysts For Dry Reforming Of Methane Via Comparison Of Nickel-Modified Molybdenum And Tungsten Carbides. RSC Adv. 2016, 6, 19944–19951. 10.1039/C5RA24815A. [DOI] [Google Scholar]
- Bakiz B.; Guinneton F.; Arab M.; Benlhachemi A.; Villain S.; Satre P.; Gavarri J.-R. Carbonatation And Decarbonatation Kinetics In The La2O3 - La2O2CO3 System Under CO2 Gas Flows. Adv. Mater. Sci. Eng. 2010, 2, 1–6. 10.1155/2010/360597. [DOI] [Google Scholar]
- Dama S.; Ghodke S. R.; Bobade R.; Gurav H. R.; Chilukuri S. Active And Durable Alkaline Earth Metal Substituted Perovskite Catalysts For Dry Reforming Of Methane. Appl. Catal., B 2018, 224, 146–158. 10.1016/j.apcatb.2017.10.048. [DOI] [Google Scholar]
- Moradi G. R.; Rahmanzadeh R. The Influence Of Partial Substitution Of Alkaline Earth With La In The LaNiO3 Perovskite Catalyst. Catal. Commun. 2012, 26, 169–172. 10.1016/j.catcom.2012.05.018. [DOI] [Google Scholar]
- Alvarez J.; Valderrama G.; Pietri E.; Pérez-Zurita M. J.; de Navarro C.; Sousa-Aguiar E. F.; Goldwasser M. R. Ni–Nb-Based Mixed Oxides Precursors For The Dry Reforming Of Methane. Top. Catal. 2011, 54, 170–178. 10.1007/s11244-011-9636-7. [DOI] [Google Scholar]
- Bekheet M. F.; Grünbacher M.; Schlicker L.; Gili A.; Doran A.; Epping J. D.; Gurlo A.; Klötzer B.; Penner S. On The Structural Stability Of Crystalline Ceria Phases In Undoped And Acceptor-Doped Ceria Materials Under In Situ Reduction Conditions. CrystEngComm 2019, 21, 145–154. 10.1039/C8CE01726C. [DOI] [PMC free article] [PubMed] [Google Scholar]
- Götsch T.; Schlicker L.; Bekheet M. F.; Doran A.; Grunbacher M.; Praty C.; Tada M.; Matsui H.; Ishiguro N.; Gurlo A.; Klotzer B.; Penner S. Structural Investigations Of La0.6Sr0.4FeO3-δ Under Reducing Conditions: Kinetic And Thermodynamic Limitations For Phase Transformations And Iron Exsolution Phenomena. RSC Adv. 2018, 8, 3120–3131. 10.1039/C7RA12309D. [DOI] [PMC free article] [PubMed] [Google Scholar]
- Pechini M.P.Method of preparing lead and alkaline earth titanates and niobates and coating method using the same to form a capacitor. US Patent No. 3,330,697, July 11, 1967.
- Doran A.; Schlicker L.; Beavers C. M.; Bhat S.; Bekheet M. F.; Gurlo A. Compact Low Power Infrared Tube Furnace For In Situ X-ray Powder Diffraction. Rev. Sci. Instrum. 2017, 88, 013903. 10.1063/1.4973561. [DOI] [PubMed] [Google Scholar]
- Schlicker L.; Doran A.; Schneppmüller P.; Gili A.; Czasny M.; Penner S.; Gurlo A. Transmission In Situ And Operando High Temperature X-ray Powder Diffraction In Variable Gaseous Environments. Rev. Sci. Instrum. 2018, 89, 033904. 10.1063/1.5001695. [DOI] [PubMed] [Google Scholar]
- Rodriguez-Carvajal J. Recent Developments Of The Program FULLPROF. Newsletter of the Commission for Powder Diffraction of the IUCr 2001, 26, 12–19. [Google Scholar]
- Finger L. W.; Cox D. E.; Jephcoat A. P. A Correction for Powder Diffraction Peak Asymmetry Due to Axial Divergence. J. Appl. Crystallogr. 1994, 27, 892–900. 10.1107/S0021889894004218. [DOI] [Google Scholar]
- Hill R. J.; Howard C. J. Quantitative Phase Analysis from Neutron Powder Diffraction Data Using the Rietveld Method. J. Appl. Crystallogr. 1987, 20, 467–476. 10.1107/S0021889887086199. [DOI] [Google Scholar]
- Brindley G. W. The Effect Of Grain Or Particle Size On X-Ray Reflections From Mixed Powders And Alloys, Considered In Relation To The Quantitative Determination Of Crystalline Substances By X-Ray Methods. Philos. Mag. 1945, 36, 347–369. 10.1080/14786444508520918. [DOI] [Google Scholar]
- Cliff G.; Lorimer G. W. The Quantitative Analysis Of Thin Specimens. J. Microsc. 1975, 103, 203–207. 10.1111/j.1365-2818.1975.tb03895.x. [DOI] [Google Scholar]
- Thust A.; Barthel J.; Tillmann K. FEI Titan 80–300 TEM. Journal of Large-Scale Facilities 2016, 2, A41. 10.17815/jlsrf-2-66. [DOI] [Google Scholar]
- Heggen M.; Luysberg M.; Tillmann K. FEI Titan 80–300 STEM. Journal of Large-Scale Facilities 2016, 2, A42. 10.17815/jlsrf-2-67. [DOI] [Google Scholar]
- Schlesiger C.; Anklamm L.; Stiel H.; Malzer W.; Kanngießer B. XAFS Spectroscopy By An X-Ray Tube Based Spectrometer Using A Novel Type Of HOPG Mosaic Crystal And Optimized Image Processing. J. Anal. At. Spectrom. 2015, 30, 1080–1085. 10.1039/C4JA00303A. [DOI] [Google Scholar]
- Schlesiger C.; Praetz S.; Gnewkow R.; Malzer W.; Kanngießer B. Recent Progress In The Performance Of HAPG Based Laboratory EXAFS And XANES Spectrometers. J. Anal. At. Spectrom. 2020, 35, 2298. 10.1039/D0JA00208A. [DOI] [Google Scholar]
- Ravel B.; Newville M. ATHENA, ARTEMIS, HEPHAESTUS: Data Analysis For X-Ray Absorption Spectroscopy Using IFEFFIT. J. Synchrotron Radiat. 2005, 12, 537–541. 10.1107/S0909049505012719. [DOI] [PubMed] [Google Scholar]
- Tamura H.; Hayashi A.; Ueda Y. Phase Diagram Of La2NiO4+δ (0≤ δ ≤ 0.18). Phys. C 1993, 216, 83–88. 10.1016/0921-4534(93)90636-5. [DOI] [Google Scholar]
- Skinner S. J. Characterisation Of La2NiO4+δ Using In-Situ High Temperature Neutron Powder Diffraction. Solid State Sci. 2003, 5 (3), 419–426. 10.1016/S1293-2558(03)00050-5. [DOI] [Google Scholar]
- Aguadero A.; Alonso J. A.; Martinez-Lope M. J.; Fernandez-Diaz M. T.; Escudero M. J.; Daza L. In Situ High Temperature Neutron Powder Diffraction Study Of Oxygen-Rich La2NiO4+δ In Air: Correlation With The Electrical Behaviour. J. Mater. Chem. 2006, 16, 3402–3408. 10.1039/B605886H. [DOI] [Google Scholar]
- Aguadero A.; Alonso J. A.; Escudero M. J.; Daza L. Evaluation Of The La2Ni1-xCuxO4+δ System As SOFC Cathode Material With 8YSZ. And LSGM As Electrolytes. Solid State Ionics 2008, 179, 393–400. 10.1016/j.ssi.2008.01.099. [DOI] [Google Scholar]
- Tang J. P.; Dass R. I.; Manthiram A. Comparison Of The Crystal Chemistry And Electrical Properties Of La(2-x)A(x)NiO(4) (A = Ca, Sr, and Ba). Mater. Res. Bull. 2000, 35, 411–424. 10.1016/S0025-5408(00)00234-8. [DOI] [Google Scholar]
- Shannon R. D. Revised Effective Ionic-Radii and Systematic Studies of Interatomic Distances in Halides and Chalcogenides. Acta Crystallogr., Sect. A: Cryst. Phys., Diffr., Theor. Gen. Crystallogr. 1976, 32, 751–767. 10.1107/S0567739476001551. [DOI] [Google Scholar]
- Vegard L. Die Konstitution Der Mischkristalle Und Die Raumfüllung Der Atome. Eur. Phys. J. A 1921, 5, 17–26. 10.1007/BF01349680. [DOI] [Google Scholar]
- Rameshan R.; Mayr L.; Klötzer B.; Eder D.; Knop-Gericke A.; Hävecker M.; Blume R.; Schlögl R.; Zemlyanov D. Y.; Penner S. Near-Ambient-Pressure X-ray Photoelectron Spectroscopy Study of Methane-Induced Carbon Deposition on Clean and Copper-Modified Polycrystalline Nickel Materials. J. Phys. Chem. C 2015, 119, 26948–26958. 10.1021/acs.jpcc.5b07317. [DOI] [PMC free article] [PubMed] [Google Scholar]
- Fernandez-Diaz M. T.; Martinez J. L.; Rodriguez-Carvajal J. High-Temperature Phase Transformation of Oxidized R2NiO4+δ (R = La, Pr, Nd) Under Vacuum. Solid State Ionics 1993, 63–65, 902–906. 10.1016/0167-2738(93)90213-M. [DOI] [Google Scholar]
- Fleming P.; Farrell R. A.; Holmes J. D.; Morris M. A. The Rapid Formation Of La(OH)3 From La2O3 Powders On Exposure To Water Vapor. J. Am. Ceram. Soc. 2010, 93, 1187–1194. 10.1111/j.1551-2916.2009.03564.x. [DOI] [Google Scholar]
- Wei J.; Iglesia E. Isotopic And Kinetic Assessment Of The Mechanism Of Reactions of CH4 With CO2 Or H2O To Form Synthesis Gas And Carbon On Nickel Catalysts. J. Catal. 2004, 224, 370–383. 10.1016/j.jcat.2004.02.032. [DOI] [Google Scholar]
- Woolley R. J.; Illy B. N.; Ryan M. P.; Skinner S. J. In Situ Determination Of The Nickel Oxidation State In La2NiO4+Δ And La4Ni3O10−Δ Using X-Ray Absorption Near-Edge Structure. J. Mater. Chem. 2011, 21, 18592–18596. 10.1039/c1jm14320d. [DOI] [Google Scholar]
- Bekheet M. F.; Dubrovinsky L.; Gurlo A. Compressibility And Structural Stability Of Spinel-Type Mnin2o4. J. Solid State Chem. 2015, 230, 301–308. 10.1016/j.jssc.2015.07.016. [DOI] [Google Scholar]
- Bekheet M. F.; Schlicker L.; Doran A.; Siemensmeyer K.; Gurlo A. Ferrimagnetism In Manganese-Rich Gallium And Aluminium Spinels Due To Mixed Valence Mn2+– Mn3+ States. Dalton Trans. 2018, 47, 2727–2738. 10.1039/C7DT04765G. [DOI] [PubMed] [Google Scholar]
Associated Data
This section collects any data citations, data availability statements, or supplementary materials included in this article.


