Abstract
15 years of Aqua CERES and MODIS observations are combined to derive nearly global maps of shortwave albedo (A) and flux (F) response to changes in cloud droplet number concentration (Nd). Absolute and relative albedo susceptibilities are computed seasonally by exploiting the linear relationship between A and ln(Nd) for shallow liquid clouds. Subtropical stratiform clouds (eastern Pacific, eastern Atlantic, and Australia) yield the highest Sr, followed by the extratropical oceans during their hemispheric summer. When Sr is cast in terms of F, the eastern Pacific clouds dominate Sr, with a secondary maximum offshore eastern Asia. Sa is mainly governed by Nd, with more pristine environments being more susceptible to change their albedo. While both Sa and Sr are advantageous for understanding radiative aspects of the aerosol indirect effect, Sr is more suitable for calculating changes in A and F due to the linear relationship between A and ln(Nd).
1. Introduction
The ability of aerosols to modify clouds by regulating their liquid droplet number concentration (Nd) is a central mechanism that would explain a Nd global increase since the preindustrial era (Boucher et al., 2013). It has been proposed that these aerosol-mediated changes in Nd can potentially impact the hydrological cycle through changes in the cloud lifespan, cloud thickness, and precipitation efficiency, among others (Lohmann and Feichter, 2005). From an energy budget point of view, the isolated effect of a Nd increase is the enhancement of the planetary albedo (Twomey, 1977). However, the magnitude of the intermingling effects of aerosols on clouds and the subsequent albedo enhancement, is a topic of considerable debate in the climate community not only because of the large spread across different climate models, but also due to the lack of consensus among observational studies (McComiskey and Feingold, 2008). While numerous studies have focused on quantifying the magnitude of the aerosol-cloud interactions, surprisingly few observational studies have aimed to estimate the radiative effect of changes in Nd.
One of the first attempts to compute regional radiative changes driven by variations in liquid cloud microphysics is described in Platnick and Twomey (1994) who coined the concept of albedo susceptibility (referred here as albedo absolute susceptibility) (Sa), which is expressed as , with A denoting the cloud albedo. By using the analytical two-stream approximation applied to satellite observations, and assuming a constant liquid water content, they estimated Sa over the northeast Pacific in the context of ship tracks emissions. Platnick and Oreopoulos (2008, PO08) improved the susceptibilities calculations by performing radiative transfer calculations, assuming a constant cloud liquid water content and fixed perturbations of Nd, which were related to cloud effective radius (re) and optical thickness (τ) via a vertically homogeneous cloud model. PO08 also extended the concept of susceptibility, by introducing the albedo relative susceptibility (Sr), that is, A changes relative to fractional changes in Nd, or . The method for computing Sa and Sr was applied in their follow-up work to the computation of global susceptibilities using four months of retrievals from the MOderate resolution Imaging Spectroradiometer (MODIS) (Oreopoulos and Platnick, 2008; OP08). Building upon OP08, Painemal and Minnis (2012, PM12) proposed an alternative method for computing Sr and Sa that consists of exploiting the relationship between the adiabatically-based MODIS Nd and the top of the atmosphere (TOA) A, with the latter derived from the Clouds and the Earth’s Radiant Energy Systems (CERES) sensor. The technique in PM12 is advantageous as CERES shortwave fluxes are not affected by the uncertainties that can severely bias radiative transfer calculations (Loeb et al., 2007). Moreover, the constant water content assumption needed for computing Sa and Sr in previous studies, rarely observed in nature, is replaced with a more physical adiabatic formulation.
In this contribution, I endeavor to compute global shortwave albedo and flux susceptibilities for liquid low clouds (< 3km), by taking advantage of 15 years of continuous CERES and MODIS measurements onboard the Aqua satellite. This work presents, for the first time, annual and seasonal Sa and Sr using Nd retrievals that have shown excellent agreement with in-situ and remotely-sensed observations in numerous studies (Grosvenor et al., 2018 and references therein), combined with the most accurate estimate of TOA shortwave fluxes.
2. Dataset and methods
Cloud and shortwave retrievals utilized in this study are taken from the Aqua CERES Single Scanner Footprint (SSF) product Edition 4 (~1:30 pm overpass). SSF TOA Shortwave fluxes and A from CERES are derived with the algorithms described in Loeb et al., 2005, and Su et al., 2015. MODIS cloud properties retrieved for CERES (CERES-MODIS, Minnis et al., 2011a), are retrieved at MODIS pixel resolution, then averaged to match the CERES footprint resolution (~ 20 km) and scanning pattern. CERES-MODIS cloud parameters utilized here include re, τ, temperature, pressure, height (Sun-Mack et al., 2014), and cloud fraction (CF). Only those liquid phase samples with cloud heights lower than 3 km and liquid water paths between 10-240 g m−2 are retained, with the last screening intended for reducing retrieval uncertainties in optically thin clouds and minimize the influence of convective systems. Additionally, only CERES footprints with CF > 0.95 (95%) are utilized, as a way to ameliorate the effect of clear-sky contamination and 3D radiative transfer effects near the cloud edges. Lastly, the analysis is limited to data with solar zenith angles less than 70°, given the potential retrieval biases at high solar zenith angles (e.g. Grosvenor and Wood, 2014). Next, low cloud CERES retrievals are averaged to a regular 1° grid when at least one overcast CERES footprint is contained within a 1° grid. Although the overall results are insensitive to more restrictive thresholds, this methodology has the advantage of increasing the number of valid samples relative to applying the threshold to 1° degree overcast scenes. Nd is estimated using the adiabatic formula described in Painemal and Zuidema (2011) as:
| (1) |
Where the adiabatic lapse rate Γ is computed as in Albrecht et al. (1990) using CERES-MODIS cloud temperature and pressure, and ρw is the liquid water density. k is a constant factor that relates volume radius to re and is assumed 0.8 over the ocean and 0.72 over land, following Martin et al. (1994). Although it is frequent to account for the cloud sub-adiabaticity by multiplying Γ by a constant fraction (<1.0, Bennartz, 1997), global values are unknown and the contribution of this additional parameter to the Nd error is modest relative to other factors (Bennartz, 2007). Figure 1 summarizes the rationale behind the methodology for computing Sr and Sa, described in PM12. The relationship between Nd and A over the northeast Pacific for three specific LWP bins (Fig. 1a) features a distinctive non-linear relationship which is well modeled by a logarithm function, as demonstrated in Fig 1b. Note the large spread of the A-Nd relationship when the data are unconstrained to LWP. It follows from Fig. 1b that albedo is a linear function of ln(Nd), which can be expressed as:
| (2) |
Figure 1:
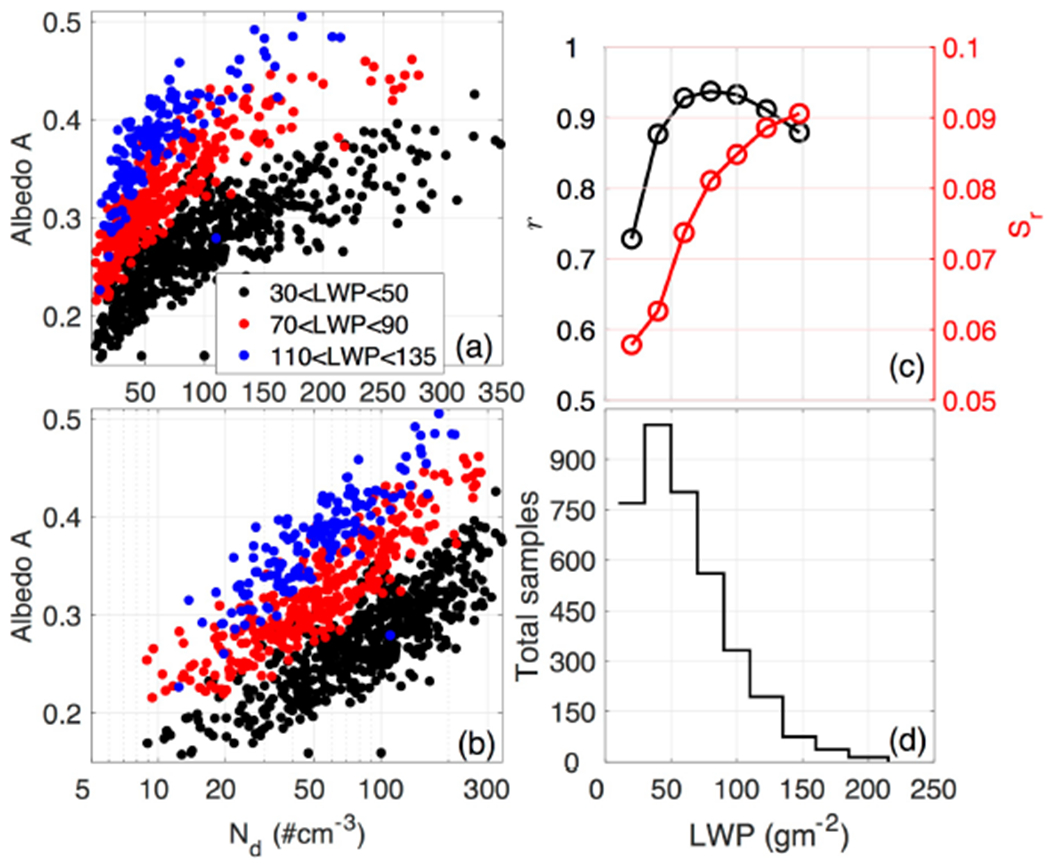
Example of the relationship between Nd and A in a) linear and b) semi-logarithmic scale for three LWP bins. c) linear correlation coefficient (black) and relative susceptibility (Sr, red line) for each LWP bin. d) number of samples contained in each LWP bin. The statistics are taken off the coast of California (127°W, 32°N) in NH summer.
The relationship is valid for specific LWP intervals, which is intended to isolate albedo changes attributed to Nd from LWP variability. Lastly, Sa and Sr can be estimated as:
| (3a) |
| (3b) |
Ten LWP bins are selected for the calculations, with a bin width of 20 g m−2 for LWP< 110 g m−2, 25 g m−2 for 110<LWP<185 g m−2, and 30 g m−2 for LWP> 185 g m−2. Consistency between the results presented here and those of PM12, who estimated Sr and Sa in three subtropical regions using a LWP bin width of 10 g m−2, show that the calculations are little sensitive to small changes in LWP bin widths.
For the specific example in Fig. 1a, the A-ln(Nd) linear correlation coefficients are greater than 0.7 (Fig. 1c, black), statistically significant values that support the derivation of Sr (Fig. 1c, red). The number of samples per bin is presented in Fig. 1d. Since the data screening reduce the number of samples over specific regions of the globe, I computed the temporal linear regressions over 2°x2° grids, a choice that should introduce a negligible error with respect to calculations performed over 1°x1° grids (Grandey and Stier, 2010). To reduce uncertainties in correlation and slopes estimates, Sr and Sa are only reported if the number of samples is greater than 50 (>12.5 usable days) and r>0.35. This guarantees that correlations are statistically significant at 99% or more according to a Student’s T test. Finally, Sr and Sa are seasonally estimated as the weighted average of the 10 LWP bins according to their frequency of occurrence per season. Similarly, the annual susceptibility is the weighted average of the four seasons, based on the seasonal number of available samples.
3. Results
3.1. Albedo susceptibilities as a function of LWP
Global A-ln(Nd) linear correlation coefficient maps for the 10 LWP bins (Fig. S1) feature values that typically exceed 0.65, except for regions over land in high latitudes where r<0.4. These low values suggest that the TOA albedo is strongly modulated by the surface albedo and little sensitive to cloud microphysics. The annual mean Sr and Sa for six specific LWP bins are presented, respectively, in Figs. 2a and b (maps for the 10 bins are included in Fig. S2 and S3). White areas correspond primarily to regions in which the number of samples was insufficient to perform the calculation. They mostly occur, as expected, over land and in the tropical ocean. In terms of Sr, this increases with LWP, with consistently high Sr over the eastern Pacific, Atlantic, and the Australian stratocumulus cloud regimes, and a sharp westward decrease. In addition, Sr peaks for LWP=110-135 g m−2 and remains constant or slightly decreases for higher LWP. This pattern is diagnosed by the two-stream Sr, as explained in section 4.
Figure 2:
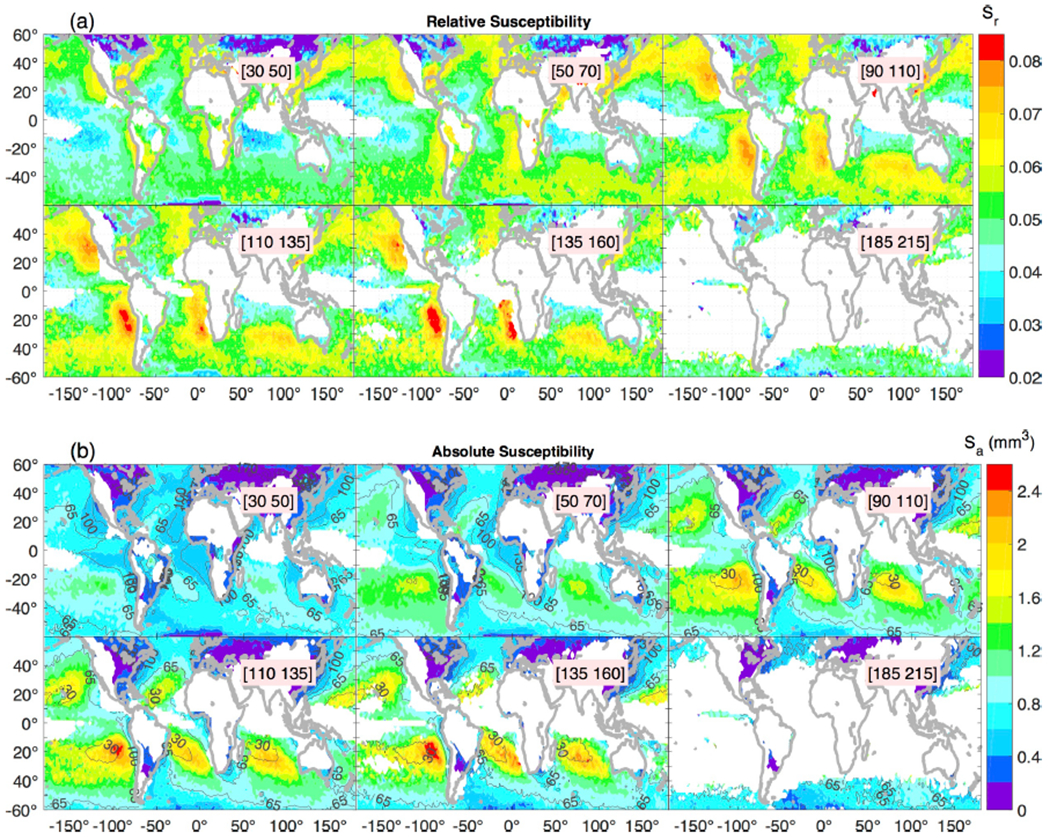
a) Seasonal average relative susceptibility estimated for 6 fixed LWP bins. b) As in a) but for absolute susceptibility. Contours in Fig. 2b denote Nd.
Similar to Sr, Sa increases with LWP (Fig. 2b), however the spatial structure is dissimilar, with a Sa peak over broad regions away from the continents, unlike Sr. While the Sa increase is partially explained by the Sr-LWP dependence (recall Sa = Sr/Nd), a systematic decrease in Nd with LWP (contours in Fig. 2a and Fig. S4) dictates the Sa pattern, in which minimum Nd gives rise to maximum Sa. In summary, the interpretation of Sa is more straightforward than Sr; polluted clouds less efficiently change their albedo compared to their more pristine counterparts, for the same absolute change in Nd (ΔNd).
3.2. Seasonal susceptibilities
Given the reduced seasonal occurrence of liquid clouds over land, the following analysis mainly focuses on oceanic clouds, where the statistics are robust. Seasonal Sr maps in Fig. 3a show that the eastern Pacific, SE Atlantic, and the oceanic region west of Australia are the most susceptible areas to change their albedo due to Nd fractional changes. The coastal area of northeast Asia, between 20°N- 40°N, is another region with high Sr from September to May. In addition, Sr features seasonal transitions with overall maximum in JJA especially over the southern Hemisphere (SH) subtropics, with a broad zonal extent in the extratropical Pacific, and maximum values near 0.075. A secondary region of interest is the extratropical band south of 40°S, which yields annual maximum during the SH summer (DJF). This feature is consistent with PO08 who showed that Sr increases with solar elevation. In terms of Sa, hemispheric seasonal maxima occur in their corresponding winter, with the SH yielding the highest global values (Fig. 2b). This trait is consistent with more pristine conditions in the SH, with vast areas featuring Nd less than 50 cm−3 (Bennartz and Rausch, 2017).
Figure 3:
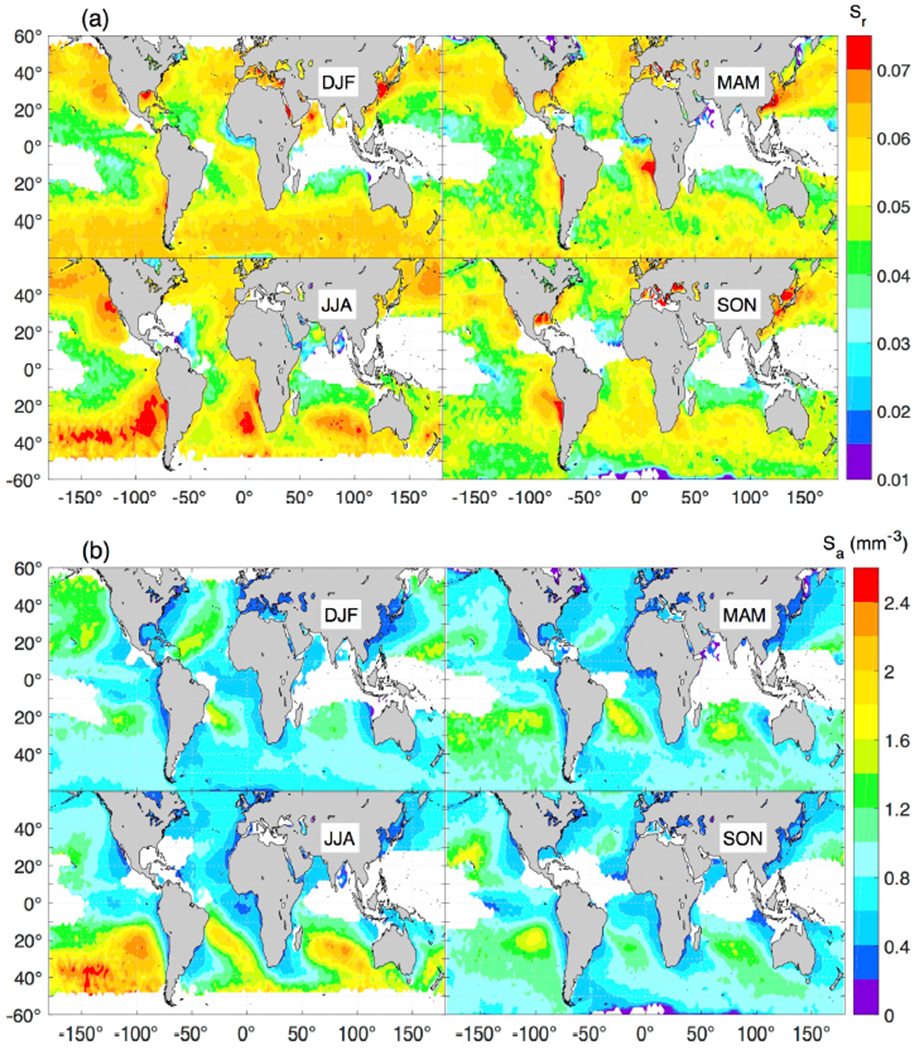
Seasonal Sr (a) and Sa (b).
Susceptibilities expressed in terms of TOA upward fluxes (F), denoted as and , are computed as the product between A susceptibilities (Sr and Sa) and the corresponding mean TOA incoming solar radiation. The noticeable seasonal transition in F relative susceptibility (, Fig. 4a), with maxima and minima during the corresponding hemispheric summer and winter, respectively, is primarily explained by the strong annual cycle of incoming solar radiation. In addition, the regions more relatively susceptible are the subtropical stratocumulus cloud regimes and the 40°S-60°S latitudinal band in summer, followed by eastern China and a narrow littoral band in eastern North America during spring. In terms of F absolute susceptibility (, Fig. 4b), the maps are qualitatively similar to their Sa counterparts, but with a clearer hemispheric contrast, and maximum values mostly confined to SH.
Figure 4:
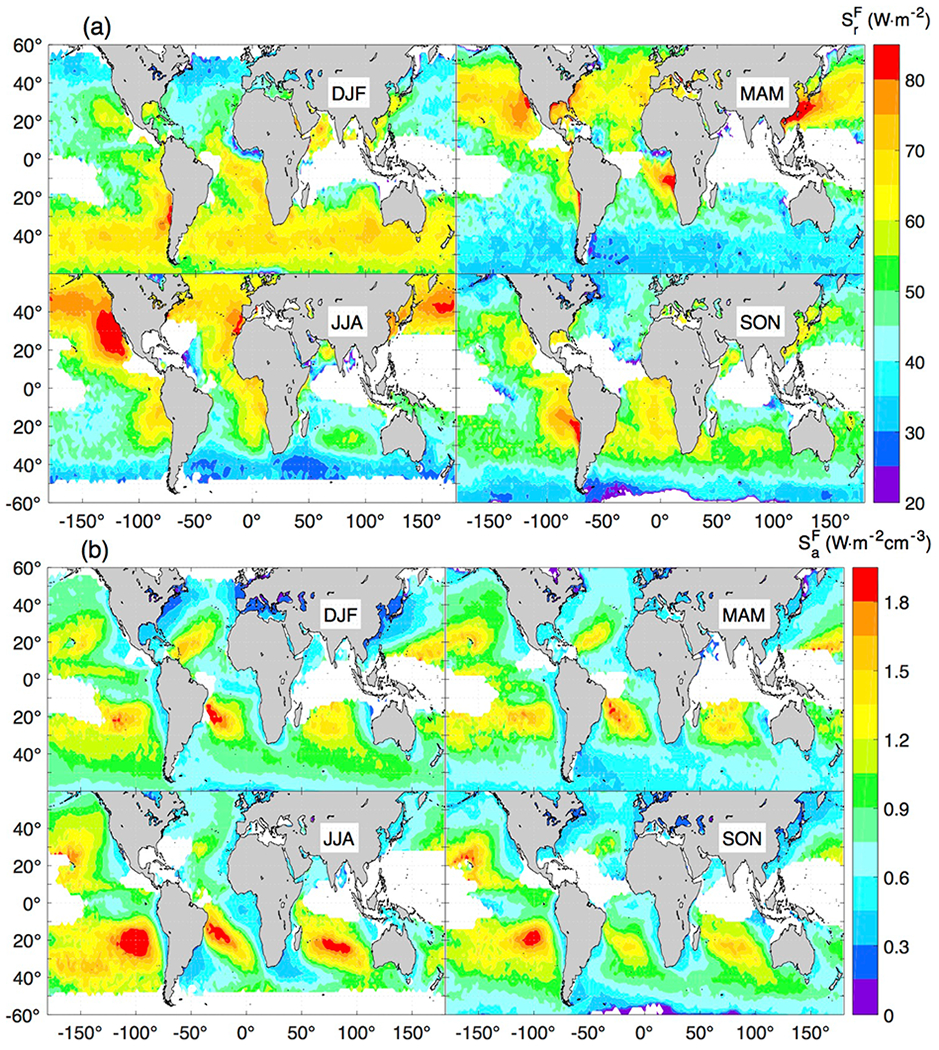
Seasonal susceptibilities expressed in terms of TOA shortwave fluxes. A) Relative TOA outgoing-flux susceptibility () and (b) absolute TOA outgoing-flux susceptibility ().
3.3. Annual and
The annual average F susceptibilities in TOA shortwave fluxes is presented in Fig. 5, and the results for albedo susceptibilities are included in Fig. S5. Overall, the eastern Pacific and Atlantic marine low clouds present the highest , with a secondary local maximum over the oceanic region of Australia. It is interesting to note the presence of high off the coast of eastern Asia, which encompasses southern China and Japan coasts over the Kuroshio Current. This oceanic location has received less attention than areas with subtropical low clouds; however, observational studies have identified the region as one prone to aerosol-cloud interactions (Koike et al., 2012). Annual absolute F susceptibility depicted in Fig. 5b yield higher magnitudes in the SH, and a westward increase that is consistent with an offshore reduction in Nd (Bennartz, 2007).
Figure 5:
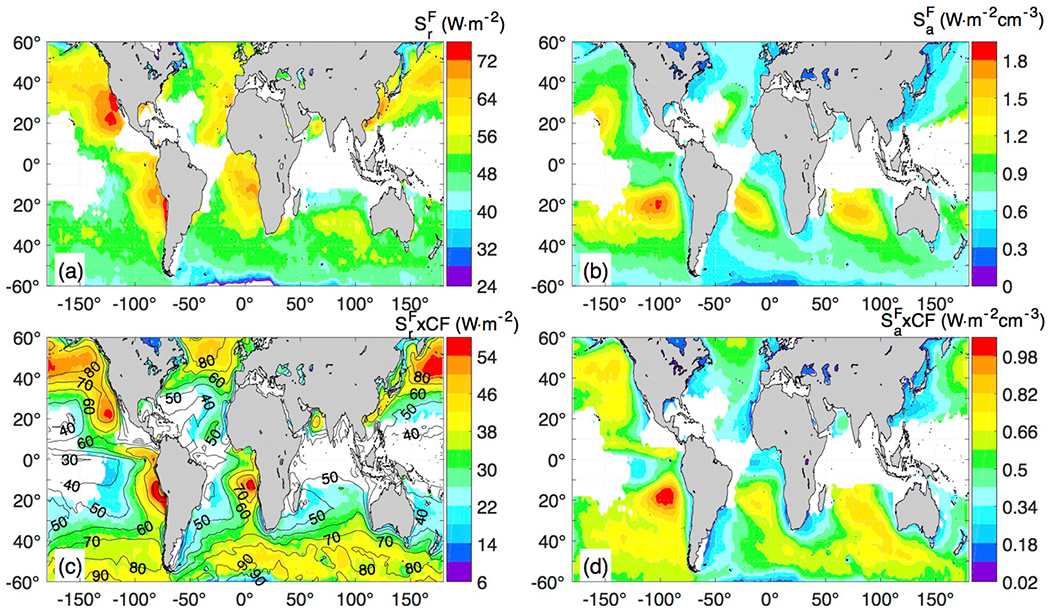
Annual relative (a) and absolute (b) shortwave flux susceptibilities. c) and d) as in a)-b) but multiplied by cloud fraction. Contours in Fig 5c are cloud fraction in percentage. The corresponding figure for Sr and Sa for albedo is presented in Fig. S5.
Figures 5c and d depict effective susceptibilities, defined as and multiplied by the annual low cloud fraction (CF, Fig 5c, contours). These maps seek to highlight the fact that TOA fluxes are primarily controlled by cloud cover, and therefore all-sky susceptibilities are lower than their cloudy counterparts presented thus far. A common feature of the effective susceptibilities in Fig. 5b and c is the enhancement of extratropical clouds (relative to other regions) due to their high CF. Since several coastal regions with high are located near the center of the stratocumulus cloud regimes, the effective also features a relative enhancement in the Northeast Pacific, Chile-Peru, and Namibia-Angola stratocumulus clouds. In contrast, in the Australia and northeast Atlantic stratocumulus regions, their are less relevant relative to their cloudy counterparts.
4. Discussion
The general dependence of Sr on LWP in Fig. 2 can be qualitatively explained by means of its analytical two-stream counterpart (Sr,2S), assuming a constant asymmetry parameter (0.85):
| (4) |
Sr,2S indirectly depends on LWP through the relationship LWP ∝ re · τ, with Painemal et al. (2012) showing that τ explains most of the LWP variance in marine stratiform clouds. Eq. 4 shows that Sr increases with τ until reaching a maximum for τ=13.3, with a gentle decrease thereafter. This is consistent with a Sr that increases with LWP up to 135 g m−2, and a nearly constant or slightly decreasing Sr for higher LWP (Fig. 2).
Sr has a secondary dependence on re, with a Sr reduction with re, as demonstrated by PO08. The role of re appears to in part explain why coastal regions that feature low re (Fig. 4 in Minnis et al. 2011b) yield maximum Sr. Solar zenith angle variations also account for seasonal changes (PO08), with a particularly strong modulation of flux susceptibilities. An additional component to take into account is the atmospheric absorption, driven by the amount of water vapor present. Radiative transfer calculations in PM12 and OP08 indicate that variations in the atmospheric composition can explain a small reduction in Sr and Sa in environments with a high concentration of atmospheric water vapor. Thus, this effect would be more prevalent in the tropics.
The all-sky susceptibilities in Fig. 5 were estimated assuming that CF is independent from Nd, and therefore, the second indirect effect is considered negligible. Although numerical simulations might be in disagreement with the CF-Nd assertion made here, satellite-based evidence of this effect might be difficult to isolate from retrieval biases, which are likely dependent on cloud cover (Painemal et al., 2013). Comparable remote sensing challenges have been reported when attempting to assess the relationship between aerosol and cloud albedo from satellite passive sensors (Christensen et al., 2017).
Another aspect that merits further discussion is the usefulness of absolute and relative susceptibilities, especially when considering their opposite spatial patterns. Although the relevance of is easily recognizable, the linearity between A and ln(Nd) (Fig 1) makes Sr (and ) particularly appealing for directly relating fractional changes in Nd to ΔA (ΔF), via ΔA = SR · fN (), where fN denotes a given fractional change in Nd. This could be extended to the determination of global ΔA based on maps of fractional changes of Nd, which could be derived, for instance, from numerical models. The idea is to some extent supported by Gryspeerdt et al. (2017), who utilized an ensemble of climate models to demonstrate that preindustrial Nd can be estimated from present time simulations and a priori knowledge of the anthropogenic contribution to the cloud condensation nuclei. Thus, the results presented here in principle enable one to connect aerosol variability with radiative fluxes at TOA due to the aerosol indirect effect.
Sa can be utilized for identifying regions and seasons in which the same variation in Nd yield the largest albedo changes. This appears particularly relevant for guiding dedicated regional modeling and sensitivity experiments in the context of aerosol-cloud-radiation interactions. Sa maps can also inform future field campaigns that aim at understanding the relationship between aerosols, clouds, and radiation, through controlled geoengineering experiments (e.g. Russell et al., 2013).
5. Concluding remarks
15 years of Aqua CERES and MODIS retrievals have been used for the global estimation of shortwave albedo and fluxes changes due to variations in Nd. This study takes advantage of the strong correlation between A and ln(Nd), to map changes in shortwave albedo and fluxes. The calculations are primarily valid over the non-polar oceans, where liquid shallow clouds are frequent. As in PO08 and PM12, I computed relative and absolute susceptibilities, defined as and , respectively. Because radiative fluxes at TOA for cloudy skies are primarily controlled by the amount of liquid water (i.e. LWP), the Nd modulation of the albedo is only apparent when LWP is kept relatively constant. Next, the total susceptibility is estimated as the susceptibility weighted average of all LWP bins between 10 and 240 g m−2.
Seasonal Sr and highlight the radiative importance of marine stratiform clouds: eastern Pacific, eastern Atlantic, and Australia cloud regimes. A secondary region of interest is the extratropical ocean during the hemispheric summers. When Sr is cast in terms of fluxes, the eastern Pacific clouds dominate whereas high values also emerge off the coast of eastern Asia. Absolute susceptibilities are mainly governed by Nd, which implies that the cloud albedo in pristine environments is highly sensitive to small perturbations in Nd. Although the interpretation of Sa is more intuitive than Sr, its main disadvantage is the non-linearity between A and Nd, which implies that Sr is more convenient for relating cloud microphysics and radiation. Lastly, although it is unlikely that the same absolute or fractional Nd change have occurred globally since pre-industrial times, Sr better reflects the fact that larger absolute changes in Nd should be expected in near-coastal regions, close to the main aerosol sources, and where Nd is also high.
The results presented in this study can help shed light into the processes that modulate the cloud radiative response due to aerosol-cloud interactions. It would be informative to examine the ability of climate models to reproduce the spatial pattern of susceptibility derived from the CERES-MODIS synergy. Such analyses will be valuable for understanding possible sources of discrepancies, as well as for estimating the range of uncertainty of the modeled radiative forcing.
Supplementary Material
Acknowledgements:
This work was funded by CERES program and NASA award # NNH16CY04C. I thank Dr. Zachary Eitzen for his suggestions and edits that greatly improved the overall quality of this article. Aqua CERES SSF level 2 is available at https://eosweb.larc.nasa.gov.
References
- Albrecht BA, Fairall CW, Thomson DW, White AB, Snider JB, & Schubert WH (1990). Surface-based remote sensing of the observed and the adiabatic liquid water content of stratocumulus clouds, Geophys. Res. Lett, 17, 89–92 [Google Scholar]
- Bennartz R (2007). Global assessment of marine boundary layer cloud droplet number concentration from satellite, J. Geophys. Res, 112, D02201, doi: 10.1029/2006JD007547. [DOI] [Google Scholar]
- Bennartz R & Rausch J (2017). Global and regional estimates of warm cloud droplet number concentration based on 13 years of AQUA-MODIS observations, Atmos. Chem. Phys, 17, 9815–9836, 10.5194/acp-17-9815-2017. [DOI] [Google Scholar]
- Boucher O, Randall D, Artaxo P, Bretherton C, Feingold G, Forster P, et al. (2013). The Physical Science Basis Contribution of Working Group I to the Fifth Assessment Report of the Intergovernmental Panel on Climate Change [Stocker TF, Qin D, Plattner G-K, Tignor M, Allen SK, Boschung J, Nauels A, Xia Y, Bex V and Midgley PM (eds.)], Cambridge University Press, Cambridge, United Kingdom and New York, NY, USA. [Google Scholar]
- Christensen MW, Neubauer D, Poulsen CA, Thomas GE, McGarragh GR, Povey A, et al. (2017). Unveiling aerosol–cloud interactions – Part 1: Cloud contamination in satellite products enhances the aerosol indirect forcing estimate, Atmos. Chem. Phys, 17, 13151–13164, 10.5194/acp-17-13151-2017, 2017. [DOI] [Google Scholar]
- Grandey BS, & Stier P (2010). A critical look at spatial scale choices in satellite-based aerosol indirect effect studies, Atmos. Chem. Phys, 10, 11,459–11, 470, doi: 10.5194/acp-10-11459-2010. [DOI] [Google Scholar]
- Grosvenor D, Sourdeval O, Zuidema P, Ackerman A, Alexandrov M, Bennartz R, et al. (2018). Remote sensing of droplet number concentration in warm clouds: A review of the current state of knowledge and perspectives. Reviews of Geophysics. 10.1029/2017RG000593. [DOI] [PMC free article] [PubMed] [Google Scholar]
- Grosvenor DP & Wood R (2014). The effect of solar zenith angle on MODIS cloud optical and microphysical retrievals within marine liquid water clouds, Atmos. Chem. Phys, 14, 7291–7321, 10.5194/acp-14-7291-2014. [DOI] [Google Scholar]
- Koike M, Takegawa N, Moteki N, Kondo Y, Nakamura H, Kita K, et al. (2012). Measurements of regional-scale aerosol impacts on cloud microphysics over the East China Sea: Possible influences of warm sea surface temperature over the Kuroshio Ocean Current, J. Geophys. Res, 117, D17205, doi: 10.1029/2011JD017324 [DOI] [Google Scholar]
- Gryspeerdt E, Quaas J, Ferrachat S, Gettelman A, Ghan S, Lohmann U, et al. (2017). Constraining the instantaneous aerosol influence on cloud albedo, Proc. Nat. Acad. Sci. USA, 119, 4899–4904, doi: 10.1073/pnas.1617765114. [DOI] [PMC free article] [PubMed] [Google Scholar]
- Loeb NG, Kato S, Loukachine K, & Manalo-Smith N (2005). An-gular Distribution Models for Top-of-Atmosphere Radiative Flux Estimation from the Clouds and the Earth’s Radiant Energy System Instrument on the Terra Satellite, Part I: Methodology, J. Atmos. Ocean. Tech, 22, 338–351, 2005. [Google Scholar]
- Loeb NG, Kato S, Loukachine K, Manalo-Smith N, & Doelling DR (2007). Angular Distribution Models for Top-of- Atmosphere Radiative Flux Estimation from the Clouds and the Earth’s Radiant Energy System Instrument on the Terra Satellite, Part II: Validation, J. Atmos. Ocean. Tech, 24, 564–584, 2007. [Google Scholar]
- Lohmann U, & Feichter J (2005). Global indirect aerosol effects: A review, Atmos. Chem. Phys, 5, 715–737. [Google Scholar]
- Martin GM, Johnson DW, & Spice A (1994). The Measurement and Parameterization of Effective Radius of Droplets in Warm Stratocumulus Clouds, J. Atmos. Sci, 51, 1823–1842, [DOI] [Google Scholar]
- McComiskey A & Feingold G (2008). Quantifying error in the radiative forcing of the first aerosol indirect effect, Geophys. Res. Lett, 35, L02810, doi: 10.1029/2007GL032667. [DOI] [Google Scholar]
- Minnis P, Sun-Mack S, Young D, Heck PW, Garber DP, Chen Y, et al. (2011a). CERES edition-2 cloud property retrievals using TRMM VIRS and Terra and Aqua MODIS data, Part I: Algorithms, IEEE Trans. Geosci. Remote Sens, 49, 4374–4400. [Google Scholar]
- Minnis P, Sun-Mack S, Chen Y, Khayer MK, Yi Y, Ayers JK, et al. (2011b). CERES edition-2 cloud property retrievals using TRMM VIRS and Terra and Aqua MODIS data, Part II: Examples of average results and comparisons with other data, IEEE Trans. Geosci. Remote Sens, vol. 49, no. 11, pp. 4401–4430, Nov. 2011. [Google Scholar]
- Oreopoulos L, & Platnick S (2008). Radiative susceptibility of cloudy atmospheres to droplet number perturbations: 2. Global analysis from MODIS, J. Geophys. Res, 113, D14S21, doi: 10.1029/2007JD009655. [DOI] [Google Scholar]
- Painemal D, & Zuidema P (2011). Assessment of MODIS cloud effective radius and optical thickness retrievals over the Southeast Pacific with VOCALS-REx in situ measurements, J. Geophys. Res, 116, D24206, doi: 10.1029/2011JD016155. [DOI] [Google Scholar]
- Painemal D, & Minnis P, (2012). On the dependence of albedo on cloud microphysics over marine stratocumulus clouds regimes determined from Clouds and the Earth’s Radiant Energy System (CERES) data, J. Geophys. Res, 117, D06203, doi: 10.1029/2011JD017120. [DOI] [Google Scholar]
- Painemal D, Minnis P, & Sun-Mack S (2013). The impact of horizontal heterogeneities, cloud fraction, and liquid water path on warm cloud effective radii from CERES-like Aqua MODIS retrievals, Atmos. Chem. Phys, 13, 9997–10003, 10.5194/acp-13-9997-2013. [DOI] [Google Scholar]
- Platnick S & Twomey S (1994). Determining the susceptibility of cloud albedo to changes in droplet concentration with the Advanced Very High Resolution Radiometer, J. Appl. Meteor, 33, 334–347 [Google Scholar]
- Platnick S, & Oreopoulos L (2008). Radiative susceptibility of cloudy atmospheres to droplet number perturbations: 1. Theoretical analysis and examples from MODIS, J. Geophys. Res, 113, D14S20, doi: 10.1029/2007JD009654. [DOI] [Google Scholar]
- Russell LM, Sorooshian A, Seinfeld JH, Albrecht BA, Nenes A, Ahlm L, et al. (2013). Eastern Pacific Emitted Aerosol Cloud Experiment, Bull. Amer. Meteor. Soc, 94, 709–729, 10.1175/BAMS-D-12-00015.1 [DOI] [Google Scholar]
- Su W, Corbett J, Eitzen Z, & Liang L (2015). Next-generation angular distribution models for top-of-atmosphere radiative flux calculation from CERES instruments: methodology, Atmos. Meas. Tech, 8, 611–632, 10.5194/amt-8-611-2015. [DOI] [Google Scholar]
- Sun-Mack S, Minnis P, Chen Y, Kato S, Yi Y, Gibson SC, et al. , (2014). Regional Apparent Boundary Layer Lapse Rates Determined from CALIPSO and MODIS Data for Cloud-Height Determination, J. Appl. Meteor. Climatol, 53, 990–1011, 10.1175/JAMC-D-13-081.1 [DOI] [Google Scholar]
- Twomey S (1977). Influence of pollution on shortwave albedo of clouds, J. Atmos. Sci, 34, 1149–1152. [Google Scholar]
Associated Data
This section collects any data citations, data availability statements, or supplementary materials included in this article.


