

Abstract
Nrf2 signaling is vital for protecting cells against oxidative stress. However, its hyperactivation is frequently found in liver cancer through excessive build‐up of p62/SQSTM1 bodies that sequester Keap1, an adaptor of the E3‐ubiquitin ligase complex for Nrf2. Here, we report that the Bax‐binding protein MOAP‐1 regulates p62‐Keap1‐Nrf2 signaling through disruption of p62 bodies. Upon induction of cellular stresses that stimulate formation of p62 bodies, MOAP‐1 is recruited to p62 bodies and reduces their levels independent of the autophagy pathway. MOAP‐1 interacts with the PB1‐ZZ domains of p62 and interferes with its self‐oligomerization and liquid–liquid phase separation, thereby disassembling the p62 bodies. Loss of MOAP‐1 can lead to marked upregulation of p62 bodies, enhanced sequestration of Keap1 by p62 and hyperactivation of Nrf2 antioxidant target genes. MOAP‐1‐deficient mice exhibit an elevated tumor burden with excessive levels of p62 bodies and Nrf2 signaling in a diethylnitrosamine (DEN)‐induced hepatocarcinogenesis model. Together, our data define MOAP‐1 as a negative regulator of Nrf2 signaling via dissociation of p62 bodies.
Keywords: antioxidant signaling, liver cancer, MOAP‐1, Nrf2, p62/SQSTM1
Subject Categories: Autophagy & Cell Death, Cancer, Signal Transduction
Stress‐induced p62/SQSTM1 bodies sequester the E3 ubiquitin ligase Keap1 from Nrf2, which is free to mediate transactivation of its target genes. MOAP‐1 recruitment to p62 bodies promotes their disassembly and reduces Nrf2 activation.

Introduction
p62 (sequestosome‐1/SQSTM1) serves as a selective autophagy receptor as well as a signaling scaffold to participate in the regulation of multiple physiological processes including oxidative stress defense and cellular metabolism (Katsuragi et al, 2015; Moscat et al, 2016). As an autophagy receptor, p62 assembles misfolded and damaged proteins into aggregates for bulk degradation through the autophagy‐lysosome pathway (Bjorkoy et al, 2005; Komatsu et al, 2007). Aggregation of p62 is mediated by self‐oligomerization through trans interaction of its N‐terminal Phox and Bem1p (PB1) domain (Lamark et al, 2003; Wilson et al, 2003; Bjorkoy et al, 2005). High level of p62 aggregation, which can be induced by cellular conditions such as oxidative or proteolytic stress, defects in autophagy or other regulatory mechanisms, results in the formation of p62‐positive cytoplasmic inclusion bodies, known as the p62 bodies (Bjorkoy et al, 2005; Komatsu et al, 2007). p62 bodies can sequester Keap1, an adaptor of the cullin‐3 E3‐ubiquitin ligase complex for Nrf2. This uncouples Nrf2 from regulation by the ubiquitin‐proteasome system (UPS), leading to its stabilization, followed by translocation to nucleus where it activates antioxidant target genes (Komatsu et al, 2010; Lau et al, 2010). High abundance of the p62 bodies, which are frequently observed in the livers of hepatocellular carcinoma (HCC) patients in the form of Mallory–Denk bodies and intracellular hyaline granules, is implicated to play a role in the development of HCC (Zatloukal et al, 2002; Mathew et al, 2009; Inami et al, 2011; Takamura et al, 2011; Umemura et al, 2016). Interestingly, in mice, p62 is required and sufficient to mediate liver tumorigenesis through enhancing the Nrf2 and mTORC1 signaling pathways, separable from its role as an autophagy receptor (Saito et al, 2016; Umemura et al, 2016). p62 activity is known to be regulated by multiple mechanisms that modulate its ability to form aggregates and to recruit Keap1 and ubiquitylated substrates (Matsumoto et al, 2011; Ichimura et al, 2013; Cha‐Molstad et al, 2015; Pan et al, 2016; Lee et al, 2017; Peng et al, 2017; Carroll et al, 2018; Kehl et al, 2019; Xu et al, 2019; Yang et al, 2019; You et al, 2019; Sanchez‐Martin et al, 2020). More recently, p62 was shown to undergo liquid–liquid phase separation and the condensates formed, appearing as “aggregates” or “bodies” visually, are in fact a dynamic structure undergoing fusion constantly (Sun et al, 2018; Zaffagnini et al, 2018; Yang et al, 2019; Sanchez‐Martin et al, 2020). Despite numerous advances toward understanding the functions and regulation of p62 in cellular signal transduction, it is not known whether p62 bodies, once formed, can be reversed through dissociation by specific regulatory protein for attenuating its signaling activity.
MOAP‐1 (modulator‐of‐apoptosis‐1) was originally identified as a Bax‐binding protein (Tan et al, 2001; Tan et al, 2005; Fu et al, 2009). MOAP‐1 has a short half‐life of ~25 min as it is tightly regulated by the UPS (Fu et al, 2007; Huang et al, 2012; Matsuura et al, 2017). Apoptotic stimulation upregulates MOAP‐1 by de‐coupling it from the UPS regulation (Fu et al, 2007). In human cancer cell lines, depletion of MOAP‐1 compromised pro‐apoptotic function of Bax, resulting in reduced sensitivity to apoptotic stimuli (Baksh et al, 2005; Tan et al, 2005). In vivo, MOAP‐1 plays a critical role in mediating Fas‐induced apoptosis in the liver via facilitating recruitment of the active form of Bid, tBid, to mitochondria (Tan et al, 2016). In this study, we report a distinct role of MOAP‐1 in promoting the disassembly of the p62 bodies formed under the stress conditions to negatively regulate the p62‐Keap1‐Nrf2 signaling. MOAP‐1 interacts with the PB1‐ZZ domains of p62 to interfere with its self‐oligomerization function, thereby disrupting its liquid phase condensation and promoting dissociation of the p62 bodies independent of the autophagy pathway. In certain cell lines, loss of MOAP‐1 alone is sufficient to trigger marked accumulation of p62 bodies, increased sequestration of Keap1 by p62 and hyperactivation of Nrf2. MOAP‐1‐deficient mice exhibit elevation of liver tumor burden with excessive levels of p62 bodies and Nrf2 signaling in the DEN‐induced carcinogenesis model. Together, our data establish a paradigm of negative regulation of the p62‐Keap1‐Nrf2 axis via dissociation of the p62 bodies.
Results
MOAP‐1 localizes at the p62 bodies upon exposure to cellular stresses
MOAP‐1 is a low abundance protein constantly degraded via the UPS (Fu et al, 2007). Inhibition of the UPS regulation of MOAP‐1, either by apoptotic stimuli or proteasome inhibitors, results in a robust upregulation of MOAP‐1 (Fu et al, 2007). MOAP‐1 was previously known to be enriched at the outer mitochondrial membrane (OMM) to facilitate Bax activation upon apoptotic stimulation (Tan et al, 2005). In the HCT116 colorectal cancer cells and immortalized mouse embryonic fibroblasts (MEFs) treated with the proteasome inhibitor MG132, however, green fluorescent protein (GFP)‐tagged MOAP‐1 appeared to localize in aggregated patterns in the perinuclear region of cytoplasm (Fig 1A, Appendix Fig S1A). The aggregated patterns of MOAP‐1 were not likely due to an artifact resulting from its overexpression as we could also detect endogenous MOAP‐1 in the protein aggregates in HCT116 cells treated with MG132 (Fig 1B). Inhibition of proteasome is known to induce aggregation of ubiquitylated protein substrates mediated by p62 (Bjorkoy et al, 2005; Wooten et al, 2006). As expected, we observed that MOAP‐1 colocalized with ubiquitin at the protein aggregates (Appendix Fig S1B). We then evaluated whether MOAP‐1‐positive aggregates also consist of p62. Indeed, MOAP‐1 and p62 appeared to colocalize at the protein aggregates (Fig 1A and B).
Figure 1. MOAP‐1 localizes at the p62 bodies upon exposure to cellular stresses.

- MOAP‐1 colocalizes with p62 in the cytoplasmic inclusion bodies upon proteasome inhibition. HCT116 cells were transfected with plasmid encoding GFP‐MOAP‐1 or GFP only control. 14 h later, cells were treated with the proteasome inhibitor MG132 (5 µM) for 8 h and analyzed by immunofluorescence (IF) with anti‐GFP (in green) and anti‐p62 (in red) antibodies. Scale bar: 5 µm.
- Endogenous MOAP‐1 resides at the p62 bodies upon proteasome inhibition. HCT116 cells were treated with MG132 (5 µM) for 8 h and analyzed by IF with anti‐MOAP‐1 (in green) and anti‐p62 (in red) antibodies. Scale bar: 5 µm.
- MOAP‐1 is recruited to the p62 bodies upon exposure to cellular stresses. LO2 hepatocytes were transfected with plasmid encoding Myc‐MOAP‐1. 14 h later, cells were then treated with MG132 (5 µM), arsenic trioxide (As2O3, 10 µM) or diethylnitrosamine (DEN, 200 µM) for 8 h each. Cells were then processed for IF analysis with anti‐Myc (in green) and anti‐p62 (in red) antibodies. Scale bar: 5 µm.
- MOAP‐1 spontaneously localizes to the p62 bodies at resting state in the liver cancer cell lines, HepG2, Huh‐1, JHH5 and JHH7. The liver cancer cell lines were transfected with the plasmid encoding Myc‐MOAP‐1. 14 h later, transfected cells were subjected to IF analysis with anti‐Myc (in green) and anti‐p62 (in red) antibodies. Scale bar: 5 µm.
- Absence of the aggregated patterns of MOAP‐1 in the p62 deficient cells. WT and p62 KO HepG2 cells were transfected with plasmid encoding Myc‐MOAP‐1 for 14 h and the cells were subjected to IF analysis as in (D). Scale bar: 5 µm.
- Western blotting analysis of p62 and Myc‐MOAP‐1 protein levels in the WT and p62 KO HepG2 cells as described in (E). Actin as loading control.
Data information: In (A–E), nuclei were counterstained with DAPI (blue).
Source data are available online for this figure.
Formation of p62‐enriched protein aggregates, which are insoluble cytoplasmic inclusion bodies hereon referred to as the p62 bodies, is normally induced upon exposure to various types of cellular stresses in many cell types including hepatocytes (Pan et al, 2016; Sanchez‐Martin & Komatsu, 2018). In these cells, p62 normally exists in a soluble and non‐aggregate state under basal condition. In some HCC cell lines, however, high abundance of p62 bodies can be readily detected at the resting state, even without any stress signals (Zatloukal et al, 2002; Inami et al, 2011). Due to the well‐established physiopathological role of the p62‐Keap‐1‐Nrf2 signaling in the liver and availability of many established hepatic cell lines with known status of p62 bodies at the basal and stress states, we decided to initially focus our investigation on defining the relationship between MOAP‐1 and p62 bodies using hepatic cell lines as our cellular models. LO2 human normal hepatocytes, which retain hepatocellular properties (Hu et al, 2013), are known to exhibit low level of insoluble p62 at the resting state (Xu et al, 2019). In these cells, treatment with the proteasome inhibitor MG132 or the oxidative stressor, arsenic trioxide (As2O3), potently triggered formation of p62 bodies (Fig 1C). The localization patterns of MOAP‐1 were then examined in the LO2 hepatocytes under basal and stress conditions. Under basal condition, MOAP‐1 appeared to localize diffusely in the cytosol in the LO2 cells (Fig 1C). Consistent with the finding from the HCT116 cells, MOAP‐1 appeared to localize at the p62 bodies upon treatment with MG132 in the LO2 cells (Fig 1C). Similarly, upon exposure to As2O3, MOAP‐1 was found to be recruited to the p62 bodies induced by the oxidative stressor (Fig 1C). We also included diethylnitrosamine (DEN), which is metabolized by the cytochrome P450 enzyme system in the hepatocytes into ethyl diazonium ions (reactive oxygen species) that induce oxidative stress (Kang et al, 2007). Similarly, treatment with DEN induced recruitment of MOAP‐1 to the p62 bodies (Fig 1C). These data suggest that MOAP‐1 localization at the p62 bodies is induced upon exposure to stress signals. Interestingly, in the HCC cell lines that exhibit high basal levels of p62 bodies including Huh1, JHH5, JHH7, and HepG2, MOAP‐1 appeared to be spontaneously localized at the p62 bodies (Fig 1D). Localization of MOAP‐1 appeared to be in a diffuse pattern in the cytosol of p62 knockout (KO) HepG2 cells generated using the CRISPR/Cas9 system, suggesting that recruitment of MOAP‐1 to protein aggregates is dependent on p62 (Fig 1E and F).
MOAP‐1 downregulates levels of the p62 bodies
The localization of MOAP‐1 to the p62 bodies may hint at its potential role in the homeostatic control of the levels of p62 bodies. While overexpression of MOAP‐1 did not overtly interfere with the formation of p62 bodies induced in the LO2 cells upon treatment with DEN for 12 h, its overexpression, however, appeared to promote downregulation of their levels over time (Fig 2A, Appendix Fig S2A). Similarly, in HepG2 cells, overexpression of MOAP‐1 resulted in a reduction of the levels of p62 bodies in a progressive manner (Fig 2B). In the HepG2 cells stably expressing GFP‐MOAP‐1, but not GFP, the basal level of p62 bodies appeared to be downregulated (Fig EV1A). In these HepG2 cells, treatment with MG132 could lead to stabilization and upregulation of GFP‐MOAP‐1, as well as increased formation of p62 bodies (Fig EV1A). Interestingly, despite the initial elevation of p62 bodies at 12 and 16 h post‐MG132 treatment, they were progressively reduced in the cells expressing GFP‐MOAP‐1, but not GFP, at 20 and 24 h post‐MG132 addition (Fig EV1A). These observations suggest that MOAP‐1 exerts a negative regulatory effect on modulating the abundance of the p62 bodies. To investigate this further, we carried out loss‐of‐function analysis in LO2 cell lines by introducing MOAP‐1 KO using the CRISPR/Cas9 system. Remarkably, high level of p62 bodies was spontaneously detected in the MOAP‐1 KO LO2 cells (Fig 2C and D), which was effectively reversed by re‐expression of MOAP‐1 (Fig 2E and F, Appendix Fig S2B). In the MG132‐treated LO2 cells that exhibited increased abundance of p62 bodies, loss of MOAP‐1 would further elevate the levels of the p62 bodies (Appendix Fig S2C and D). To validate the specificity of the immunofluorescence signal of p62 detected in the analysis, p62 KO LO2 cells generated using the CRISPR/Cas9 system, were included as a negative control. No p62 bodies could be detected in these p62‐deficient cells (Fig 2C). To evaluate whether regulation of p62 bodies by MOAP‐1 is specific to hepatic cells, HeLa cervical cancer cells and MEFs were also included in the analysis. Interestingly, knockout of MOAP‐1 led to a spontaneous increase in the abundance of p62 bodies in the HeLa cells, but not the MEFs (Figs 2G and H, and EV1B and C). In MEFs, however, absence of MOAP‐1 resulted in elevated levels of p62 bodies upon exposure to As2O3 (Fig 2G and H). Furthermore, upon washout of As2O3 from the MEFs pre‐treated with this oxidative stressor for 12 h, reduction in the levels of p62 bodies over time was at a much lower rate in the MOAP‐1‐deficient MEFs (Fig EV1E and F). In the LO2 and HeLa cells where MOAP‐1 deficiency led to a dramatic increase in the levels of p62 bodies, no difference in the total protein levels of p62 was observed (Figs 2I and EV1D). However, there was an increase in the distribution of p62 in the detergent‐insoluble fraction of the lysates prepared using lysis buffer containing 1% Triton X (Fig EV1H). Similarly, no significant difference in the total p62 protein levels was noted between the wild type (WT) and MOAP‐1 KO MEFs and LO2 hepatocytes treated with the As2O3 or MG132, respectively (Figs 2J and EV1G, Appendix Fig S2E). Moreover, using Halo pulse‐chase assay, no significant difference in the turnover of Halo‐tagged p62 protein was detected between the WT and MOAP‐1 KO LO2 cells (Fig 2K and L). Together, our data suggest that MOAP‐1 appears to play a role in regulating levels of the p62 bodies, but not p62 protein.
Figure 2. MOAP‐1 regulates levels of p62 bodies.

- MOAP‐1 downregulates the levels of the diethylnitrosamine (DEN)‐induced p62 bodies in a time‐dependent manner. LO2 cells were transfected with plasmid encoding Myc‐MOAP‐1. 14 h later, cells were treated with DEN (200 µM) for the indicated period of times, before being subjected to IF with anti‐Myc (in green) and anti‐p62 (in red) antibodies. Cells expressing Myc‐MOAP‐1 were marked by dashed lines. Scale bar: 5 µm.
- MOAP‐1 downregulates the p62 bodies in the resting HepG2 liver cancer cells. HepG2 were transfected with plasmid encoding Myc‐MOAP‐1. At the indicated time post‐transfection, transfected cells were subjected to IF as in (A). Scale bar: 10 µm.
- Loss of MOAP‐1 leads to spontaneous elevation of the basal levels of p62 bodies in the LO2 cells. WT, MOAP‐1 KO, and p62 KO LO2 cells were subjected to IF with anti‐p62 antibody (in red). p62 KO cells were included as a negative control. Insets in the upper panels are enlarged in the lower panels.
- Quantification of the p62 bodies in the WT and MOAP‐1 KO LO2 cells. (Left panel) number of p62 bodies per cell. n = 7 independently plated samples. (Right panel) size of p62 bodies. n = 442 and 1014 bodies detected in the WT and MOAP‐1 KO LO2 cells, respectively, from three independently plated samples.
- Re‐expression of MOAP‐1 reduces levels of p62 bodies in the MOAP‐1‐deficient LO2 cells. MOAP‐1 KO LO2 cells were transfected with plasmid encoding Myc‐MOAP‐1 for 24 h and subjected to IF with anti‐p62 (in red) and anti‐Myc (green) antibodies. Cells expressing Myc‐MOAP‐1 were marked by dashed lines. Scale bar: 5 µm.
- Quantification of the p62 bodies in the MOAP‐1 KO LO2 cells re‐introduced with Myc‐MOAP‐1. (Left panel) number of p62 bodies per cell. n = 7 independently plated samples of MOAP‐1 KO cells transfected with empty vector control (Ctrl) or plasmid encoding Myc‐MOAP‐1. (Right panel) size of p62 bodies. n = 178 and 69 bodies detected in the Ctrl and Myc‐MOAP‐1 expressing cells, respectively, from three independently plated samples.
- Increased levels of p62 bodies in MOAP‐1 KO MEFs upon treatment with arsenic trioxide. WT and MOAP‐1 KO MEFs were treated with arsenic trioxide (As2O3, 10 µM) for the indicated durations and subjected to IF with anti‐p62 antibody (in red). Scale bar: 5 µm.
- Quantification of the p62 bodies in the WT and MOAP‐1 KO MEFs treated with arsenic trioxide. (Left panel) number of p62 bodies per cell. n ≥ 6 independently plated samples. (Right panel) size of p62 bodies. n = 10 (WT, basal), 17 (MOAP‐1 KO, basal), 104 (WT, As2O3 2 h), 137 (MOAP‐1 KO, As2O3 2 h), 605 (WT, As2O3 4 h), 977 (MOAP‐1 KO, As2O3 4 h), 721 (WT, As2O3 6 h) and 487 bodies (MOAP‐1 KO, As2O3 6 h) from three independently plated samples.
- MOAP‐1 deficiency does not alter total protein levels of p62 in the LO2 cells. Western blotting analysis of p62 protein levels in the WT, MOAP‐1 KO, and p62 KO LO2 cells lysed in 1x Laemmli sample buffer containing 2% SDS. Actin as loading control.
- MOAP‐1 deficiency does not affect total protein levels of p62 in MEFs under basal and As2O3‐treated conditions. Western blotting analysis of p62 and MOAP‐1 in the WT and MOAP‐1 KO MEFs treated with As2O3 as indicated. MOAP‐1 was immunoprecipitated from the lysates. Actin as loading control.
- Loss of MOAP‐1 does not alter protein turnover of p62 in the LO2 cells. WT and MOAP‐1 KO LO2 cells stably expressing Halo‐tagged p62 were subjected to TMR labeling and harvested at the time points post‐labeling as indicated. TMR signals of Halo‐p62 were visualized by a Bio‐Rad Imager at 565 nM wavelength, whereas the total Halo‐p62 protein was detected by Western blotting using anti‐Halo or anti‐p62 antibodies.
- Quantification of the TMR signals in the WT and MOAP‐1 KO LO2 cells by densitometric analysis. Average integrated density values of the TMR signals from three independent experiments were presented, relative to the levels at 0 h.
Data information: In (A, B, C, E, G), nuclei were counterstained with DAPI (blue). In (D, F, H, L), error bars represent SEM. **P < 0.01, ***P < 0.001, ns, not significant, Student’s t‐test.
Source data are available online for this figure.
Figure EV1. MOAP‐1 is a negative regulator of p62 bodies.

- MOAP‐1 downregulates the levels of the MG132‐induced p62 bodies in a time‐dependent manner. HepG2 cells stably expressing GFP‐MOAP‐1 or GFP were treated with MG132 (5 µM) for the indicated durations before being subjected to IF analysis with anti‐GFP (in green) and anti‐p62 (in red) antibodies.
- MOAP‐1 regulates levels of p62 bodies in HeLa cervical cancer cells. WT and MOAP‐1 KO HeLa cells were subjected to IF analysis with the anti‐p62 antibody (in red).
- Quantification of the p62 bodies in the WT and MOAP‐1 KO HeLa cells. (Left panel) number of p62 bodies per cell. n = 7 independently plated samples. (Right panel) size of p62 bodies. n = 164 and 410 bodies detected in the WT and MOAP‐1 KO cells, respectively, from three independently plated samples.
- Deficiency in MOAP‐1 does not alter total protein levels of p62 in the HeLa cells. Western blotting analysis of p62 protein levels in the WT and MOAP‐1 KO HeLa cells.
- Effect on the reduction of p62 bodies during the washout period after arsenic trioxide treatment is weaker in the MOAP‐1 KO MEFs. WT and MOAP‐1 KO MEFs were treated with arsenic trioxide (As2O3, 10 µM) for 12 h. The cells were washed three times. At 6 or 12 h post‐washing, the cells were harvested for IF analysis with anti‐p62 antibody (in red).
- Quantification of the p62 bodies in the WT and MOAP‐1 KO MEFs treated with As2O3 and at the indicated times during the washout period. (Upper panel) number of p62 bodies per cell. n = 6 independently plated samples. (Lower panel) size of p62 bodies. n = 318 (WT, basal), 273 (MOAP‐1 KO, basal), 532 (WT, As2O3 12 h),1207 (MOAP‐1 KO, As2O3 12 h), 164 (WT, washout 6 h), 571 (MOAP‐1 KO, washout 6 h), 139 (WT, washout 12 h) and 725 bodies (MOAP‐1 KO, washout 12 h) from three independently plated samples.
- MOAP‐1 deficiency does not overtly alter the protein levels of p62 in the MEFs upon washout of As2O3. Western blotting analysis of p62 and MOAP‐1 in the WT and MOAP‐1 KO MEFs treated with As2O3 and at the indicated times during the washout period. MOAP‐1 was immunoprecipitated from the lysates. Actin as loading control.
- MOAP‐1 deficiency elevates levels of p62 protein in the detergent‐insoluble fractions in LO2 and HeLa cells. LO2 and HeLa cells with the indicated genotypes were lysed in 1% Triton X lysis buffer, separated into detergent‐soluble (S) and insoluble (I) fractions and analyzed by Western blotting. p62 KO LO2 cells were included as a negative control to validate the specificity of the p62 protein band detected in these fractions. Coomassie Brilliant Blue (CBB)‐stained gels were included to show comparable loading of the insoluble fractions in the samples.
Data information: In (A, B, E) Nuclei were counterstained with DAPI (blue). Scale bar: 10 µm. In (C, F), error bars represent SEM. *P < 0.05, **P < 0.01, ***P < 0.001, ns, not significant, Student’s t‐test.
Downregulation of the p62 bodies by MOAP‐1 does not require involvement of the autophagy pathway
p62 bodies are generally thought to be directed for degradation via the autophagy‐lysosome pathway (Bjorkoy et al, 2005; Komatsu et al, 2007; Pankiv et al, 2007). If MOAP‐1‐mediated downregulation of p62 bodies is mediated by autophagic clearance, then MOAP‐1 deficiency is expected to result in accumulation of p62 protein. The observation that only p62 bodies, but not total protein levels of p62, were elevated in the MOAP‐1‐deficient cells argues against this possibility (Fig 2). To examine further whether MOAP‐1‐mediated downregulation of p62 bodies is independent from the autophagy‐lysosome pathway, we depleted ATG5, an essential mediator of autophagy signaling, in HepG2 cells, which led to upregulation of the levels of the p62 bodies and total protein (Fig 3A–C). Overexpression of MOAP‐1 in this context remained competent in downregulating the p62 bodies (Fig 3A and B). Furthermore, blockade of the auto‐lysosomal degradation pathway using Bafilomycin A1 (BafA1) or chloroquine (CQ) effectively led to accumulation of p62 and lipidated LC3 (LC3II), but failed to prevent MOAP‐1‐mediated downregulation of p62 bodies (Fig 3D–F).
Figure 3. Downregulation of p62 bodies by MOAP‐1 does not depend on the autophagy pathway.
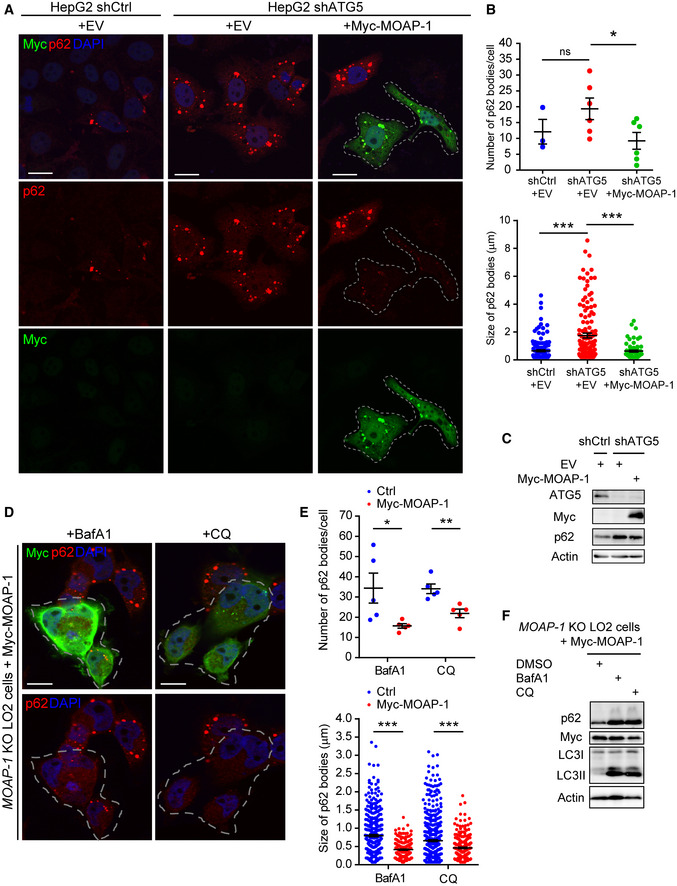
- Overexpression of MOAP‐1 downregulates levels of p62 bodies in the ATG5‐depleted cells. HepG2 cells were infected with lentivirus encoding short hairpin RNA for ATG5 (shATG5) or scramble control (shCtrl) for 48 h before being transfected with Myc‐MOAP‐1 or empty vector (EV) control for 24 h and subjected to IF analysis using anti‐p62 (in red) and anti‐Myc (in green) antibodies. Cells expressing Myc‐MOAP‐1 were marked by dashed lines.
- Quantification of the p62 bodies in the ATG5‐depleted cells transfected with Myc‐MOAP‐1 or empty vector. (Upper panel) number of p62 bodies per cell. n ≥ 3 independently plated samples. (Lower panel) size of p62 bodies. n = 135, 133 and 65 bodies in the shCtrl + EV, shATG5 + EV, and shATG5 + Myc‐MOAP‐1 cells, respectively, from three independently plated samples.
- Western blotting of the lysates from HepG2 cells infected with lentivirus encoding shATG5 or shCtrl and transfected with Myc‐MOAP‐1.
- Inhibition of the auto‐lysosomal degradation pathway does not prevent MOAP‐1‐mediated reduction of the p62 bodies. MOAP‐1 KO LO2 cells were pre‐treated with auto‐lysosome inhibitors chloroquine (CQ) (10 µM) or BafA1 (1 µM) for 3 h, before being transfected with Myc‐MOAP‐1 for 24 h in the presence of CQ or BafA1 and subjected to immunofluorescence using anti‐p62 (in red) and anti‐Myc (in green) antibodies. Cells expressing Myc‐MOAP‐1 were marked by dashed lines.
- Quantification of the p62 bodies in the MOAP‐1 KO LO2 cells pre‐treated with CQ or BafA1 before being transfected with Myc‐MOAP‐1 or empty vector control. (Upper panel) number of p62 bodies per cell. n = 5 independently plated samples. (Lower panel) size of p62 bodies. n = 362 (Ctrl, BafA1), 226 (Myc‐MOAP‐1, BafA1), 544 (Ctrl, CQ), and 266 bodies (Myc‐MOAP‐1, CQ), from three independently plated samples.
- Western blotting of lysates from MOAP‐1 KO LO2 cells pre‐treated with CQ or BafA1 and transfected with Myc‐MOAP‐1.
Data information: In (A, D), nuclei were counterstained with DAPI (blue), scale bar: 10 µm. In (B, E), error bars represent SEM. *P < 0.05, **P < 0.01, ***P < 0.001, ns, not significant, Student’s t‐test.
Source data are available online for this figure.
p62 bodies are targeted for autophagy‐lysosomal degradation through direct recruitment of LC3 (Komatsu et al, 2007; Pankiv et al, 2007). To determine whether MOAP‐1 deficiency alters recruitment of LC3 to the p62 bodies, we analyzed the colocalization of p62 and LC3 in the LO2 cells in the presence or absence of MOAP‐1. GFP‐tagged LC3 appeared to colocalize with p62 bodies to similar degree in both WT and MOAP‐1‐deficient LO2 cells (Appendix Fig S3A). We then examined the colocalization of endogenous LC3 and p62 bodies. In contrast to GFP‐LC3, endogenous LC3 appeared to be poorly localized with the p62 bodies in both WT and MOAP‐1 KO LO2 cells (Appendix Fig S3B). This discrepancy could be due to sensitivity of the antibodies (anti‐GFP vs. anti‐LC3) used. Nevertheless, this observation may suggest that the increase in the levels of p62 bodies in the MOAP‐1‐deficient cells is not likely due to alteration in the recruitment of LC3 to the p62 bodies. Moreover, LAMP1, which is a lysosome‐resident protein frequently used as a marker for lysosome (Klionsky et al, 2016), did not appear to localize in close proximity with the p62 bodies in both the WT and MOAP‐1‐deficient cells (Appendix Fig S3C).
MOAP‐1 interferes with the liquid–liquid phase separation of p62
p62 bodies were recently shown to possess liquid‐like properties through liquid–liquid phase separation (Sun et al, 2018; Zaffagnini et al, 2018; Yang et al, 2019; Sanchez‐Martin et al, 2020). As phase‐separated condensates, p62 bodies appeared as spherical in shape and could grow in size through fusion (Sun et al, 2018). The spherical shape of p62 bodies observed in the LO2 and liver cancer cells (Fig 1) implies that these p62 bodies share the property of phase‐separated liquid droplets. We evaluated the nature of the p62 bodies in the LO2 cells by expressing red fluorescent protein (RFP)‐tagged p62 under live imaging. RFP‐p62 bodies were readily detected in the WT LO2 cells under resting state (Fig 4A). We reasoned that this was due to overexpression of RFP‐p62 that had crossed the saturation concentration in the LO2 cells, leading to its phase condensation and appearance of p62 bodies. Nevertheless, the exogenous RFP‐p62 bodies were larger in size in the MOAP‐1 KO cells in comparison with the WT LO2 cells, despite their comparable levels of expression (Fig 4A–C). These p62 bodies appeared to be liquid‐like and constantly underwent fusion and fission in both WT and MOAP‐1‐deficient LO2 cells (Fig 4D and E). Interestingly, the fluorescence signal of RFP‐p62 recovered at a reduced rate after photobleaching in the MOAP‐1 KO LO2 cells (Fig 4F and G). In contrast, the fluorescence signal of RFP‐p62 recovered at a significantly increased rate after photobleaching in the HepG2 cells overexpressing GFP‐MOAP‐1 than those expressing the GFP control (Fig 4H and I). These data suggest that MOAP‐1 positively regulates the rate of the exchange of RFP‐p62 in the p62 bodies.
Figure 4. Liquid–liquid phase separation of p62 is affected by MOAP‐1.

-
ALarger RFP‐p62 bodies in the MOAP‐1‐deficient cells. WT and MOAP‐1 KO LO2 cells were transfected with expression vector encoding RFP‐tagged p62. 16 h later, cells were subjected to live imaging analysis. Z‐stacks of the confocal images were flattened as maximal intensity projections. Scale bar: 5 µm.
-
BQuantification of size of RFP‐p62 bodies in WT and MOAP‐1 KO LO2 cells. n = 129 and 161 bodies in the WT and MOAP‐1 KO cells, respectively, from three independently plated samples. ***P < 0.001, Student’s t‐test.
-
CWestern analysis of lysates of the WT and MOAP‐1 KO LO2 cells transfected with expression vector encoding RFP‐tagged p62 as in (A).
-
D, ERFP‐p62 bodies exhibit fusion (D) and fission (E) characteristics of liquid droplets. WT and MOAP‐1 KO LO2 cells were transfected with expression vector encoding RFP‐tagged p62 and 14 h later, cells were analyzed by live imaging to visualize the dynamics of RFP‐p62 bodies. Scale bar: 2 µm
-
FLoss of MOAP‐1 leads to slower exchange of p62 in the RFP‐p62 bodies. WT and MOAP‐1 KO LO2 cells transfected with expression vector encoding RFP‐tagged p62. 14 h later, cells were subjected to the fluorescence recovery after photobleaching (FRAP) assay. Scale bar: 2 µm.
-
GQuantification of the rate of fluorescence recovery of RFP‐p62 in WT and MOAP‐1 KO cells. n = 5 samples.
-
HOverexpression of GFP‐MOAP‐1 but not GFP leads to increased exchange of p62 in the RFP‐p62 bodies. HepG2 cells were transfected with expression vector encoding RFP‐tagged p62 and GFP‐tagged MOAP‐1 or GFP only control and 14 h later, cells were subjected to FRAP assay. Scale bar: 2 µm.
-
IQuantification of the rate of fluorescence recovery of RFP‐p62 in HepG2 cells co‐expressing GFP‐MOAP‐1 or GFP. n = 5 samples.
-
JRe‐introduction of MOAP‐1 disrupts the spherical structure of p62 bodies in the MOAP‐1‐deficient LO2 cells. MOAP‐1 KO LO2 cells were transfected with expression vector encoding Myc‐MOAP‐1 and harvested at 14‐ or 24‐h post‐transfection for IF analysis using anti‐p62 (in red) and anti‐Myc (in green) antibodies. Insets were enlarged in the lower panels. Scale bar: 2 µm.
Data information: In (B, G, I), error bars represent SEM. (G,I) *P < 0.05, **P < 0.01, two‐way ANOVA.
Source data are available online for this figure.
In the LO2 cells co‐expressing RFP‐p62 and GFP‐MOAP‐1 for a prolonged period of time, however, RFP‐p62 no longer appeared as spherical bodies, but appeared to be diffusely distributed in the cytosol (Fig EV2A), suggesting that overexpression of MOAP‐1 may interfere with the liquid phase condensation of RFP‐p62. Moreover, in the MOAP‐1 KO LO2 cells that contained high basal levels of p62 bodies, upon re‐introduction of MOAP‐1, many of the p62 bodies appeared to have lost the spherical shape and became deformed (Fig 4J). The levels of the p62 bodies in these cells were reduced significantly at a later time point, with the remnants appeared to dissociate into smaller and asymmetrical entities (Fig 4J). In Huh1 cells which had high abundance of p62 bodies in spherical shape, overexpression of MOAP‐1 also led to their deformation and disintegration a few hours before they became diffuse at 24 h post‐transfection (Fig EV2B and C). Thus, it is likely that upon overexpression of MOAP‐1, disintegration of p62 bodies proceeds from spherical, phase‐separated to smaller, asymmetrical states, before transforming into diffuse patterns in the cytosol.
Figure EV2. Overexpression of MOAP‐1 disrupts the spherical structure of p62 bodies.

- Liquid phase condensation of p62 is impaired in the cells overexpressing MOAP‐1. LO2 cells were transfected with expression vectors encoding RFP‐p62 with or without GFP‐MOAP‐1 for 24 h. Scale bar: 5 µm.
- Huh1 cells were transfected with expression vector encoding Myc‐MOAP‐1 or empty vector (EV), and harvested at 18‐ or 24‐h post‐transfection for IF analysis using anti‐p62 (in red) and anti‐Myc (in green) antibodies. Insets were enlarged in the lower panels. Nuclei were stained with DAPI (in blue). Scale bar: 5 µm.
- Quantification of the p62 bodies in the Huh1 cells transfected with empty vector (EV) or Myc‐MOAP‐1 for 18 or 24 h as described in (B). (Left panel) number of p62 bodies per cell. n = 7 independently plated samples. (Right panel) size of p62 bodies. n = 77, 91, and 22 bodies detected in the EV, Myc‐MOAP‐1 transfected cells at 18‐ and 24‐h post‐transfection, respectively, from three independently plated samples. Error bars represent SEM. **P < 0.01, ***P < 0.001, ns, not significant, Student’s t‐test.
MOAP‐1 interacts with p62 and the interaction is enhanced by stress signals
To address the mechanism by which MOAP‐1 promotes dissociation of the p62 bodies, we first checked whether MOAP‐1 regulates K63‐linked poly‐ubiquitylation of p62, which was previously proposed to inhibit p62 aggregation (Pan et al, 2016). MOAP‐1 deficiency did not alter K63‐linked poly‐ubiquitylation of p62 under basal condition (Appendix Fig S4A). Similarly, no difference in the K63‐linked poly‐ubiquitylation of p62 was observed between WT and MOAP‐1 KO LO2 cells treated with the proteasome inhibitor MG132, which stimulated K63‐linked ubiquitylation of p62 (Appendix Fig S4A). No difference was noted in the protein levels of TRIM21 (Appendix Fig S4A), which is the E3 ligase that conjugates the K63‐linked ubiquitin chains to p62 (Pan et al, 2016). Recently, K63‐linked poly‐ubiquitin chain and p62‐interacting proteins such as DAXX, NBR1, and TAK1 were shown to facilitate formation of p62 bodies (Sun et al, 2018; Zaffagnini et al, 2018; Kehl et al, 2019; Yang et al, 2019; Sanchez‐Martin et al, 2020). To evaluate whether MOAP‐1 regulates p62 bodies through influencing the interaction of p62 with these proteins, we performed co‐immunoprecipitation (co‐IP) experiments on HepG2 cells stably overexpressing Myc‐MOAP‐1 or Myc‐only control. Treatment with MG132, which is known to stimulate p62 bodies formation, was included in the analysis. Higher levels of these proteins were found to bind to p62 in cells treated with MG132. However, this could be due to upregulation of the p62 protein as a result of proteasomal inhibition (Appendix Fig S4B). No notable difference was observed in the interaction of p62 with DAXX, NBR1, TAK1, or K63‐linked poly‐ubiquitin chain upon overexpression of MOAP‐1 under basal or MG132‐treated condition (Appendix Fig S4B). K48‐linked poly‐ubiquitin chain, which was previously reported to be less efficient in driving p62 bodies formation than K63‐linked poly‐ubiquitin chain (Zaffagnini et al, 2018), was also found to bind to p62 and with higher abundance upon MG132 treatment in both Myc‐MOAP‐1 overexpressing and control HepG2 cells (Appendix Fig S4B).
We then determined whether MOAP‐1 regulates p62 bodies through association with p62. Proximity ligation, co‐IP, and in vitro binding assays confirmed the interaction between MOAP‐1 and p62 in the LO2 cells and liver in vivo (Figs 5A and B, and EV3A–C, Appendix Fig S4B). Interestingly, MOAP‐1/p62 interaction could be further enhanced by treatment with DEN, arsenic trioxide or MG132 (Figs 5A and EV3B–D, Appendix Fig S4B). MOAP‐1 has no clearly defined domains apart from a putative BH3‐like motif (Fig 5C), which is required for mediating its pro‐apoptotic function through interaction with Bax and MTCH2 (Tan et al, 2001; Tan et al, 2016). Mutation of this BH3‐like motif, referred to as L120E, did not affect MOAP‐1/p62 interaction (Fig 5B). To map the region of MOAP‐1 required for mediating its interaction with p62, we carried out mutagenesis analysis of MOAP‐1. Only the truncated mutants harboring the amino acids (aa)1‐190, aa1‐255, aa1‐300, aa60‐351, and aa115‐351 of MOAP‐1 were able to interact with p62 (Appendix Fig S5A), suggesting that the aa115‐190 region is important for mediating MOAP‐1/p62 interaction. Indeed, the fragments of MOAP‐1 spanning aa115‐255 and aa115‐190 were sufficient to bind to p62 (Appendix Fig S5B). Further analysis using a series of deletion mutants in the aa120‐210 region showed that aa150‐190 of MOAP‐1 is critical for mediating the interaction with p62 (Appendix Fig S5C). Protein sequence alignment among MOAP‐1 from multiple species was conducted to identify the conserved amino acids in this region of MOAP‐1 across several mammalian species (Fig 5C). Notably, three short sequences consisting of positively or negatively charged amino acids were identified in the aa150–190 region of MOAP‐1. Among these sequences, the positively charged residues (KRRR, marked as M1) were previously found to mediate intramolecular interaction of MOAP‐1 by binding to its negatively charged residues (EEEF, marked as M2) (Fig 5C; Baksh et al, 2005). Alanine substitution mutation analysis was then performed to determine the requirement of any of these charged amino acids for mediating MOAP‐1 interaction with p62. Interestingly, alanine substitution of the positively charged residues in the KYKKLR sequence (marked as M3), but not in the other two sequences (M2 and M1), abolished the interaction with p62 (Fig 5B and C). This may suggest that MOAP‐1/p62 binding might require electrostatic interaction conferred by the KYKKLR sequence. The p62‐binding‐defective mutant of MOAP‐1, hereon referred to as the MOAP‐1‐M3, also failed to localize at the p62 bodies (Fig 5D), nor was effective in increasing the rate of exchange of RFP‐p62 in the p62 bodies after photobleaching in contrast to MOAP‐1 (Fig 5E–G). MOAP‐1‐M3 was able to enhance TNFα‐induced apoptosis in an indistinguishable manner from MOAP‐1 (Baksh et al, 2005), suggesting that MOAP‐1‐M3 still retains its function in facilitating apoptosis signaling. To evaluate the significance of the MOAP‐1/p62 interaction in regulating p62 bodies, we compared the effectiveness of MOAP‐1 and MOAP‐1‐M3 on affecting the levels of the p62 bodies. Unlike MOAP‐1 and its other p62‐binding‐competent mutants (L120E, M1, and M2), the p62‐binding‐defective MOAP‐1‐M3 failed to reduce p62 bodies in the MOAP‐1‐deficient LO2 cells (Fig 5H–J, Appendix Fig S5D and E).
Figure 5. MOAP‐1 associates with p62 to promote dissociation of the p62 bodies.

- MOAP‐1 associates with p62 and their interaction is enhanced by DEN‐mediated stress. LO2 cells transfected with Myc‐MOAP‐1 were treated with or without diethylnitrosamine (DEN) (200 µM) for 12 h and subjected to Duolink proximity ligation assay using anti‐p62 and anti‐Myc antibodies. Red dots represent MOAP‐1/p62 interaction. Scale bar: 5 µm.
- Alanine substitution of positively charged residues in the KYKKLR sequence of MOAP‐1 abolishes its interaction with p62. Replacement of the positively charged residues in the KYKKLR sequence of MOAP‐1 with alanine (referred to as the M3 mutant) disrupts MOAP‐1/p62 interaction, whereas alanine substitution in the neighboring region of positively charged KRRR (M1 mutant) and negatively charged EEE (M2 mutant) has no effect. LO2 cells were transfected with plasmid encoding Myc‐MOAP‐1 or the indicated alanine mutants together with plasmid encoding Flag‐p62. The cells were then subjected to co‐IP assay with anti‐Myc antibody.
- Schematics of the amino acid (aa) residues in the aa115‐208 region of MOAP‐1 across the indicated mammalian species. Red boxes depicting location of positively or negatively charged residues of MOAP‐1 subjected to mutagenesis to alter positively charged residues in the KYKKLR sequence (aa161‐166.) (MOAP‐1‐M3), the KRRR sequence (aa202‐205) (MOAP‐1‐M1) and the negatively charged residues in the EEE sequence (aa178‐180) (MOAP‐1‐M2) to alanine.
- MOAP‐1, but not its p62‐binding‐defective mutant, MOAP‐1‐M3, localizes at the p62 bodies. MOAP‐1 KO LO2 cells were transfected with plasmid encoding Myc‐MOAP‐1 or Myc‐MOAP‐1‐M3 mutant. The transfected cells were harvested at 14 h post‐transfection, which is the time point that localization of MOAP‐1 at the p62 bodies was readily detected. IF analysis was performed on these cells using anti‐p62 (red) and anti‐Myc (green) antibodies. Arrowheads indicate colocalization between Myc‐MOAP‐1 and p62 bodies. Scale bar: 5 µm.
- MOAP‐1 but not the MOAP‐1‐M3‐mutant promotes the exchange of RFP‐p62 in the p62 bodies. WT LO2 cells transfected with expression vector encoding RFP‐tagged p62 and GFP‐tagged MOAP‐1 or MOAP‐1‐M3. At 14 h post‐transfection, cells were subjected to FRAP assay. Scale bar: 2 µm.
- Quantification of the rate of fluorescence recovery of RFP‐p62 in cells co‐expressing GFP‐MOAP‐1 or GFP‐MOAP‐1‐M3 mutant. n = 6 samples. Error bars represent SEM. *P < 0.05, **P < 0.01, ns, not significant, two‐way ANOVA.
- Western analysis of lysates of the WT LO2 cells transfected with expression vector encoding RFP‐tagged p62 and GFP‐tagged MOAP‐1 or MOAP‐1‐M3 as described in (E).
- Re‐expression of MOAP‐1, but not the MOAP‐1‐M3 mutant, reduces the levels of p62 bodies. MOAP‐1 KO LO2 cells were transfected with plasmid encoding Myc‐MOAP‐1 or Myc‐MOAP‐1‐M3. The transfected cells were harvested at 24 h post‐transfection, which is the time point that MOAP‐1 was found to effectively downregulate p62 bodies, followed by IF analysis as in (D). Cells expressing Myc‐MOAP‐1 or Myc‐MOAP‐1‐M3 were marked by dashed lines. Scale bar: 10 µm.
- Quantification of the p62 bodies in the MOAP‐1 KO LO2 cells expressing Myc‐MOAP‐1 and Myc‐MOAP‐1‐M3 mutant. (Left panel) number of p62 bodies per cell. n = 7 independently plated samples. (Right panel) size of p62 bodies. n = 107 and 267 bodies detected in the MOAP‐1 KO LO2 cells expressing Myc‐MOAP‐1 and Myc‐MOAP‐1‐M3 mutant, respectively, from three independently plated samples. Error bars represent SEM. ***P < 0.001, Student’s t‐test.
- Western blotting of MOAP‐1 KO LO2 cells transfected with plasmid encoding Myc‐MOAP‐1 or Myc‐MOAP‐1‐M3 mutant as described in (H).
Data information: In (A, D, H), nuclei were stained with DAPI (blue).
Source data are available online for this figure.
Figure EV3. MOAP‐1 interacts with p62 and the interaction is enhanced by treatment with DEN or arsenic trioxide.

-
AMOAP‐1 binds p62 in vitro. Recombinant proteins of MOAP‐1 and GST‐p62 or GST control (1µg each) were incubated for 2 h and the mixture was subjected to GST pull‐down. Eluates from the pull‐down and input (1% of the pre‐pull‐down mixtures) were analyzed by Western blotting or SDS–PAGE followed by Coomassie Brilliant Blue (CBB) staining to detect GST and GST‐p62 proteins in the pull‐down.
-
B, CCo‐IP assay performed on the LO2 cells treated with or without diethylnitrosamine (DEN, 200 µM) for the indicated times (B) or liver lysates prepared from wild‐type mice injected with PBS or DEN (100 µg/g body weight) for 48 h (C). TCL, total cell lysates.
-
DCo‐IP assay performed on the MEFs treated with As2O3 (10 µM) for the indicated period of times.
MOAP‐1 disassembles the p62 bodies through binding to the region spanning the PB1 and ZZ domains of p62
Aggregation of p62 requires self‐oligomerization (Lamark et al, 2003; Wilson et al, 2003). Hence, MOAP‐1‐mediated dissociation of p62 bodies can potentially be achieved through disrupting the ability of p62 to maintain in oligomeric state. Indeed, overexpression of MOAP‐1 inhibited homo‐dimerization of p62 (Fig 6A). In contrast, loss of MOAP‐1 resulted in elevation of the dimerization activity of p62 (Fig 6B and C). Re‐expression of the WT MOAP‐1, but not MOAP‐1‐M3, reduced levels of the p62 oligomerization in the MOAP‐1‐deficient cells (Fig 6D and E). Self‐oligomerization of p62 is known to be mediated through electrostatic interaction of its N‐terminal PB1 domain (Lamark et al, 2003; Wilson et al, 2003; Moscat et al, 2006). The p62 mutant lacking the PB1 domain (referred to as ΔPB1) failed to oligomerize and form p62 bodies (Figs 6A and EV4A). Recently, binding between type‐1 and type‐2 N‐terminal degrons and the Zinc Finger (ZZ) domain of p62 was also shown to allosterically promote self‐oligomerization and aggregation of p62 (Cha‐Molstad et al, 2015; Cha‐Molstad et al, 2017; Zhang et al, 2018). Interestingly, both the PB1 and ZZ domains of p62 appeared to be required for mediating its association with MOAP‐1 (Fig 6F). In contrast to the ΔPB1 mutant, both K7A and D69A point mutants in the PB1 domain of p62, which are defective in self‐oligomerization and formation of p62 bodies (Lamark et al, 2003; Wurzer et al, 2015), could still interact with MOAP‐1 under basal conditions (Fig EV4B). Interestingly, unlike the WT p62, their interaction with MOAP‐1 was not enhanced by DEN treatment (Fig EV4C), suggesting that the ability of p62 to oligomerize is a pre‐requisite for the stimulatory effect by DEN on promoting MOAP‐1/p62 interaction. To determine whether the PB1 and ZZ domains are sufficient for mediating interaction with MOAP‐1, fragments of p62 containing PB1, ZZ and PB1‐ZZ were tested for their ability to interact with MOAP‐1. While neither PB1 nor ZZ domain alone seemed to interact with MOAP‐1, the fragment encompassing both the PB1 and ZZ domains (referred to as PB1‐ZZ) interacted with MOAP‐1 efficiently (Fig 6G). In contrast to the PB1‐ZZ fragment, the fragment of p62 encompassing the LC3 interacting region (LIR) and Keap1 interacting region (KIR) failed to interact with MOAP‐1. While the PB1‐ZZ fragment was sufficient for mediating self‐oligomerization, it was not as efficient as the full‐length protein in forming p62 bodies (Figs 6H, and EV4A), as it lacked the UBA domain that is also required for p62 bodies formation (Bjorkoy et al, 2005). The homo‐dimerization of the PB1‐ZZ fragment, however, could be effectively disrupted by overexpression of MOAP‐1 (Fig 6H). Together, these data suggest that MOAP‐1 acts to disrupt the oligomeric state of p62 through interacting with the region spanning its PB1 and ZZ domains.
Figure 6. MOAP‐1 disrupts self‐oligomerization of p62 through binding to its N‐terminal PB1‐ZZ domains.

- Overexpression of MOAP‐1 inhibits dimerization of p62. p62 KO LO2 hepatocytes were transfected with the indicated plasmids. 24 h later, cell lysates were subjected to co‐IP assay with anti‐Myc antibody. PB1 deletion (ΔPB1) mutant, which is impaired in p62 oligomerization, is included as a control. TCL, total cell lysates.
- Dimerization of p62 is enhanced in the MOAP‐1‐deficient cells. cells. WT and MOAP‐1 KO LO2 cells were transfected with plasmids encoding Flag‐tagged and Myc‐tagged p62 or empty vector. 24 h post‐transfection, cells were harvested, lysed and the cell lysates were subjected to co‐IP assay with anti‐Myc antibody.
- Quantification of the levels of Flag‐p62 bound to Myc‐p62 in the co‐IP experiment as described in (B) by densitometric analysis.
- Re‐expression of MOAP‐1, but not the p62‐binding‐defective mutant, MOAP‐1‐M3, reduces p62 oligomerization in the MOAP‐1 KO LO2 hepatocytes. WT and MOAP‐1 KO LO2 cells were transfected with plasmids encoding His‐tagged p62 and Myc‐MOAP‐1 or Myc‐MOAP‐1‐M3 and 24 h later, subjected to His‐pull‐down and cross‐linking using DSSO.
- Quantification of the levels of p62 oligomer depicted in (D) by densitometric analysis.
- The region of p62 spanning the PB1 and ZZ domains is required for mediating its interaction with MOAP‐1. p62 KO LO2 cells were transfected with plasmids encoding Myc‐p62 or the indicated deletion mutants and Flag‐MOAP‐1 for 24 h. The transfected cells were subjected to co‐IP assay with anti‐Myc antibody. (Lower panel) Schematics depicting the domains in p62. PB1, Phox, and Bem1p; ZZ, Zinc Finger; TB, TRAF6‐binding domain; KIR, Keap1 interacting region; LIR, LC3 interacting region; UBA, ubiquitin‐associated domain.
- The fragment encompassing the PB1 and ZZ domains of p62 is sufficient for mediating its interaction with MOAP‐1. p62 KO LO2 cells were transfected with plasmids encoding Myc‐p62 or the indicated fragments and Flag‐MOAP‐1. 24 h later, the transfected cells were subjected to co‐IP assay with anti‐Myc antibody.
- MOAP‐1 binds and inhibits homo‐dimerization of the PB1‐ZZ fragment. p62 KO LO2 cells were transfected with plasmids encoding Myc‐and Flag‐tagged PB1‐ZZ in the absence or presence of HA‐tagged MOAP‐1 for 24 h and subjected to co‐IP assay with anti‐Myc antibody.
Data information: (C, E) Error bars represent SEM. *P < 0.05, **P < 0.01, Student’s t‐test. Averages of three independent experiments were presented, relative to the levels detected in the WT cells.
Source data are available online for this figure.
Figure EV4. Oligomerization of p62 is a pre‐requisite for its enhanced interaction with MOAP‐1 under DEN conditions.

- The fragment of p62 encompassing the PB1 and ZZ domains is not fully competent in forming aggregates compared to the full‐length p62, while the mutant of p62 lacking the PB1 domain and the K7A and D69A mutants all fail to form aggregates. p62 KO LO2 hepatocytes were transfected with Myc‐p62 or the indicated mutants for 24 h and subjected to immunofluorescence using anti‐Myc antibody (in red). Nuclei were stained with DAPI (in blue). Scale bar: 10 µm.
- The K7A and D69A mutants of p62, which fail to oligomerize, retained their ability to interact with MOAP‐1. p62 KO LO2 hepatocytes were transfected with Myc‐p62 or the indicated mutants and Flag‐MOAP‐1 for 24 h and subjected to co‐IP assay using anti‐Myc antibody. TCL, total cell lysates.
- DEN treatment enhances interaction between MOAP‐1 and p62, but not the K7A and D69A mutants. p62 KO LO2 hepatocytes were transfected with Myc‐p62 or the indicated mutants and Flag‐MOAP‐1 for 24 h and treated with diethylnitrosamine (DEN, 200 µM) for 12 h before being subjected to co‐IP assay using anti‐Myc antibody.
Hyperactivation of the p62‐mediated Nrf2 antioxidant signaling in the absence of MOAP‐1
Upregulation of p62 bodies is known to facilitate sequestration of Keap1, an adaptor protein for the cullin‐3 E3‐ubiquitin ligase complex that targets Nrf2 for proteasomal degradation (Komatsu et al, 2010; Lau et al, 2010). Upon disengagement from Keap1, Nrf2 is stabilized, followed by its translocation to nucleus to confer activation of its target genes (Saito et al, 2016). Increased recruitment of Keap1 to the p62 bodies, Keap1/p62 binding, accompanied by concomitant decrease in Keap1/Nrf2 interaction was observed in the MOAP‐1‐deficient LO2 cells (Fig 7A–E). Consequently, elevated levels of nuclear Nrf2 and mRNA transcripts of Nrf2‐controlled antioxidant and metabolic genes (HMOX‐1, NQO1, SLC7A11, GCLC, and G6PD) were also detected in these MOAP‐1‐deficient cells (Fig 7F–H). Similarly, an increase in the recruitment of Keap1 to p62 bodies and in the levels of Nrf2 target genes were also observed in the MOAP‐1‐deficient HeLa cells (Fig EV5A and B). In MEFs, loss of MOAP‐1 led to a significant increase in the levels of HMOX‐1 upon exposure to As2O3, but not under resting state (Fig EV5C). To validate the regulatory role of MOAP‐1 in suppressing the Nrf2 signaling, transcriptional activity of Nrf2 was evaluated by using the Nrf2‐antioxidant response element (ARE) luciferase reporter in the WT and MOAP‐1‐deficient LO2 cells. Absence of MOAP‐1 markedly enhanced basal transcriptional activity of Nrf2 (Fig EV5D). Deletion of p62 effectively blocked the upregulation of Nrf2 signaling detected in the MOAP‐1‐deficient cells (Figs 7I and EV5D), confirming that heightened activation of Nrf2 signaling in the absence of MOAP‐1 is dependent on p62. Furthermore, re‐introduction of MOAP‐1, but not MOAP‐1‐M3, into the MOAP‐1 KO LO2 cells, effectively inhibited the recruitment of Keap1 to the p62 bodies, Keap1/p62 interaction and downregulated transcriptional activity of Nrf2 (Figs 7J and K, and EV5E–K). Like MOAP‐1, the apoptosis signaling‐defective mutant, MOAP‐1‐L120E, was equally effective as MOAP‐1 in displacing binding of Keap1 from p62 and suppressing Nrf2 activity (Fig 7J and K). Together, these findings suggest that MOAP‐1 directly regulates p62‐Keap1‐Nrf2 signaling through binding to p62 to disrupt its function in sequestering Keap1, thereby negatively regulating the activity of Nrf2.
Figure 7. Loss of MOAP‐1 promotes p62‐mediated hyperactivation of Nrf2.

- Increased recruitment of Keap1 to p62 bodies in the MOAP‐1‐deficient LO2 cells. WT and MOAP‐1 KO LO2 cells were subjected to IF analysis with anti‐Keap1 (green) and anti‐p62 (red) antibodies. Insets in the upper panels are enlarged in the lower panels. Nuclei were counterstained with DAPI (in blue). Scale bar: 5 µm.
- MOAP‐1 deficiency promotes p62/Keap1 interaction. WT, MOAP‐1 KO, and p62 KO LO2 cells were subjected to co‐IP assay using anti‐p62 antibody. TCL, total cell lysates.
- Quantification of the levels of Keap1 bound to p62 in the co‐IP experiment as described in (B) by densitometric analysis.
- Diminished Keap1/Nrf2 interaction in the absence of MOAP‐1. WT and MOAP‐1 KO LO2 cells were subjected to Duolink PLA using anti‐Keap1 and anti‐Nrf2 antibodies. Red dots represent Keap1/Nrf2 interaction. Nuclei were counterstained with DAPI (in blue). Scale bar: 10 µm.
- Quantification of the Duolink signals depicted in (D). Duolink signals were quantified by ImageJ analysis and normalized to the number of nuclei.
- Loss of MOAP‐1 results in marked elevation of nuclear Nrf2. WT and MOAP‐1 KO LO2 cells were subjected to IF analysis with anti‐Nrf2 (in green) and anti‐p62 (in red) antibodies. Scale bar: 10 µm.
- Quantification of nuclear levels of Nrf2 in (F). The mean gray values of Nrf2 fluorescence signals were quantified by ImageJ analysis.
- MOAP‐1 deficiency promotes activation of Nrf2 signaling. Transcript levels of downstream targets of Nrf2 (HMOX‐1, NQO1, SLC7A11, GCLC, and G6PD) in WT and MOAP‐1 KO LO2 cells were determined by RT–PCR and normalized to GAPDH.
- Elevated transcriptional activity of Nrf2 in the MOAP‐1‐deficient cells is mediated through p62. Transcript levels of Nrf2 target genes (HMOX‐1 and NQO1) in WT, MOAP‐1 KO and MOAP‐1/p62 DKO LO2 cells were determined by RT–PCR and normalized to GAPDH.
- Re‐expression of MOAP‐1 and MOAP‐1‐L120E, but not the p62‐binding‐defective mutant of MOAP‐1, MOAP‐1‐M3, inhibits p62/Keap1 interaction in the MOAP‐1 deficient cells. MOAP‐1 KO LO2 cells were transfected with plasmid encoding Myc‐tagged MOAP‐1, L120E or M3. The transfected cells were then subjected to co‐IP assay with anti‐p62 antibody.
- Re‐introduction of MOAP‐1 and MOAP‐1‐L120E, but not the p62‐binding‐defective MOAP‐1‐M3, reduces Nrf2 transcriptional activity in the MOAP‐1 KO cells. MOAP‐1 KO LO2 cells were transfected with Myc‐tagged MOAP‐1, MOAP‐1‐L120E or MOAP‐1‐M3 and ARE‐Nrf2‐firefly and renilla luciferase reporter constructs for overnight and subjected to luciferase assay.
Data information: In (C, E, G, H, I, K), error bar represents SEM. *P < 0.05, **P < 0.01, ***P < 0.001, ns, not significant, Student’s t‐test, in comparison with the WT cells. Averages of three independent experiments were presented, relative to the levels detected in the WT cells.
Source data are available online for this figure.
Figure EV5. Loss of MOAP‐1 promotes p62‐dependent activation of Nrf2.

- Increased recruitment of Keap1 to the p62 bodies in the MOAP‐1 KO HeLa cells. WT and MOAP‐1 KO HeLa cells were subjected to IF analysis with anti‐Keap1 (green) and anti‐p62 (red) antibodies. Insets in the upper panels are enlarged in the lower panels. Nuclei were counterstained with DAPI (in blue). Scale bar: 5 µm.
- MOAP‐1 deficiency promotes activation of Nrf2 signaling in HeLa cells. Transcript levels of downstream targets of Nrf2 (HMOX‐1, NQO1, SLC7A11, GCLC, and G6PD) in WT and MOAP‐1 KO HeLa cells were determined by RT–PCR and normalized to GAPDH.
- Increased levels of HMOX1 in MOAP‐1 KO MEFs upon treatment with arsenic trioxide. WT and MOAP‐1 KO MEFs were treated with As2O3 (10 µM) for the indicated hours and cells were harvested for Western blotting.
- Elevated transcriptional activity of Nrf2 in the MOAP‐1‐deficient cells is mediated through p62. WT, MOAP‐1 KO, and MOAP‐1/p62 double KO (DKO) LO2 cells were transfected with antioxidant response element (ARE)‐firefly luciferase and renilla luciferase reporter constructs for overnight and subjected to dual luciferase assay. Normalized firefly to renilla luciferase activities in relative to that of untreated WT were plotted.
- Re‐expression of MOAP‐1, but not the p62‐binding‐defective MOAP‐1‐M3 mutant, reduces the recruitment of Keap1 to p62 bodies in the MOAP‐1‐deficient LO2 cells. MOAP‐1 KO LO2 cells stably expressing GFP‐MOAP‐1 or GFP‐MOAP‐1‐M3 were subjected to IF analysis with anti‐Keap1 (green) and anti‐p62 (red) antibodies. Insets in the upper panels are enlarged in the lower panels. Nuclei were counterstained with DAPI (in blue). Scale bar: 5 µm.
- Re‐expression of MOAP‐1, but not the MOAP‐1‐M3 mutant, restores the Keap1/Nrf2 interaction in the MOAP‐1 KO LO2 cells. MOAP‐1 KO LO2 cells stably expressing GFP‐MOAP‐1 or GFP‐MOAP‐1‐M3 were subjected to Duolink proximity ligation assay using anti‐Keap1 and anti‐Nrf2 antibodies. Red dots represent Keap1/Nrf2 interaction. Nuclei were counterstained with DAPI (in blue). Scale bar: 10 µm.
- Quantification of the Duolink signals as described in (F). Duolink signals were quantified by ImageJ analysis and normalized to the number of nuclei.
- Re‐introduction of MOAP‐1, but not the MOAP‐1‐M3 mutant, reduces nuclear levels of Nrf2 in the MOAP‐1 KO LO2 cells. MOAP‐1 KO LO2 cells stably expressing GFP‐MOAP‐1 or GFP‐MOAP‐1‐M3 were subjected to IF analysis with the anti‐Nrf2 antibody. Scale bar: 10 µm.
- Quantification of nuclear levels of Nrf2 as described in (H). The mean gray values of Nrf2 fluorescence signals were quantified by ImageJ analysis.
- MOAP‐1, but not the M3 mutant, reduces the transcriptional activity of Nrf2 target genes. Transcript levels of downstream targets of Nrf2 (HMOX‐1, NQO1, SLC7A11, GCLC, and G6PD) in the MOAP‐1 KO LO2 cells stably expressing GFP‐MOAP‐1 or GFP‐MOAP‐1‐M3 were determined by RT–PCR and normalized to GAPDH.
- Western blotting of MOAP‐1 KO LO2 cells stably expressing GFP‐MOAP‐1 or GFP‐MOAP‐1‐M3 mutant as described in (E‐J).
Data information: In (B, D, G, I, J), error bar represents SEM. *P < 0.05, **P < 0.01, ***P < 0.001, ns, not significant, Student’s t‐test. Averages of three independent experiments were plotted.
MOAP‐1 deficiency results in elevation of tumor burden in the DEN‐mediated mouse liver cancer model
Acute DEN treatment was reported to induce p62 upregulation in the hepatocytes around the central veins in the liver (Umemura et al, 2016). In the liver of WT mice, increased levels of p62 in both diffuse and aggregated patterns around the central veins were noted (Fig 8A). Interestingly, a marked elevation in the levels of p62 bodies was seen in this region of the liver from the MOAP‐1‐deficient mice (Fig 8A). In agreement with the findings that MOAP‐1 deficiency resulted in elevated levels of p62 bodies without affecting total protein levels of p62 (Figs 2 and EV1), no significant changes in the total p62 protein levels in livers of the WT and MOAP‐1 KO mice injected with either PBS or an acute dose of DEN were observed (Fig 8B). However, an increase in the levels of p62 was noted in the detergent‐insoluble fraction of the liver lysates from MOAP‐1 KO mice subjected to the acute DEN treatment (Fig 8C), suggesting that MOAP‐1 deficiency can affect distribution of p62 in the insoluble inclusion bodies. Increased p62/Keap1 interaction and higher levels of Nrf2 and its downstream targets HMOX‐1 and NQO1 were also noted in the MOAP‐1 KO liver under acute DEN conditions (Fig 8B, Appendix Fig S6A and B).
Figure 8. MOAP‐1 deficiency results in increased p62 bodies, hyperactivation of Nrf2 and elevated tumor burden in the DEN‐mediated mouse liver cancer model.

-
AHigh level of p62 bodies in the liver of the MOAP‐1 KO mice subjected to acute diethylnitrosamine (DEN) treatment. Eight‐week‐old male WT and MOAP‐1 KO mice were injected with an acute dose of DEN (100 µg/g body weight). Mice were sacrificed at 48 h post‐injection. Livers were harvested for immunohistochemistry (IHC) analysis with anti‐p62 antibody (in red). Nuclei were counterstained with DAPI (in blue). Insets in the upper panels are enlarged in the lower panels. Scale bar: 20 µm.
-
BLoss of MOAP‐1 results in higher levels of Nrf2 and its downstream target protein, HMOX‐1, in liver upon acute DEN treatment. Lysates of the livers harvested from mice subjected to acute DEN treatment as described in (A) were prepared in RIPA lysis buffer containing 1% SDS and analyzed by Western blotting. Actin as loading control.
-
CMOAP‐1 deficiency elevates levels of p62 protein in the detergent‐insoluble fractions of the liver lysates from mice subjected to acute DEN treatment. Livers from mice injected as described in (A) were lysed in 1% Triton X lysis buffer, separated into detergent‐soluble (S) and insoluble (I) fractions and analyzed by Western blotting.
-
DHigh levels of p62 bodies detected in the tumors of the MOAP‐1 KO mice. Tumor sections from livers dissected from the 8.5‐month‐old male WT and MOAP‐1 KO mice injected with a single dose of DEN (25 µg/g body weight) at 15‐day‐old were subjected to IHC analysis with anti‐p62 antibody (in red). Nuclear were stained with DAPI (in blue). Insets were enlarged in the bottom right. Scale bar: 20 µm.
-
EQuantification of the p62 bodies in the WT and MOAP‐1 KO tumors. (Left panel) number of p62 bodies per cell. n = 7 tumors from the livers of WT and MOAP‐1 KO mice. (Right panel) size of p62 bodies. n = 456 and 1211 bodies detected in the WT and MOAP‐1 KO tumors, respectively, from three independent samples. Error bar represents SEM. *P < 0.05, ***P < 0.001, Student’s t‐test.
-
FIncreased levels of Nrf2 and its downstream target protein, HMOX‐1, in the MOAP‐1‐deficient tumors. While p62 protein is upregulated in the tumors compared to the adjacent non‐tumor tissues in both WT and MOAP‐1 KO livers, no significant difference is observed in the p62 protein levels between the WT and MOAP‐1 KO tumors. Lysates of the tumors and non‐tumor parts of the livers from mice injected with DEN as described in (D) were prepared in RIPA lysis buffer containing 1% SDS and subjected to Western blotting. Actin as loading control. P, PBS injected control; N, non‐tumor; T, tumor.
-
GUpregulation of mRNA levels of HMOX‐1 and NQO1 in the MOAP‐1‐deficient tumors. Livers harvested from the mice injected with PBS or DEN as described in (D) were subjected to RT–PCR analysis. n = 3 WT and 3 MOAP‐1 KO mice injected with the PBS control, and 8 WT and 9 MOAP‐1 KO mice injected with DEN. Error bar represents SEM. **P < 0.01, Student’s t‐test.
-
HMOAP‐1‐deficient mice bear higher tumor burden in the DEN‐mediated liver cancer model. Representative images of liver tumors dissected from the 8.5‐month‐old male WT and MOAP‐1 KO mice injected with a single dose of DEN (25 µg/g body weight) at 15‐day‐old. Scale bar: 5 mm.
-
IMeasurements of the number, maximum diameter of the tumor nodules and total liver weight from WT and MOAP‐1 KO mice (n = 13 and 14, respectively) injected with DEN as described in (H). Error bar represents SEM. **P < 0.01, ***P < 0.001, Student’s t‐test.
-
J, KMOAP‐1 deficiency promotes tumor initiation. Frequency of mice with macroscopic tumor nodules (J) and measurements of the number, diameter of the largest nodules and total liver weight (K) of the 4.5‐month‐old WT and MOAP‐1 KO mice (n = 18 and 23, respectively) injected with a single dose of DEN (25 µg/g body weight) at 15‐day‐old. (K) Error bar represents SEM. *P < 0.05, ns, not significant, Student’s t‐test.
Source data are available online for this figure.
Mice injected with a single dose of DEN at P15 were known to develop liver tumors robustly eight months post‐injection (Maeda et al, 2005). In line with the findings from cell lines and acute DEN model, significantly higher levels of the p62 bodies were readily observed in the tumors from MOAP‐1 KO mice in comparison to those in the WT counterpart (Fig 8D and E). While p62 protein levels appeared to be upregulated in the tumors in comparison to the adjacent hepatic tissues, no significant difference was observed in the p62 protein levels between the tumors from the WT and MOAP‐1 KO mice (Fig 8F). However, substantial elevation in the protein levels of Nrf2 and its downstream target, HMOX‐1, were observed in the tumors from the MOAP‐1 KO mice (Fig 8F). Likewise, mRNA levels of HMOX‐1 and NQO1 were also increased in the MOAP‐1 KO tumors (Fig 8G). In these MOAP‐1 KO mice, significantly higher liver tumor burden in comparison to the WT mice was observed (Fig 8H and I, Appendix Fig S6C). We then evaluated whether loss of MOAP‐1 might promote liver tumor development at the early stage. MOAP‐1 KO mice developed tumor nodules in the liver at a significantly higher incidence than the WT mice at four months post‐DEN‐injection (Fig 8J and K), suggesting that mice deficient in MOAP‐1 are more susceptible to tumor initiation. These findings collectively suggest a critical role of MOAP‐1 in downregulating p62 bodies and Nrf2 activity in liver exposed to DEN carcinogen, thereby reducing the susceptibility of mice to liver tumorigenesis induced by DEN.
Discussion
Increasing number of cell signaling proteins has been recently found to possess the ability to undergo phase separation to form membraneless organelles as a mechanism for eliciting rapid, adaptive and reversible responses upon exposure to stress (Alberti et al, 2019). The ability of p62 to form phase‐separated cytoplasmic bodies confers it a critical function in activating the p62‐Keap1‐Nrf2 signaling axis for mounting antioxidant defense against multiple types of cellular stress (Moscat et al, 2016; Yang et al, 2019; Sanchez‐Martin et al, 2020). Recently, poly‐ubiquitin chain and p62‐interacting proteins such as DAXX, NBR1 and TAK1 were reported to facilitate formation of p62 bodies (Sun et al, 2018; Zaffagnini et al, 2018; Kehl et al, 2019; Yang et al, 2019; Sanchez‐Martin et al, 2020), highlighting the complexity associated with the formation of the p62 bodies. Despite the advances toward understanding the functions and positive factors on the regulation of p62 bodies, less is known whether there is negative regulatory mechanism exerting its effect directly on the integrity of the p62 bodies as it is generally thought that p62 bodies are functionally inactivated via autophagic degradation (Bjorkoy et al, 2005; Komatsu et al, 2007). However, Johansen and colleagues had shown that the LIR and KIR motifs of p62 might not be occupied simultaneously by LC3 and Keap1 (Jain et al, 2010). Furthermore, from the recent work by others (Kehl et al, 2019; Runwal et al, 2019; Sanchez‐Martin et al, 2020), it raises the question whether p62 bodies are subjected to autophagic degradation. Indeed, binding of NBR1 and/or TAK1 to p62 was recently reported to uncouple p62 from the regulation by autophagy (Kehl et al, 2019; Sanchez‐Martin et al, 2020). Moreover, in the HCC cell line such as Huh1 cells, p62 bodies could be readily detected at basal state, although these cells exhibit normal autophagic activity relative to other cell lines such as HEK293T (Ichimura et al, 2013).
MOAP‐1 dismantles p62 bodies through binding to the region of p62 encompassing the PB1 and ZZ domains disrupt its ability to maintain in oligomeric state, leading to the dissociation of the p62 bodies. A previous study by Zong and colleagues demonstrated that ubiquitylation of p62 at the K7 residue in the PB1 domain by TRIM21 E3 ubiquitin ligase would prevent p62 aggregation and sequestration of Keap1 (Pan et al, 2016). Although MOAP‐1 deficiency appears to phenocopy that of TRIM21 in rendering high levels of p62 bodies, a clear distinction between these two modes of regulation is that MOAP‐1 does not block the formation of p62 bodies nor alter its K63‐linked poly‐ubiquitylation. Formation of p62 bodies remains robust in the MOAP‐1‐overexpressing cells under stress conditions, but these p62 bodies were downregulated by MOAP‐1 in a progressive manner over time (Figs 2A and EV1A, Appendix Fig S2A). Self‐oligomerization of p62, mediated by its PB1 domain, allows p62 to aggregate and sequester ubiquitylated substrate for facilitating their degradation through the autophagy‐lysosome pathway (Lamark et al, 2003; Wilson et al, 2003; Bjorkoy et al, 2005; Komatsu et al, 2007). The K7A and D69A mutations of the two critical residues of the PB1 domain of p62 render it unable to self‐oligomerize and form aggregates, resulting in impaired autophagic degradation of p62 (Ichimura et al, 2008). Our finding that MOAP‐1 blocks the PB1‐mediated self‐oligomerization of p62 should theoretically also result in inhibition of autophagic degradation of p62, leading to its accumulation, especially under the condition of MOAP‐1 overexpression. However, as stress‐induced formation of p62 bodies remains robust in the presence of endogenous and exogenous MOAP‐1 (Figs 1C, 2A and G, and EV1A), it is conceivable that MOAP‐1 may only exert an effect on disrupting the oligomeric states of p62. This may potentially be achieved through enhancement of the MOAP‐1/p62 interaction in the p62 bodies which may play a part for disrupting the integrity of the p62 bodies. Thus, a hypothetical model can be considered that upon stress stimulation, p62 bodies are formed to sequester Keap1 to result in the activation of Nrf2 signaling, MOAP‐1 is then recruited to the p62 bodies to promote their dissociation, thereby releasing Keap1 from p62. This can serve as a negative feedback mechanism to modulate the activity of the p62‐Keap1‐Nrf2 signaling, as well as allowing p62 to re‐distribute to non‐aggregated state, so that it can standby and re‐initiate another round of signaling to activate Nrf2 upon stress. Even though it is known that co‐chaperone systems such as the heat shock protein 70 (HSP70)/J‐protein complex could reverse protein aggregation in mammalian cells (Nillegoda et al, 2015), such mode of regulation has not been reported for p62 bodies. To our knowledge, MOAP‐1 represents the first modulator that exhibits disaggregase‐like activity for disassembling p62 bodies to attenuate their signaling activity. It remains to be addressed whether additional factors such as molecular chaperones and post‐translational modifications of MOAP‐1 and/or p62 are required to mediate dissociation of p62 bodies by MOAP‐1.
MOAP‐1 was previously known to facilitate apoptosis signaling via promoting Bax apoptotic function and mediating recruitment of tBid to mitochondria by its receptor, MTCH2 (Baksh et al, 2005; Tan et al, 2005; Tan et al, 2016). Interestingly, functions of MOAP‐1 in regulating apoptosis and p62 bodies appear separable. In contrast to the previously known mitochondrial localization of MOAP‐1 where it facilitates apoptosis signaling (Tan et al, 2005; Tan et al, 2016), MOAP‐1 was found to be recruited to the p62 bodies formed under a variety of cellular stress conditions. Moreover, mutants of MOAP‐1 that exhibit mutually exclusive functions in regulating apoptosis and p62 bodies have been identified in this study. The MOAP‐1‐L120E mutant, which is defective in promoting Bax‐dependent function and mitochondrial recruitment of tBid (Tan et al, 2005; Tan et al, 2016), remains effective in disrupting p62 bodies and suppressing Nrf2 activity (Fig 7J and K, Appendix Fig S5D). In contrast, the MOAP‐1‐M3 mutant, which is competent in promoting Bax apoptotic function (Baksh et al, 2005), is unable to interact with p62 to downregulate the levels of p62 bodies nor Nrf2 activity (Figs 7J and K, EV5E–J). MOAP‐1 is a low abundance protein constantly degraded via the UPS (Fu et al, 2007). Upon induction of apoptosis signaling, MOAP‐1 protein is uncoupled from the UPS regulation, resulting in stabilization and upregulation of MOAP‐1, which facilitates Bax‐mediated apoptosis (Fu et al, 2007). Upon oxidative stress such as treatment with arsenic trioxide, endogenous MOAP‐1 appears to be upregulated (Fig 2J). It is therefore reasonable to postulate that upregulation of MOAP‐1 could be one mechanism by which MOAP‐1 mediates downregulation of the p62 bodies. In the DEN treatment condition, however, endogenous MOAP‐1 was not upregulated in the LO2 hepatocytes nor in the mouse livers in vivo, yet MOAP‐1/p62 interaction was enhanced significantly (Fig EV3B and C). Hence, the enhanced binding of MOAP‐1 to p62 mediated by stress signals is likely to be involved in activating the function of MOAP‐1 in facilitating disassembly of p62 bodies. It would certainly be of interest in future to investigate further the mechanism underlying the enhancement of MOAP‐1/p62 interaction triggered by the stress signals.
High abundance of p62 bodies is implicated in HCC development in the mouse models and is clinically associated with recurrence, fibrosis, liver stiffness and inversely correlatess with disease‐free survival (Inami et al, 2011; Umemura et al, 2016; Denk et al, 2019). p62 is critical for promoting liver tumorigenesis in several mouse models including autophagy‐deficient mice and DEN carcinogenesis model (Takamura et al, 2011; Umemura et al, 2016). Identification of MOAP‐1 as a negative regulator of the p62‐Keap1‐Nrf2 signaling axis through disrupting p62 bodies offers fresh insight toward understanding of the regulation of this tumorigenic signaling mechanism underpinning HCC development. Furthermore, accumulation of p62 bodies may have arisen from defective autophagy signaling in liver, for instance, in the patients with allelic loss of beclin‐1 (Mathew et al, 2009). As MOAP‐1‐mediated downregulation of p62 bodies is independent of autophagy, MOAP‐1 can potentially be exploited further as a target for devising novel therapeutic strategy for HCC treatment. By being a direct substrate of the UPS (Fu et al, 2007), MOAP‐1 may potentially be targetable by small molecule compounds that confer stabilization effect on the MOAP‐1 protein. As p62 bodies are also commonly found to be elevated in many types of neurodegenerative diseases (Zatloukal et al, 2002; Lim & Yue, 2015; Ma et al, 2019), it would be of interest to investigate further in future whether MOAP‐1 could play a role in regulating p62 bodies in the neuronal cells.
Materials and Methods
Antibodies
The primary antibodies used were as follows: Actin (Sigma‐Aldrich, SAB5500001), ATG5 (Nanotools, clone 7C6), DAXX (Santa‐Cruz, clone M‐112), Flag (Sigma‐Aldrich, clone M2), GAPDH (Cell Signaling Technology, #2118), GFP (Cell Signaling Technology, #2956), HA (Abcam, ab9110), Halo (Promega, G9211), His (Santa‐Cruz, clone H‐3), HMOX‐1 (Abcam, ab137749), Keap1 (Proteintech, 10503‐2‐AP), LAMP1 (Cell Signaling Technology, #9091), LC3B (Cell Signaling Technology, #2775), MOAP‐1 (Sigma‐Aldrich, HPA000939), Myc (Santa‐Cruz, clone 9E10), NBR1 (Abnova, clone 6B11), Nrf2 (MBL International, clone 1F2), p62/SQSTM1 (Abcam, ab56416), TAK1 (Abcam, ab109526), Tom20 (Santa‐Cruz, clone F‐10), TRIM21 (Proteintech, 12108‐1‐AP), Tubulin (Santa‐Cruz, clone TU‐02), Ubiquitin (Santa‐Cruz, clone P4D1), Ubiquitin (linkage‐specific K63) (Abcam, ab179434), Ubiquitin (linkage‐specific K48) (Abcam, ab140601).
Constructs
For mammalian expression, cDNAs encoding MOAP‐1 (human full‐length or the indicated mutants) and p62 were cloned into pXJ‐40 Myc/Flag/RFP, pIRES‐neomycin (Clontech) or pHTN‐Halo (Promega) expression vector. p62 (human) was subcloned from pGEX‐GST‐p62, which was a kind gift from Dr Masaaki Komatsu (Komatsu et al, 2007). pEGFP‐LC3 was a gift from Dr Tamotsu Yoshimori (Addgene plasmid #21073; Kabeya et al, 2000). pX330‐U6‐Chimeric_BB‐CBh‐hSpCas9 was a gift from Dr Feng Zhang (Addgene plasmid #42230). Short hairpin RNA against human ATG5 (CCTTGGAACATCACAGTACAT) or scrambled sequence was cloned into pLKO.1 expression vector, which was a gift from Dr Bob Weinberg (Addgene plasmid #8453; Stewart et al, 2003). pGL3‐ARE firefly luciferase reporter plasmid and pRL‐CMV renilla internal control plasmid were a gift from Dr Alan Porter.
Cell lines
LO2 human hepatocytes (Hu et al, 2013; Xu et al, 2019), liver cancer cells (HepG2, Huh‐1, JHH5 and JHH7; Ichimura et al, 2013), HeLa and MEFs (Tan et al, 2016) were maintained in DMEM supplemented with 10% fetal bovine serum (FBS) in a 5% CO2, humidified atmosphere at 37ºC. For generation of MOAP‐1 or p62 knockout cells using the CRISPR‐Cas9 system, the following gRNA sequences were cloned into the pX330‐U6‐Chimeric_BB‐CBh‐hSpCas9 expression vector (Cong et al, 2013): MOAP‐1 TGCGGAGACTAGTCACGCCC; p62/SQSTM1 AATGGCC‐ATGTCCTACGTGA. Cells were transiently transfected with the pX330 vectors. Three days post‐transfection, cells were single cell sorted by flow cytometry. Clones were expanded and screened for successful gene knockout of MOAP‐1 or p62 by Western blotting and validated by Sanger sequencing. At least two clones with successful gene KO were used in all experiments. For generation of stable cell lines, pIRES‐GFP/Myc‐MOAP‐1‐neomycin or pHTN‐Halo‐p62 expression vectors were transfected into the host cells, and 48 h later cells were selected with G418 antibiotics (500 µg/ml, Gibco) until stable pools were acquired. Treatment of cells with the proteasome inhibitor MG132 (Sigma‐Aldrich) or arsenic trioxide (Sigma‐Aldrich) to induce formation of p62 bodies were carried out as previously described (Eino et al, 2015; Pan et al, 2016).
Mice
MOAP‐1 KO mice were first generated in the 129 background and backcrossed with the C57/BL6 strain for at least ten generations as previously described (Tan et al, 2016). All the wild type and MOAP‐1 KO mice used for experiments were from the same heterozygous founders in C57/BL6 genetic background and were in‐bred for not more than six generations. Mice were weaned at 21 day old and maintained on the Chow diet and 12 h light/12 h dark cycle at 23ºC. Only male mice were used for all experiments, which were approved by and conducted in accordance to the regulations and guidelines of the Institutional Animal Care and Use Committee of National University of Singapore.
Acute diethylnitrosamine (DEN) experiment and DEN‐induced liver tumorigenesis
Fifteen‐day‐old male mice were injected intraperitoneally (i.p.) with a single dose of DEN (25 µg/g body weight) (Sigma‐Aldrich) as previously described (Maeda et al, 2005; Ang et al, 2019). Four or eight months later, mice were euthanized by CO2 asphyxiation and livers were harvested for analysis of total liver weight, number and maximum diameters of liver nodules as previously described (Umemura et al, 2016). Tumor nodules were harvested and snap frozen (for Western blotting or RT–PCR analysis) or fixed with 4% paraformaldehyde (for immunohistochemistry). For acute DEN experiment, male mice of eight‐week‐old were injected with a single dose of DEN (100 µg/g body weight, i.p.) and euthanized forty‐eight‐hours later. Left lateral lobes of the livers were harvested and either snap frozen or fixed with 4% paraformaldehyde for histology and immunohistochemistry analysis.
Immunofluorescence (IF)
Cells, which had been seeded on 1 mm thick coverslips, were fixed in 4% paraformaldehyde/PBS for 12 min at room temperature, and rinsed three times in PBS, followed by permeabilization with 0.1% Triton X‐100/PBS for 3 min. Cells were subsequently blocked with 1% BSA/PBS for 1 h and incubated with the primary antibodies at 1:200 dilution in 1% BSA/PBS for overnight at 4ºC, before being incubated with Alexa‐fluorophore‐conjugated secondary antibody (Alexa Fluo 488 and 633, Life Technologies) for 1 h at room temperature. Six washes in PBS with 5 min incubation each were carried out before and after the second antibody incubation (1:500 dilution). Coverslips were mounted on a poly‐lysine glass slide with DAKO anti‐fade mounting media containing DAPI (Life Technologies). Confocal microscopy was performed using an Olympus FV10i microscope. Unless stated otherwise, the images shown were of single focal planes.
Immunohistochemistry (IHC)
Liver tissues were fixed in 4% paraformaldehyde for 24 h at room temperature (RT), followed by another 24 h at 4ºC. Fixed tissues were embedded in paraffin and the sections were cut at 4 µm for IHC staining. Slides were first de‐waxed by incubation at 60°C for 1 h and rehydrated through a descending series of ethanol to water. Antigen retrieval was performed using heat‐induced epitope retrieval method in a high‐pressure cooker for 10 min at the highest pressure with slides immersed in the DAKO target retrieval solution (citrate buffer pH6). Slides were cooled down and rinsed with tap water for five times. After two rinses with PBS containing 0.1% Triton X‐100 for tissue permeabilization, the slides were blocked in PBS containing 10% horse serum, 0.1% Triton X‐100 for 30 min. 2% mouse on mouse (M.O.M) blocking reagent was included in this step for staining using antibodies raised in mice. The slides were then subjected to three washes with PBS containing 0.01% Triton X‐100, followed by overnight incubation with primary antibodies at 1:100 dilution in PBS containing 0.01% Triton X‐100 and 1% horse serum (hereon referred to as the IHC antibody diluent) at 4ºC. The following day, slides were washed with PBS containing 0.01% Triton X‐100 for five times and incubated with Alexa‐fluorophore‐conjugated secondary antibody (Alexa Fluo Plus 647 and 555, Life Technologies) at 1:500 dilution in the IHC antibody diluent at RT for 1 h. After five washes of PBS containing 0.01% Triton X‐100, slides were counterstained with DAPI in PBS, mounted in anti‐fade mounting media. Images were acquired with an Olympus FV10i confocal microscope. Single focal plane images were shown.
Quantification of p62 bodies
Confocal images of the color channel where p62 bodies were visualized were first inverted and converted into a binary mode using the ImageJ software (NIH). Quantification of the number of p62 bodies was performed as previously described (Sanchez‐Martin et al, 2020). The total number of p62 bodies per view was normalized to the number of nuclei to derive the number of p62 bodies per cell. Quantification of the size was carried out as previously described (Yang et al, 2019) with some modifications. Briefly, ImageJ analysis was performed using the “Analyze Particles” function to measure the Feret diameter of the p62 bodies in pixels, which were then converted into µm in accordance to scale.
Live imaging and fluorescence recovery after photobleaching (FRAP) of RFP‐p62 bodies
Cells were seeded overnight in a µ‐slide 8 well glass bottom chamber (Ibidi) and transfected with expression vector encoding RFP‐p62. 16 h later, cells were pre‐incubated for 30 min at 37°C in the temperature‐controlled chamber supplied with 5% CO2 in a Zeiss LSM710 confocal microscope. For live imaging, 20 Z‐stacks of approximately 0.5 µm section were scanned every 2 min for a total duration of 30 min. The Z‐stacks were converted into maximal intensity projections using ImageJ software (NIH). For FRAP, cells were prepared in the same way as for live imaging. After 30 min pre‐incubation, RFP‐p62 signals were bleached for 10 s with a 100% laser intensity of 405 nm and 543 nm. Recovery was recorded by measuring the fluorescence intensity of the focal plane every 10 s.
Halo pulse‐chase assay
Halo pulse‐chase assay was carried out as previously described (Yamaguchi et al, 2009). WT and MOAP‐1 KO LO2 cells stably expressing Halo‐p62 were labeled with 50 nM of TMR ligands (Promega) for 10 min at 37°C, and then rinsed three times in fresh DMEM to remove unbound ligands. To block continuous labeling of newly synthesized proteins with residual ligands, 50 μM of HaloTag Succinimidyl Ester (O4) (Promega) was added to cells. Cells were harvested at indicated time points and lysed in 1x Laemmli sample buffer. Total protein lysates were loaded on SDS–PAGE gel and the TMR‐labeled Halo‐p62 protein was visualized directly on a Bio‐Rad Imager at 565 nm wavelength.
Western blotting
Cells were lyzed in 1x Laemmli sample buffer containing 60 mM Tris pH 6.8, 2% SDS and supplemented with 150 mM NaCl, 1 mM EDTA, 5% glycerol and 7 mM beta‐mercaptoethanol. Liver tissues or tumor nodules (~30 mg) were homogenized in 1 ml RIPA lysis buffer (50 mM Tris pH 8.0, 150 mM sodium chloride, 1% SDS, 1% Triton X‐100, 0.5% sodium deoxycholate and supplemented with protease inhibitor cocktail) using a Dounce tissue grinder and incubated on ice for 2 h. Tissue/cell lysates were centrifuged at 21,000 g for 20 min to remove cell debris. Equivalent amount of protein samples (80‐100 μg) were prepared and mixed with 2x Laemmli sample buffer before subjecting to SDS–PAGE using 15% or 10% acrylamide gels and transferred to nitrocellulose membranes. Membranes were blocked with 5% BSA (bovine serum albumin)/PBST (containing 0.1 % Tween20) for 1 h at room temperature and then probed with the indicated primary antibodies overnight at 1:1,000 dilution in 5% BSA/PBST, followed by the appropriate HRP‐conjugated anti‐mouse/rabbit secondary antibodies (Bethyl Laboratories) or VeriBlot for IP Detection Reagent (Abcam, ab131366) for IP blots to minimize cross‐reactivity with the IgG bands. Six washes in PBST with 5 min incubation between washes were carried out before and after the second antibody incubation.
Co‐immunoprecipitation
IP assays were performed as previously described (Sukumaran et al, 2010), with some modifications. For cell culture, cells were lysed in 1 ml IP lysis buffer containing 2% Triton X and 0.1% SDS and incubated on ice for 30 min. MOAP‐1 KO or p62 KO cells were used for mapping of domains mediating MOAP‐1/p62 interaction to avoid interference of endogenous MOAP‐1 or p62 protein that can form dimer or oligomer with the exogenous protein. For liver tissues including tumors, 30 mg of tissues were homogenized in 1 ml IP lysis buffer containing 2% Triton X and 0.1% SDS and incubated on ice for 1 h. The cell or tissue lysates were then centrifuged at 20,000 g for 12 min and 10 mg of the lysates were then diluted in 1:1 ratio with IP lysis buffer without Triton X and incubated with 5 µg of antibodies at 4°C overnight. The lysates‐antibody mixture was then centrifuged at 20,000 g for 10 min, and the supernatant was incubated with Protein‐A/G agarose (Thermo Scientific) or magnetic beads (MedChemExpress) for 2 h at 4°C. The beads containing the immunoprecipitated protein complexes were washed four times with IP lysis buffer and eluted in 1x Laemmli sample buffer.
p62 oligomerization assay using His‐pull‐down and cross‐linking
Cell lysates were subjected to His‐pull‐down using Ni‐NTA beads (Qiagen) following the protocol from the supplier. His‐tagged p62 protein was then eluted from the beads using 100 mM imidazole and subjected to cross‐linking using disuccinimidyl sulfoxide (DSSO) (Thermo Scientific) at a final concentration of 200 µM on ice for 30 min, and the cross‐linking reaction was stopped by adding Tris buffer, pH 8.0 to a final concentration of 20 mM.
Poly‐ubiquitylation assay
Immunoprecipitation of lysates prepared in a denaturing condition was performed as described (Jaffray & Hay, 2006). 4 × 10⁶ cells seeded overnight in 10 cm dishes were treated with MG132 (10 µM) for 12 h and cells were harvested by scraping in 1 ml of 2% SDS lysis buffer (2% SDS, 50 mM Tris–HCl, pH 7.5) containing 10 mM iodoacetamide (Sigma‐Aldrich) and protease inhibitor cocktail (Thermo Scientific). After 30 min of incubation at the room temperature to facilitate lysis, cell lysates were sonicated at 5,000 amplitude microns using a Soniprep 150 sonicator (Henderson Biomedical Ltd.) for 2 × 45 s and centrifuged at 16,110 g for a further 15 min to remove cell debris. 800 µl of the supernatant was diluted 20‐fold in 15.2 ml of Renaturation Buffer (50 mM Tris–HCl, pH 7.5, 150 mM NaCl, 0.5 mM β‐mercaptoethanol, 0.5% NP40) containing complete protease inhibitor cocktail (Roche) in a 50 ml Falcon tube (Corning) and incubated with the anti‐p62 antibody‐bound beads with gentle mixing in a horizontal rotator. After 3 h incubation at 4ºC, beads were washed 5 times with the Renaturation Buffer, and resuspended in 1x Laemmli sample buffer.
Recombinant proteins and in vitro binding assay
GST‐MOAP‐1 and GST control recombinant proteins were prepared as previously described (Tan et al, 2016). GST‐p62 recombinant protein was prepared as previously described (Komatsu et al, 2007). Cleavage of GST from the GST‐MOAP‐1 recombinant protein was performed using His‐TEV (Sigma‐Aldrich) following the protocol from the supplier. For in vitro binding assay, a mixture containing 1 µg of GST‐p62 and MOAP‐1 each were incubated in the in vitro binding buffer (2200 µM Tris–HCl pH 8.0, 150 mM NaCl, 1 mg/ml BSA and 1 mM DTT) for 2 h and added with Glutathione Sepharose 4 Fast Flow beads (GE Healthcare) for another 1 h at 4ºC. The beads were washed four times in the same buffer before elution in 1× Laemmli sample buffer.
RT–PCR
mRNA transcripts were extracted from livers or cells using RNeasy Plus Mini kit (Qiagen) following the supplier’s protocol. cDNA was synthesized from 1 μg of the total mRNA using qScript cDNA SuperMix (Quantabio) following the supplier’s protocol. 60 min of incubation at 42°C was opted. The cDNA was then subjected to RT–PCR using the following primers:
| Forward primer | Reverse primer | |
|---|---|---|
| Human set | ||
| NQO1 | CATGGCATAGAGGTCCGACT | GCACTGATCGTACTGGCTCA |
| HMOX‐1 | CTCAAACCTCCAAAAGCC | TCAAAAACCACCCCAACCC |
| SLC7A11 | CCATGAACGGTGGTGTGTT | GACCCTCTCGAGACGCAAC |
| GCLC | GGATGATGCTAATGAGTCTGACC | TCTACTCTCCATCCAATGTCTGAG |
| G6PD | CTGCAGATGCTGTGTCTGGT | TGCATTTCAACACCTTGACC |
| Mouse set | ||
| NQO1 | AGCGTTCGGTATTACGATCC | AGTACAATCAGGGCTCTTCTCG |
| HMOX‐1 | GAGCCTGAATCGAGCAGAAC | AGCCTTCTCTGGACACCTGA |
Nrf2 transcriptional activity
Nrf2‐dependent antioxidant response element (ARE) luciferase reporter assay was conducted as described previously (Gan et al, 2013). Briefly, cells were seeded in a 24‐well culture plate and transfected with 0.15 μg of pGL3‐ARE firefly luciferase reporter plasmid and 0.1 µg pRL‐CMV. 24 h post‐transfection, cells were lysed, and the luciferase activities were determined using the Dual‐Luciferase® Reporter Assay System (Promega). Results were expressed as firefly luciferase activity normalized to renilla luciferase activity.
Statistical analysis
Data presented were mean ± standard error of the mean (SEM). Two‐sample unpaired Student’s t‐test was used for comparison of two groups with normally distributed variables and comparable variances. Two‐way ANOVA test was used for the comparison among multiple groups with variables influenced by two or more factors. Chi‐squared (Χ2) test was used for comparing groups with dichotomous variables. Data from at least three independent experiments were analyzed and the exact n is stated in the corresponding figure legends. No statistical method was applied to pre‐determine the sample size. All experiments were not randomized, and the investigators were not blinded during execution of experiments and data analyses. No samples or animals were excluded from the analyses. ***P < 0.001, **P < 0.01, *P < 0.05, ns, not significant.
Author contributions
VCY conceived and supervised the project. CTT and VCY wrote the manuscript. CTT and VCY designed and CTT conducted most of the experiments. H‐CC, QZ, and CY contributed to the DEN‐induced tumorigenesis experiment and analysis. NYF and KS contributed to the experimental design throughout the work. All authors reviewed and approved the manuscript.
Conflict of interest
The authors declare that they have no conflict of interest.
Supporting information
Appendix
Expanded View Figures PDF
Source Data for Expanded View
Review Process File
Source Data for Figure 1
Source Data for Figure 2
Source Data for Figure 3
Source Data for Figure 4
Source Data for Figure 5
Source Data for Figure 6
Source Data for Figure 7
Source Data for Figure 8
Acknowledgements
We are grateful to the expert assistance rendered by the animal, advanced imaging, flow cytometry facilities at the National University of Singapore and the Advanced Molecular Pathology Laboratory (AMPL), A*STAR. This research is supported by grants awarded to VCY by the Singapore Ministry of Health’s National Medical Research Council under its OF‐IRG scheme (NMRC/OFIRG/0011/2016), the Singapore Ministry of Education Academic Research Fund Tier 1 (R‐148‐000‐288‐114) and the NUSMed‐FoS Joint Research Programme on Healthy Brain Aging (R‐148‐000‐280‐133).
EMBO Reports (2021) 22: e50854.
Data availability
No data from this study are deposited in external repositories. Uncropped images for Western blots and quantitative data are presented in the Source Data files.
References
- Alberti S, Gladfelter A, Mittag T (2019) Considerations and challenges in studying liquid‐liquid phase separation and biomolecular condensates. Cell 176: 419–434 [DOI] [PMC free article] [PubMed] [Google Scholar]
- Ang CH, Hsu SH, Guo F, Tan CT, Yu VC, Visvader JE, Chow PKH, Fu NY (2019) Lgr5(+) pericentral hepatocytes are self‐maintained in normal liver regeneration and susceptible to hepatocarcinogenesis. Proc Natl Acad Sci USA 116: 19530–19540. [DOI] [PMC free article] [PubMed] [Google Scholar]
- Baksh S, Tommasi S, Fenton S, Yu VC, Martins LM, Pfeifer GP, Latif F, Downward J, Neel BG (2005) The tumor suppressor RASSF1A and MAP‐1 link death receptor signaling to Bax conformational change and cell death. Mol Cell 18: 637–650 [DOI] [PubMed] [Google Scholar]
- Bjorkoy G, Lamark T, Brech A, Outzen H, Perander M, Overvatn A, Stenmark H, Johansen T (2005) p62/SQSTM1 forms protein aggregates degraded by autophagy and has a protective effect on huntingtin‐induced cell death. J Cell Biol 171: 603–614 [DOI] [PMC free article] [PubMed] [Google Scholar]
- Carroll B, Otten EG, Manni D, Stefanatos R, Menzies FM, Smith GR, Jurk D, Kenneth N, Wilkinson S, Passos JF et al (2018) Oxidation of SQSTM1/p62 mediates the link between redox state and protein homeostasis. Nat Commun 9: 256 [DOI] [PMC free article] [PubMed] [Google Scholar]
- Cha‐Molstad H, Sung KS, Hwang J, Kim KA, Yu JE, Yoo YD, Jang JM, Han DH, Molstad M, Kim JG et al (2015) Amino‐terminal arginylation targets endoplasmic reticulum chaperone BiP for autophagy through p62 binding. Nat Cell Biol 17: 917–929 [DOI] [PMC free article] [PubMed] [Google Scholar]
- Cha‐Molstad H, Yu JE, Feng Z, Lee SH, Kim JG, Yang P, Han B, Sung KW, Yoo YD, Hwang J et al (2017) p62/SQSTM1/Sequestosome‐1 is an N‐recognin of the N‐end rule pathway which modulates autophagosome biogenesis. Nat Commun 8: 102 [DOI] [PMC free article] [PubMed] [Google Scholar]
- Cong L, Ran FA, Cox D, Lin S, Barretto R, Habib N, Hsu PD, Wu X, Jiang W, Marraffini LA et al (2013) Multiplex genome engineering using CRISPR/Cas systems. Science 339: 819–823 [DOI] [PMC free article] [PubMed] [Google Scholar]
- Denk H, Stumptner C, Abuja PM, Zatloukal K (2019) Sequestosome 1/p62‐related pathways as therapeutic targets in hepatocellular carcinoma. Expert Opin Ther Targets 23: 393–406 [DOI] [PubMed] [Google Scholar]
- Eino A, Kageyama S, Uemura T, Annoh H, Saito T, Narita I, Waguri S, Komatsu M (2015) Sqstm1‐GFP knock‐in mice reveal dynamic actions of Sqstm1 during autophagy and under stress conditions in living cells. J Cell Sci 128: 4453–4461 [DOI] [PMC free article] [PubMed] [Google Scholar]
- Fu NY, Sukumaran SK, Kerk SY, Yu VC (2009) Baxbeta: a constitutively active human Bax isoform that is under tight regulatory control by the proteasomal degradation mechanism. Mol Cell 33: 15–29 [DOI] [PubMed] [Google Scholar]
- Fu NY, Sukumaran SK, Yu VC (2007) Inhibition of ubiquitin‐mediated degradation of MOAP‐1 by apoptotic stimuli promotes Bax function in mitochondria. Proc Natl Acad Sci USA 104: 10051–10056 [DOI] [PMC free article] [PubMed] [Google Scholar]
- Gan FF, Ling H, Ang X, Reddy SA, Lee SS, Yang H, Tan SH, Hayes JD, Chui WK, Chew EH (2013) A novel shogaol analog suppresses cancer cell invasion and inflammation, and displays cytoprotective effects through modulation of NF‐kappaB and Nrf2‐Keap1 signaling pathways. Toxicol Appl Pharmacol 272: 852–862 [DOI] [PubMed] [Google Scholar]
- Hu X, Yang T, Li C, Zhang L, Li M, Huang W, Zhou P (2013) Human fetal hepatocyte line, L‐02, exhibits good liver function in vitro and in an acute liver failure model. Transplant Proc 45: 695–700 [DOI] [PubMed] [Google Scholar]
- Huang NJ, Zhang L, Tang W, Chen C, Yang CS, Kornbluth S (2012) The Trim39 ubiquitin ligase inhibits APC/CCdh1‐mediated degradation of the Bax activator MOAP‐1. J Cell Biol 197: 361–367 [DOI] [PMC free article] [PubMed] [Google Scholar]
- Ichimura Y, Kumanomidou T, Sou YS, Mizushima T, Ezaki J, Ueno T, Kominami E, Yamane T, Tanaka K, Komatsu M (2008) Structural basis for sorting mechanism of p62 in selective autophagy. J Biol Chem 283: 22847–22857 [DOI] [PubMed] [Google Scholar]
- Ichimura Y, Waguri S, Sou YS, Kageyama S, Hasegawa J, Ishimura R, Saito T, Yang Y, Kouno T, Fukutomi T et al (2013) Phosphorylation of p62 activates the Keap1‐Nrf2 pathway during selective autophagy. Mol Cell 51: 618–631 [DOI] [PubMed] [Google Scholar]
- Inami Y, Waguri S, Sakamoto A, Kouno T, Nakada K, Hino O, Watanabe S, Ando J, Iwadate M, Yamamoto M et al (2011) Persistent activation of Nrf2 through p62 in hepatocellular carcinoma cells. J Cell Biol 193: 275–284 [DOI] [PMC free article] [PubMed] [Google Scholar]
- Jaffray EG, Hay RT (2006) Detection of modification by ubiquitin‐like proteins. Methods 38: 35–38 [DOI] [PubMed] [Google Scholar]
- Jain A, Lamark T, Sjottem E, Larsen KB, Awuh JA, Overvatn A, McMahon M, Hayes JD, Johansen T (2010) p62/SQSTM1 is a target gene for transcription factor NRF2 and creates a positive feedback loop by inducing antioxidant response element‐driven gene transcription. J Biol Chem 285: 22576–22591 [DOI] [PMC free article] [PubMed] [Google Scholar]
- Kabeya Y, Mizushima N, Ueno T, Yamamoto A, Kirisako T, Noda T, Kominami E, Ohsumi Y, Yoshimori T (2000) LC3, a mammalian homologue of yeast Apg8p, is localized in autophagosome membranes after processing. EMBO J 19: 5720–5728 [DOI] [PMC free article] [PubMed] [Google Scholar]
- Kang JS, Wanibuchi H, Morimura K, Gonzalez FJ, Fukushima S (2007) Role of CYP2E1 in diethylnitrosamine‐induced hepatocarcinogenesis in vivo . Cancer Res 67: 11141–11146 [DOI] [PubMed] [Google Scholar]
- Katsuragi Y, Ichimura Y, Komatsu M (2015) p62/SQSTM1 functions as a signaling hub and an autophagy adaptor. FEBS J 282: 4672–4678 [DOI] [PubMed] [Google Scholar]
- Kehl SR, Soos BA, Saha B, Choi SW, Herren AW, Johansen T, Mandell MA (2019) TAK1 converts Sequestosome 1/p62 from an autophagy receptor to a signaling platform. EMBO Rep 20: e46238 [DOI] [PMC free article] [PubMed] [Google Scholar]
- Klionsky DJ, Abdelmohsen K, Abe A, Abedin MJ, Abeliovich H, Acevedo Arozena A, Adachi H, Adams CM, Adams PD, Adeli K et al (2016) Guidelines for the use and interpretation of assays for monitoring autophagy. Autophagy 12: 1–222 [DOI] [PMC free article] [PubMed] [Google Scholar]
- Komatsu M, Kurokawa H, Waguri S, Taguchi K, Kobayashi A, Ichimura Y, Sou YS, Ueno I, Sakamoto A, Tong KI et al (2010) The selective autophagy substrate p62 activates the stress responsive transcription factor Nrf2 through inactivation of Keap1. Nat Cell Biol 12: 213–223 [DOI] [PubMed] [Google Scholar]
- Komatsu M, Waguri S, Koike M, Sou YS, Ueno T, Hara T, Mizushima N, Iwata J, Ezaki J, Murata S et al (2007) Homeostatic levels of p62 control cytoplasmic inclusion body formation in autophagy‐deficient mice. Cell 131: 1149–1163 [DOI] [PubMed] [Google Scholar]
- Lamark T, Perander M, Outzen H, Kristiansen K, Overvatn A, Michaelsen E, Bjorkoy G, Johansen T (2003) Interaction codes within the family of mammalian Phox and Bem1p domain‐containing proteins. J Biol Chem 278: 34568–34581 [DOI] [PubMed] [Google Scholar]
- Lau A, Wang XJ, Zhao F, Villeneuve NF, Wu T, Jiang T, Sun Z, White E, Zhang DD (2010) A noncanonical mechanism of Nrf2 activation by autophagy deficiency: direct interaction between Keap1 and p62. Mol Cell Biol 30: 3275–3285 [DOI] [PMC free article] [PubMed] [Google Scholar]
- Lee Y, Chou TF, Pittman SK, Keith AL, Razani B, Weihl CC (2017) Keap1/Cullin3 modulates p62/SQSTM1 activity via UBA domain ubiquitination. Cell Rep 19: 188–202 [DOI] [PMC free article] [PubMed] [Google Scholar]
- Lim J, Yue Z (2015) Neuronal aggregates: formation, clearance, and spreading. Dev Cell 32: 491–501 [DOI] [PMC free article] [PubMed] [Google Scholar]
- Ma S, Attarwala IY, Xie XQ (2019) SQSTM1/p62: a potential target for neurodegenerative disease. ACS Chem Neurosci 10: 2094–2114 [DOI] [PMC free article] [PubMed] [Google Scholar]
- Maeda S, Kamata H, Luo JL, Leffert H, Karin M (2005) IKKbeta couples hepatocyte death to cytokine‐driven compensatory proliferation that promotes chemical hepatocarcinogenesis. Cell 121: 977–990 [DOI] [PubMed] [Google Scholar]
- Mathew R, Karp CM, Beaudoin B, Vuong N, Chen G, Chen HY, Bray K, Reddy A, Bhanot G, Gelinas C et al (2009) Autophagy suppresses tumorigenesis through elimination of p62. Cell 137: 1062–1075 [DOI] [PMC free article] [PubMed] [Google Scholar]
- Matsumoto G, Wada K, Okuno M, Kurosawa M, Nukina N (2011) Serine 403 phosphorylation of p62/SQSTM1 regulates selective autophagic clearance of ubiquitinated proteins. Mol Cell 44: 279–289 [DOI] [PubMed] [Google Scholar]
- Matsuura K, Huang NJ, Cocce K, Zhang L, Kornbluth S (2017) Downregulation of the proapoptotic protein MOAP‐1 by the UBR5 ubiquitin ligase and its role in ovarian cancer resistance to cisplatin. Oncogene 36: 1698–1706 [DOI] [PMC free article] [PubMed] [Google Scholar]
- Moscat J, Diaz‐Meco MT, Albert A, Campuzano S (2006) Cell signaling and function organized by PB1 domain interactions. Mol Cell 23: 631–640 [DOI] [PubMed] [Google Scholar]
- Moscat J, Karin M, Diaz‐Meco MT (2016) p62 in cancer: signaling adaptor beyond autophagy. Cell 167: 606–609 [DOI] [PMC free article] [PubMed] [Google Scholar]
- Nillegoda NB, Kirstein J, Szlachcic A, Berynskyy M, Stank A, Stengel F, Arnsburg K, Gao X, Scior A, Aebersold R et al (2015) Crucial HSP70 co‐chaperone complex unlocks metazoan protein disaggregation. Nature 524: 247–251 [DOI] [PMC free article] [PubMed] [Google Scholar]
- Pan JA, Sun Y, Jiang YP, Bott AJ, Jaber N, Dou Z, Yang B, Chen JS, Catanzaro JM, Du C et al (2016) TRIM21 ubiquitylates SQSTM1/p62 and suppresses protein sequestration to regulate redox homeostasis. Mol Cell 61: 720–733 [DOI] [PMC free article] [PubMed] [Google Scholar]
- Pankiv S, Clausen TH, Lamark T, Brech A, Bruun JA, Outzen H, Overvatn A, Bjorkoy G, Johansen T (2007) p62/SQSTM1 binds directly to Atg8/LC3 to facilitate degradation of ubiquitinated protein aggregates by autophagy. J Biol Chem 282: 24131–24145 [DOI] [PubMed] [Google Scholar]
- Peng H, Yang J, Li G, You Q, Han W, Li T, Gao D, Xie X, Lee BH, Du J et al (2017) Ubiquitylation of p62/sequestosome1 activates its autophagy receptor function and controls selective autophagy upon ubiquitin stress. Cell Res 27: 657–674 [DOI] [PMC free article] [PubMed] [Google Scholar]
- Runwal G, Stamatakou E, Siddiqi FH, Puri C, Zhu Y, Rubinsztein DC (2019) LC3‐positive structures are prominent in autophagy‐deficient cells. Sci Rep 9: 10147 [DOI] [PMC free article] [PubMed] [Google Scholar]
- Saito T, Ichimura Y, Taguchi K, Suzuki T, Mizushima T, Takagi K, Hirose Y, Nagahashi M, Iso T, Fukutomi T et al (2016) p62/Sqstm1 promotes malignancy of HCV‐positive hepatocellular carcinoma through Nrf2‐dependent metabolic reprogramming. Nat Commun 7: 12030 [DOI] [PMC free article] [PubMed] [Google Scholar]
- Sanchez‐Martin P, Komatsu M (2018) p62/SQSTM1 ‐ steering the cell through health and disease. J Cell Sci 131 [DOI] [PubMed] [Google Scholar]
- Sanchez‐Martin P, Sou YS, Kageyama S, Koike M, Waguri S, Komatsu M (2020) NBR1‐mediated p62‐liquid droplets enhance the Keap1‐Nrf2 system. EMBO Rep 21: e48902 [DOI] [PMC free article] [PubMed] [Google Scholar]
- Stewart SA, Dykxhoorn DM, Palliser D, Mizuno H, Yu EY, An DS, Sabatini DM, Chen IS, Hahn WC, Sharp PA et al (2003) Lentivirus‐delivered stable gene silencing by RNAi in primary cells. RNA 9: 493–501 [DOI] [PMC free article] [PubMed] [Google Scholar]
- Sukumaran SK, Fu NY, Tin CB, Wan KF, Lee SS, Yu VC (2010) A soluble form of the pilus protein FimA targets the VDAC‐hexokinase complex at mitochondria to suppress host cell apoptosis. Mol Cell 37: 768–783 [DOI] [PubMed] [Google Scholar]
- Sun D, Wu R, Zheng J, Li P, Yu L (2018) Polyubiquitin chain‐induced p62 phase separation drives autophagic cargo segregation. Cell Res 28: 405–415 [DOI] [PMC free article] [PubMed] [Google Scholar]
- Takamura A, Komatsu M, Hara T, Sakamoto A, Kishi C, Waguri S, Eishi Y, Hino O, Tanaka K, Mizushima N (2011) Autophagy‐deficient mice develop multiple liver tumors. Genes Dev 25: 795–800 [DOI] [PMC free article] [PubMed] [Google Scholar]
- Tan CT, Zhou QL, Su YC, Fu NY, Chang HC, Tao RN, Sukumaran SK, Baksh S, Tan YJ, Sabapathy K et al (2016) MOAP‐1 mediates fas‐induced apoptosis in liver by facilitating tBid recruitment to mitochondria. Cell Rep 16: 174–185 [DOI] [PubMed] [Google Scholar]
- Tan KO, Fu NY, Sukumaran SK, Chan SL, Kang JH, Poon KL, Chen BS, Yu VC (2005) MAP‐1 is a mitochondrial effector of Bax. Proc Natl Acad Sci USA 102: 14623–14628 [DOI] [PMC free article] [PubMed] [Google Scholar]
- Tan KO, Tan KM, Chan SL, Yee KS, Bevort M, Ang KC, Yu VC (2001) MAP‐1, a novel proapoptotic protein containing a BH3‐like motif that associates with Bax through its Bcl‐2 homology domains. J Biol Chem 276: 2802–2807 [DOI] [PubMed] [Google Scholar]
- Umemura A, He F, Taniguchi K, Nakagawa H, Yamachika S, Font‐Burgada J, Zhong Z, Subramaniam S, Raghunandan S, Duran A et al (2016) p62, upregulated during preneoplasia, induces hepatocellular carcinogenesis by maintaining survival of stressed HCC‐initiating cells. Cancer Cell 29: 935–948 [DOI] [PMC free article] [PubMed] [Google Scholar]
- Wilson MI, Gill DJ, Perisic O, Quinn MT, Williams RL (2003) PB1 domain‐mediated heterodimerization in NADPH oxidase and signaling complexes of atypical protein kinase C with Par6 and p62. Mol Cell 12: 39–50 [DOI] [PubMed] [Google Scholar]
- Wooten MW, Hu X, Babu JR, Seibenhener ML, Geetha T, Paine MG, Wooten MC (2006) Signaling, polyubiquitination, trafficking, and inclusions: sequestosome 1/p62's role in neurodegenerative disease. J Biomed Biotechnol 2006: 62079 [DOI] [PMC free article] [PubMed] [Google Scholar]
- Wurzer B, Zaffagnini G, Fracchiolla D, Turco E, Abert C, Romanov J, Martens S (2015) Oligomerization of p62 allows for selection of ubiquitinated cargo and isolation membrane during selective autophagy. Elife 4: e08941 [DOI] [PMC free article] [PubMed] [Google Scholar]
- Xu D, Li X, Shao F, Lv G, Lv H, Lee JH, Qian X, Wang Z, Xia Y, Du L et al (2019) The protein kinase activity of fructokinase A specifies the antioxidant responses of tumor cells by phosphorylating p62. Sci Adv 5: eaav4570 [DOI] [PMC free article] [PubMed] [Google Scholar]
- Yamaguchi K, Inoue S, Ohara O, Nagase T (2009) Pulse‐chase experiment for the analysis of protein stability in cultured mammalian cells by covalent fluorescent labeling of fusion proteins. Methods Mol Biol 577: 121–131 [DOI] [PubMed] [Google Scholar]
- Yang Y, Willis TL, Button RW, Strang CJ, Fu Y, Wen X, Grayson PRC, Evans T, Sipthorpe RJ, Roberts SL et al (2019) Cytoplasmic DAXX drives SQSTM1/p62 phase condensation to activate Nrf2‐mediated stress response. Nat Commun 10: 3759 [DOI] [PMC free article] [PubMed] [Google Scholar]
- You Z, Jiang WX, Qin LY, Gong Z, Wan W, Li J, Wang Y, Zhang H, Peng C, Zhou T et al (2019) Requirement for p62 acetylation in the aggregation of ubiquitylated proteins under nutrient stress. Nat Commun 10: 5792 [DOI] [PMC free article] [PubMed] [Google Scholar]
- Zaffagnini G, Savova A, Danieli A, Romanov J, Tremel S, Ebner M, Peterbauer T, Sztacho M, Trapannone R, Tarafder AK et al (2018) p62 filaments capture and present ubiquitinated cargos for autophagy. EMBO J 37: e98308 [DOI] [PMC free article] [PubMed] [Google Scholar]
- Zatloukal K, Stumptner C, Fuchsbichler A, Heid H, Schnoelzer M, Kenner L, Kleinert R, Prinz M, Aguzzi A, Denk H (2002) p62 Is a common component of cytoplasmic inclusions in protein aggregation diseases. Am J Pathol 160: 255–263 [DOI] [PMC free article] [PubMed] [Google Scholar]
- Zhang Y, Mun SR, Linares JF, Ahn J, Towers CG, Ji CH, Fitzwalter BE, Holden MR, Mi W, Shi X et al (2018) ZZ‐dependent regulation of p62/SQSTM1 in autophagy. Nat Commun 9: 4373 [DOI] [PMC free article] [PubMed] [Google Scholar]
Associated Data
This section collects any data citations, data availability statements, or supplementary materials included in this article.
Supplementary Materials
Appendix
Expanded View Figures PDF
Source Data for Expanded View
Review Process File
Source Data for Figure 1
Source Data for Figure 2
Source Data for Figure 3
Source Data for Figure 4
Source Data for Figure 5
Source Data for Figure 6
Source Data for Figure 7
Source Data for Figure 8
Data Availability Statement
No data from this study are deposited in external repositories. Uncropped images for Western blots and quantitative data are presented in the Source Data files.