

Abstract
The ergot diseases of agricultural and nonagricultural grasses are caused by the infection of Claviceps spp. (Hypocreales, Ascomycota) on florets, producing dark spur‐like sclerotia on spikes that are toxic to humans and animals, leading to detrimental impacts on agriculture and economy due to the downgrading of cereal grains, import–export barriers, reduced yield, and ecological concerns. At least seven phylogenetic lineages (phylogenetic species) were identified within the premolecular concept of C. purpurea s.l. (sensu lato) in agricultural areas and vicinities in Canada and the Western United States. Claviceps purpurea s.s (sensu stricto) remained as the most prevalent species with a wide host range, including cereal crops, native, invasive, and weedy grasses. The knowledge on genetic diversity and distribution of C. purpurea s.s. in North America is lacking. The objective of the present study was to shed light on genetic differentiation and evolution of the natural populations of C. purpurea s.s. Multilocus DNA sequences of samples from Canada and the Western USA were analyzed using a phylogenetic network approach, and population demographic parameters were investigated. Results showed that three distinct genetically subdivided populations exist, and the subdivision is not correlated with geographic or host differentiations. Potential intrinsic mechanisms that might play roles in leading to the cessation of gene flows among the subpopulations, that is, mating and/or vegetative incompatibility, genomic adaptation, were discussed. The neutrality of two house‐keeping genes that are widely used for DNA barcoding, that is, translation elongation factor 1‐α (TEF1‐α) and RNA polymerase II second largest subunit (RPB2), was challenged and discussed.
Keywords: Ascomycota, house‐keeping gene, multilocus haplotype, neutrality, phylogenetic network, population structure, selective sweeping
Regardless of the frequent sexuality and multiple modes of dispersal, the population of the toxigenic plant pathogen, Claviceps purpurea, that infects wide range of agricultural and nonagricultural grasses, was subdivided in nature. The population structure shed light on the underline mechanisms that might have led to the cessation of gene flow among subdivided populations. House‐keeping gene markers were not neutral in certain circumstances.

1. INTRODUCTION
Elucidating the genetic structure of plant pathogen populations that infect both agricultural and nonagricultural host populations can provide insight into the evolutionary history of the pathogen populations, and can be useful for predicting the potential development of new races, effective population size, dispersal potential, and the probability for host range expansion or the emergence of more virulent races of the pathogen. The ergot diseases of cereal crops, forage grasses, native, and invasive grasses are caused by the infection of Claviceps spp. (Hypocreales, Ascomycota) on florets, producing dark spur‐like sclerotia (Figure 1) on spikes that are toxic to humans and animals. During the last ten years, the incidence and severity of ergot in agricultural crops (barley, rye, wheat) as well as forage, native, and weedy grasses has increased in the eastern and prairies provinces of Canada (Menzies & Turkington, 2015; Xue et al., 2017) as well as regions of the western United States including barley growing regions in Colorado, Montana, and Wyoming (Wyka, 2020).
FIGURE 1.

Claviceps purpurea sclerotia on grasses Elymus repens in the field heads (background), the asexual stage in honeydew after inoculating a barley plant in greenhouse (upper inset), and the sexual stage produced from a germinating sclerotium in a controlled environment (bottom inset)
The broad host range of the premolecular C. purpurea s.l. (sensu lato), including more than 400 species of Poaceae (Alderman et al., 2004; Campbell 1957; Píchová et al. 2018), and cosmopolitan distribution suggested a potential species complex that was later proven with evidence pointing toward adaptation to ecological niches (Douhan et al. 2008; Liu et al., 2020; Pazoutova et al. 2000, 2002, Pažoutová et al., 2015; Shoukouhi et al., 2019). At least seven phylogenetic lineages (phylogenetic species) were identified within C. purpurea s.l. across Canada and the United States, including C. purpurea s.s. (sensu stricto), C. humidiphila, C. occidentalis, C. perihumidiphila, C. quebecensis, C. ripicola, and C. spartinae (Liu et al., 2020; Shoukouhi et al., 2019). Claviceps purpurea s.s. was the predominant species recovered, with a wide host range including cereal crops and forage grasses, comprising 90% of samples collected (data not shown). Host specificity studies under controlled conditions showed virulence variations between the C. purpurea s.l. isolates (Cagaš & Macháč, 2002; Menzies et al., 2017), suggesting genetic variation between isolates. Previous pathogenicity and population studies of C. purpurea likely included multiple species within C. purpurea s.l. and therefore may not accurately represent the population dynamics of this fungus (C. purpurea s.s., Cagaš & Macháč, 2002; Campbell, 1957; Gilmore et al., 2016).
During an annual life cycle of C. purpurea s.l, both sexual and asexual propagules are produced and cause infections. The primary infection occurs in spring or early summer by windborne ascospores (sexual) released from ascostromata developed from overwintered sclerotia. While the infection of late flowering plants is primarily caused by secondary inocula in the form of asexual conidia, which is immersed in honeydew that oozes from florets and is transmitted by insect vectors, rain splash, or direct head‐to‐head contacts (Figure 1; Campbell & Freisen, 1959; Tenberge, 2006). Global commercialization of the seeds contaminated with ergots (sclerotia) can lead to human‐mediated long‐distance dispersal (Munkvold, 2009). The annual sexual reproduction within the population likely results in genetic recombination among the strains in the field, increasing genotypic diversity. However, this would also homogenize populations preventing population differentiation. Meanwhile, the abundance and polycyclic nature of asexual secondary propagules may contribute to shaping clonal population structures (Milgroom, 2015c). The observed fluctuation of disease incidence in western Canada and the United States may reflect a population bottleneck and expansion causing genetic drift that could have also impacted the population structure (Menzies et al., 2017). To elucidate which forces have impacted on the evolution of this fungus in nature, an insight to the population structure is imperative.
Multilocus genotyping data combined with population network analyses can be used to explore genetic differentiation and evolution of natural populations. Phylogenetic network analyses are suitable for reticulate relationships caused by various population processes, that is, recombination, gene conversion, lineage sorting, and deep coalescence (Posada & Crandall, 2001). This provides a better inference of the relationships among populations than strict phylogenetic analyses assuming a bifurcate evolutionary pattern (Bapteste et al., 2013; Morrison, 2005). Population demographic parameters reflect the signatures of the natural forces that have shaped the population's structure (as reviewed by Charlesworth & Charlesworth, 2017). The main objective of this study was to investigate the population structure of the ergot fungus, C. purpurea s.s in Canada and Western USA to determine whether the population represents a single panmixia or subdivide to several populations, and whether or not these subdivisions are influenced by geography and/or host association.
2. MATERIALS AND METHODS
2.1. Fungal isolates and DNA sequences
Floret samples infected by Claviceps purpurea were collected from agricultural areas and vicinities in Canadian provinces and Western United States: Alberta (AB), Manitoba (MB), Ontario (ON), Quebec (QC), Saskatchewan (SK), and Colorado (CO), supplemented with occasional samples from British Columbia (BC), Montana (MT), Newfoundland (NL), Nova Scotia (NS), and Wyoming (WY). Sclerotia from the same host and location (<100 m2) were pooled as one sample, as such a total of 303 samples were obtained. Axenic fungal cultures were isolated and purified for 252 samples; other 51 samples were as sclerotia without pure culture (collected from ON and QC in 2016, also see the Table S1). For genomic DNA (gDNA) extraction, a small portion of mycelia from axenic cultures (252 samples) was plucked or a fraction of the sclerotia (51 samples) was taken after surface sterilization. A high‐throughput protocol was used on a KingFisher Flex magnetic particle processor (Thermo Fisher Scientific Oy) with Macherey‐Nagel NucleoMag® 96 Trace kit (Machery Nagel GmbH & Co. KG) following the manufacturer's manual. All fungal isolates, sources (culture or sclerotium), hosts, and locations were provided in Table S1. All gDNA samples were subjected to PCR for four gene regions: RNA polymerase II second largest subunit (RPB2) using Claviceps specific forward primer TTTCGTGGTATTGTTCGCAGA (Pažoutová et al., 2015) and fRPB2‐7cR (Liu et al., 1999), translation elongation factor 1‐α (TEF1‐α) using EF1‐983F and EF1‐2218R (Pažoutová et al., 2015; Rehner & Buckley, 2005), ergot alkaloid chanoclavine I synthase oxidoreductase (easE) using easE996f and easE1895r, and ergot alkaloid chanoclavine I aldehyde oxidoreductase (easA) using easA547f and easA867r (Shoukouhi et al., 2019). PCR and sequencing followed the protocols developed by Shoukouhi et al. (2019). Twenty‐four reference sequences of 14 related species were downloaded from GenBank to be used for confirming the identities of all 303 samples (Table S1).
2.2. Data analysis
The DNA sequences for each gene were aligned using online version MAFFT (Katoh et al., 2017), accessed on 02‐02‐2020 with auto strategy (FFT‐NS‐1, FFT‐NS‐2, FFT‐NS‐i or L‐INS‐i; depends on data size). The resulting alignments were eye‐adjusted: Big gaps at both ends due to unequal length of sequences were removed by shortening alignments; short indels (1–2 nts) in the middle due to polymers were adjusted so that the coding regions can be properly assigned (all the gene regions amplified are exons). The alignments of four genes were concatenated using Geneious Prime v.2020.1.2 (https://www.geneious.com), and missing loci were treated as gaps. To confirm the identities of all samples, the concatenated alignment was appended with the 24 reference sequences of 14 related species, and subjected to a phylogenetic analysis using PAUP* 4.0b10 (Swofford, 2002). The most parsimonious trees were searched for using heuristic branch‐swapping algorithm, tree‐bisection‐reconnection (TBR), 100 replicates, number of rearrangements per replicate limit 5,000, and bootstrap replicates 2000.
A subset of samples that have been sequenced for all four genes was submitted to population demographic analyses and network analyses as follows. The analyses of DNA polymorphism, nucleotide diversity, haplotype diversity, and neutrality were performed using dnaSP v6.10.04 (Rozas et al., 2017) for the individual genes and concatenated matrices. Testing for neutrality was evaluated using Tajima's D with total number of mutation (Tajima, 1989), Fu, and Li's D* and F*(Fu & Li, 1993). Haplotypes were generated and analyzed for each gene and concatenated alignment.
Phylogenetic network analyses were conducted for the haplotypes of concatenated DNA sequences using SplitsTree4 V4.14.8 (Huson & Bryant, 2006). A neighbor‐net method with four different variance calculations was tested, that is, ordinary least square, FitchMargoliash1, FitchMargoliash2, and Estimated variance. The clustering patterns were further tested using BEAST2 v2.5 (Bayesian evolutionary analysis sampling trees) with a multilocus coalescent model (Bouckaert et al., 2019), which estimates rooted, time‐measured phylogenies. The best‐fit models for each partition genes were selected by Akaike information criterion (AIC) or hierarchical likelihood ratio tests (hLRTs) through Modeltest 3.7 (Posada & Crandall, 1998), that is, GTR or TrN for TEF1‐α, K81 + I+G for RPB2, TVMef + I+G or K80 + I+G for easE, and SYM + I or K80 + G for easA. Only four substitute model options (JC69, HKY, TN93, and GTR) were available in BEASTv2.5, and therefore, we set GTR for TEF1‐α, and HKY for the other three genes (HKY was considered as an extension of K80, and K81 models). Other priors were set as default, 10,000,000 generations, sampling frequency 1,000, burn‐in 10%, and link trees. Resulting phylogenies were visualized using DensiTree v 2.0.0 (Bouckaert & Heled, 2014). To further test the evolutionary trajectories inferred by BEAST, we performed phylogenetic analyses for the haplotypes aligned with closely related species and out‐groups using PAUP* 4.0b10. The heuristic search protocols were the same as described earlier.
Genetic differentiation between subpopulations (genetic clusters, abbreviated as GC in the following text, tables and figures) was further tested by the analysis of molecular variance (AMOVA, with 9,999 permutations) and the principle coordinate analysis (PCoA) in GenAlEx 6.5 (Peakall & Smouse, 2012). The haplotype‐SNP matrix from the concatenated alignment was used to generate a pairwise individual‐by‐individual (N × N) genetic distance matrix, which was used for subsequent calculation of ΦPT (analogous of F ST) via AMOVA between subpopulations (genetic clusters), PCoA, Mantel, and spacial autocorrelation analyses.
The sequence‐based statistics, S nn measuring the frequency in which the “nearest‐neighbor” sequences or haplotypes belong to the same subpopulation, were considered suitable for both high haplotype diversity and low haplotype diversity (Hudson, 2000). S nn and gene flow parameter, N m, the migration number per generation (Nei, 1982) was estimated in DnaSp v6.
Next, we investigated whether the genetic differentiation revealed by phylogenetic networks and statistic tests were correlated with geographic separation, or host ranges as follows. Based on geographic location, 156 samples were separated into three geographically separated populations: 1. Western Canada (AB, BC, MB, SK); 2. Eastern Canada (ON, QC, NL, NS); and 3. Western US (CO, MT, WY) (Table 1, Figure 2). We examined the differentiation among three geographic regions by genotypic components, AMOVA, PCoA, and pairwise genetic differentiation, ΦPT statistics, and compared with the estimates for genetic clusters. To test for isolation by distance, we conducted Mantel tests to understand the correlation between genetic distances and geographic distances. For calculating geographic distance, the approximate XY coordinates were obtained from converting the center of the named locations (town/city/agricultural district, Table 1). For a few haplotypes shared by multiple locations, the medians of coordinates were used. All these tests were performed in GenAlEx 6.5.
TABLE 1.
146 haplotypes of concatenated sequences from four loci (153 SNPs), frequency, isolate collecting information, and subpopulation assignments
| Haplotype | Fr a | Isolate | Host | Host Tribe | Year | Country, Province (State) | Location | Approximate Coordinates b | Genetic Cluster c | Geographic population c | Host goup c |
|---|---|---|---|---|---|---|---|---|---|---|---|
| Hap1 | 1 | Clav01 | Elymus trachycalus | Triticeae | 2016 | US, CO | Saguache, Center | 37.751584, −106.111029 | GC3 | USW | Tri |
| Hap2 | 1 | Clav02 | Bromus inermis | Bromeae | 2016 | US, CO | Saguache, Center | 37.751584, −106.111029 | GC3 | USW | Bro |
| Hap3 | 1 | Clav03 | Bromus inermis | Bromeae | 2016 | US, CO | Saguache, Center | 37.751584, −106.111029 | GC3 | USW | Bro |
| Hap4 | 1 | Clav04 | Bromus inermis | Bromeae | 2016 | US, CO | Saguache, Center | 37.751584, −106.111029 | GC3 | USW | Bro |
| Hap5 | 1 | Clav05 | Poaceae | n.a. | 2016 | US, CO | Saguache, Center | 37.751584, −106.111029 | GC3 | USW | n.a. |
| Hap6 | 1 | Clav06 | Thinopyrum intermedium | Triticeae | 2016 | US, CO | Saguache, Center | 37.751584, −106.111029 | GC3 | USW | Tri |
| Hap7 | 1 | Clav08 | Bromus inermis | Bromeae | 2016 | US, CO | Rio Grande, Del Norte | 37.679591, −106.355537 | GC3 | USW | Bro |
| Hap8 | 1 | Clav09x1 | Bromus inermis | Bromeae | 2016 | US, CO | Saguache, Center | 37.751584, −106.111029 | GC3 | USW | Bro |
| Hap9 | 2 | Clav09x2 | Bromus inermis | Bromeae | 2016 | US, CO | Saguache, Center | 37.751584, −106.111029 | GC3 | USW | Bro |
| Clav09x3 | Bromus inermis | Bromeae | 2016 | US, CO | Saguache, Center | 37.751584, −106.111029 | GC3 | USW | Bro | ||
| Hap10 | 1 | Clav10 | Achnatherum robustum | Stipeae | 2016 | US, CO | Rio Grande, Monte Vista | 37.579963, −106.151511 | GC3 | USW | n.a. |
| Hap11 | 1 | Clav11 | Pascopyrum smithii | Triticeae | 2016 | US, CO | Saguache, Center | 37.751584, −106.111029 | GC1 | USW | Tri |
| Hap12 | 1 | Clav12 | Bromus inermis | Bromeae | 2016 | US, CO | Rio Grande, Del Norte | 37.679591, −106.355537 | GC2 | USW | Bro |
| Hap13 | 1 | Clav13 | Bromus inermis | Bromeae | 2016 | US, CO | Saguache, Center | 37.751584, −106.111029 | GC1 | USW | Bro |
| Hap14 | 1 | Clav14 | Achnatherum robustum | Stipeae | 2015 | US, CO | San Luis Valley | 37.725066, −105.851177 | GC2 | USW | n.a. |
| Hap15 | 1 | Clav16 | Poaceae | n.a. | n.n. | US, CO | Saguache | 37.751584, −106.111029 | GC3 | USW | n.a. |
| Hap16 | 1 | Clav18 | Hordeum vulgare | Triticeae | 2015 | US, CO | Rio Grande, Monte Vista | 37.579963, −106.151511 | GC3 | USW | TriC |
| Hap17 | 1 | Clav19 | Hordeum vulgare | Triticeae | 2015 | US, CO | Rio Grande, Del Norte | 37.679591, −106.355537 | GC3 | USW | TriC |
| Hap18 | 1 | Clav20 | Hordeum vulgare | Triticeae | 2015 | US, CO | Rio Grande, Monte Vista | 37.579963, −106.151511 | GC3 | USW | TriC |
| Hap19 | 1 | Clav21 | Hordeum vulgare | Triticeae | 2015 | US, CO | Rio Grande, Monte Vista | 37.579963, −106.151511 | GC3 | USW | TriC |
| Hap20 | 1 | Clav23 | Hordeum vulgare | Triticeae | 2015 | US, CO | Saguache, Center | 37.751584, −106.111029 | GC1 | USW | TriC |
| Hap21 | 1 | Clav25 | Hordeum vulgare | Triticeae | 2015 | US, CO | Saguache | 37.751584, −106.111029 | GC3 | USW | TriC |
| Hap22 | 1 | Clav26 | Hordeum vulgare | Triticeae | 2015 | US, CO | Saguache, Center | 37.751584, −106.111029 | GC3 | USW | TriC |
| Hap23 | 1 | Clav27 | Hordeum vulgare | Triticeae | 2015 | US, CO | Rio Grande, Monte Vista | 37.579963, −106.151511 | GC2 | USW | TriC |
| Hap24 | 1 | Clav28 | Hordeum vulgare | Triticeae | 2015 | US, CO | Saguache, Center | 37.751584, −106.111029 | GC3 | USW | TriC |
| Hap25 | 1 | Clav29 | Hordeum vulgare | Triticeae | 2016 | US, WY | Washakie, Worland | 44.016538, −107.957727 | GC3 | USW | TriC |
| Hap26 | 1 | Clav33 | Hordeum vulgare | Triticeae | 2015 | US, MT | Yellowstone, Huntley | 45.902089, −108.306116 | GC1 | USW | TriC |
| Hap27 | 1 | Clav37 | Achnatherum robustum | Stipeae | 2017 | US, CO | Rio Grande, Monte Vista | 37.579963, −106.151511 | GC1 | USW | n.a. |
| Hap28 | 1 | Clav38 | Bromus inermis | Bromeae | 2017 | US, CO | Alamosa | 37.470983, −105.878860 | GC2 | USW | Bro |
| Hap29 | 1 | Clav39 | Bromus inermis | Bromeae | 2017 | US, CO | Rio Grande, Monte Vista | 37.579963, −106.151511 | GC1 | USW | Bro |
| Hap30 | 1 | Clav40 | Thinopyrum intermedium | Triticeae | 2017 | US, CO | Rio Grande, Monte Vista | 37.579963, −106.151511 | GC3 | USW | Tri |
| Hap31 | 1 | Clav41 | Phleum pratense | Poeae | 2017 | US, CO | Saguache, Center | 37.751584, −106.111029 | GC3 | USW | n.a. |
| Hap32 | 1 | Clav42 | Phleum pratense | Poeae | 2017 | US, CO | Rio Grande, Del Norte | 37.679591, −106.355537 | GC3 | USW | n.a. |
| Hap33 | 1 | Clav43 | Sporobolus airoides | Zoysieae | 2017 | US, CO | Saguache, Center | 37.751584, −106.111029 | GC3 | USW | n.a. |
| Hap34 | 1 | Clav44 | Bromus inermis | Bromeae | 2016 | US, WY | Washakie, Worland | 44.016538, −107.957727 | GC3 | USW | Bro |
| Hap35 | 1 | Clav45 | Bromus inermis | Bromeae | 2016 | US, WY | Washakie, Worland | 44.016538, −107.957727 | GC3 | USW | Bro |
| Hap36 | 1 | Clav46 | Secale cereale | Triticeae | 2016 | US, WY | Washakie, Worland | 44.016538, −107.957727 | GC2 | USW | TriC |
| Hap37 | 1 | LM1000 | Ammophila breviligulata | Poeae | 2018 | CA, QC | Saint‐Henri‐de‐Taillon | 48.679321, −71.882174 | GC3 | CAE | n.a. |
| Hap38 | 1 | LM1004 | Ammophila breviligulata | Poeae | 2018 | CA, QC | Saint‐Henri‐de‐Taillon | 48.679321, −71.882174 | GC2 | CAE | n.a. |
| Hap39 | 1 | LM1006 | Elymus repens | Triticeae | 2018 | CA, QC | Saint‐Henri‐de‐Taillon | 48.679321, −71.882174 | GC1 | CAE | Tri |
| Hap40 | 1 | LM1007 | Elymus repens | Triticeae | 2018 | CA, QC | Saint‐Henri‐de‐Taillon | 48.679321, −71.882174 | GC2 | CAE | Tri |
| Hap41 | 1 | LM1015 | Elymus repens | Triticeae | 2018 | CA, QC | South of Lac‐Saint‐Jean | 48.427272, −71.920971 | GC2 | CAE | Tri |
| Hap42 | 1 | LM1016 | Elymus repens | Triticeae | 2018 | CA, QC | Parc National Pointe‐Taillon | 48.686714, −71.869392 | GC1 | CAE | Tri |
| Hap43 | 1 | LM1018 | Elymus repens | Triticeae | 2018 | CA, QC | Parc National de la Maurice | 46.770014, −72.954005 | GC3 | CAE | Tri |
| Hap44 | 1 | LM1023 | Elymus repens | Triticeae | 2018 | CA, NS | Whycocomagh | 45.973787, −61.122525 | GC3 | CAE | Tri |
| Hap45 | 1 | LM13 | Hordeum vulgare | Triticeae | 1996 | CA, SK | Crop District: SK5 | 50.766959, −102.095529 | GC3 | CAW | TriC |
| Hap46 | 1 | LM15 | Hordeum vulgare | Triticeae | 1996 | CA, MB | Crop District: MB7 | 49.958573, −98.474904 | GC1 | CAW | TriC |
| Hap47 | 1 | LM16 | Hordeum vulgare | Triticeae | 1996 | CA, AB | Crop District: AB5 | 52.319928, −114.335955 | GC2 | CAW | TriC |
| Hap48 | 2 | LM18 | Hordeum vulgare | Triticeae | 1997 | CA, MB | Crop District: MB7 | 49.958573, −98.474905 | GC1 | CAW | TriC |
| LM20 | Hordeum vulgare | Triticeae | 1997 | CA, MB | Crop District: MB4 | 51.181872, −101.294412 | GC1 | CAW | TriC | ||
| Hap49 | 1 | LM19 | Hordeum vulgare | Triticeae | 1997 | CA, SK | Crop District: SK8 | 52.733575, −104.079084 | GC1 | CAW | TriC |
| Hap50 | 2 | LM206 | Bromus riparius | Bromeae | 2014 | CA, MB | Minnewasta Golf Course | 49.187079, −98.129535 | GC3 | CAW | Bro |
| LM685 | Elymus repens | Triticeae | 2017 | CA, ON | Ottawa, Constance bay | 45.492377, −76.075568 | GC3 | CAE | Tri | ||
| Hap51 | 1 | LM208 | Elymus repens | Triticeae | 2014 | CA, MB | Morden, 59 Fairway Dr | 49.187175, −98.134208 | GC3 | CAW | Tri |
| Hap52 | 2 | LM209 | Elymus repens | Triticeae | 2014 | CA, MB | Morden, 59 Fairway Dr | 49.187175, −98.134208 | GC3 | CAW | Tri |
| LM210 | Elymus repens | Triticeae | 2014 | CA, MB | Minnewasta Golf Course | 49.187079, −98.129535 | GC3 | CAW | Tri | ||
| Hap53 | 1 | LM211 | Elymus repens | Triticeae | 2014 | CA, MB | Minnewasta Golf Course | 49.187079, −98.129535 | GC2 | CAW | Tri |
| Hap54 | 1 | LM212 | Elymus repens | Triticeae | 2014 | CA, MB | Minnewasta Golf Course | 49.187079, −98.129535 | GC3 | CAW | Tri |
| Hap55 | 1 | LM213 | Elymus repens | Triticeae | 2014 | CA, MB | Minnewasta Golf Course | 49.187079, −98.129535 | GC2 | CAW | Tri |
| Hap56 | 1 | LM214 | Elymus repens | Triticeae | 2014 | CA, MB | Minnewasta Golf Course | 49.187079, −98.129535 | GC1 | CAW | Tri |
| Hap57 | 1 | LM216 | Elymus repens | Triticeae | 2014 | CA, MB | AAFC Morden RDC | 49.184991, −98.091762 | GC1 | CAW | Tri |
| Hap58 | 1 | LM217 | Elymus repens | Triticeae | 2014 | CA, MB | AAFC Morden RDC | 49.184991, −98.091762 | GC2 | CAW | Tri |
| Hap59 | 1 | LM221 | Phalaris arudinacea | Poeae | 2014 | CA, MB | Snowflake | 49.063439, −98.652897 | GC1 | CAW | n.a. |
| Hap60 | 1 | LM222 | Phalaris arudinacea | Poeae | 2014 | CA, MB | Snowflake | 49.063439, −98.652897 | GC1 | CAW | n.a. |
| Hap61 | 3 | LM223 | Bromus riparius | Bromeae | 2014 | CA, MB | Snowflake | 49.063439, −98.652897 | GC3 | CAW | Bro |
| LM226 | Bromus riparius | Bromeae | 2014 | CA, MB | Snowflake | 49.063439, −98.652897 | GC3 | CAW | Bro | ||
| LM227 | Bromus riparius | Bromeae | 2014 | CA, MB | Snowflake | 49.063439, −98.652897 | GC3 | CAW | Bro | ||
| Hap62 | 1 | LM225 | Bromus riparius | Bromeae | 2014 | CA, MB | Snowflake | 49.063439, −98.652897 | GC2 | CAW | Bro |
| Hap63 | 1 | LM232 | Phalaris canariensis | Poeae | 2014 | CA, MB | Oakbank, Garven Rd | 49.975124, −96.975761 | GC3 | CAW | n.a. |
| Hap64 | 1 | LM236 | Ornamental grass | n.a. | 2014 | CA, BC | Peachland | 49.778671, −119.735858 | GC1 | CAW | n.a. |
| Hap65 | 1 | LM26 | Triticum aestivum | Triticeae | 2000 | CA, MB | Crop District: MB7 | 49.958573, −98.474906 | GC1 | CAW | TriC |
| Hap66 | 1 | LM3 | Triticale sp. | Triticeae | 1996 | CA, MB | University of Manitoba | 49.807388, −97.137305 | GC2 | CAW | TriC |
| Hap67 | 1 | LM302 | Secale cereale | Triticeae | 2013 | CA, MB | Brandon | 49.839271, −99.930058 | GC3 | CAW | TriC |
| Hap68 | 1 | LM326 | Bromus riparius | Bromeae | 2014 | CA, MB | Minnewasta Golf Course | 49.187079, −98.129535 | GC2 | CAW | Bro |
| Hap69 | 1 | LM328 | Elymus repens | Triticeae | 2014 | CA, MB | Minnewasta Golf Course | 49.187079, −98.129535 | GC1 | CAW | Tri |
| Hap70 | 1 | LM330 | Elymus repens | Triticeae | 2014 | CA, MB | AAFC Morden RDC | 49.184991, −98.091762 | GC1 | CAW | Tri |
| Hap71 | 1 | LM331 | Elymus repens | Triticeae | 2014 | CA, MB | Snowflake | 49.063439, −98.652897 | GC3 | CAW | Tri |
| Hap72 | 1 | LM332 | Elymus repens | Triticeae | 2014 | CA, MB | Snowflake | 49.063439, −98.652897 | GC3 | CAW | Tri |
| Hap73 | 1 | LM335 | Phalaris canariensis | Poeae | 2014 | CA, MB | Peachland | 49.778671, −119.735858 | GC3 | CAW | n.a. |
| Hap74 | 1 | LM35 | Triticum aestivum | Triticeae | 2000 | CA, MB | Crop District: MB1 | 49.362259, −100.252217 | GC1 | CAW | TriC |
| Hap75 | 1 | LM36 | Triticum aestivum | Triticeae | 2000 | CA, MB | Crop District: MB3 | 50.322365, −100.410408 | GC3 | CAW | TriC |
| Hap76 | 1 | LM363 | Elymus repens | Triticeae | 2015 | CA, SK | near Wapella | 50.261835, −101.972356 | GC3 | CAW | Tri |
| Hap77 | 1 | LM372 | Elymus repens | Triticeae | 2014 | CA, MB | Morden | 49.196098, −98.106165 | GC1 | CAW | Tri |
| Hap78 | 1 | LM382 | Bromus inermis | Bromeae | 2015 | CA, SK | Wapella | 50.261835, −101.972356 | GC3 | CAW | Bro |
| Hap79 | 1 | LM39 | Triticum durum | Triticeae | 2000 | CA, SK | Crop District: SK1b | 50.046218, −102.230159 | GC1 | CAW | TriC |
| Hap80 | 2 | LM399 | Bromus inermis | Bromeae | 2015 | CA, SK | Wapella | 50.261835, −101.972356 | GC3 | CAW | Bro |
| LM406 | Bromus inermis | Bromeae | 2015 | CA, SK | Wapella | 50.261835, −101.972356 | GC3 | CAW | Bro | ||
| Hap81 | 1 | LM402 | Bromus inermis | Bromeae | 2015 | CA, SK | Wapella | 50.261835, −101.972356 | GC2 | CAW | Bro |
| Hap82 | 1 | LM403 | Bromus inermis | Bromeae | 2015 | CA, SK | Wapella | 50.261835, −101.972356 | GC1 | CAW | Bro |
| Hap83 | 1 | LM407 | Elymus repens | Triticeae | 2015 | CA, SK | Wapella | 50.261835, −101.972356 | GC1 | CAW | Tri |
| Hap84 | 1 | LM410 | Bromus inermis | Bromeae | 2015 | CA, SK | Wapella | 50.261835, −101.972356 | GC1 | CAW | Bro |
| Hap85 | 1 | LM411 | Bromus inermis | Bromeae | 2015 | CA, SK | Wapella | 50.261835, −101.972356 | GC2 | CAW | Bro |
| Hap86 | 1 | LM414 | Secale cereale | Triticeae | 2014 | CA, SK | Scott | 52.366225, −108.830474 | GC3 | CAW | TriC |
| Hap87 | 1 | LM415 | Secale cereale | Triticeae | 2014 | CA, SK | Watrous | 51.686058, −105.466174 | GC3 | CAW | TriC |
| Hap88 | 1 | LM420 | Bromus inermis | Bromeae | 2015 | CA, SK | Wapella | 50.261835, −101.972356 | GC3 | CAW | Bro |
| Hap89 | 1 | LM459 | Elymus sp. | Triticeae | 2016 | CA, ON | Nepean, Dealership Drive | 45.264625, −75.782265 | GC2 | CAE | Tri |
| Hap90 | 1 | LM46 | Triticum durum | Triticeae | 2000 | CA, AB | Crop District: AB1 | 50.263277, −110.561590 | GC2 | CAW | TriC |
| Hap91 | 1 | LM460 | Bromus inermis | Bromeae | 2016 | CA, QC | Gatineau, Rue Notre‐Dame‐de‐l'île | 45.432596, −75.710750 | GC2 | CAE | Bro |
| Hap92 | 1 | LM463 | Elymus repens | Triticeae | 2016 | CA, ON | St.Isidore, Caledonia Road | 45.388675, −74.907616 | GC1 | CAE | Tri |
| Hap93 | 1 | LM465 | Elymus repens | Triticeae | 2016 | CA, ON | Ottawa, Albert Road | 45.414394, −75.710383 | GC1 | CAE | Tri |
| Hap94 | 1 | LM466 | Elymus repens | Triticeae | 2016 | CA, ON | Casselman, Rue Principle (Route 7) | 45.313275, −75.090372 | GC1 | CAE | Tri |
| Hap95 | 1 | LM467 | Secale cereale | Triticeae | 2015 | CA, SK | Yorkton | 51.216752, −102.466594 | GC1 | CAW | TriC |
| Hap96 | 1 | LM470 | Elymus repens | Triticeae | 2016 | CA, ON | Ottawa, Central Experimental Farm | 45.379765, −75.717087 | GC2 | CAE | Tri |
| Hap97 | 1 | LM471 | Elymus repens | Triticeae | 2016 | CA, ON | Ottawa, Central Experimental Farm | 45.379765, −75.717087 | GC1 | CAE | Tri |
| Hap98 | 1 | LM472 | Triticum aestivum | Triticeae | 2016 | CA, ON | Ottawa, Central Experimental Farm | 45.383782, −75.718501 | GC3 | CAE | TriC |
| Hap99 | 1 | LM473 | Triticum aestivum | Triticeae | 2016 | CA, ON | Ottawa, Central Experimental Farm | 45.379765, −75.717087 | GC3 | CAE | TriC |
| Hap100 | 1 | LM474 | Hordeum vulgare | Triticeae | 2016 | CA, ON | Ottawa, Central Experimental Farm | 45.383249, −75.710674 | GC3 | CAE | TriC |
| Hap101 | 1 | LM475 | Elymus repens | Triticeae | 2016 | CA, ON | Ottawa, Central Experimental Farm | 45.388133, −75.703122 | GC1 | CAE | Tri |
| Hap102 | 2 | LM476 | Bromus inermis | Bromeae | 2016 | CA, ON | Ottawa, Central Experimental Farm | 45.388133, −75.703122 | GC2 | CAE | Bro |
| LM55 | Secale cereale | Triticeae | 2000 | CA, AB | Crop District: AB4 | 50.960038, −110.887276 | GC2 | CAW | TriC | ||
| Hap103 | 1 | LM477 | Elymus repens | Triticeae | 2016 | CA, ON | Nepean, Barrhaven | 45.264095, −75.780920 | GC2 | CAE | Tri |
| Hap104 | 1 | LM478 | Elymus repens | Triticeae | 2016 | CA, ON | Nepean, Barrhaven | 45.264095, −75.780920 | GC3 | CAE | Tri |
| Hap105 | 1 | LM479 | Cyperaceae | n.a. | 2016 | CA, ON | Lansdowne, Island Parkway | 44.349027, −76.094653 | GC3 | CAE | n.a. |
| Hap106 | 1 | LM480 | Elymus repens | Triticeae | 2016 | CA, ON | Grand Valley | 43.867404, −80.307495 | GC1 | CAE | Tri |
| Hap107 | 1 | LM481 | Elymus repens | Triticeae | 2016 | CA, ON | n.n. | 43.943560, −80.358900 | GC1 | CAE | Tri |
| Hap108 | 1 | LM50 | Triticum durum | Triticeae | 2000 | CA, AB | Crop District: AB2 | 49.958935, −112.804169 | GC3 | CAW | TriC |
| Hap109 | 1 | LM54 | Secale cereale | Triticeae | 2000 | CA, AB | Crop District: AB4 | 50.960038, −110.887276 | GC2 | CAW | TriC |
| Hap110 | 1 | LM558 | Elymus repens | Triticeae | 2016 | CA, QC | Saint‐Lin‐Laurentides | 45.857732, −73.798360 | GC1 | CAE | Tri |
| Hap111 | 1 | LM562 | Elymus repens | Triticeae | 2016 | CA, QC | Maskinongé | 46.228879, −73.012555 | GC3 | CAE | Tri |
| Hap112 | 1 | LM566 | Hordeum vulgare | Triticeae | 2016 | CA, QC | Ste‐Cécile‐de‐Milton | 45.491011, −72.761878 | GC1 | CAE | TriC |
| Hap113 | 1 | LM569 | Triticum aestivum | Triticeae | 2016 | CA, QC | Louisville | 46.258056, −73.008924 | GC1 | CAE | TriC |
| Hap114 | 1 | LM59 | Avena sativa | Aveneae | 2005 | CA, MB | Portage la prairie | 49.969321, −98.289172 | GC3 | CAW | n.a. |
| Hap115 | 2 | LM60 | Avena sativa | Aveneae | 2005 | CA, MB | Portage la prairie | 49.969321, −98.289172 | GC3 | CAW | n.a. |
| LM683 | Bromus inermis | Bromeae | 2017 | CA, ON | High Lonesome Nature Reserve | 45.331743, −76.369610 | GC3 | CAE | Bro | ||
| Hap116 | 1 | LM634 | Elymus repens | Triticeae | 2017 | CA, ON | Nepean, Barrhaven | 45.270924, −75.775472 | GC3 | CAE | Tri |
| Hap117 | 1 | LM635 | Elymus repens | Triticeae | 2017 | CA, ON | Nepean, Barrhaven | 45.270290, −75.777285 | GC1 | CAE | Tri |
| Hap118 | 1 | LM636 | Elymus repens | Triticeae | 2017 | CA, ON | Nepean, Barrhaven | 45.271271, −75.777757 | GC1 | CAE | Tri |
| Hap119 | 1 | LM637 | Bromus inermis | Bromeae | 2017 | CA, ON | Nepean, Barrhaven | 45.271656, −75.776952 | GC1 | CAE | Bro |
| Hap120 | 1 | LM638 | Elymus repens | Triticeae | 2017 | CA, ON | Nepean, Barrhaven | 45.271656, −75.776952 | GC3 | CAE | Tri |
| Hap121 | 1 | LM639 | Elymus repens | Triticeae | 2017 | CA, ON | Nepean, Barrhaven | 45.271656, −75.776952 | GC1 | CAE | Tri |
| Hap122 | 1 | LM640 | Calamagrostis xacutiflora | Poeae | 2017 | CA, QC | Gatineau | 45.432596, −75.710750 | GC1 | CAE | n.a. |
| Hap123 | 1 | LM641 | Elymus repens | Triticeae | 2017 | CA, ON | Mer Bleue, Dolman Ridge Rd | 45.40639, −75.51833 | GC1 | CAE | Tri |
| Hap124 | 2 | LM642 | Elymus repens | Triticeae | 2017 | CA, ON | Woodlawn, Torbolton Ridge Rd | 45.425462, −76.081984 | GC1 | CAE | Tri |
| LM652 | Elymus repens | Triticeae | 2017 | CA, ON | Woodlawn, Torbolton Ridge Rd | 45.425462, −76.081984 | GC1 | CAE | Tri | ||
| Hap125 | 1 | LM643 | Elymus repens | Triticeae | 2017 | CA, ON | Mer Bleue, Dolman Ridge Rd | 45.40639, −75.51833 | GC3 | CAE | Tri |
| Hap126 | 1 | LM646 | Elymus repens | Triticeae | 2017 | CA, ON | High Lonesome Nature Reserve | 45.3327, −76.372 | GC3 | CAE | Tri |
| Hap127 | 1 | LM647 | Bromus inermis | Bromeae | 2017 | CA, ON | High Lonesome Nature Reserve | 45.331743, −76.369612 | GC1 | CAE | Bro |
| Hap128 | 1 | LM648 | Elymus repens | Triticeae | 2017 | CA, ON | High Lonesome Nature Reserve | 45.331743, −76.369613 | GC1 | CAE | Tri |
| Hap129 | 1 | LM649 | Phleum pratense | Poeae | 2017 | CA, ON | High Lonesome Nature Reserve | 45.331743, −76.369614 | GC1 | CAE | n.a. |
| Hap130 | 1 | LM651 | Elymus virginicus | Triticeae | 2017 | CA, ON | Woodlawn, Torbolton Ridge Rd | 45.425462, −76.081984 | GC2 | CAE | Tri |
| Hap131 | 1 | LM653 | Elymus repens | Triticeae | 2017 | CA, ON | Ottawa, Constance bay | 45.492377, −76.075568 | GC1 | CAE | Tri |
| Hap132 | 1 | LM655 | Pascopyrum smithii | Triticeae | 2017 | CA, MB | AAFC Brandon RDC | 49.839271, −99.930058 | GC3 | CAW | Tri |
| Hap133 | 1 | LM656 | Elymus lanceolatus | Triticeae | 2017 | CA, MB | AAFC Brandon RDC | 49.839271, −99.930058 | GC1 | CAW | Tri |
| Hap134 | 1 | LM657 | Elymus innovatus | Triticeae | 2017 | CA, AB | Jasper National Park | 52.869451, −118.076100 | GC1 | CAW | Tri |
| Hap135 | 1 | LM66 | Poaceae | n.a. | 1996 | CA, MB | Crop District: MB3 | 50.322365, −100.410408 | GC2 | CAW | n.a. |
| Hap136 | 1 | LM681 | Elymus repens | Triticeae | 2017 | CA, ON | High Lonesome Nature Reserve | 45.331743, −76.369611 | GC3 | CAE | Tri |
| Hap137 | 1 | LM686 | Pascopyrum smithii | Triticeae | 2017 | CA, MB | AAFC Brandon RDC | 49.839271, −99.930058 | GC2 | CAW | Tri |
| Hap138 | 1 | LM710 | Lolium aruninaceum | Poeae | 2017 | CA, ON | Ottawa, Quyon Ferry Landing | 45.511693, −76.222032 | GC1 | CAE | n.a. |
| Hap139 | 1 | LM711 | Bromus inermis | Bromeae | 2017 | CA, BC | Peace River District | 56.875329, −123.298317 | GC2 | CAW | Bro |
| Hap140 | 1 | LM712 | Bromus inermis | Bromeae | 2017 | CA, MB | Morden | 49.196098, −98.106165 | GC3 | CAW | Bro |
| Hap141 | 1 | LM714 | Elymus repens | Triticeae | 2017 | CA, QC | Gatineau Park | 45.583699, −75.896328 | GC2 | CAE | Tri |
| Hap142 | 1 | LM715 | Elymus repens | Triticeae | 2017 | CA, ON | Arnprior | 45.435753, −76.351986 | GC3 | CAE | Tri |
| Hap143 | 1 | LM717 | Elymus repens | Triticeae | 2017 | CA, ON | Ottawa | 45.422550, −75.531216 | GC3 | CAE | Tri |
| Hap144 | 1 | LM83 | Bromus ciliatus | Bromeae | 1956 | CA, BC | Baldonnel | 56.217560, −120.689544 | GC1 | CAW | Bro |
| Hap145 | 1 | LM88 | Secale cereale | Triticeae | 2015 | CA, SK | near Arborfield | 53.104120, −103.660996 | GC1 | CAW | TriC |
| Hap146 | 1 | LM9 | Triticum aestivum | Triticeae | 1996 | CA, MB | Crop District: MB7 | 49.958573, −98.474907 | GC1 | CAW | TriC |
Frequency of haplotypes.
The approximate coordinates were obtained by locating the centre of the described location on Google Map. For hap50, hap52, hap102, and hap115, the medians of coordinates from multiple locations were used.
Genetic clusters: GC1—3; geographic regions: Eastern Canada (CAE), Western Canada (CAW), Western USA (USW); host groups: crop Triticeae (TriC), noncrop Triticeae (Tri), Bromeae (Bro), n.a., not applied.
FIGURE 2.

Geographic locations of studied samples, and designation of geographic regions: western Canada (CAW), eastern Canada (CAE) and western USA (USW). Larger sizes of rhombus marks indicate more samples
Besides geographic isolation, host specialization is considered another major force driving population subdivision in plant pathogen populations (Milgroom, 2015a). The correlations between genetic clusters with three major host groups were examined: (a) Bromeae (Bromus, 32 haplotypes); (b) Noncrop Triticeae (Elymus, Pascopyrum, Thinopyrum, 56 haplotypes), and (c) Crop Triticeae (Hordeum, Secale, Triticum, Trirticale, 36 haplotypes). The two haplotypes on Avena (Aveneae) and other 22 haplotypes were not included in the analyses because their host species belonged to distant taxa and small sample size. Genetic differentiation among these three host groups was examined through AMOVA, PCoA, and pairwise genetic differentiation, ΦPT statistics, and compared with the estimates from genetic clusters.
To understand the characteristics of each subpopulations, the allelic pattern was examined in GenAlEx through the parameters: N a (number of different alleles), N e (number of effective alleles = , I (Shannon's information index = −1* ∑ (P i * Ln (P i))), h (haploid genetic diversity = ), where P i is the frequency of the ith allele for the population; is the sum of the squared population allele frequencies. Nucleotide diversity (π), mutation rate (θ), recombination parameter (R), linkage disequilibrium, and neutrality were tested in DnaSP v6. The recombination parameters include R per gene (R g, recombination rate per generation between the most distant sites), R per adjacent sites (R a), and minimum recombination events (R m). The parameter for linkage disequilibrium was the Kelly's ZnS statistic measuring the overall association between polymorphic sites (Kelly, 1997), the average r 2 of all pairwise comparison (Hill & Robertson, 1968), Rozas' Za (association between adjacent polymorphic sites), and ZZ (= ZnS − Za) (Rozas et al., 2001). We compared the estimated recombination and linkage disequilibrium from each GCs with the combined populations. The rationale is that a higher level of recombination and lower level of LD is expected in subpopulations (genetic clusters) than in the combined population if the population was subdivided. Neutrality tests were conducted using Tajima's D, Fu, and Li's D* and F* to find any evidence of selection in each GC.
3. RESULTS
3.1. DNA sequences for each locus
Varied number of sequences was obtained from each locus: 227 for TEF1, 204 for RPB2, 264 for easE, and 274 for easA, among which 156 samples were successfully amplified for all four genes. All sequences were submitted to GenBank (see Data Accessibility, Table S1). The alignment of each gene resulted in matrices: TEF1‐α 648 sites with 227 sequences, RPB2 693 sites with 204 sequences, easE 756 sites with 264 sequences, and easA 246 sites with 274 sequences. The matrix of concatenated sequences of four genes along with reference sequences composed of 327 sequences and 2,345 characters. The most parsimonious trees showed that 303 samples grouped with ex‐neotype of C. purpurea s.s. (DAOMC 251723 = CCC771) as a clade with a 94% bootstrapping support (Figure S1) with predominant internal branches having supports lower than 70%, indicating the 303 samples belonged to a single species C. purpurea s.s.
Analyses of DNA polymorphism showed that easE had a much higher proportion of variable sites (0.127), haplotype, and nucleotide diversities (0.950 ± 0.008, 0.0144 ± 0.00023), than three other genes. TEF1‐α was the least variable (Table 2). For neutrality tests, easA showed nonsignificant deviation from neutrality based on all parameters (Tajima's D, Fu & Li's D*, Fu & Li's F*); easE showed nonsignificant deviation based on Tajima's D, however, significant at 0.02 critical level based on Fu & Li' D and F; TEF1‐α and RPB2 showed significant departure from neutral based on all parameters at various critical levels (p‐value < .01, .02, .05). Overall, Fu & Li's statistics based on coalescence simulation, as expected, showed more sensitive than Tajima's D (Table 2). In general, easA appeared neutral, easE under slight selection which can only be detected by Fu & Li's statistics, but TEF1‐α and RPB2 were likely under selection, which could be a result of highly structured population or selective sweep (see more results for tests in subpopulations and in Section 4).
TABLE 2.
DNA polymorphism and neutrality of each loci
| Loci | Number of sequences | DNA polymorphism | Average number of nucleotide differences | Neutrality | ||||||||||||||
|---|---|---|---|---|---|---|---|---|---|---|---|---|---|---|---|---|---|---|
| Site a | Variable sites | Ratio of variable sites | Singleton | Parsimony informative | Number of haplotypes | Haplotype diversity | Nucleotide diversity | Theta (per site)from S | Theta (per sequence) from S | Tajima's D | p‐value | Fu & Li's D* | p‐value | Fu & Li's F* | p‐value | |||
| N | TS | S | S/TS | h | Hd ± SD | Pi ± SD | θ‐W | Θ‐W | k | TjD | P | FuLi D* | P | FuLi F* | P | |||
| TEF1 | 227 | 648 | 37 | 0.0571 | 23 | 14 | 31 | 0.74 ± 0.027 | 0.0024 ± 0.00021 | 0.010 | 6.17 | 1.54 | −2.146 | <.01 *** | −5.835 | <.02 *** | −5.122 | <.02 *** |
| RPB2 | 204 | 693 | 43 | 0.062 | 26 | 17 | 44 | 0.82 ± 0.019 | 0.0030 ± 0.00018 | 0.011 | 7.30 | 2.04 | −2.179 | <.01 *** | −6.142 | <.02 *** | −5.311 | <.02 *** |
| easE | 264 | 756 | 96 | 0.127 | 39 | 57 | 94 | 0.95 ± 0.008 | 0.0144 ± 0.00023 | 0.021 | 15.61 | 10.92 | −1.112 | >.10 n.s. | −5.015 | <.02 *** | −3.750 | <.02 *** |
| easA | 274 | 246 | 19 | 0.0772 | 2 | 17 | 28 | 0.91 ± 0.007 | 0.0119 ± 0.00042 | 0.012 | 3.07 | 2.92 | −0.251 | >.10 n.s. | 0.131 | >.10 n.s. | −0.027 | >.10n.s. |
*** significant at indicated level, i.e. .01, or .02.
3.2. Haplotype analyses
Haplotype diversity varied between genes with the TEF1‐α having 31 haplotypes from 227 isolates, RPB2 44 haplotypes from 204 isolates, easE 94 haplotypes from 264 isolates, and easA 28 haplotypes from 274 isolates. A greater percentage of private haplotypes were identified in the first three genes, that is, 58% (18/31), 66% (29/44), and 62% (58/94), while relatively fewer private haplotypes 32% (9/28) were observed for easA (Table S2). For the concatenated alignment of 156 isolates, 146 haplotypes were identified, among which one was shared by three isolates, eight haplotypes consisted of 2 isolates, and all other haplotypes (94%) were unique. Of the nine shared haplotypes, only three (hap 50, hap 102, hap 115) were found in more than one region (Western Canada, Eastern Canada; Table 1).
3.3. Population structure analyses
Three genetically distinct clusters, GC1–3, were recovered on the network generated by SplitsTree4 V4.14.8, with GC1 being more distantly related to the other two clusters, GC2 and 3 (Figure 3a). DensiTree view of the 9,001 resulting trees from BEAST confirmed the network pattern in that GC1 was clearly separated from others, while GC3 was nested inside of GC2. The branching pattern also suggested that the divergence between GC1 and the other two clusters was more ancestral, while GC3 from GC2 was more recent (Figure 3b). The rooted phylogeny of haplotypes supported this trajectory in that GC1 appeared as a paraphyletic group in relationship to GC2 and GC3, while majority GC2 samples formed a group paraphyletic to GC3 except three haplotypes located inside of GC3 clade (Figure S2). The nonreciprocal and incomplete separations of GCs indicate either recent divergence (intraspecific), or/and the lower inference power of the strict phylogenetic approach compared with networking analyses at intraspecies level. The separation of three genetic clusters was also observed in the PCoA analyses showing GC1 clearly separated from other samples, while the separation between GC2 and GC3 was not clear‐cut (Figure 4a).
FIGURE 3.

Network analyses based on 146 haplotypes of four‐locus concatenated sequences using SplitsTree4 V4.14.8 (a) and BEAST v2.5 (b)
FIGURE 4.
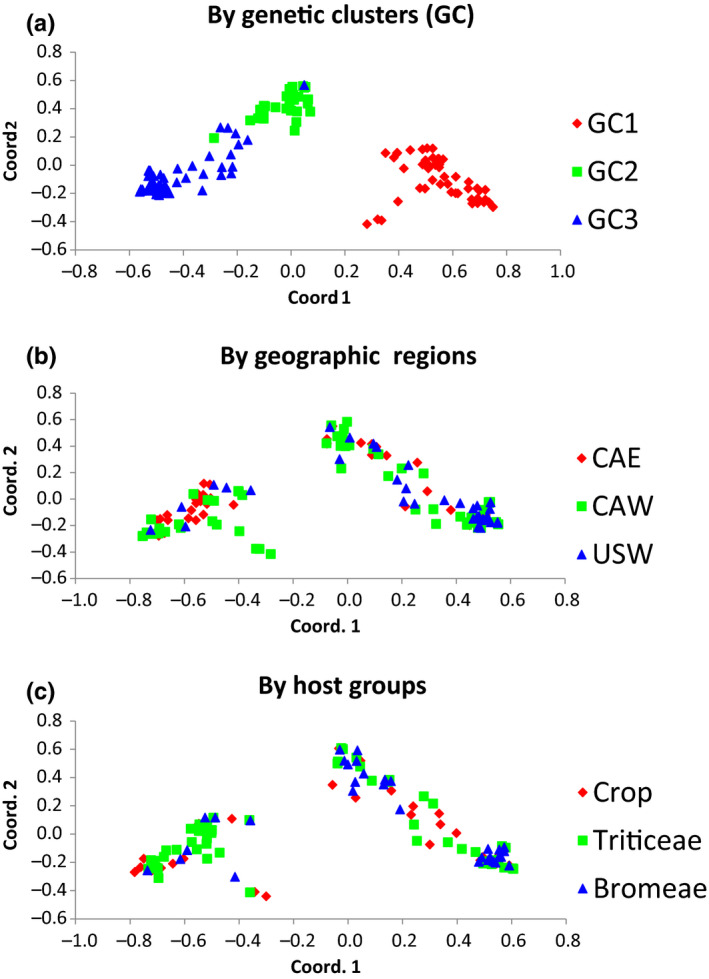
Principal coordinate analyses (PcoA) of 146 haplotypes using GenAlex 6.5. Populations were assigned based on genetic cluster (a), geographical regions (b), and host groups (c)
Genetic differentiation among the genetic clusters was statistically significant (ΦPH = 0.445, S nn = 0.991), with very limited gene flow (N m = 0.46; Table 3). Populations of C. purpurea s.s. were also significantly differentiated based on geographic regions using the permutation tests; however, S nn (0.5808) was close to 0.5 and the PCoA did not ascertain geographic separation, indicating subpopulations were not strongly differentiated and likely belong to the same population (Hudson, 2000). In addition, molecular variance within geographic regions (96%) was much higher than that among the regions (4%). The measure of population subdivision (ΦPH), was much lower (0.036 versus 0.445), and gene flow level (N m = 6.27) was much higher than among three genetic clusters. The differentiation among three host groups was not statistically significant and had a higher level of gene flow (N m = 9.31; Table 3). PCoA analyses did not separate geographic regions or host groups (Figure 4b,c).
TABLE 3.
Analysis of molecular variance and sequences‐based statistics for genetic clusters, geographic populations, and host groups
| Parameters d | Genetic clusters a | Geographic regions b | Host groups c | |||
|---|---|---|---|---|---|---|
| p‐value | p‐value | p‐value | ||||
| Molecular variance among populations | 45% | 4% | 1% | |||
| Molecular variance within populations | 55% | 96% | 99% | |||
| ΦPT | 0.445 | .001*** | 0.036 | .003** | 0.011 | .106 n.s. |
| S nn | 0.99145 | .0000*** | 0.5808 | .000*** | 0.376 | .251 n.s. |
| N m | 0.46 | 6.27 | 9.31 | |||
Abbreviation: ns, not significant.
Clusters inferred by SplitsTree and BEAST analyses.
Populations defined by geographic regions, that is, Eastern Canada, Western Canada, Western US.
Three populations compared: Bromeae, Triticeae (noncrops), and crops in Triticeae.
Molecular variance among and within populations, Φ PT (analog of F ST), were estimated using GenAlEx; S nn (Hudson, 2000) and N m (Nei, 1982) estimates of gene flow (migration number per generation) were from dnaSP.
.01 < p<.05; **.001 < p<.01; ***p < .001.
The pairwise comparison of genetic differentiation between genetic clusters, geographic regions, and host groups showed that three genetic clusters were significantly differentiated from each other, and the values of ΦPH and Nei's D between GC1 and GC3 were the greatest (0.51, 0.088). Pairwise comparisons between Western U.S. and Canadian regions (CAE, CAW) were also statistically significant; however, the level of the differentiation as estimated by ΦPH values and Nei's D was an order of magnitude lower than those between genetic clusters (Table 4). The differentiation between populations associated with host groups Bromeae and Triticeae was close to being significant (ΦPH = 0.023, p‐value .056) and was not significant between crops and each grass tribe (Table 4). These patterns can also be observed by examining the percentage of GCs in each geographic region and host group. In western US region, which is comprised of intermountain regions in Colorado and Wyoming, isolates belong to the genetic cluster GC3 were the most abundant, composing 70% of the C. purpurea isolates recovered. The GC3 genetic cluster was also the most frequently observed population in western Canada (41%) (Figure 5a). However, GC1 was the most abundant population in eastern Canada, comprising 47% of the isolates recovered (Figure 5a). In all region, GC2 was the least abundant genetic cluster observed, never representing more than 22% of C. purpurea isolates recovered (Figure 5a). Mantel test on isolation by distance revealed a low correlation between genetic distances (among the haplotypes) and the logarithm of geographic distances, with very low value of r (0.052), however, p‐value = .010, indicating significant nonrandom distribution of haplotypes (Figure 6). For host groups, the Crops (Triticeae) and Bromeae groups had higher GC3 (47%, 44% respectively) than GC1 (36%, 22%), while Triticeae (noncrops) groups had a higher percentage of GC1 genotype (46%) than GC3 (38%) (Figure 5b). Bromeae group had a higher percentage of GC2 (34%) genotype than the other two groups.
TABLE 4.
Pairwise genetic differentiation measured as ΦPT(analogous of F ST), and N ei genetic distance between genetic clusters, geographic populations, and host groups
| Genetic clusters | Geographic regions | Host groups | |||||||||
|---|---|---|---|---|---|---|---|---|---|---|---|
| GC 1 | GC 2 | GC 3 | CAE | CAW | USW | Crops | Triticeae | Bromeae | |||
| GC 1 | 0.057 | 0.088 | CAE | 0.003 | 0.012 | Crops | 0.003 | 0.004 | |||
| GC 2 | 0.38*** | 0.040 | CAW | 0.007ns | 0.008 | Triticeae | 0.001ns | 0.006 | |||
| GC 3 | 0.51*** | 0.34*** | USW | 0.07*** | 0.044*** | Bromeae | 0.008ns | 0.023* | |||
Upper diagonal listed N ei genetic distances, below diagonal ΦPT Values, p‐value by 9,999 permutation test ***<.01, **<.05, *<.1, ns > .1
FIGURE 5.

Percentages of three genetic clusters in three geographic regions (a), and three host groups (b)
FIGURE 6.

Mantel test for isolation by distance (IBD) showing no evidence of a correlation between genetic distance versus log geographic distance
3.4. Demographics of genetic clusters
Allelic analyses of haplotypes showed that GC1 had a slightly higher number of effective alleles N e = 1.13 than GC2 (1.11) and GC3 (1.09), highest allelic diversity measured as Shannon's information index I = 0.144, and haploid genetic diversity h = 0.083. GC3 had highest total allele number (N a = 1.66), rare (frequency < 5%), and private allele frequencies (0.48, 0.34; Figure 7). Analyses of DNA sequences of 156 samples in DnaSP v6 showed that GC1 had slightly higher nucleotide diversity (π = 0.00555), while GC3 had higher mutation rates per site and per sequence (θ − w = 0.0083, Θ − W = 19.450). Neutrality tests based on Tajima's D, Fu, and Li's D* and F* all suggested GC3 was under significant selective pressure. GC1 was under detectable pressure based on Fu and Li's D* (p‐value < .1), but not based on Tajima's D and Fu and Li's F*. GC2 was not under selection based on all parameters (Table 5). Two of the recombination parameters of the combined population of all three populations (R g = 61.5, R a = 0.0262) were lower than the three genetic clusters independently. These parameters were the highest in GC2 (176, 0.0751), further supporting population subdivision. Combination of GC1 and GC2 resulted in lower values of R g (109) and R a (0.0465) compared with each individual genetic clusters (GC1: R g = 112, R a = 0.0478; GC2: R g = 176, R a = 0.0751). The same pattern was shown when GC1 and GC3 were combined (Table 6). This pattern can be interpreted as the result of the reduced random mating between GC1 and GC2, and between GC1 and GC3. However, when GC2 and GC3 were combined, intermediate values of Rg (82) and R a (0.035) were resulted, which is consistent with the result of PCoA analyses showing the incomplete separation between GC2 and GC3 (Figure 4a). The estimated minimum recombination events in the combined populations (R m = 13–18) were higher than the individual GCs (9–14). A likely explanation could be that R m was affected by the sample sizes in that the combined population had a larger sample size (N = 85–156 samples) than three GCs (N = 55, 30, 71 samples, respectively). The estimates of LD parameters, Z ns, Z a, ZZ, Wall's B, and Q, were very low (<0.1, or ≈ 0) suggesting frequent recombination in GCs and among GCs in general. In comparison with individual GCs, the lower values of combined populations, that is, GC1 with GC2, and GC1 with GC3, could suggest the lower recombination during selective sweeping between GC1 and GC2 and between GC1 and GC3 (Kelly, 1997).
FIGURE 7.

Allelic pattern across three genetic clusters. N a, number of different alleles; N e, number of effective alleles = , I Shannon's information index = −1×∑(PiLn(Pi)), h, haploid genetic diversity = , where P i is the frequency of the ith allele for the population (cluster)
TABLE 5.
Genetic diversity and neutrality of genetic clusters based on four genes concatenated alignment
| Subpopulation | Genetic diversity | Neutrality | |||||||||
|---|---|---|---|---|---|---|---|---|---|---|---|
| Number of sequences | Number of haplotypes | Nucleotide diversity | Theta (per site) from Sa | Theta (per sequence) from S | Tajima's D | p‐value | Fu & Li's D* | p‐value | Fu & Li's F* | p‐value | |
| N | h | π ± SD | θ − W ± SD | Θ‐W | Tjm D | P | Fu & Li D* | P | Fu & Li F* | P | |
| GC 1 | 55 | 53 | 0.0056 ± 0.0003 | 0.0079 ± 0.0009 | 18.577 | −1.1285 | >.10 ns | −1.8955 | <.1* | −1.9198 | >.1 ns |
| GC 2 | 30 | 29 | 0.0048 ± 0.0002 | 0.0056 ± 0.0008 | 13.126 | −0.5919 | >.10 ns | −0.9500 | >.1 ns | −0.9825 | >0.1 ns |
| GC 3 | 71 | 64 | 0.0041 ± 0.0002 | 0.0084 ± 0.0009 | 19.45 | −1.7398 | <.1* | −4.0161 | <.02*** | −3.7277 | <.02*** |
| Combined | 156 | 146 | 0.0072 ± 0.0124 | 0.0116 ± 0.0009 | 27.205 | −1.326 | >.10 ns | −4.8238 | <.02*** | −3.8362 | <.02*** |
TABLE 6.
Recombination and linkage disequilibrium between genetic clusters based on four genes concatenated alignment
| GCs | Recombination | Linkage disequilibrium | |||||||
|---|---|---|---|---|---|---|---|---|---|
| N | R g | R a | R m | Z nS | Z a | ZZ | Wall's B | Wall's Q | |
| GC 1 | 55 | 112 | 0.0478 | 14 | 0.0366 | 0.0979 | 0.0613 | 0.0741 | 0.0613 |
| GC 2 | 30 | 176 | 0.0751 | 11 | 0.0501 | 0.103 | 0.0529 | 0.04 | 0.0588 |
| GC 3 | 71 | 65.8 | 0.0281 | 9 | 0.0293 | 0.1624 | 0.1331 | 0.1209 | 0.1848 |
| GC1 + GC2 | 85 | 109 | 0.0465 | 16 | 0.026 | 0.0597 | 0.0337 | 0.0288 | 0.0571 |
| GC1 + GC3 | 126 | 35.8 | 0.0153 | 17 | 0.0216 | 0.0817 | 0.0602 | 0.0469 | 0.0698 |
| GC2 + GC3 | 101 | 82 | 0.035 | 13 | 0.0197 | 0.102 | 0.0823 | 0.0811 | 0.1339 |
| All | 156 | 61.5 | 0.0262 | 18 | 0.0163 | 0.0638 | 0.0475 | 0.0352 | 0.049 |
4. DISCUSSION
Our study is the first in‐depth investigation of the population structure of C. purpurea s.s (excluding previously identified phylogenetic species) in Canada and western USA using multilocus genotyping. The results from the network analyses (Figure 3), AMOVA (Table 3), PCoA (Figure 4), and demographic parameters (Hudson's S nn, Nei's genetic distance and N m; Tables 3 and 4) clearly demonstrated the existence of three genetic clusters (GC1–3; Figure 3) that co‐exist throughout Canada and western U.S. on agricultural and nonagricultural grass species.
Coalescence analyses suggested a relatively recent divergence of GC3 from GC2, whereas the divergence between GC1 and GC2 was more ancestral (Figure 3b). This evolutionary trajectory was supported by the rooted phylogeny (Figure S2) and by demographic parameters; that is, GC1 and GC2 had higher estimates of effective allele number, allele richness (Shannon's information index), haploid diversity, and nucleotide diversity than GC3 (Figure 7, Table 5). Moreover, GC3 had higher mutation rates (θ − w = 0.0084, Θ − w = 19.35), higher rare, and private alleles and showed the deviation from neutrality, indicating GC3 is likely experiencing recent fast adaptation under selective pressure. The separation of three genetic clusters seems consistent with what was found in Oregon and Washington using simple sequence repeat markers (Gilmore et al., 2016). In that study, four groups were recovered: Group 1 was distantly related to other three groups, and later determined to be a different species, C. humidiphila (Pažoutová et al., 2015). Groups 2 and 3 were more closely related to each other than to group 4. It is likely that group 4 identified by Gilmore et al. (2016) corresponds to GC1 in this study, and the other two groups correspond with GC 2 and GC3 in our study.
High levels of genetic variation and a high proportion of private and rare haplotypes in each genetic cluster suggest a rapid expansion and disruptive selection after introduction or genetic drift (bottleneck) and limited gene flow between the genetic clusters (Milgroom, 2015b). Since neither geographic location nor host range seem to be creating barriers among the three GCs, some other evolutionary force must be maintaining the separate populations. Sexual or vegetative incompatibility, another potential mechanism, might be maintaining this division. Reduced recombination between GC1 with either GC2 or GC3 was demonstrated by the comparison of estimates for recombination rates (R g and R a) and LD (Z ns, Z a and ZZ) within and between the GCs (Table 6). In addition, during a sclerotium germination experiment for a companion study, Liu et al. (2020) observed an interesting phenomenon that raised several questions regarding sexual reproduction in Claviceps species. Several sclerotia of C. ripicola (a close relative of C. purpurea), after chill treatment and incubation for 8–10 weeks, produced tiny buds on sclerotia, and then, these buds stopped growing up to normal stromata (Liu et al., 2020). The authors speculate that the abortion might be due to the absence of a compatible partner. Although Esser and Tudzynski (1978) demonstrated that heterokaryosis is not required for the completion of the life cycle in C. purpurea, other studies reported heterokaryosis occurred frequently on sclerotia and occasionally in artificial media (Amici et al., 1967; Tudzynski, 2006). Mating between different strains can be obtained by inoculating rye florets with mixed conidial suspensions (Tudzynski et al., 1982). If homothallism is the most common state for C. purpurea s.s., this would also help to maintain the three distinct genetic clusters. The occasional outcrossing may result in novel lineages, perhaps even GC3. However, an in‐depth understanding of genetic mechanisms in Claviceps is lacking. Vegetative compatibility has been applied for intraspecific classification of many sexual and asexual fungal species, including species closely related to ergot fungi, that is, Epichloë spp. (Chung & Schardl, 1997; Leslie, 1993), but has been understudied in Claviceps. The modest progress in genetic studies in Claviceps has been attributed to the technical challenges (Tudzynski, 2006), including long generation time, complex conditions for obtaining sexual progeny, unstable asexual proliferation, and frequent degeneration of vegetative growth. However, PCR‐based assays could be optimized for testing large sample sizes (Yokoyama et al., 2004), and high‐throughput techniques in recognizing vegetative compatible groups could also help overcome some of these obstacles and improve our understanding of genetic recombination in Claviceps purpurea (Papaioannou & Typas, 2015; Salman et al., 2015). Understanding the mating systems and vegetative compatibility in C. purpuea populations would help to identify reproduction barriers and shed light on the mechanisms of population subdivision in Claviceps purpurea.
The genomes of the members in three GCs may also be evolving and adapting to other environmental pressures, resulting in subpopulations remaining separated. A recent comparative genomic analysis of the genus Claviceps found that species in the section Claviceps, such as C. purpurea, have adaptive genomes through colocalization of transposable elements around predicted effectors and a putative loss of repeat‐induced point mutation (Wyka, Mondo, Liu, Dettman, et al., 2020). This has resulted in unconstrained tandem gene duplication coinciding with increased host range potential and speciation (Wyka, Mondo, Liu, Dettman, et al., 2020). These alterations in genomic architecture and plasticity can influence and shape the evolutionary trajectory of fungal pathogens and their adaptability. Members of the genus Claviceps are renowned for their production of secondary metabolites, which may serve to improve overall fitness of the organism. A pangenome analysis of 24 genomes found that C. purpurea has a relatively large accessory genome (~38%) that is likely maintained by high recombination rates and transposon‐mediated gene duplication, but the high recombination rate is also likely influencing the overall trend of purifying selection across the genome (Wyka et al., 2020). This purifying or stabilizing selection may be purging deleterious genetic polymorphisms that arise from random mutations and transposon‐mediated gene duplication. However, Wyka, Mondo, Liu, Dettman, et al., 2020 did observed evidence of strong positive selection pressure on secondary metabolite genes and that the lpsA1 and lpsA2 (genes in the ergotamine synthesis pathway) were the results of a recombination event. It is possible that the combination of positive selection on secondary metabolite genes with purifying selection across the rest of the genome has resulted in a more specific, as yet undetected, niche adaptation followed by population stabilization that has resulted in the observed patterns in geographic and host overlap of the three GCs found in North America.
4.1. The neutrality of two house‐keeping genes (EF1‐α and RPB2)
The initial neutrality tests for each individual gene indicated only easA was not significantly deviating from neutral, while the other three genes all showed significant deviation at varied critical levels (Table 1). This is unexpected as it was generally accepted that house‐keeping genes; that is, TEF1‐α and RPB2 are neutral. Structured population could account for biased estimates of neutrality parameters; therefore, we conducted the tests for separate GCs. There was no significant deviation in TEF1‐α and easE in GC1 and GC2, but significant deviation from neutrality in GC3 for all three parameters. RPB2 was neutral in all three GCs with Tajima'D, but deviated significantly at 0.05 critical level with Fu and Li's D* and F*, which are more sensitive tests based on coalescence approach. Overall, it appears that RPB2 is under moderate selection pressure in all populations, while TEF1‐α and easE are under strong selection only in GC3, which might be associated with the divergence of GC3. Understandably, easE is experiencing positive selection (as inferred by a negative value of Tajima'D) because it is common that genes involving secondary metabolite production are under selective pressure (Wyka, Mondo, Liu, Dettman, et al., 2020). The observed high level of genetic variation (polymorphisms, nucleotide, and haplotype diversity) is consistent with the scenario of positive selection. Compared with easE, TEF1‐α and RPB2 are much more conserved. A likely explanation is that TEF1‐α and RPB2 are linked with genes or regions under positive selection and have undergone “genetic hitchhiking,” or what is referred to as “selective sweeping.” In this case, the selective pressure on the region linked with TEF1‐α is higher than on the regions linked with RPB2. Both TEF1‐α and RPB2 genes have been widely used in phylogenetics and species barcoding of various fungal groups because of many advantageous features including that they are selectively neutral (Brandon Matheny et al., 2007; Geiser et al., 2004; O'Donnell et al., 2009). Our results challenge this assumption. The situation may vary in different fungal groups and may or may not always have a significant impact on the species level studied. In Claviceps, some cryptic species noticeably separated based on RPB2 sequence data but showed very little variation in TEF1, and vice versa (Liu et al., 2020; Shoukouhi et al., 2019). A holistic approach is recommended to overcome the bias caused by either one of these genes. As these two genes are being considered as a universal secondary fungal barcoding region, perhaps both genes should be considered.
CONFLICT OF INTEREST
No conflict.
AUTHOR CONTRIBUTION
Miao Liu: Data curation (supporting); Formal analysis (lead); Funding acquisition (equal); Investigation (equal); Methodology (supporting); Project administration (lead); Resources (supporting); Supervision (lead); Validation (equal); Visualization (equal); Writing‐original draft (lead); Writing‐review & editing (equal). Parivash Shoukouhi: Data curation (lead); Investigation (equal); Methodology (lead); Resources (supporting); Supervision (supporting); Writing‐review & editing (supporting). Kassandra Bisson: Data curation (lead); Investigation (equal); Methodology (equal); Resources (supporting); Writing‐review & editing (supporting). Stephen A. Wyka: Data curation (lead); Investigation (equal); Methodology (equal); Resources (equal); Writing‐review & editing (equal). Kirk D. Broders: Data curation (supporting); Funding acquisition (equal); Project administration (equal); Supervision (equal); Validation (equal); Writing‐original draft (supporting); Writing‐review & editing (equal). Jim G. Menzies: Data curation (supporting); Funding acquisition (supporting); Investigation (equal); Methodology (equal); Project administration (supporting); Resources (lead); Supervision (equal); Writing‐review & editing (supporting).
Supporting information
Fig S1
Fig S2
Table S1
Table S2
ACKNOWLEDGMENTS
We thank the Molecular Technologies Laboratory (MTL) at the Ottawa Research & Development Centre for technical assistance, Randy Clear, Yuanhong Chen, Stephen Darbyshire, Bryan Doig, Sarah Hambleton, Henry Klein‐Gebbinck, Keith A. Seifert, and Joey Tanney for providing ergot samples, thank National Capital Commission (Quebec), and Newfoundland Labrador Provincial Parks Division for granting land access permit for collecting specimens. The study was funded by Agriculture and Agri‐Food Canada's Growing Forward 2 for a research network on Emerging Mycotoxins (EmTox, project # J‐000048), STB fungal and bacterial biosystematics J‐002272, and the American Malting Barley Association grant no. 17037621. Kirk Broders is supported by the Simon's Foundation Grant number 429440 to the Smithsonian Tropical Research Institute.
Liu M, Shoukouhi P, Bisson K, Wyka SA, Broders KD, Menzies JG. Sympatric divergence of the ergot fungus, Claviceps purpurea, populations infecting agricultural and nonagricultural grasses in North America. Ecol Evol.2021;11:273–293. 10.1002/ece3.7028
Reproduced with the permission of the Minister of Department of Agriculture and Agri‐Food Canada (AAFC).
DATA AVAILABILITY STATEMENT
All DNA sequences were submitted to GenBank (Table S1). GB accessions: TEF1‐α MT429981–MT430207, RPB2 MT429777–MT429980, easE MT430208–MT430471, easA MT430472–MT430745.
REFERENCES
- Alderman, S. C. , Halse, R. R. , & White, J. F. (2004). A reevaluation of the host range and geographical distribution of Claviceps species in the United States. Plant Disease, 88, 63–81. [DOI] [PubMed] [Google Scholar]
- Amici, A. M. , Scotti, T. , Spalla, C. , & Tognoli, L. (1967). Heterokaryosis and alkaloid production in Claviceps purpurea . Applied Microbiology, 15(3), 611–615. 10.1128/AEM.15.3.611-615.1967 [DOI] [PMC free article] [PubMed] [Google Scholar]
- Bapteste, E. , van Iersel, L. , Janke, A. , Kelchner, S. , Kelk, S. , McInerney, J. O. , Morrison, D. A. , Nakhleh, L. , Steel, M. , Stougie, L. , & Whitfield, J. (2013). Networks: Expanding evolutionary thinking. Trends in Genetics, 29(8), 439–441. 10.1016/j.tig.2013.05.007 [DOI] [PubMed] [Google Scholar]
- Bouckaert, R. R. , & Heled, J. (2014). DensiTree 2: Seeing trees through the forest. bioRxiv, 012401 10.1101/012401 [DOI] [Google Scholar]
- Bouckaert, R. , Vaughan, T. G. , Barido‐Sottani, J. , Duchêne, S. , Fourment, M. , Gavryushkina, A. , Heled, J. , Jones, G. , Kühnert, D. , De Maio, N. , Matschiner, M. , Mendes, F. K. , Müller, N. F. , Ogilvie, H. A. , du Plessis, L. , Popinga, A. , Rambaut, A. , Rasmussen, D. , Siveroni, I. , … Drummond, A. J. (2019). BEAST 2.5: An advanced software platform for Bayesian evolutionary analysis. PLOS Computational Biology, 15(4), e1006650 10.1371/journal.pcbi.1006650 [DOI] [PMC free article] [PubMed] [Google Scholar]
- Brandon Matheny, P. , Wang, Z. , Binder, M. , Curtis, J. M. , Lim, Y. W. , Henrik Nilsson, R. , Hughes, K. W. , Hofstetter, V. , Ammirati, J. F. , Schoch, C. L. , Langer, E. , Langer, G. , McLaughlin, D. J. , Wilson, A. W. , Frøslev, T. , Ge, Z.‐W. , Kerrigan, R. W. , Slot, J. C. , Yang, Z.‐L. , … Hibbett, D. S. (2007). Contributions of rpb2 and tef1 to the phylogeny of mushrooms and allies (Basidiomycota, Fungi). Molecular Phylogenetics and Evolution, 43(2), 430–451. 10.1016/j.ympev.2006.08.024 [DOI] [PubMed] [Google Scholar]
- Cagaš, B. , & Macháč, R. (2002). Different pathogenicity of ergot isolates (Claviceps purpurea [Fr.] Tul.) on Kentucky bluegrass (Poa pratensis L.). Plant Protection Science, 38, 18–22. 10.17221/4815-PPS [DOI] [Google Scholar]
- Campbell, W. P. (1957). Studies on ergot infection in gramineous hosts. Canadian Journal of Botany, 35(3), 315–320. 10.1139/b57-028 [DOI] [Google Scholar]
- Campbell, W. P. , & Freisen, H. A. (1959). The control of ergot in cereal crops. Plant Disease Reporter, 43(12), 1266–1267. [Google Scholar]
- Charlesworth, B. , & Charlesworth, D. (2017). Population genetics from 1966 to 2016. Heredity, 118(1), 2–9. 10.1038/hdy.2016.55 [DOI] [PMC free article] [PubMed] [Google Scholar]
- Chung, K.‐R. , & Schardl, C. L. (1997). Vegetative compatibility between and within Epichloë species. Mycologia, 89(4), 558–565. 10.2307/3760992 [DOI] [Google Scholar]
- Douhan, G. W. , Smith, M. E. , Huyrn, K. L. , Westbrook, A. , Beerli, P. , & Fisher, A. J. (2008). Multigene analysis suggests ecological speciation in the fungal pathogen Claviceps purpurea. Molecular Ecology, 17(9), 2276–2286. 10.1111/j.1365-294X.2008.03753.x [DOI] [PMC free article] [PubMed] [Google Scholar]
- Esser, K. , & Tudzynski, P. (1978). Genetics of the ergot fungus Claviceps purpurea: I. Proof of a monoecious life cycle and segregation patterns for mycelial morphology and alkaloid production. Theoretical and Applied Genetics, 53(4), 145–149. 10.1007/BF00273574 [DOI] [PubMed] [Google Scholar]
- Fu, Y. X. , & Li, W. H. (1993). Statistical tests of neutrality of mutations. Genetics, 133(3), 693–709. [DOI] [PMC free article] [PubMed] [Google Scholar]
- Geiser, D. M. , del Mar, J.‐G. , Kang, S. , Makalowska, I. , Veeraraghavan, N. , Ward, T. J. , Zhang, N. , Kuldau, G. A. , & O'Donnell, K. (2004). FUSARIUM‐ID v. 1.0: A DNA sequence database for identifying Fusarium . European Journal of Plant Pathology, 110(5/6), 473–479. 10.1023/B:EJPP.0000032386.75915.a0 [DOI] [Google Scholar]
- Gilmore, B. S. , Alderman, S. C. , Knaus, B. J. , Bassil, N. V. , Martin, R. C. , Dombrowski, J. E. , & Dung, J. K. S. (2016). Simple sequence repeat markers that identify Claviceps species and strains. Fungal Biology and Biotechnology, 3, 1–13. 10.1186/s40694-016-0019-5 [DOI] [PMC free article] [PubMed] [Google Scholar]
- Hill, W. G. , & Robertson, A. (1968). Linkage disequilibrium in finite populations. Theoretical and Applied Genetics, 38(6), 226–231. 10.1007/BF01245622 [DOI] [PubMed] [Google Scholar]
- Hudson, R. R. (2000). A new statistic for detecting genetic differentiation. Genetics, 155(4), 2011. [DOI] [PMC free article] [PubMed] [Google Scholar]
- Huson, D. H. , & Bryant, D. (2006). Application of phylogenetic networks in evolutionary studies. Molecular Biology and Evolution, 23(2), 254–267. 10.1093/molbev/msj030 [DOI] [PubMed] [Google Scholar]
- Katoh, K. , Rozewicki, J. , & Yamada, K. D. (2017). MAFFT online service: Multiple sequence alignment, interactive sequence choice and visualization. Briefings in Bioinformatics, 20(4), 1160–1166. 10.1093/bib/bbx108 [DOI] [PMC free article] [PubMed] [Google Scholar]
- Kelly, J. K. (1997). A test of neutrality based on interlocus associations. Genetics, 146(3), 1197–1206. [DOI] [PMC free article] [PubMed] [Google Scholar]
- Leslie, J. F. (1993). Fungal vegetative compatibility. Annual Review of Phytopathology, 31(1), 127–150. 10.1146/annurev.py.31.090193.001015 [DOI] [PubMed] [Google Scholar]
- Liu, M. , Overy, D. P. , Cayouette, J. , Shoukouhi, P. , Hicks, C. , Bisson, K. R. , Spoule, A. , Wyka, S. A. , Broders, K. D. , Popovic, Z. , & Menzies, J. G. (2020). Four phylogenetic species of ergot from Canada and their characteristics in morphology, alkaloid production and pathogenicity. Mycologia, 112(5), 974–988. 10.1080/00275514.2020.1797372 [DOI] [PubMed] [Google Scholar]
- Liu, Y. J. , Whelen, S. , & Hall, B. D. (1999). Phylogenetic relationships among ascomycetes: Evidence from an RNA polymerase II subunit. Molecular Biology and Evolution, 16(12), 1799–1808. 10.1093/oxfordjournals.molbev.a026092 [DOI] [PubMed] [Google Scholar]
- Menzies, J. G. , Klein‐Gebbinck, H. W. , Gordon, A. , & O'Sullivan, D. M. (2017). Evaluation of Claviceps purpurea isolates on wheat reveals complex virulence and host susceptibility relationships. Canadian Journal of Plant Pathology, 39(3), 307–317. 10.1080/07060661.2017.1355334 [DOI] [Google Scholar]
- Menzies, J. G. , & Turkington, T. K. (2015). An overview of the ergot (Claviceps purpurea) issue in western Canada: Challenges and solutions. Canadian Journal of Plant Pathology, 37(1), 40–51. 10.1080/07060661.2014.986527 [DOI] [Google Scholar]
- Milgroom, M. G. (2015a). Differentiation of pathogen populations on host species: Evidence of host specialization In Milgroom M. G. (Ed.), Population biology of plant pathogens: Genetics, ecology, and evolution (pp. 143–145). APS Press. [Google Scholar]
- Milgroom, M. G. (2015b). Migration and population structure In Milgroom M. G. (Ed.), Population biology of plant pathogens: Genetics, ecology, and evolution (pp. 119–146). APS Press. [Google Scholar]
- Milgroom, M. G. (2015c). Recombination and randomly mating populations In Milgroom M. G. (Ed.), Population biology of plant pathogens: Genetics, ecology, and evolution (pp. 147–184). APS Press. [Google Scholar]
- Morrison, D. A. (2005). Networks in phylogenetic analysis: New tools for population biology. International Journal for Parasitology, 35(5), 567–582. 10.1016/j.ijpara.2005.02.007 [DOI] [PubMed] [Google Scholar]
- Munkvold, G. P. (2009). Seed pathology progress in academia and industry. Annual Review of Phytopathology, 47(1), 285–311. 10.1146/annurev-phyto-080508-081916 [DOI] [PubMed] [Google Scholar]
- Nei, M. (1982). Evolution of human races at the gene level. Progress in Clinical and Biological Research, 103 Pt A, 167–181. [PubMed] [Google Scholar]
- O'Donnell, K. , Gueidan, C. , Sink, S. , Johnston, P. R. , Crous, P. W. , Glenn, A. , Riley, R. , Zitomer, N. C. , Colyer, P. , Waalwijk, C. , Tvd, L. , Moretti, A. , Kang, S. , Kim, H.‐S. , Geiser, D. M. , Juba, J. H. , Baayen, R. P. , Cromey, M. G. , Bithell, S. , … Sarver, B. A. J. (2009). A two‐locus DNA sequence database for typing plant and human pathogens within the Fusarium oxysporum species complex. Fungal Genetics and Biology, 46(12), 936–948. 10.1016/j.fgb.2009.08.006 [DOI] [PubMed] [Google Scholar]
- Papaioannou, I. A. , & Typas, M. A. (2015). High‐throughput assessment and genetic investigation of vegetative compatibility in Verticillium dahliae . Journal of Phytopathology, 163(6), 475–485. 10.1111/jph.12345 [DOI] [Google Scholar]
- Pazoutova, S. , Olsovska, J. , Linka, M. , Kolinska, R. , & Flieger, M. (2000). Chemoraces and habitat specialization of Claviceps purpurea populations. Appl Environ Microbiol, 66(12), 5419–5425. [DOI] [PMC free article] [PubMed] [Google Scholar]
- Pažoutová, S. , Pešicová, K. , Chudíčková, M. , Šrůtka, P. , & Kolařík, M. (2015). Delimitation of cryptic species inside Claviceps purpurea . Fungal Biology, 119, 7–26. 10.1016/j.funbio.2014.10.003 [DOI] [PubMed] [Google Scholar]
- Pazoutova, S. , Raybould, A. F. , Honzatko, A. , & Kolinska, R. (2002). Specialised population of Claviceps purpurea from salt marsh Spartina species. Mycological Research, 106, 210–214. [Google Scholar]
- Peakall, R. , & Smouse, P. E. (2012). GenAlEx 6.5: Genetic analysis in Excel. Population genetic software for teaching and research—An update. Bioinformatics, 28(19), 2537–2539. 10.1093/bioinformatics/bts460 [DOI] [PMC free article] [PubMed] [Google Scholar]
- Píchová, K. , Pažoutová, S. , Kostovčík, M. , Chudíčková, M. , Stodůlková, E. , Novák, P. , Flieger, M. , van der Linde, E. , & Kolařík, M. (2018). Evolutionary history of ergot with a new infrageneric classification (Hypocreales: Clavicipitaceae: Claviceps ). Molecular Phylogenetics and Evolution, 123, 73–87. [DOI] [PubMed] [Google Scholar]
- Posada, D. , & Crandall, K. A. (1998). MODELTEST: Testing the model of DNA substitution. Bioinformatics, 14(9), 817–818. 10.1093/bioinformatics/14.9.817 [DOI] [PubMed] [Google Scholar]
- Posada, D. , & Crandall, K. A. (2001). Intraspecific gene genealogies: Trees grafting into networks. Trends in Ecology & Evolution, 16(1), 37–45. 10.1016/S0169-5347(00)02026-7 [DOI] [PubMed] [Google Scholar]
- Rehner, S. A. , & Buckley, E. (2005). A Beauveria phylogeny inferred from nuclear ITS and EF1‐α sequences: Evidence for cryptic diversification and links to Cordyceps teleomorphs. Mycologia, 97(1), 84–98. 10.1080/15572536.2006.11832842 [DOI] [PubMed] [Google Scholar]
- Rozas, J. , Ferrer‐Mata, A. , Sanchez‐DelBarrio, J. C. , Guirao‐Rico, S. , Librado, P. , Ramos‐Onsins, S. E. , & Sanchez‐Gracia, A. (2017). DnaSP 6: DNA sequence polymorphism analysis of large data sets. Molecular Biology and Evolution, 34(12), 3299–3302. 10.1093/molbev/msx248 [DOI] [PubMed] [Google Scholar]
- Rozas, J. , Gullaud, M. , Blandin, G. , & Aguadé, M. (2001). DNA variation at the rp49 Gene Region of Drosophila simulans: Evolutionary inferences from an unusual haplotype structure. Genetics, 158(3), 1147. [DOI] [PMC free article] [PubMed] [Google Scholar]
- Salman, A. , Shufan, E. , Lapidot, I. , Tsror, L. , Moreh, R. , Mordechai, S. , & Huleihel, M. (2015). Assignment of Colletotrichum coccodes isolates into vegetative compatibility groups using infrared spectroscopy: A step towards practical application. Analyst, 140(9), 3098–3106. 10.1039/C5AN00213C [DOI] [PubMed] [Google Scholar]
- Shoukouhi, P. , Hicks, C. , Menzies, J. G. , Popovic, Z. , Chen, W. , Seifert, K. A. , Assabgui, R. , & Liu, M. (2019). Phylogeny of Canadian ergot fungi and a detection assay by real‐time polymerase chain reaction. Mycologia, 111(3), 493–505. 10.1080/00275514.2019.1581018 [DOI] [PubMed] [Google Scholar]
- Swofford, D. L. (2002). PAUP*. Phylogenetic analysis using parsimony (*and other methods). version 4.0 b10 (computer program). Sinauer Associates. [Google Scholar]
- Tajima, F. (1989). Statistical method for testing the neutral mutation hypothesis by DNA polymorphism. Genetics, 123(3), 585–595. [DOI] [PMC free article] [PubMed] [Google Scholar]
- Tenberge, K. B. (2006). Biology and life strategy of the ergot fungi In Kren V., & Cvak L. (Eds), Ergot: the genus Claviceps (pp. 25–56). Hardwood Academic Publishers; (republished 2006 by Taylor and Francise e‐Library). [Google Scholar]
- Tudzynski, P. (2006). Genetics of Claviceps purpurea In In Kren V., & Cvak L. (Eds), Ergot: the genus Claviceps (pp. 25–56). (pp. 25–56). Hardwood Academic Publishers; (republished 2006 by Taylor and Francise e‐Library). [Google Scholar]
- Tudzynski, P. , Esser, K. , & Gröschel, H. (1982). Genetics of the ergot fungus Claviceps purpurea. Part 2: Exchange of genetic material via meiotic recombination. Theoretical and Applied Genetics, 61(2), 97–100. 10.1007/BF00273873 [DOI] [PubMed] [Google Scholar]
- Wyka, S. A. (2020). From fields to genomes: A comprehensive understanding of the lifestyle and evolution of Claviceps purpurea the ergot fungus. PhD Dissertation, Department of Agricultural Biology, Colorado State University; Retrieved from https://mountainscholar.org/handle/10217/211800 [Google Scholar]
- Wyka, S. A. , Mondo, S. J. , Liu, M. , Dettman, J. , Nalam, V. , & Broders, K. D. (2020). Whole genome comparisons of ergot fungi reveals the divergence and evolution of species within the genus Claviceps are the result of varying mechanisms driving genome evolution and host range expansion. Genome Biology and Evolution. In review. Preprint available at BioRxiv. BioRxiv, 10.1101/2020.04.13.039230 [DOI] [PMC free article] [PubMed] [Google Scholar]
- Wyka, S. A. , Mondo, S. J. , Liu, M. , Nalam, V. , & Broders, K. D. (2020). A large accessory genome, high recombination rates, and selection of secondary metabolite genes help maintain global distribution and broad host range of the fungal plant pathogen Claviceps purpurea . BioRxiv, 10.1101/2020.05.20.106880 [DOI] [PMC free article] [PubMed] [Google Scholar]
- Xue, A. G. , Chen, Y. , & Ai‐Rewashdy, Y. (2017). Diseases of spring wheat in central and eastern Ontario in 2017. Canadian Plant Disease Survey, 98, 148–149. [Google Scholar]
- Yokoyama, E. , Yamagishi, K. , & Hara, A. (2004). Development of a PCR‐based mating‐type assay for Clavicipitaceae. FEMS Microbiology Letters, 237(2), 205–212. 10.1016/j.femsle.2004.06.033 [DOI] [PubMed] [Google Scholar]
Associated Data
This section collects any data citations, data availability statements, or supplementary materials included in this article.
Supplementary Materials
Fig S1
Fig S2
Table S1
Table S2
Data Availability Statement
All DNA sequences were submitted to GenBank (Table S1). GB accessions: TEF1‐α MT429981–MT430207, RPB2 MT429777–MT429980, easE MT430208–MT430471, easA MT430472–MT430745.