Abstract
Although there have been substantial developments in the analysis of uncertainty in economic evaluations of health care programmes, the development of methods for one-way sensitivity analysis has been notably slower. Conditional incremental net benefit was recently proposed as an approach for implementing probabilistic one-way sensitivity analysis for economic evaluations comparing two strategies. In this paper, we generalise this approach to economic evaluations that compare three or more strategies. We find that ‘conditional net benefit’ may be used to conduct probabilistic one-way sensitivity analysis for economic evaluations comparing any number of strategies. We also propose the ‘conditional net benefit frontier’, which may be used to identify the most cost-effective of any number of strategies conditional upon the specific value of a parameter of interest.
Key Points
| Probabilistic one-way sensitivity analysis for evaluations with three or more strategies should be reported using conditional net benefit. |
| The results of the probabilistic one-way sensitivity analysis for each strategy can be reported using conditional net benefit curves. |
| The implications of the probabilistic one-way sensitivity analysis for the decision can be reported using the conditional net benefit frontier. |
Introduction
The use of economic evaluation to inform decisions about which strategies should be reimbursed, and for which patient groups, is accepted as standard practice in developed health care systems [1]. Decision makers are often interested in whether changes in specific parameters in the evidence base could change the assessment of whether the strategy being considered represents good or poor value for money. McCabe et al. [2] describe how the conventional approach to addressing this question, deterministic one-way sensitivity analysis, provides decision makers with biased results and hence harms the quality of decision making. They go on to describe the ‘conditional incremental net benefit’ (cINB) approach for one-way sensitivity analysis; this approach respects non-linearities in cost-effectiveness models and correlations between model parameters in order to provide less biased results. However, this ‘incremental’ approach is limited to analyses that compare only two strategies. Reimbursement decisions often consider three or more strategies, which limits the utility of the cINB approach in practice. McCabe and colleagues indicated that the underlying concepts could be generalised to analyses with more than two strategies, in a manner analogous to Barton and colleagues’ cost-effectiveness acceptability frontier (CEAF) [3]. In this short paper, we describe the specifics of this approach—the ‘conditional net benefit frontier’ (cNBF)—and illustrate this using a previously published economic evaluation [4].
Probabilistic One-Way Sensitivity Analysis
In principle, reimbursement decisions guided by economic evaluations should be based upon the expected net benefit [E(NB)]. If the objective is to maximise population health, then the strategy with the highest E(NB) should be chosen. However, reimbursement decisions are rarely, if ever, made on the basis of E(NB) alone, and decision makers will often ask analysts to address ‘what if’ type questions with regards to important parameters in the analyses, such as effectiveness, safety, and resource utilisation. Under these circumstances, decision makers are interested in whether a parameter could take a value that would change the most cost-effective strategy. As McCabe et al. described, one of the key differences between deterministic one-way sensitivity analysis and probabilistic one-way sensitivity analysis (POSA) is that POSA tells the decision maker not only whether such a value is possible, but also the probability that such a value will be observed [2].
Constructing the Conditional Net Benefit Frontier
Generating the data required to construct the cNBF is identical to the processes described for conducting POSA and estimating cINB [2]. Having chosen a parameter for which POSA is required, a set of values is selected from the distribution for that parameter, covering the full range of possible values. For example, these may be centiles or deciles of the distribution in question, depending upon the degree of precision required. The use of centiles would mean that approximately 100 discrete values are selected for the parameter of interest, such that 1% of the total area of the probability density function (PDF) lies between each value.
Since it is not possible to cover the entire range of values for distributions that are unbounded from either above (e.g. the gamma distribution) or below (e.g. the normal distribution), operationalising the intent of complete coverage requires a judgement about how close to the upper and lower bound values the assessed range should go; the more precise the level of analysis chosen for the POSA, the closer to covering the full range of values it will get. In our analyses, we have covered the range between the 1st and 99th centiles, but we might instead have chosen to cover the range between the 1st and 9th deciles, or the 1st and 999th milles, depending upon the degree of precision required. If the gradient at the chosen anchor values indicates that a change in the indicated decision may occur should the selected parameter take a value outside the chosen range, analysts may choose to extend the POSA range as a form of threshold analysis.
Once the parameter values to be considered are selected, for each value, the analyst runs a full probabilistic analysis of the model using a Monte Carlo simulation, whilst holding the parameter of interest constant at the selected value. For each probabilistic analysis, the expected costs and outcomes for each strategy are recorded. This process is repeated for each of the selected values for the parameter of interest.
The conditional expected cost and outcome data produced in the previous step are used to calculate either the conditional expected net health benefit or the conditional expected net monetary benefit, for each strategy [5]. The conditional expected net monetary benefit is calculated using Eq. 1:
| 1 |
where NMB denotes net monetary benefit, λ denotes the value of a unit of benefit [e.g. quality-adjusted life years (QALYs)], denotes the expected health benefit (e.g. QALYs) conditional upon the value of the parameter of interest, and denotes the expected costs conditional upon the value of the parameter of interest. Note that the overline for each of and denotes that each is conditional upon the value of the parameter of interest (as opposed to the and resulting from a conventional probabilistic analysis, which are not conditional on any parameter taking a specific value).
The conditional expected net health benefit is calculated using Eq. 2:
| 2 |
where NHB denotes net health benefit.
POSA works equally well with net health benefit and net monetary benefit. For the remainder of this paper, we refer simply to conditional net benefit (cNB).
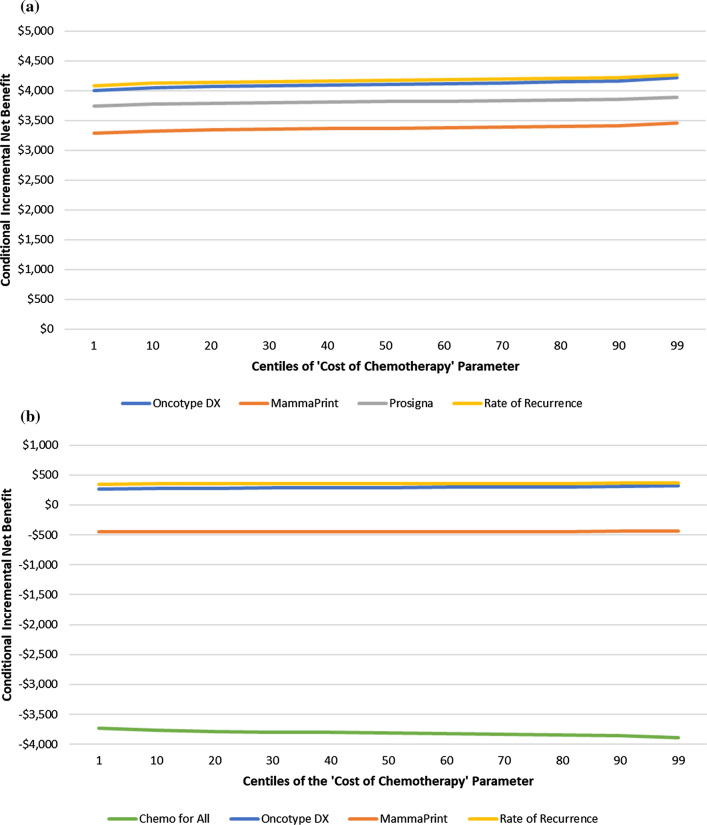
To illustrate the value to decision makers of the cNBF when there are more than two strategies, Fig. 1 plots the cINB curves for each strategy using the model from a previously published economic evaluation [4]. This evaluation compared five chemotherapy-sparing tests in breast cancer to the conventional practice of providing chemotherapy to all patients (‘chemo for all’). Figure 1a plots the cINB curves with ‘chemo for all’ as the comparator, whilst Fig. 1b plots the cINB curves with ‘Prosigna’ as the comparator. Both plots show the incremental net monetary benefit of each strategy versus the comparator strategy (vertical axis), across the range of centiles of the distribution of the ‘cost of chemotherapy’ parameter, with the most cost-effective strategy at any given centile being that with the highest cINB. In both plots, the ‘risk of recurrence’ strategy is the most cost-effective for all values of the ‘cost of chemotherapy’ parameter. However, the values of the incremental net monetary benefit (on the vertical axis) are different in the two figures due to the use of different comparator strategies. Furthermore, whilst the choice of comparator will not affect the rank ordering of the technologies, the contribution of each strategy to population health cannot be derived from either figure without knowing the absolute net benefit of the strategy. This impairs the utility of cINB curves for communicating the results of an economic evaluation to decision makers.
Fig. 1.
Conditional incremental net benefit curves: a ‘chemo for all’ as comparator; b and ‘Prosigna’ as comparator
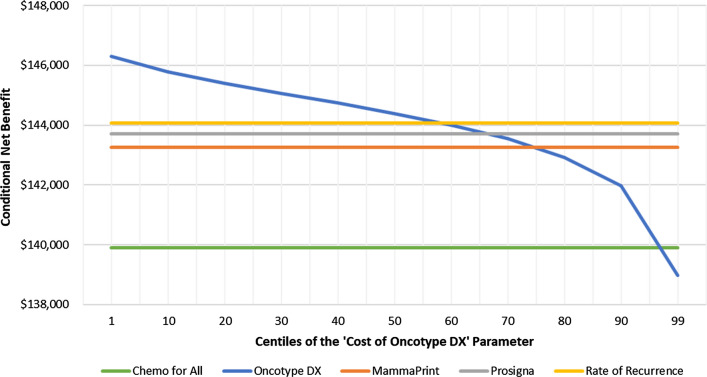
The solution to this problem is to use absolute net benefit rather than incremental net benefit. The strategy with the highest (absolute) net benefit is always the best value [6]. The same POSA described above will produce the data required to calculate the cNB estimate for each strategy for each of the selected values for the parameter of interest. If the net benefit for a strategy is not affected by changes in the parameter, then the cNB will be the same as the net benefit for that strategy. This can be seen in Fig. 2. This figure reports the results of a POSA for the parameter ‘cost of Oncotype DX’. We have chosen this parameter for illustration because there are values for this parameter that change which strategy has the highest expected cNB. The range for the parameter is $270–$7593. The corresponding range of the cNB for the ‘Oncotype DX’ strategy is $146,303–$139,891. This is plotted graphically as the conditional net benefit curve (cNBC). Each cNBC shows how sensitive the cNB is to the value of the respective parameter. The lower the gradient of the cNBC, the less sensitive the cNB is to that parameter. The distance between cNBC for each strategy allows the decision maker to read off the magnitude of the difference in cNB between strategies, at any given value for the parameter of interest. The point at which the cNBCs cross serves the same function as a threshold analysis, by identifying the value of the parameter at which rank ordering of the strategies change.
Fig. 2.
Conditional net benefit curves
In this example, only the cNBC for the ‘Oncotype DX’ strategy is affected by changes in this parameter; for all other strategies, the cNBCs are horizontal lines across the selected range of values, since the cNB for these other strategies is unaffected by the ‘cost of Oncotype DX’ parameter.
As Fig. 2 shows, the ‘Oncotype DX’ strategy is expected to have the highest cNB until the cost of the Oncotype DX test approaches the 60th centile of its distribution. Beyond this point, the ‘rate of recurrence’ strategy has the highest cNB. It is also worth noting that the historic standard of care, ‘chemo for all’, is only better value than Oncotype DX guided therapy if the cost of Oncotype DX is in excess of the 97th centile value of its distribution.
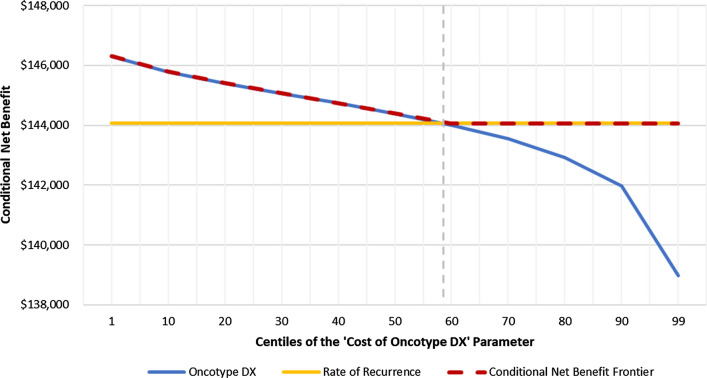
Figure 2 also shows how plotting the cNBCs allows decision makers to answer a series of ‘what if’ type questions. However, over the range of possible values for the ‘cost of Oncotype DX’ parameter, only two strategies offer the highest value, conditional upon the specific value taken: ‘Oncotype DX’ or ‘rate of recurrence’. When the decision maker is only interested in how the specific value of the parameter affects the ‘best buy’ choice—that is, determination of the single most cost-effective strategy—we can eliminate the data on the strategies that are never the best buy. Figure 3 shows the cNBCs for ‘Oncotype DX’ and ‘rate of recurrence’, plus the cNBF. The analyst can construct the cNBF from the cNBCs. The frontier (the red dashed line in Fig. 3) plots the highest cNB amongst all of the strategies for the complete range of values considered in the POSA. The greater the number of strategies that comprise the cNBF, and the greater the degree to which the cNBCs for these strategies diverge, the greater the decision uncertainty attributable to the parameter of interest.
Fig. 3.
Conditional net benefit frontier
Discussion
The practical application of one-way sensitivity analysis has remained deterministic long after probabilistic analysis of the reference case became accepted as best practice. In part, this delay may have been due to a misperception that expected value of perfect parameter information (EVPPI) provides identical information to POSA [7], as well as a concern that EVPPI is too computationally intensive to be routinely undertaken. However, as McCabe and colleagues noted, EVPPI does not address the ‘what if’ questions that one-way sensitivity analysis targets [2]. Further, advances in computational power and more efficient modelling software [8] have made more intensive simulation modelling strategies feasible with standard computing resources. The volume of simulations required for effective POSA is also a magnitude smaller than that conventionally required for EVPPI [9].
Many economic evaluations evaluate more than two strategies, and the cINB is ill suited to these cases. For deterministic one-way sensitivity analysis to be completely replaced, an extension of the principle of POSA to evaluations comparing more than two strategies is therefore required. The cNB is the natural generalisation of the cINB, since the strategy with the highest cNB is the most cost-effective at the specific value of the parameter of interest, irrespective of the number of strategies being compared [6]. The cNBF also provides a general method for identifying the most cost-effective strategy for any specific value of the parameter of interest, irrespective of the number of strategies being compared. While the cINB may still be used for comparisons of two strategies, it confers no advantages over the cNB and cNBF in such circumstances; we therefore recommend that analysts adopt the practice of considering the cNB and cNBF in all cases, including comparisons of two strategies, so as to standardise a single methodology across all evaluations.
Conclusion
The cNBF is analogous to the CEAF [3] and allows decision makers to identify the impact of the value taken by a specific parameter on which strategy will provide the best value. With POSA, cNB, and cNBF, there is no longer any need to report deterministic one-way sensitivity analysis of economic evaluations to health care decision makers.
Declarations
Funding
The research reported in this article did not receive any external funding.
Conflict of Interest
None of the authors have any conflicts of interest related to the work reported in this article.
Ethics Approval
The research reported in this article did not involve human subjects and did not require ethics approval.
Consent to Participate
Not applicable (N/A).
Consent for Publication
Not applicable.
Availability of Data and Material
Not applicable.
Code Availability
The code of the model used for this article is available from the authors on request.
Author Contributions
CM was responsible for the original idea presented in this article, drafted the first version of the manuscript, and incorporated amendments to the manuscript. AS, PH, GT, and MP worked with CM to develop the original idea and contributed substantial revisions to the manuscript. MP revised the manuscript following reviewer comments. GT and PH wrote the code and implemented the analysis to produce the results reported in the article. All authors are responsible for the content of the submitted manuscript.
References
- 1.International Society for PharmacoEconomics and Outcomes Research. ISPOR Global Health Care Systems Road Map. 2020. https://tools.ispor.org/htaroadmaps/. Accessed 20th Apr 2020.
- 2.McCabe C, Paulden M, Awotwe I, et al. One-way sensitivity analysis for probabilistic cost-effectiveness analysis: conditional expected incremental net benefit. PharmacoEconomics. 2020;38(135–141):2020. doi: 10.1007/s40273-019-00869-3. [DOI] [PMC free article] [PubMed] [Google Scholar]
- 3.Barton G, Briggs AH, Fenwick EAL. Optimal cost effectiveness decisions: the role of the cost effectiveness acceptability curve (CEAC), the cost effectiveness acceptability frontier (CEAF) and the expected value of perfect information (EVPI) Value Health. 2008;11(5):886–897. doi: 10.1111/j.1524-4733.2008.00358.x. [DOI] [PubMed] [Google Scholar]
- 4.Hall PS, McCabe C, Stein RC, Cameron D. Economic evaluation of genomic test directed chemotherapy for early-stage lymph node-positive breast cancer. J Natl Cancer Inst. 2012;104(1):56–66. doi: 10.1093/jnci/djr484. [DOI] [PubMed] [Google Scholar]
- 5.Stinnett AA, Mullahy J. Net health benefits: a new framework for the analysis of uncertainty in cost effectiveness analysis. Med Decis Making. 1998;18(2 suppl):S68–80. doi: 10.1177/0272989X98018002S09. [DOI] [PubMed] [Google Scholar]
- 6.Paulden M. Calculating and interpreting ICERs and net benefit. PharmacoEconomics. 2020;38(8):785–807. doi: 10.1007/s40273-020-00914-6. [DOI] [PubMed] [Google Scholar]
- 7.Claxton K, Sculpher M, McCabe C, Briggs A, Akehurst R, Buxton M, Brazier J, O’Hagan T. Probabilistic sensitivity analysis: not an optional extra. Health Econ. 2005;14(4):339–347. doi: 10.1002/hec.985. [DOI] [PubMed] [Google Scholar]
- 8.Holman C, Paulden M, Pechlivanoglou P, McCabe C. A comparison of four software packages for implementing decision analytic cost effectiveness models. PharmacoEconomics. 2017;35(8):817–830. doi: 10.1007/s40273-017-0510-8. [DOI] [PubMed] [Google Scholar]
- 9.Brennan A, Kharroubi S, O'Hagan A, Chilcott J. Calculating partial expected value of perfect information via Monte Carlo sampling algorithms. Med Decis Making. 2007;27(4):448–470. doi: 10.1177/0272989X07302555. [DOI] [PubMed] [Google Scholar]


