Abstract
L-selectin is a cell adhesion molecule that plays an important role in modulating immune cell trafficking. The expression of L-selectin has been found to be upregulated in several human cancers. However, the association of L-selectin expression with the immune profile and its prognostic value in breast cancer has not been explored in detail. We utilized TCGA and Oncomine datasets to compare SELL (L-selectin gene) expression between tumor and normal breast tissues. The association of SELL expression with its promoter DNA methylation and infiltrating immune cells was evaluated by using Wanderer, TIMER, and CIBERSORT tools. Single cell RNA sequencing data was utilised to determine the cell specific expression of L-selectin in breast cancer. Furthermore, the relationship between SELL expression and patient survival was evaluated using the Kaplan–Meier plotter. Gene set enrichment analysis was performed to determine functional associations of SELL expression. We found that SELL expression was significantly higher in breast tumors and regulated by DNA methylation. L-selectin exhibited a strong positive correlation with markers of the inflammatory microenvironment, including M1 macrophages. Interestingly, single cell sequencing data analysis revealed that B-cells and T-cells exhibited comparable expression levels of SELL, suggesting both B-cells and T cells contribute to SELL expression in breast cancer. Higher expression of SELL was associated with better survival outcome in basal, Her2 + and luminal B subtypes of breast cancer. GSEA revealed association of SELL expression with several immunological features in breast cancer. SELL expression increases in breast tumor tissues with reduced DNA methylation and associated inflammatory microenvironment. Also, high SELL expression is associated with favorable survival outcomes in breast cancer.
Electronic supplementary material
The online version of this article (10.1007/s13205-020-02549-y) contains supplementary material, which is available to authorized users.
Keywords: Selectin, Immunotherapy, Tumor microenvironment, Immune infiltration, Breast cancer, Epigenetics
Introduction
Breast cancer is the most common cancer among females and a major health burden globally (Bray et al. 2018). On the basis of gene expression signatures, breast cancers are commonly classified into four distinct subtypes, luminal A, luminal B, HER2 + enriched (non-luminal) and basal or triple-negative (Eliyatkın et al. 2015). Immunotherapeutic approaches have emerged as promising therapeutic strategy in several cancer types including breast cancer. Breast cancer microenvironment is infiltrated by leukocytes of both lymphoid and myeloid lineages. Recent advances in breast cancer immunotherapy have established that leukocyte composition, including number of specific leukocytes as well as their functional states differ widely in different molecular subtypes and may predict clinical outcome (Denkert et al. 2018). Therefore, mechanisms underlying host immune response in breast cancer require further exploration. Trafficking of immune cells from the peripheral blood to the tumor microenvironment (TME) is pivotal for utility of immunotherapeutic approaches (Ley et al. 2007). These events of immune cell trafficking to getting to the site of cancer and establishment of immune response happen in a series of distinct processes involving attachment/adhesion, rolling/tethering, chemotaxis and extravasation. All these processes are regulated by the specialised cell adhesion molecules on T lymphocytes and endothelial cells, called selectins.
L-selectin also known as CD62L, is the smallest of the vascular selectins, constitutively expressed on multiple tumor-infiltrating immune cells (TIICs), with higher levels on neutrophils and monocytes. Interestingly, L-selectin expression has also been observed to be elevated in tumor cells in urothelial cancers (Choudhary et al. 2015). Recent evidence suggests that selectins might serve as important targets for cancer immunotherapy. It has recently been shown that in a mouse model of adoptive T cell cancer immunotherapy, L-selectin overexpression in T cells was associated with enhanced infiltration and proliferation of T cells within the tumor, thereby improved control of tumor growth (Watson et al. 2019). A concern of the current immunotherapies includes regaining the control of selectins to modulate tumor-immune infiltration. The role of L-selectin in immune cell trafficking/infiltration and association with breast cancer is incompletely understood. To address this question, we evaluated the expression of L-selectin in breast cancer and determined its association with overall immune cell composition of tumor tissues. We also analyzed the relationship between L-selectin expression and patient prognosis. This knowledge may help in future to design better T-cell therapies to overcome the present barriers and major challenges for broadening immunotherapy.
Materials and methods
Data collection and processing
We extracted mRNA expression of SELL from RNA seq data of TCGA cancer dataset for breast cancer (TCGA-BRCA, sourced from NCI Genomic Data Commons (GDC, https://gdc.cancer.gov), consisting of data of 1084 patients using online tool cBioPortal (https://www.cbioportal.org) (Cerami et al. 2012; Gao et al. 2013). Gene expression value for SELL in breast tumor was downloaded as normalized z-scores (batch normalized from Illumina HiSeq_RNASeqV2). Further, the expression of SELL in paired normal and breast tumor tissues from 77 patients of the TCGA-BRCA dataset was extracted using the online tool TCGA-Wanderer (http://maplab.imppc.org/wanderer/) (Díez-Villanueva et al. 2015) (Fig. 1).
Fig. 1.
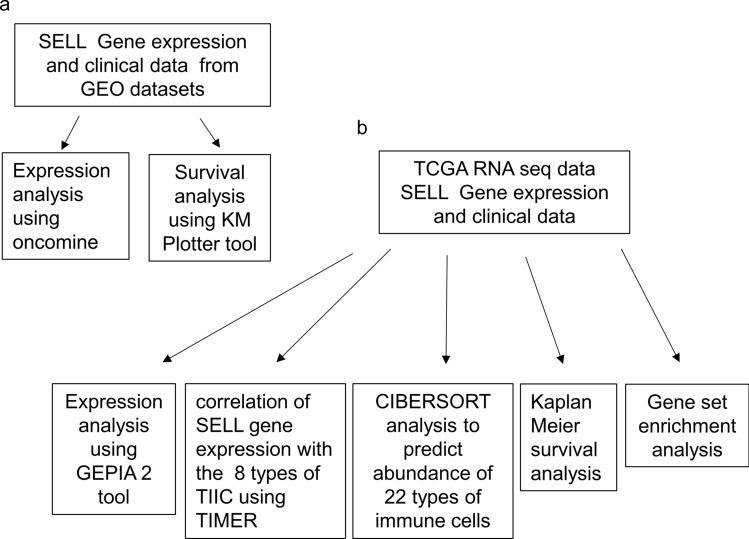
Schematic representation of the data type and the methodology used in the study; a microarray datasets, b RNA sequencing data analysis. GEO, Gene Expression Omnibus; TIIC, tumor infiltrating immune cells
Oncomine analysis
Oncomine is a web server of gene expression data from multiple cancer datasets with standardized options for data analysis (www.oncomine.org). SELL expression was analyzed using default parameters and instructions given on the website. To compare the SELL mRNA expression in normal and tumor tissues, a criterion of p-value < 0.01 was considered significant. Summarized results were extracted using the gene summary view option and individual plots for breast cancer were extracted from the dataset view option. Plots were labeled separately with statistical results provided by the webserver.
Gene expression profiling interactive analysis (GEPIA2)
SELL mRNA expression in breast cancer and normal tissues in TCGA-BRCA dataset was compared using the online database Gene Expression Profiling Interactive Analysis (GEPIA) (http://gepia.cancer-pku.cn/index.html) (Tang et al. 2019, p. 2). For normal tissues, combined respective tissues of the normal breast from TCGA and GTEx study were used. Subtype-based expression differences of breast were also inferred. Fold change difference in the expression was calculated after quantile normalization, based on the median value of cancer types chosen depicted in log2 (TPM + 1). Box plots were utilized to plot the expression difference of the discrete variables with p-value < 0.01 considered as statistically significant.
Wanderer
TCGA-Wanderer is a web server that hosts the DNA methylation data of TCGA studies (http://maplab.imppc.org/wanderer/). SELL methylation data and corresponding correlations to gene expression were extracted as described by the webserver (Díez-Villanueva et al. 2015). These data were generated on “Infinium Human Methylation 450 BeadChip”. Multiple CpG probes, designated to SELL genomic locus were analyzed.
TIMER analysis
Online tool TIMER (Tumor IMmune Estimation Resource; https://cistrome.shinyapps.io/timer) was used to correlate mRNA expression of SELL gene in TCGA-BRCA dataset with tumor purity and infiltration levels of 6 immune cell types (B cells, CD4 + T cells, CD8 + T cells, neutrophils, macrophages, and dendritic cells) (Li et al. 2017). This tool computes immune infiltration based on a predefined signature gene matrix of the immune subsets. The gene module was used taking SELL genes as input, and TCGA breast cancer subtypes were selected as datasets.
CIBERSORT analysis
A recently established computational tool CIBERSORT (Cell-type Identification by Estimating Relative Subsets of RNA Transcripts) was applied to bulk tumor gene expression profile of breast cancers for estimation of relative fractions of 22 immune cells types (Chen et al. 2018). CIBERSORT is based on a predetermined gene expression signature matrix consisting of a reference profile of a set of 22 immune cells that applied to deconvolute mRNA profile of mixed samples, including tumor tissues to determine the relative proportions of immune cells. Previously published CIBERSORT data profile for TCGA-BRCA was extracted from the GDC data portal (https://gdc.cancer.gov) and used to correlate with the SELL mRNA expression of RNA-seq data of breast cancer extracted from cBioPortal for the same patients (Thorsson et al. 2018).
Survival analysis
The mRNA expression of SELL was correlated with the survival in breast cancer patients for assessing the overall survival (OS), relapse-free survival (RFS), and distant metastasis-free survival (DMFS) using Kaplan–Meier Plotter (http://kmplot.com), an online database of gene expression and clinical data from multiple microarray gene expression datasets from NCBI-GEO (https://www.ncbi.nlm.nih.gov/geo) (Györffy et al. 2010). For the current study, we utilized microarray gene expression profiles of probe id 204563_at for survival analysis. For the SELL gene expression, the breast carcinoma cases were dichotomized at the median expression value of the SELL gene as low gene expression if they had expression values within the lower 50% and as high gene expression if they had gene expression values within the upper 50%. The hazard ratio (HR) with 95% confidence intervals and log-rank p-value were also computed GEPIA tool was also utilized for survival analysis in TCGA-BRCA patients using the same parameters.
Gene set enrichment analysis (GSEA)
GSEA was performed using the GSEA tool (https://www.gsea-msigdb.org/gsea/index.jsp) to identify SELL-associated molecular pathways. KEGG pathway database was analyzed (https://www.genome.jp/kegg/pathway.html) and extracted enriched pathways were selected based on normalized enrichment score (NES), p < 0.05, and false discovery rate (FDR) q < 0.05.
Statistical analysis
Student t-test and non-parametric t-test were used for expression analysis. A p-value < 0.01 was considered statistically significant for microarray gene expression analysis. For correlations of SELL with immune infiltration levels, Spearman’s correlation analysis was used. Kaplan–Meier analysis was used for survival analysis. A p-value of < 0.05 was considered as statistically significant for survival analysis.
Results
The expression of L-selectin mRNA is upregulated in breast cancer
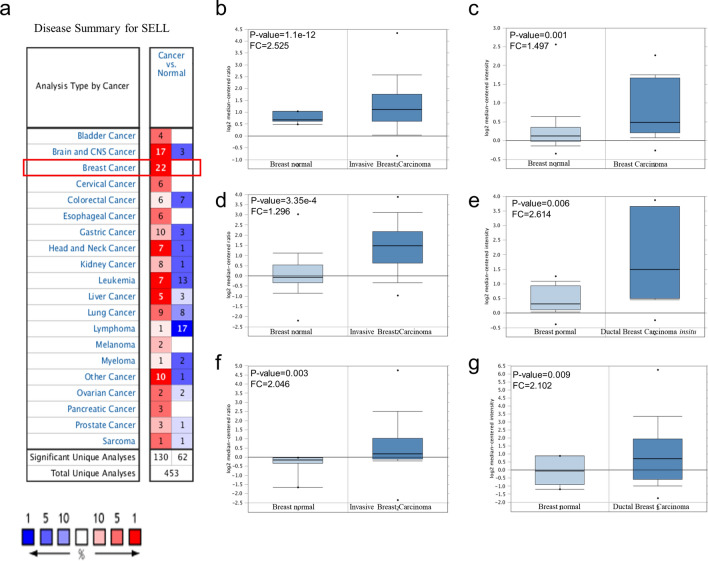
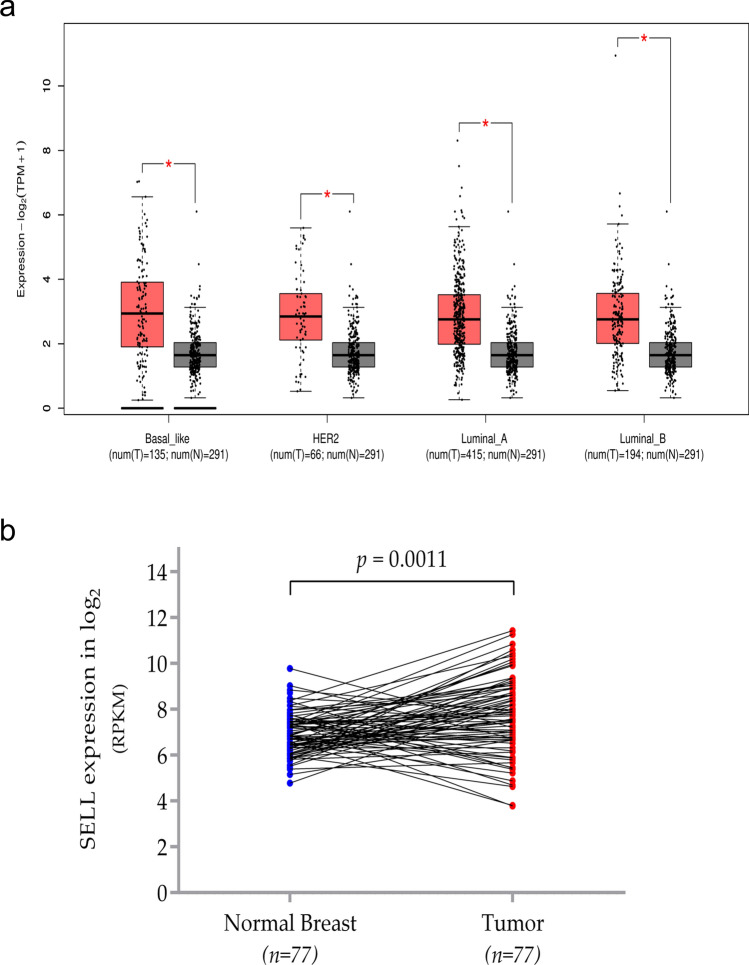
A pan-cancer analysis using the Oncomine tool suggested that in multiple cancers, mRNA expression of SELL was higher in tumor tissues as compared to controls (Fig. 2a). In breast cancer, Oncomine analysis suggests that SELL expression is significantly higher in tumor tissues compared to normal breast tissues from multiple datasets (Fig. 2a). Representative datasets have been given in Fig. 2b–g and detailed information of the number of patients included in each analysis, fold change and p-value are summarized in Table 1. Further, we assessed SELL mRNA expression in breast cancer tissues and a combined group of normal tissues from the TCGA breast cancer dataset (TCGA-BRCA) and GTEX project using Gene expression profiling interactive analysis (GEPIA2) tool. The analysis included luminal A-like (n = 415), luminal B like (n = 192), HER2 + non-luminal (n = 66) and basal-like/triple-negative (n = 135), and 219 normal breast tissue. We found SELL to be upregulated in all four subtypes of breast tumor sample compared to the normal breast tissue (p < 0.01, Fig. 3a). Further, analysis using 77 paired tumors and normal tissue from TCGA dataset also confirmed significantly higher expression of SELL in breast tumors (p = 0.0011, Fig. 3b).
Fig. 2.
Expression analysis of SELL in breast cancer datasets. a Expression of SELL in breast tumor and normal breast tissues assessed using ONCOMINE tool. b Expression of SELL in invasive breast carcinoma (n = 76) and normal breast (n = 61) from TCGA, c breast carcinoma (n = 14) and normal breast (n = 144) from Curtis dataset, d breast carcinoma (n = 154) and normal breast (n = 4) from Gluck dataset, e ductal breast carcinoma (n = 14) and normal breast (n = 11) from Ma breast 4 dataset, f invasive breast carcinoma (n = 53) and normal breast (n = 6) from Finak dataset, g breast carcinoma (n = 40) and normal breast (n = 7) (Richard dataset). p value was set up at 0.01 for expression analysis
Table 1.
The transcription levels of SELL in between different types of breast cancer and normal breast tissues (ONCOMINE)
| S. no. | Datasets used (Ref) | Types of breast cancer vs normal | Fold change | t test | p value | Reporter |
|---|---|---|---|---|---|---|
| 1 | TCGA breast | Invasive breast carcinoma (n = 76) vs normal (n = 61) | 2.525 | 7.733 | 1.1E−12 | A_23_P103523 |
| 2 | Curtis breast | Invasive Breast Carcinoma (n = 21) vs normal (n = 144) | 1.497 | 3.507 | 0.001 | ILMN_1724422 |
| 3 | Gluck breast | Invasive breast carcinoma (n = 154) vs normal (n = 4) | 1.296 | 5.101 | 3.35E−4 | 31,849 |
| 4 | Ma breast 4 | Ductal breast carcinoma insitu stroma (n = 11) vs normal (n = 14) | 2.614 | 2.996 | 0.006 | G5713320_3p_at |
| 5 | Finak breast | Invasive breast carcinoma stroma (n = 53) vs normal (n = 6) | 2.046 | 3.369 | 0.003 | A_23_P103522 |
| 6 | Richardson Breast 2 | Ductal breast carcinoma (n = 40) vs normal (n = 7) | 2.102 | 2.598 | 0.009 | 204563_at |
Fig. 3.
Expression analysis of SELL in TCGA breast cancer dataset. a Expression of SELL analyzed by GEPIA2 in all four subtype of breast cancer subtypes compared to normal breast tissues. p value 0.01 were considered as statistically significant. The box plot was used as representation of gene expression profile as log scale log2 (TPM + 1) and |Log2 FC| Cutoff = 1. b Paired analysis of matched (n = 77) breast tumor-normal tissues (p = 0.0011). TPM, transcript per million; RPKM, reads per kilobase million; *p < 0.01
DNA methylation modulate the expression of SELL in breast cancer
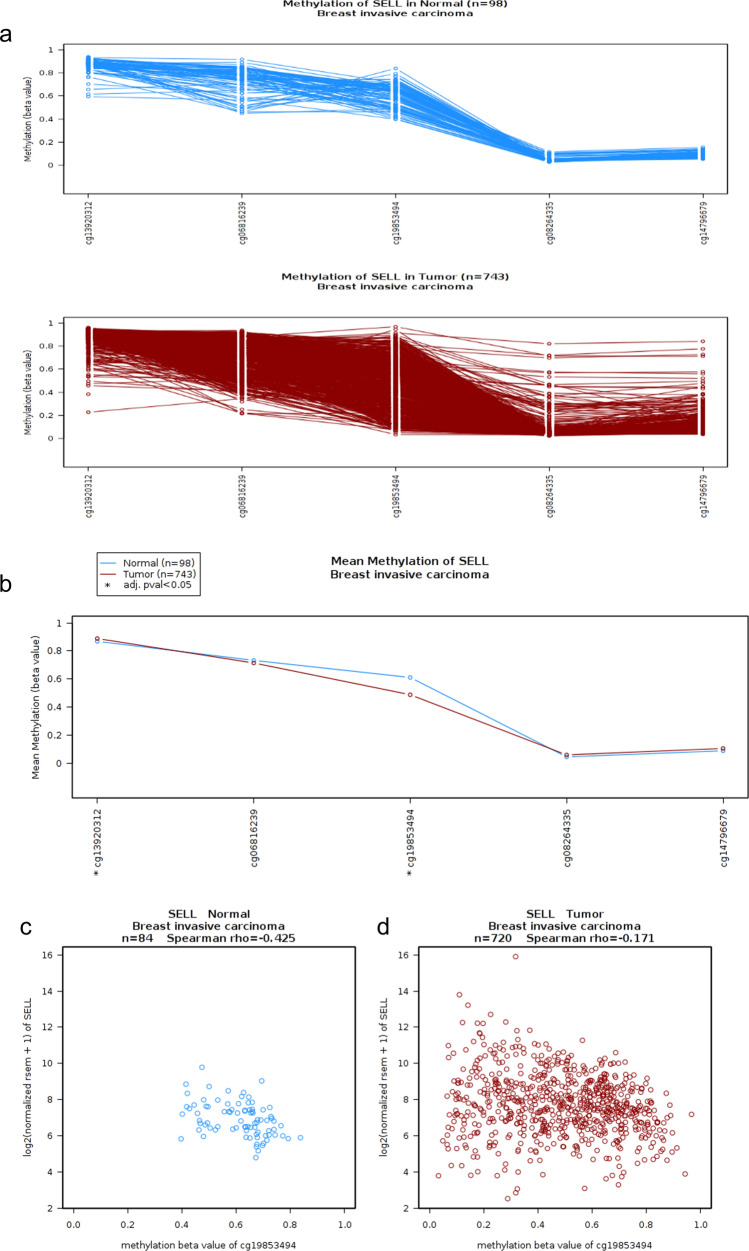
To investigate the role of epigenetic modifications in the upregulation of SELL mRNA expression in breast cancer, we assessed DNA methylation and RNA expression data from TCGA-BRCA dataset by utilizing the TCGA-Wanderer tool. Spearman correlation analysis between methylation levels and transcription of its gene expression were assessed which revealed that DNA methylation at site cg19853494 exhibited significant negative correlation with SELL expression. These results suggested the involvement of DNA methylation in transcriptional regulation that of SELL gene expression in breast cancer (Fig. 4a–d).
Fig. 4.
DNA methylation of SELL gene in TCGA breast cancer dataset. a Gene track showing methylation levels in five probes of SELL in normal breast and breast tumor tissues. b Comparison of mean methylation levels of SELL in normal breast and breast tumor tissues. c Spearman’s correlation analysis between SELL expression and its methylation at probe cg19853494 in normal breast. d Spearman’s correlation analysis between SELL expression and its methylation at probe cg19853494 in breast tumor tissues
Cellular origin of L-selectin in breast cancer
To determine the cell-specific expression of L-selectin in breast cancer, we utilized single-cell RNA sequencing for individual cellular constituents of breast cancer from dataset GSE75688. Interestingly, the percentage of measurable SELL expressing cells among the total number of a specific cell type was highest for T cells (64.81%), followed by myeloid cells (56.41%), B cells (44.58%), stromal cells (17.39% and tumor cells (15.03%). Interestingly, B cells and T cells exhibited comparable expression levels of SELL, suggesting both B cells and T cells contribute to SELL expression in breast cancer (Supplementary Fig. 1).
Association of SELL expression with overall tumor microenvironment
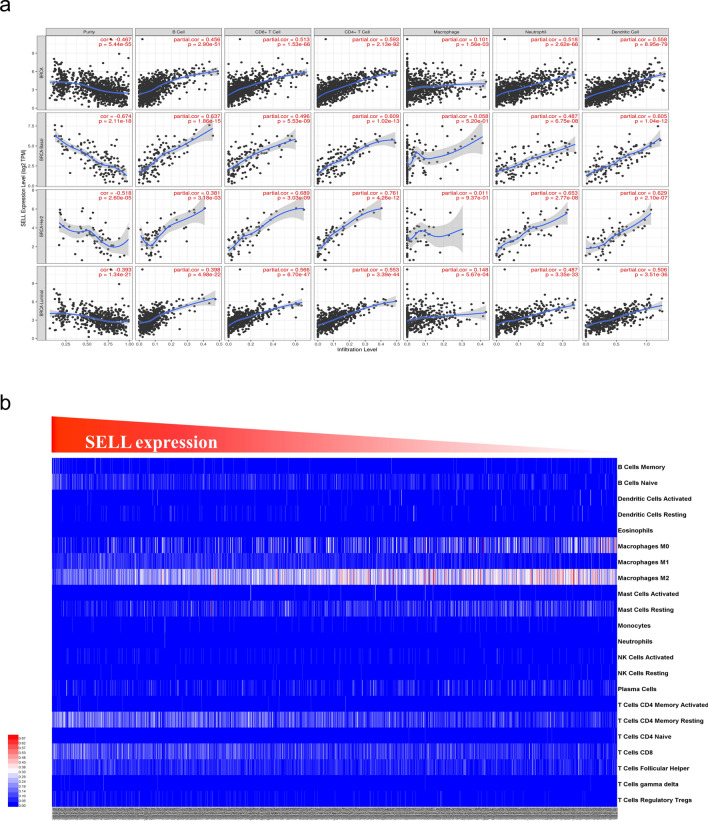
As per the literature, L-Selectin is expressed on several epithelial cells and infiltrating immune cells (Choudhary et al. 2015; Borsig 2018). To assess the association of increased L-Selectin mRNA with level of tumor purity and immune infiltration, we utilized TIMER tool. This analysis revealed a clear negative correlation of SELL expression with tumor purity and a positive correlation with the abundance of tumor-infiltrating immune cells—B cells, CD8 + T cells, CD4 + T cells, macrophages, neutrophils and dendritic cells in all three breast cancer groups analyzed (Fig. 5a). Furthermore, to strengthen this observation of the positive association between SELL expression and overall immune composition, we assessed the relative fractions of 22 different types of immune cells in TCGA breast cancer datasets using more robust CIBERSORT analysis and performed a correlation analysis with SELL expression (Fig. 5b). Detailed correlation results have been given in Table 2. We found a strong positive correlation with the inflammatory macrophages M1 (r = 0.4798626, p < 0.0001) and T Cells CD4 memory resting (r = 0.4541212, p < 0.0001), and a strong negative correlation with the anti-inflammatory M2 macrophages (r = − 0.4754232, p < 0.0001). We oberved a weak positive correlation of SELL expression with B cells naïve, T cells CD8 + , T Cells regulatory Tregs, T cells gamma delta, T cells CD4 memory activated, resting dendritic cells, and follicular helper T cells. We also observed a weak negative correlation between SELL expression and neutrophils, NK cells resting, mast cells resting, and macrophages M0 (Table 2). No correlation was observed with NK cells activated, monocytes, B cells memory, eosinophils, mast cells activated, plasma cells, T cells CD4 naïve, and dendritic cells activated.
Fig. 5.
Association of SELL expression with tumor immunity. a Scatter plot represents the association of SELL expression with the tumor-infiltrating immune cells generated using TIMER web server. Analysis was done on total sample (first panel), basal, Her2 + and luminal subtypes of breast cancer. Each dot represents a single breast tumor samples. b CIBERSORT analysis for association of SELL expression and abundance of 22 types of immune cells in TCGA-BRCA dataset. Samples were arranged in order of SELL expression from highest (left) to lowest (right)
Table 2.
Correlation of SELL expression with 22 types of immune cells in TCGA-BRCA dataset estimated by CIBERSORT
| Types of immune cells | Spearman r | 95% confidence interval | p (two tailed) | p value summary |
|---|---|---|---|---|
| SELL vs macrophages M1 | 0.4798626 | 0.4311341 to 0.5258002 | < 0.0001 | **** |
| SELL vs T Cells CD4 memory resting | 0.4541212 | 0.4039523 to 0.5015665 | < 0.0001 | **** |
| SELL vs B cells naive | 0.3839538 | 0.3303062 to 0.4351287 | < 0.0001 | **** |
| SELL vs T cells CD8 | 0.3710398 | 0.3168227 to 0.4228400 | < 0.0001 | **** |
| SELL vs T cells regulatory tregs | 0.3360892 | 0.2804406 to 0.3894862 | < 0.0001 | **** |
| SELL vs T cells gamma delta | 0.2583429 | 0.2000792 to 0.3147860 | < 0.0001 | **** |
| SELL vs T cells CD4 memory activated | 0.2581346 | 0.1998649 to 0.3145849 | < 0.0001 | **** |
| SELL vs Dendritic cells resting | 0.2389378 | 0.1801428 to 0.2960315 | < 0.0001 | **** |
| SELL vs T cells follicular helper | 0.1931263 | 0.1332681 to 0.2515807 | < 0.0001 | **** |
| SELL vs NK cells activated | 0.08429355 | 0.02297303 to 0.1449822 | 0.0056 | ** |
| SELL vs monocytes | 0.0832981 | 0.02197105 to 0.1440007 | 0.0062 | ** |
| SELL vs B cells memory | 0.05181987 | − 0.009650365 to 0.112899 | 0.0889 | ns |
| SELL vs eosinophils | − 0.03559484 | − 0.0968226 to 0.02590131 | 0.2427 | ns |
| SELL vs mast cells activated | − 0.06393665 | − 0.1248856 to − 0.0025069 | 0.0357 | * |
| SELL vs plasma cells | − 0.06455667 | − 0.1254984 to 0.00312957 | 0.034 | * |
| SELL vs T cells CD4 naive | − 0.08650665 | − 0.1471640 to − 0.0252010 | 0.0045 | ** |
| SELL vs dendritic cells activated | − 0.08991022 | − 0.1505183 to − 0.0286288 | 0.0031 | ** |
| SELL vs neutrophils | − 0.1088761 | − 0.1691839 to − 0.0477560 | 0.0003 | *** |
| SELL vs NK cells resting | − 0.1462736 | − 0.2058630 to − 0.0856034 | < 0.0001 | **** |
| SELL vs mast cells resting | − 0.1719529 | − 0.2309524 to − 0.1116934 | < 0.0001 | **** |
| SELL vs macrophages M0 | − 0.2157571 | − 0.2735702 to − 0.1563907 | < 0.0001 | **** |
| SELL vs macrophages M2 | − 0.4754232 | − 0.5216261 to − 0.4264399 | < 0.0001 | **** |
ns, not significant; *p < 0.05; **p < 0.01; ***p < 0.001; ***p < 0.0001
Prognostic significance of L-selectin in breast cancer
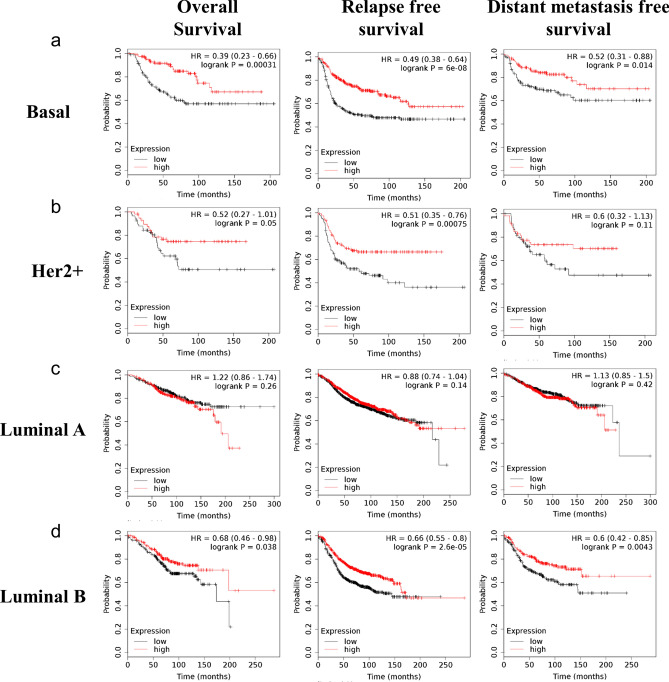
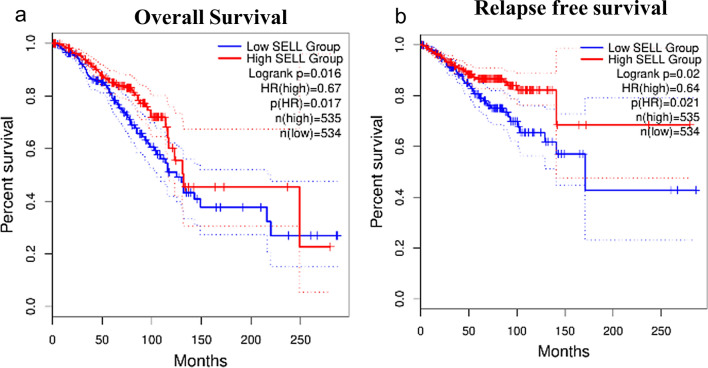
To determine the relationship between SELL expression and prognosis of breast cancer patients, we utilized microarray gene expression datasets from NCBI-GEO using Kaplan–Meier plotter tool. The prognostic value of SELL expression within different subtypes of breast cancer was determined (Supplementary Table S1). In all subtypes of breast cancer, the expression of SELL was significantly associated with RFS (HR = 0.75, p = 2.5e−07) and DMFS (HR = 0.77, p = 0.0088), but not with OS (HR = 0.82, p = 0.062). In basal/triple-negative subtype, SELL expression was significantly associated with OS (HR = 0.39, p = 0.00031), RFS (HR = 0.49, p = 6e-08) and DMFS (HR = 0.52, p = 0.014, Supplementary Table S1, Fig. 6a). In HER2 + subtype, SELL expression was significantly associated with OS (HR = 0.52, p = 0.05) and RFS (HR = 0.51, p = 0.00075, Supplementary Table S1, Fig. 6b). In luminal A subtype, we could not find any correlation between SELL expression and survival outcome (Supplementary Table S1, Fig. 6c), while in luminal B subtype, SELL expression was significantly associated with OS (HR = 0.68, p = 0.038), RFS (HR = 0.66, p = 2.6e-05) and DMFS (HR = 0.6, p = 0.0043, Supplementary Table S1, Fig. 6d). Further, high SELL expression was associated with better OS (HR = 0.67, p = 0.016, Supplementary Table S2, Fig. 7a) and RFS (HR = 0.64, p = 0.02, Supplementary Table S2, Fig. 7b) in TCGA-BRCA dataset.
Fig. 6.
Survival analysis of SELL mRNA levels in different subtypes of breast cancer in GEO datasets assessed by KM-Plotter. Association of SELL expression with the OS, RFS and DMFS in breast cancer subtype for (a) basal subtype, (b) Her2 + subtype, (c) Luminal A subtype, and (d) Luminal B subtype. Median value of mRNA expression was used as group cut-off for SELL high and SELL low groups
Fig. 7.
Survival analysis of SELL mRNA levels in different subtypes of breast cancer in TCGA dataset assessed by GEPIA2 tool. a Overall survival. b Relapse-free survival
Gene set enrichment analysis (GSEA)
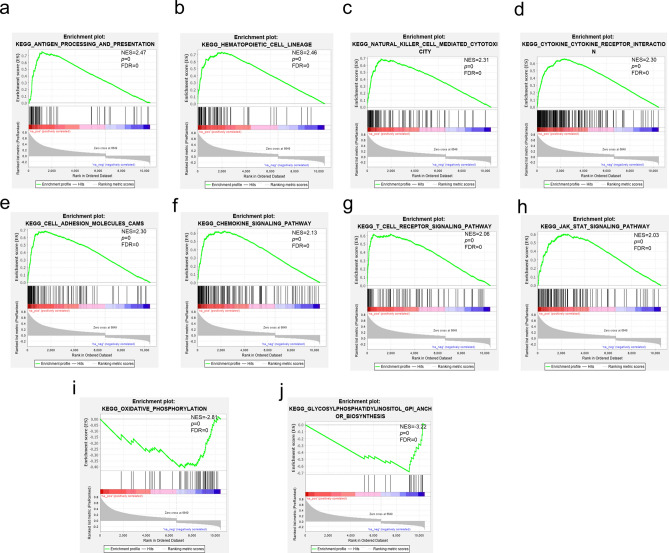
SELL mRNA expression data were used for whole transcriptome correlation analysis using TCGA breast cancer gene expression data in cBioportal web server. GSEA was applied to analyze the biological pathways in which the SELL-associated genes were enriched using GSEA software. GSEA analysis suggested that genes positively correlated with SELL expression are involved in the immune-related pathways including antigen processing and presentation, NK cell-mediated cytotoxic immunity, cytokine–cytokine receptor interaction, T-cell receptor signaling, chemokine signaling, as well as in the regulation of several molecular pathways, such as hematopoietic cell lineage, cell–cell adhesion, JAK-STAT signaling (Fig. 8a–h). Highest enrichment of negatively associated genes was observed in the biological processes including oxidative phosphorylation and glycosylphosphatidyl biosynthesis (Fig. 8i, j).
Fig. 8.
Gene set enrichment analysis in SELL coexpression gene profile (a–j). NES normalized enrichment score, FDR false discovery rate
Discussion
L-Selectin, encoded by the SELL gene is a cell adhesion molecule characteristically found on the immune cells and pre-implantation embryo (Genbacev et al. 2003; Ivetic et al. 2019). It is involved in the binding and subsequent rolling of leukocyte on endothelial cells, facilitating the trafficking of immune cells into secondary lymphoid organs and inflammation sites (Ivetic et al. 2019). It has previously been shown to play a crucial role in the development of metastasis in various cancers and hematological malignancies (Chen et al. 2009; Burgess et al. 2013; Kobawala et al. 2016; Sopper et al. 2016). It acts as a mediator of lung metastasis and the absence of L-selectin leads to attenuation of lung metastasis (Läubli and Borsig 2010). In breast cancer, L-selectin has also been shown to be involved in the lung-derived factor-mediated tumor cell migration, and immunodepletion of the L-selectin leads to reduced migration capability of the breast cancer cells (Chu et al. 2014). While this study provides strong clues regarding the significance of L-selectin in breast cancer, no systematic study has been done to analyze expression levels and immunological associations of L-selectin expression in this malignancy. Therefore, the current study was focused to determine expression levels and prognostic significance of L-Selectin in breast cancer. We observed an elevated level of SELL mRNA expression in different subgroups of breast cancers. Further, the expression levels among different subtypes of breast cancer were comparable. While this can be attributed to high immune infiltration, we confirmed that in breast tumor tissues, expression of SELL is positively correlated to the number of immune cells. In contrast to immune cell-specific SELL expression, Chaudhary et al. have demonstrated high tumor-specific SELL expression in urothelial cancer (Choudhary et al. 2015).
Previously it has been shown that during the reprogramming of CD8 T cells during chronic infection, the SELL promoter undergoes DNA methylation changes that regulates its expression (Youngblood et al. 2013). In the current study, we observed that SELL expression is highly associated with DNA methylation of its genomic region, in both tumor and normal breast tissues. Furthermore, methylation of SELL was found to be reduced in tumors compared to normal breast tissues, in agreement to its higher expression in the paired tissues. These results suggest that in breast cancer, epigenetic reprogramming is involved in the regulation of SELL expression.
L-selectin is also shed during the cytotoxic activity of the tumor-infiltrating lymphocyte in melanoma (Yang et al. 2011). A significantly higher expression of L-selectin in the serum of ovarian cancer patients was found compared to the control groups (Majchrzak-Baczmańska et al. 2018). The serum level of bladder cancer patients showed an increased level of CD62L in metastatic compared to non-metastatic tumor sample (Choudhary et al. 2015). Therefore, soluble L-selectin may potentially reflect the status of mRNA in tumor tissues.
Also, abolishment of the L-selectin in tumor-infiltrating immune cells led to acceleration of the subcutaneous B16F10 melanoma tumor growth, therefore suggesting its important functions in anti-tumor immunity (Yamada et al. 2006). Using mRNA deconvolution approach CIBERSORT, we observed a clear association of higher SELL expression and inflammatory tumor microenvironment enriched in M1 type inflammatory macrophages, while a negative correlation was found with M2-type anti-inflammatory macrophages.
Further, using multiple datasets, we investigated the prognostic significance of SELL expression in breast cancer. Our survival analyses suggest that patients with high SELL expression in breast tumor exhibited better overall survival, relapse-free survival and distant metastasis-free survival in basal, luminal B, and HER2 + subtypes, while SELL was not associated with patient survival in luminal A subtype. Interestingly, recent studies suggest that luminal A breast cancers have highly heterogeneous immune cell compositions compared to other subtypes (Zhu et al. 2019). Also, prognostic significance of tumor-infiltrating lymphocytes in luminal breast cancer is highly distinct compared to other subtypes (Denkert et al. 2018). A recent study partitioned luminal A breast tumors from The Cancer Genome Atlas (TCGA) into two distinct prognostic subgroups that exhibited differential expression of immune-related genes (Netanely et al. 2016). This partition exhibited better discriminative prognostic value than the luminal A/B classification, suggesting that the immunogenicity of luminal tumors is heterogeneous, which might be the reason behind the weak correlations of SELL with survival outcome in luminal A subtype observed in our study.
Since we also observed a positive correlation between SELL and inflammatory macrophages, our results are in agreement with Jeong et al., who reported a strong association of M1 macrophages with a favorable outcome while M2 macrophages with poor survival in breast cancer (Jeong et al. 2019). Our findings collectively elaborated and described that the SELL expression might be a predictive biomarker for breast cancer and will be a potential target with additional clinical benefit for future cancer therapeutics.
Electronic supplementary material
Below is the link to the electronic supplementary material.
Acknowledgements
Anita Chopra acknowledges support from the Wellcome Trust/DBT India Alliance Fellowship (grant number: IA/CPHI/17/1/503333). Sarita Kumari acknowledges financial support as fellowship from Department of Health Research, Government of India. Jay Singh acknowledges financial support as fellowship from Department of Biotechnology, Government of India. Mohit Arora acknowledges financial support as fellowship from Council of Scientific and Industrial Research, Government of India.
Author contributions
SK conceptualized the study and wrote the original manuscript. MA, SK, JS, and AC performed data analysis and interpretation. SSC, AC, and SK supervised the study and edited the manuscript.
Funding
This work did not receive any external funding.
Code availability
Not applicable.
Complaince with ethical standards
Conflict of interest
All authors declare no conflict of interest.
Ethical approval
Ethical review and approval was not required for the study on human participants in accordance with the local legislation and institutional requirements.
Availability of data and material
The current study was performed using publicly available datasets, which have been cited in the manuscript. The results shown here are in part based upon data generated by the TCGA Research Network: https://www.cancer.gov/tcga.
Consent to participate
Not applicable.
Consent for publication
Not applicable.
References
- Borsig L. Selectins in cancer immunity. Glycobiology. 2018;28:648–655. doi: 10.1093/glycob/cwx105. [DOI] [PMC free article] [PubMed] [Google Scholar]
- Bray F, Ferlay J, Soerjomataram I, et al. Global cancer statistics 2018: GLOBOCAN estimates of incidence and mortality worldwide for 36 cancers in 185 countries. CA Cancer J Clin. 2018;68:394–424. doi: 10.3322/caac.21492. [DOI] [PubMed] [Google Scholar]
- Burgess M, Gill D, Singhania R, et al. CD62L as a therapeutic target in chronic lymphocytic leukemia. Clin Cancer Res. 2013;19:5675–5685. doi: 10.1158/1078-0432.CCR-13-1037. [DOI] [PubMed] [Google Scholar]
- Cerami E, Gao J, Dogrusoz U, et al. The cBio cancer genomics portal: an open platform for exploring multidimensional cancer genomics data. Cancer Discov. 2012;2:401. doi: 10.1158/2159-8290.CD-12-0095. [DOI] [PMC free article] [PubMed] [Google Scholar]
- Chen Z, Jing Y, Song B, et al. Chemically modified heparin inhibits in vitro L-selectin-mediated human ovarian carcinoma cell adhesion. Int J Gynecol Cancer. 2009;19:540–546. doi: 10.1111/IGC.0b013e3181a44bc8. [DOI] [PubMed] [Google Scholar]
- Chen B, Khodadoust MS, Liu CL, et al. Profiling tumor infiltrating immune cells with CIBERSORT. Methods Mol Biol Clifton NJ. 2018;1711:243–259. doi: 10.1007/978-1-4939-7493-1_12. [DOI] [PMC free article] [PubMed] [Google Scholar]
- Choudhary D, Hegde P, Voznesensky O, et al. Increased expression of L-selectin (CD62L) in high grade urothelial carcinoma: a potential biomarker for metastatic disease. Urol Oncol. 2015;33:387.e17–387.e27. doi: 10.1016/j.urolonc.2014.12.009. [DOI] [PMC free article] [PubMed] [Google Scholar]
- Chu JE, Xia Y, Chin-Yee B, et al. Lung-derived factors mediate breast cancer cell migration through CD44 receptor-ligand interactions in a novel ex vivo system for analysis of organ-specific soluble proteins. Neoplasia N Y N. 2014;16:180–191. doi: 10.1593/neo.132076. [DOI] [PMC free article] [PubMed] [Google Scholar]
- Denkert C, von Minckwitz G, Darb-Esfahani S, et al. Tumour-infiltrating lymphocytes and prognosis in different subtypes of breast cancer: a pooled analysis of 3771 patients treated with neoadjuvant therapy. Lancet Oncol. 2018;19:40–50. doi: 10.1016/S1470-2045(17)30904-X. [DOI] [PubMed] [Google Scholar]
- Díez-Villanueva A, Mallona I, Peinado MA. Wanderer, an interactive viewer to explore DNA methylation and gene expression data in human cancer. Epigenetics Chromatin. 2015;8:22. doi: 10.1186/s13072-015-0014-8. [DOI] [PMC free article] [PubMed] [Google Scholar]
- Eliyatkın N, Yalçın E, Zengel B, et al. Molecular classification of breast carcinoma: from traditional, old-fashioned way to a new age, and a new way. J Breast Health. 2015;11:59–66. doi: 10.5152/tjbh.2015.1669. [DOI] [PMC free article] [PubMed] [Google Scholar]
- Gao J, Aksoy BA, Dogrusoz U, et al. Integrative analysis of complex cancer genomics and clinical profiles using the cBioPortal. Sci Signal. 2013;6:p1. doi: 10.1126/scisignal.2004088. [DOI] [PMC free article] [PubMed] [Google Scholar]
- Genbacev OD, Prakobphol A, Foulk RA, et al. Trophoblast L-selectin-mediated adhesion at the maternal-fetal interface. Science. 2003;299:405–408. doi: 10.1126/science.1079546. [DOI] [PubMed] [Google Scholar]
- Györffy B, Lanczky A, Eklund AC, et al. An online survival analysis tool to rapidly assess the effect of 22,277 genes on breast cancer prognosis using microarray data of 1,809 patients. Breast Cancer Res Treat. 2010;123:725–731. doi: 10.1007/s10549-009-0674-9. [DOI] [PubMed] [Google Scholar]
- Ivetic A, Hoskins Green HL, Hart SJ. L-selectin: a major regulator of leukocyte adhesion. Migr Signal Front Immunol. 2019;10:1068. doi: 10.3389/fimmu.2019.01068. [DOI] [PMC free article] [PubMed] [Google Scholar]
- Jeong H, Hwang I, Kang SH, et al. Tumor-associated macrophages as potential prognostic biomarkers of invasive breast cancer. J Breast Cancer. 2019;22:38–51. doi: 10.4048/jbc.2019.22.e5. [DOI] [PMC free article] [PubMed] [Google Scholar]
- Kobawala TP, Trivedi TI, Gajjar KK, et al (2016) Significance of TNF-α and the adhesion molecules: L-selectin and VCAM-1 in papillary thyroid carcinoma. In: J. Thyroid Res. https://www.hindawi.com/journals/jtr/2016/8143695/. Accessed 21 Dec 2019 [DOI] [PMC free article] [PubMed]
- Läubli H, Borsig L. Selectins as mediators of lung metastasis. Cancer Microenviron. 2010;3:97–105. doi: 10.1007/s12307-010-0043-6. [DOI] [PMC free article] [PubMed] [Google Scholar]
- Ley K, Laudanna C, Cybulsky MI, Nourshargh S. Getting to the site of inflammation: the leukocyte adhesion cascade updated. Nat Rev Immunol. 2007;7:678–689. doi: 10.1038/nri2156. [DOI] [PubMed] [Google Scholar]
- Li T, Fan J, Wang B, et al. TIMER: a web server for comprehensive analysis of tumor-infiltrating immune cells. Cancer Res. 2017;77:e108–e110. doi: 10.1158/0008-5472.CAN-17-0307. [DOI] [PMC free article] [PubMed] [Google Scholar]
- Majchrzak-Baczmańska DB, Głowacka E, Wilczyński M, Malinowski A. Serum concentrations of soluble (s)L- and (s)P-selectins in women with ovarian cancer. Prz Menopauzalny Menopause Rev. 2018;17:11–17. doi: 10.5114/pm.2018.74897. [DOI] [PMC free article] [PubMed] [Google Scholar]
- Netanely D, Avraham A, Ben-Baruch A, et al. Expression and methylation patterns partition luminal-A breast tumors into distinct prognostic subgroups. Breast Cancer Res BCR. 2016;18:74. doi: 10.1186/s13058-016-0724-2. [DOI] [PMC free article] [PubMed] [Google Scholar]
- Sopper S, Mustjoki S, White D, et al. Reduced CD62L expression on T cells and increased soluble CD62L levels predict molecular response to tyrosine kinase inhibitor therapy in early chronic-phase chronic myelogenous leukemia. J Clin Oncol. 2016;35:175–184. doi: 10.1200/JCO.2016.67.0893. [DOI] [PubMed] [Google Scholar]
- Tang Z, Kang B, Li C, et al. GEPIA2: an enhanced web server for large-scale expression profiling and interactive analysis. Nucleic Acids Res. 2019;47:W556–W560. doi: 10.1093/nar/gkz430. [DOI] [PMC free article] [PubMed] [Google Scholar]
- Thorsson V, Gibbs DL, Brown SD, et al. The immune landscape of cancer. Immunity. 2018;48:812–830.e14. doi: 10.1016/j.immuni.2018.03.023. [DOI] [PMC free article] [PubMed] [Google Scholar]
- Watson HA, Durairaj RRP, Ohme J, et al. L-Selectin enhanced T cells improve the efficacy of cancer immunotherapy. Front Immunol. 2019;10:1321. doi: 10.3389/fimmu.2019.01321. [DOI] [PMC free article] [PubMed] [Google Scholar]
- Yamada M, Yanaba K, Hasegawa M, et al. Regulation of local and metastatic host-mediated anti-tumour mechanisms by L-selectin and intercellular adhesion molecule-1. Clin Exp Immunol. 2006;143:216–227. doi: 10.1111/j.1365-2249.2005.02989.x. [DOI] [PMC free article] [PubMed] [Google Scholar]
- Yang S, Liu F, Wang QJ, et al. The shedding of CD62L (L-Selectin) regulates the acquisition of lytic activity in human tumor reactive T lymphocytes. PLoS ONE. 2011;6:e22560. doi: 10.1371/journal.pone.0022560. [DOI] [PMC free article] [PubMed] [Google Scholar]
- Youngblood B, Hale J, Xu X, et al. Progressive memory differentiation of CD8 T cells is regulated by de novo DNA methylation (P1426) J Immunol. 2013;190:117.13–117.13. [Google Scholar]
- Zhu B, Tse LA, Wang D, et al. Immune gene expression profiling reveals heterogeneity in luminal breast tumors. Breast Cancer Res. 2019;21:147. doi: 10.1186/s13058-019-1218-9. [DOI] [PMC free article] [PubMed] [Google Scholar]
Associated Data
This section collects any data citations, data availability statements, or supplementary materials included in this article.
Supplementary Materials
Data Availability Statement
Not applicable.


