

Abstract
The molecular pathology of multi-organ injuries in COVID-19 patients remains unclear, preventing effective therapeutics development. Here, we report a proteomic analysis of 144 autopsy samples from seven organs in 19 COVID-19 patients. We quantified 11,394 proteins in these samples, in which 5,336 were perturbed in the COVID-19 patients compared to controls. Our data showed that cathepsin L1, rather than ACE2, was significantly upregulated in the lung from the COVID-19 patients. Systemic hyperinflammation and dysregulation of glucose and fatty acid metabolism were detected in multiple organs. We also observed dysregulation of key factors involved in hypoxia, angiogenesis, blood coagulation, and fibrosis in multiple organs from the COVID-19 patients. Evidence for testicular injuries includes reduced Leydig cells, suppressed cholesterol biosynthesis, and sperm mobility. In summary, this study depicts a multi-organ proteomic landscape of COVID-19 autopsies that furthers our understanding of the biological basis of COVID-19 pathology.
Keywords: COVID-19, autopsy, proteome, tissue, cathepsin, hyperinflammation, coagulation, fibrosis, angiogenesis, pathology
Graphical Abstract
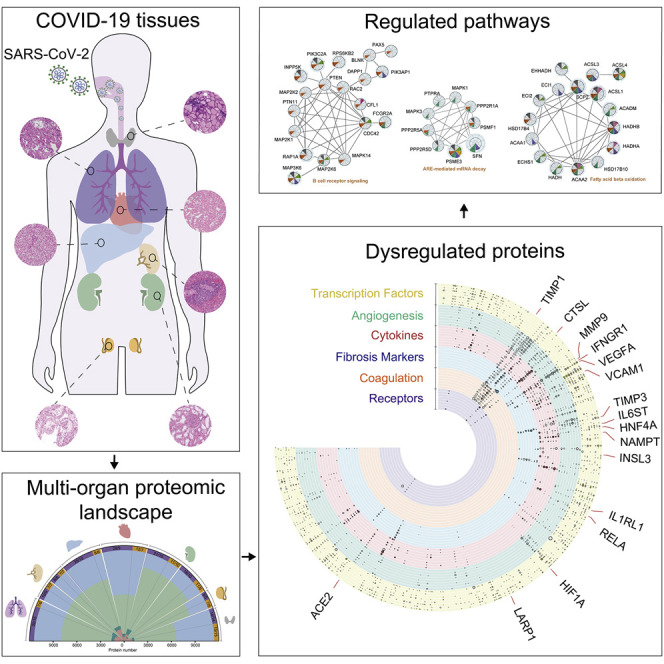
A proteomics analysis of 144 autopsy samples from seven organs in 19 COVID-19 patients shows elevated expression of cathepsin L1, rather than ACE2, in the lung tissue and highlights dysregulation of angiogenesis, coagulation, and fibrosis in multiple organs, in addition to systemic hyperinflammation.
Introduction
The ongoing COVID-19 pandemic, caused by severe acute respiratory syndrome coronavirus 2 (SARS-CoV-2), led to more than 55 million infected individuals and over 1.3 million deaths by the middle of November 2020. Morphological characterization of autopsies, mainly focused on the pulmonary lesions, has greatly advanced our understanding of COVID-19-caused deaths (Carsana et al., 2020; Su et al., 2020; Wichmann et al., 2020; Wu et al., 2020; Xu et al., 2020; Yao et al., 2020). Mechanistic studies of SARS-CoV-2-infected cell line models (Bojkova et al., 2020; Bouhaddou et al., 2020; Gordon et al., 2020) offered new insights into virus-perturbed biochemical processes of COVID-19 and suggested potential therapies. SARS-CoV-2-infected mouse models (Bao et al., 2020; Hassan et al., 2020; Jiang et al., 2020) and rhesus macaque models (Chandrashekar et al., 2020; Deng et al., 2020) generated by adenovirus transduction of human ACE2 have been established for preclinical selection of antiviral therapeutic agents and vaccines as well as for investigating pathogenesis. Few studies have characterized host responses at the molecular level from clinical specimens. We and others have studied the host responses by proteomic and metabolomic analysis of patient sera (Messner et al., 2020; Shen et al., 2020), but molecular changes in infected tissues and consequentially affected organs remain elusive. To date, little knowledge has been obtained concerning how SARS-CoV-2 virus induces injuries in multiple organs (Bian, 2020; Tian et al., 2020; Wichmann et al., 2020) including lung, kidney (Kudose et al., 2020), liver, heart, spleen, thyroid, and testis (Yang et al., 2020), and how to prevent and revert them.
Ackermann et al. (2020) analyzed the lung transcriptome of seven COVID-19 autopsies and reported intussusceptive angiogenesis that may be induced by hypoxemia. Latest advances of proteomics technologies allow effective and robust analysis of formalin-fixed tissue samples (Gao et al., 2020; Zhu et al., 2019). Comparative analysis of mRNA and protein expression in tissue samples showed that proteins measured by mass spectrometry were much more stable than transcripts (Shao et al., 2019). Here, we report a multi-organ proteomic profiling of 144 autopsy tissue samples collected from the lung, spleen, liver, heart, kidney, thyroid, and testis of 19 patients died from COVID-19 and 74 control tissue samples from 56 non-COVID-19 patients. Using tandem mass tagging (TMT)-based shotgun proteomics, we quantified 11,394 proteins, of which 5,336 were significantly dysregulated in at least one organ in the COVID-19 patients. This data resource offers a unique channel for understanding multi-organ injuries in the COVID-19 patients and nominating potential therapeutics.
Results and discussion
Generation and characterization of proteomic landscape
We first performed proteomic profiling of 144 autopsy tissue samples from seven organs, namely lung (N = 15, n = 30; N represents the number of patients, n represents the number of samples), spleen (N = 9, n = 9 from white pulp and red pulp and N = 8, n = 8 from red pulp), liver (N = 10, n = 24), kidney (N = 10, n = 18 from renal cortex and N = 10, n = 16 from renal medulla), heart (N = 9, n = 19), testis (N = 5, n = 5), and thyroid (N = 15, n = 15). The samples were from 19 COVID-19 cases, ten of which have been described previously (Wu et al., 2020), compared with 74 control samples from 56 non-COVID-19 cases with other diseases via surgeries (Figure 1 A; Tables S1 and S2). All 19 COVID-19 patients died from SARS-CoV-2 pneumonia or respiratory failure, among which seven also developed terminal multiple organ dysfunction syndrome (MODS). Other confounders, including the effects of smoking, gender, hypertension, diabetes, and coronary heart disease, all showed no difference between the COVID-19 and non-COVID-19 groups by Fisher’s exact tests (Table S1). Due to missing values of body mass index (BMI) information, this study could not be utilized to investigate the impact of BMI. Detailed information of patients including medication history during hospitalization, laboratory test data, pathological changes, and cause of death are summarized in Figures S1 and S2 and Tables S1 and S5.
Figure 1.

Multi-organ proteomic landscape of COVID-19 autopsies
(A) The quantified and dysregulated proteins across multiple organs. The outermost (first) ring represents the type of samples. The number of samples and patients (n/N) is labeled respectively. The second ring (in blue) refers to the missing/undetected proteins for each organ. The numbers in black represent the quantified proteins in the specific organ. The third ring (in light green) refers to unregulated proteins. The numbers in white represent the significantly dysregulated proteins in specific organ type (B-H adjusted p value <0.05; |log2[fold change of COVID-19 versus non-COVID-19]| >log2[1.2]). The innermost ring refers to the number of significantly dysregulated proteins for each organ (pink, upregulated; dark green, downregulated).
(B) Protein expression of CRP and CD163 across six organs (except testis). The y axis stands for the protein expression ratio by TMT-based quantitative proteomics. Pairwise comparison of each protein between COVID-19 and non-COVID-19 groups was performed with Student’s t test. The cutoff of dysregulated proteins has been set at B-H adjusted p value <0.05 and |log2(FC)| >log2(1.2). B-H adjusted p value: ∗p < 0.05; ∗∗p < 0.01; ∗∗∗p < 0.001.
See also Figure S1, Figure S2, and S3 and Tables S1, S2, S3, and S4
Figure S1.

Comparison of histopathological features of organs between COVID-19 and non-COVID-19 patients (H&E ×200), related to Figure 1
The left column shows the results of the non-COVID-19 patients and the right part shows the results of the COVID-19 patients. A. Pathological features of lungs from the COVID-19 patients. (i) The lung showed diffuse alveolar damage, with the alveolar epithelia replaced by hyperplastic type II alveolar epithelia and falling of type II alveolar epithelia (a). Alveolar septa were thickened with the proliferation of fibroblasts/myofibroblasts and fibrosis (b). Fibrinous exudation and hyaline membrane formation (c) were observed, with neutrophils aggregation in the alveolar cavity (d). (ii) There were some microthrombus in small vessels of the lung (a), and megakaryocytes in the alveolar septal capillaries (b). B. Pathological findings of the spleen from COVID-19 patients. (i) The red pulp of the spleen expanded, and splenic sinus extended with hyperemia accompanying with macrophage proliferation. (ii) The white pulp of spleen exhibited atrophy with significantly reduced lymphocytes. C. Pathological findings of the liver from COVID-19 patients. (i) Coagulative necrosis of hepatocytes was observed in zone III. (ii) The hepatocytes exhibited prominent steatosis. D. Pathological findings of the heart from COVID-19 patients. (i) Atrophic myocardia and scant lymphocytes (a) were present in the edematous cardiac interstitium. (ii) The myocardium showed hydropic degenerative change. E. Pathological findings of the kidney from the COVID-19 patients. (i) In the renal cortex, the proximal tubules showed prominent acute tubule injury manifested as the loss of brush border and epithelial cells necrosis in the tubular lumens (a). Microthrombi in peritubular capillaries and glomeruli (b) were frequently observed. (ii) In the renal medulla, the collecting ducts showed occasional cellular swelling and atrophy (a), and edema without significant inflammation (b). F. Pathological findings of the thyroid from the COVID-19 patients. Lymphoid infiltration was found in some of interfollicular region. Neither neutrophilic infiltration nor necrosis was present.
Figure S2.

Laboratory characteristics of multi-organ dysfunction and infection indicators with COVID-19, related to Figure 1
Boxplots display the blood biochemistry tests based on samples collected from the COVID-19 patients on the day of admission (red) and death (green). The dash line represents the normal range of laboratory characteristic. BNP, brain natriuretic peptide; CK-MB, creatine kinase-MB; ALB, albumin; ALT, alanine aminotransferase; AST, aspartate aminotransferase; LDH, lactate dehydrogenase; TBIL, total bilirubin; ALP, alkaline phosphatase; GGT, gamma-glutamyl transferase; WBC, white blood cells; PLT, platelets; RBC, red blood cells; BUN, blood urea nitrogen; PT, prothrombin time; APTT, activated partial thromboplastin time; INR, international normalized ratio; FIB, fibrinogen; TT, thrombin time; CRP, C-reactive protein; IL-6, interleukin-6.
Altogether, we quantified 11,394 proteins from above samples with a false discovery rate (FDR) less than 1% at both peptide and protein levels (Figure 1A; Table S3). The number of identified proteins ranged from 5,828 (heart) to 9,544 (kidney) across seven types of organs. We analyzed 37 technical replicates of randomly selected tissue samples, as well as 18 pooled controls for each TMT batch (Figure S3 A; Table S2). Proteins quantification in these technical replicates and control samples showed relatively low median coefficient of variance (CV) of 6.88% and 2.47%, respectively (Figures S3B and S3C). A total of 5,336 dysregulated proteins were characterized from the seven types of organs between COVID-19 and control groups (Benjamini-Hochberg [B-H] adjusted p value <0.05 and |log2(fold change) | >log2[1.2]) (Figure 1A; Table S4). Splenic red pulp samples were excluded from downstream analysis, because they did not show any statistically significant proteomic regulations (Figure 1A). Hierarchical clustering of the differentially expressed proteins from each organ type (Figure S3D) showed that these proteins well separated COVID-19 samples and controls. The t-distributed stochastic neighbor embedding (t-SNE) analysis shows that dysregulated proteomes of each organ type clustered tightly apart from each other (Figure S3E), consolidating that these selected proteins well-resolved different organ types. Except for testis, the other six organ types shared only 27 dysregulated proteins, suggesting different organs responded to viral infection via diverse pathways. Among them, the acute inflammatory protein C-reactive protein (CRP) and the scavenger receptor cysteine-rich type 1 protein M130 (CD163), which is highly expressed marker in M2 type macrophage (Etzerodt and Moestrup, 2013), were the most upregulated proteins (Figure 1B), probably reflecting both the hyperinflammatory and repairing state in patients died from COVID-19.
Figure S3.

Proteomic workflow and quality control of proteome data analysis, related to Figure 1 and STAR methods
A. The workflow of TMT-labeling based quantitative proteomic analysis employed in our study. 288 peptide samples containing 37 technique replicates, 16 common pooled controls and 17 tissue specific pooled controls were distributed into 18 batches and analyzed by TMT 16-plex labeling based proteomics. FFPE, formalin-fixed and paraffin-embedded; PCT, pressure cycling technology; RP-LC, reversed phase liquid chromatography; LC-MS, liquid chromatography-mass spectrometry. B. The median CV of the proteomics data is calculated by the log2(abundance) of quantified proteins in the pooled controls of each organ. C. The median CV of the proteomics data is calculated by expression ratio of quantified proteins in the technique replicates of each organ. D. Heatmap of dysregulated proteins for lung (37 samples ∗ 1606 proteins), spleen (17 samples ∗ 1726 proteins), liver (36 samples ∗ 1969 proteins), heart (40 samples ∗ 919 proteins), renal cortex (32 samples ∗ 1585 proteins), renal medulla (29 samples ∗ 642 proteins) and thyroid (29 samples ∗ 1297 proteins) between the COVID-19 patients and non-COVID-19 groups were shown. E. The t-distributed stochastic neighbor embedding (t-SNE) visualization of significantly dysregulated proteins in multiorgan proteomes of the COVID-19 (triangle) and the non-COVID-19 (circle) patients. The color of triangle or circle represents the organ type. Note: The cutoff of dysregulated proteins has been set at B-H adjusted p value < 0.05 and |log2(FC)| > log2(1.2).
In our study, 14 out of 19 COVID-19 patients exhibited sepsis (Table S1), which is associated with systemic hyperinflammatory response, multi-organ injuries, and MODS (Hotchkiss et al., 2016). We compared the multi-organ proteomes of the COVID-19 patients with MODS (N = 7) to those without MODS (N = 12). As shown in Table S4, three types of organs including liver, renal cortex, and testis showed significant dysregulation of protein expression between the two groups. In the liver of MODS group, most of elevated proteins in regulated exocytosis are involved in immune response, such as acute phase response, cytokine secretion, and neutrophil degranulation (Table S6), suggesting dysfunction of the first line of host defense. These inflammatory cells and mediators all contribute to the development of MODS (Lobo et al., 2003).
Six clusters of proteins relevant to SARS-CoV-2 infection
We then focused on six clusters of proteins including viral receptors and proteases, transcription factors (TFs), cytokines (and their receptors), coagulation system-related proteins, angiogenesis-associated proteins, and fibrosis markers due to their relevance to SARS-CoV-2 infection (Figures 2A and 2B). After cellular entry mediated by receptors and proteases, SARS-CoV-2 hijacks the host translation machinery and induces host inflammatory response via TFs, leading to hyper-inflammatory state, which might be associated with the clinically observed blood hypercoagulability as measured by blood tests (Figure S2; Table S5), fibrosis and microthrombosis as examined by pathologists (Figure S1), and enhanced angiogenesis as reported by morphologic and gene expression examination in the lung of COVID-19 (Ackermann et al., 2020). More details of the regulated proteins are provided in the supplementary tables.
Figure 2.

Six functional clusters of dysregulated proteins from seven organs between COVID-19 and non-COVID-19 patients
(A) Counts of dysregulated proteins in six clusters of molecules, including potential virus receptors and proteases, fibrosis markers, cytokines (and their receptors), transcription factors (TFs), coagulation system, and angiogenesis-associated proteins are shown in a bar chart. Each column along y axis represents a type of organ. The number of proteins is shown in x axis.
(B) Landscape of 5336 significantly dysregulated proteins in seven organs. The dysregulated proteins in the six clusters are labeled as circles (solid, upregulated proteins; hollow, downregulated proteins). The size of circle indicates |log2(FC)|.
(C) Protein expression of potential virus receptors across multiple organs. The y axis stands for the protein expression ratio by TMT-based quantitative proteomics. Pairwise comparison of each protein between COVID-19 and non-COVID-19 groups was performed using Student’s t test. The cutoff of dysregulated proteins has been set at B-H adjusted p value <0.05 and |log2(FC)| >log2(1.2). B-H adjusted p value: ∗p < 0.05; ∗∗p < 0.01; ∗∗∗p < 0.001.
See also Figures S4 and S5 and Table S5.
Our data showed substantial regulation of TFs in COVID-19 autopsies. 395 out of 1,117 quantified TFs were altered in at least one tissue type (Figure S4 A; Table S5), and they were significantly enriched in spliceosome and viral carcinogenesis, among others, as shown in Figure S4B. By matching the experimental fold-change with the predicted activation state in Ingenuity Pathway Analysis (IPA), ten of these dysregulated TFs showed the same regulatory trend. Our data showed that six of these proteins are involved in the inflammatory responses and all of them were upregulated in multiple COVID-19 organs. The six proteins include nuclear factor κB (NF-κB) subunit 2 (NFKB2) (Lawrence, 2009), transcription factor p65 (RELA) (Rayet and Gélinas, 1999), CCAAT/enhancer-binding protein β (C/EBPB) (Greenbaum et al., 1998), signal transducer and activator of transcription 1 and 3 (STAT1/3) (Yu et al., 2009), and transcription factor jun-B (JUNB) (Hess et al., 2004) (Figure 2B; Table S5). We also detected dysregulation of TFs involved in tissue injuries and hypoxia state. The RB transcriptional corepressor 1 (RB1) was upregulated in the liver and renal cortex (Figures 2B and S4A), which may negatively modulate the cell cycle (Dyson, 2016) and induce a higher degree of mitochondrial membrane permeabilization and apoptosis (Hilgendorf et al., 2013). The La-related protein 1 (LARP1) is an RNA-binding protein regulating mRNA translation and modulated by mTOR signaling (Tcherkezian et al., 2014). Recently, LARP1 has been reported to interact with SARS-CoV-2 (Gordon et al., 2020). Interestingly, our data showed that it was upregulated in the lung, spleen, liver, renal medulla, and thyroid of these COVID-19 patients (Figure 2B), suggesting it might be a critical player in the SARS-CoV-2 replication. The hypoxia-inducible factor 1-alpha (HIF1A) was upregulated in renal cortex (Figures 2B and S4A) and was also predicted to be activated in the lung, liver, renal cortex, and medulla by upstream regulator analysis, although not detected in these samples, suggesting systemic hypoxia state (Lee et al., 2019b) in these COVID-19 patients. Hepatocyte nuclear factor 4-alpha (HNF4A) can modulate the transcription of genes regulating lipid and bile acid synthesis and gluconeogenesis (Babeu and Boudreau, 2014). The hypoxia state and upregulated STAT3 could reduce the expression of HNF4A (Cairo and Buendia, 2012; Mazure et al., 2001), leading to downregulation of microsomal triglyceride transfer protein large subunit (MTTP) and apolipoprotein B-100 (ApoB), and upregulation of scavenger receptor class B member 1 (SCARB1) (Hayhurst et al., 2001), as confirmed by our proteomic data (Figure 2B; Table S4). Reduced MTTP and ApoB and increased SCARB1 have been associated with hepatic steatosis (Hayhurst et al., 2001) (Figure S1).
Figure S4.

Transcription factors and cytokines dysregulated in multiple organs, related to Figure 2
A. Circular heatmap of dysregulated transcription factors. The selected transcription factors with |log2(FC)| larger than |log2(1.5)| from dysregulated proteins are shown. Some of the transcription factors in specific tissue with the same trend of changes, and distinguished out by upstream analysis are highlighted in red frame with red and bold font. B. Pathway enrichment analysis of dysregulated transcription factors between the COVID-19 and non-COVID-19 groups. Reactome pathways were enriched by String. FDR: false discovery rate. C. The chord diagram shows the shared cytokines (and their receptors) dysregulated between COVID-19 and non-COVID-19 groups across multiple organs. The cutoff of dysregulated proteins has been set at B-H adjusted p value < 0.05 and |log2(FC)| > log2(1.2). The color of proteins represents the upregulation or downregulation pattern. The length of the brick for each protein corresponds to the sum of |log2(FC)| in multiple organs. The length of the brick for each organ corresponds to the sum of |log2(FC)| in one or more proteins. D. Pathway enrichment analysis of dysregulated cytokines. Gene ontology (GO) pathways were enriched by Metascape.
Among the 242 quantified cytokines and related proteins, 112 were significantly dysregulated and enriched in angiogenesis, response to growth factor, and other pathways (Figures S4C and S4D; Table S5). Nicotinamide phosphoribosyl transferase (NAMPT), glucocorticoid receptor (NR3C1), and interferon-gamma receptor 1 (IFNGR1) were dysregulated in most organs. NAMPT, which participates in multiple signaling pathways (e.g., interleukin [IL]6-STAT3 and NF-κB) (Garten et al., 2015), was upregulated in the six organs except for testis. NR3C1 is the receptor for glucocorticoid and a transcriptional factor promoting anti-inflammatory responses (Baschant and Tuckermann, 2010). It is classified as cytokine and associated proteins in the ImmPort database. The downregulation of NR3C1 was identified in the five organs except for testis and thyroid (Figure S4C), suggesting reduced anti-inflammatory responses. IFNGR1, which triggers host immune responses on viral infection (Xia et al., 2018) (e.g., induction of phagocyte oxidase system, nitric oxide [NO] production, and lysosomal enzymes activation for microbe destruction in macrophages) (Schroder et al., 2004), was upregulated in the five organs except for testis and thyroid.
CTSL, rather than ACE2, was upregulated in lungs
Our data identified six reported potential receptors or proteases for the virus entry (Figure 2C), namely angiotensin-converting enzyme 2 (ACE2) (Hoffmann et al., 2020), C-type lectin domain family 4 member M (CLEC4M) (Jeffers et al., 2004) and member L (CD209) (Yang et al., 2004), Niemann-Pick C1(NPC1) (Côté et al., 2011), carcinoembryonic antigen-related cell adhesion molecule 1 (CEACAM1) (Tsai et al., 2003), and cathepsin L1 (CTSL) (Liu et al., 2020b; Ou et al., 2020). ACE2, the known receptor mediating SARS-CoV-2 entry, did not show significant regulation in the lung, suggesting that ACE2 inhibitors might not be an effective therapy for severe and critical COVID-19 patients. However, it was downregulated in both kidney and heart (Figure 2C), which may be associated with its modulatory roles on angiotensin II, including inflammation, vasoconstriction, and thrombosis (Liu et al., 2020a). The other two receptors for SARS (Chan et al., 2006; Jeffers et al., 2004), namely CD209 and CLEC4M, were not significantly dysregulated in the lung either (Figure 2C). Interestingly, our results showed CTSL, the serine protease of SARS-CoV-2 in the endosomal pathway, was significantly upregulated in the lung (Figure 2C), nominating it as a potential therapeutic target for COVID-19 (Bittmann et al., 2020). In the SARS-CoV-2 infection cell model, the inhibitor of CTSL has been proven to be effective for blocking the virus entry (Ou et al., 2020). Besides CTSL, our data showed upregulation of several other cathepsins including CTSB, CTSD, CTSE, CTSH, CTSK, CTSS, and CTSZ in the lung of the COVID-19 patients (Table S4). Cathepsins have been reported to facilitate the synthesis of pro-IL-1β and activate NLRP3 inflammasome, leading to pyroptosis (Orlowski et al., 2015; Yap et al., 2020). IL-1 signaling was also enriched and activated in the spleen, renal medulla, and thyroid of the COVID-19 patients (Table S6). In the lung of COVID-19 patients, myeloperoxidase (MPO) for neutrophil primary granules was upregulated (Table S4), indicating infiltration of neutrophils recruited by IL-1. Interestingly, we also found upregulation of lactate dehydrogenase (LDH) in the lung (Table S4), which is an indicator of pyroptosis and tissue injuries. Thus, the inhibition of CTSL may also contribute to the excessive inflammatory activity in the COVID-19 patients. Of note, we also observed upregulation of CTSL in the spleen, renal medulla, and thyroid (Figure 2C).
Multi-organ coagulation, angiogenesis, and fibrosis
Our data suggested systematic dysregulation of coagulation, angiogenesis, and fibrosis in COVID-19 patients, as shown in Figures 3 and S5 and Table S5. Microthrombi in the COVID-19 patients were observed in the lung, kidney (Figure S1), and lower extremity veins (Table S1) of the COVID-19 patients, in agreement with laboratory test results, such as elevated D-dimer (Figure S2). The formation of microthrombi is due to imbalance among coagulation, anticoagulation, and fibrinolytic systems (Palta et al., 2014). Our data uncovered multiple dysregulated proteins participating in coagulation, anticoagulation, and fibrinolytic system that might have contributed to the coagulation disorders in COVID-19 (Figure 3A; Table S5). Four coagulation factors, namely coagulation factors prothrombin (F2), XI, XII, and XIIIa (F11, F12, and F13A1), were dysregulated in the COVID-19 patients (Figure 3A). F13A1 is activated in the last step of coagulation, which could induce hemostasis and stabilize the fibrin clot to avoid fibrinolysis (Muszbek et al., 2011). We detected increase of F13A1 in the renal cortex, which might be associated with the observed blood clotting in the renal cortex (Figure S1). VWF is a glycoprotein that binds to the factor VIII (F8), protects F8 from degradation by vitamin K-dependent protein C (PROC), and could trigger the platelet aggregation following vascular injury (Peyvandi et al., 2011). We found that VWF was increased in the renal cortex in COVID-19 (Figure 3A), indicating higher risk of thrombosis. Our data also showed increase of fibrinogen alpha chain, gamma chain, and beta chain (FGA, FGG, and FGB) in the COVID-19 lung (Figure 3A). These proteins could be cleaved into fibrin that contributes to formation of blood clots (Göbel et al., 2018). We detected dysregulation of multiple serine protease inhibitors in the COVID-19 organs (Figure 3A). Heparin cofactor 2 (SERPIND1) is a serine proteinase inhibitor, which acts as the inhibitor of thrombin (He et al., 2002) and the cofactor for heparin. Plasminogen activator inhibitor 1 (SERPINE1) is a major inhibitor of plasmin, which could break down the blood clotting (Chapin and Hajjar, 2015). The downregulation of SERPIND1 and the upregulation of SERPINE1 in the renal cortex might have contributed to the microthrombi observed in the COVID-19 kidney cortex (Figure S1).
Figure 3.

Coagulation, angiogenesis-associated proteins, and fibrosis markers regulated in multiple organs
(A–C) Chord diagrams show dysregulated and multi-organ shared proteins in coagulation system (A), angiogenesis associated proteins (B), and potential fibrosis markers (C) between COVID-19 and non-COVID-19 patients across multiple organs. The cutoff of dysregulated proteins has been set at B-H adjusted p value <0.05 and |log2(FC)| >log2(1.2). The length of the brick for each protein corresponds to the sum of |log2(FC)| in multiple organs. The length of the brick for each organ corresponds to the sum of |log2(FC)| in one or more proteins.
See also Figure S5.
Figure S5.

The network of fibrosis associated proteins over four fibrosis stages in multiple organs, related to Figures 2 and 3
The network shows the interactions among 179 stage-specific dysregulated proteins between COVID-19 and non-COVID-19 groups in each organ over the four fibrosis stages: initiation (green), inflammation (blue), proliferation (orange), and modification (red). The network analysis was performed using String and Cytoscape. The size of the dot represents the value of |log2(FC)|. Note: The cutoff of dysregulated proteins has been set at B-H adjusted p value < 0.05 and |log2(FC)| > log2(1.2).
Abnormal angiogenesis resulted from aberrant coagulation, and tissue hypoxia has been reported in the COVID-19 lungs with specialized technologies using microvascular corrosion casting coupled with scanning electron microscopy (Ackermann et al., 2020). In our study, a total of 139 angiogenesis-related proteins from the nCounter PanCancer Progression Panel (NanoSring Technologies) were significantly dysregulated (Figure 3B; Table S5), suggesting abnormal angiogenesis.
Fibrosis has been observed in the lungs of COVID-19 patients (Figure S1; Table S1). It is usually divided into four stages (i.e., initiation, inflammation, proliferation, and modification) (Wynn, 2003). A cascade of stress and immune responses are triggered at the initiation stage, followed by activation of multiple inflammatory signaling pathways, such as the chemokine signaling, complement system, macrophage activation, and NF-κB signaling, among others. At the proliferation stage, fibroblasts differentiate and proliferate. Finally, the extracellular matrix (ECM) composed of immune cells and fibroblast cells is re-structured in the modification stage. In the COVID-19 samples, we characterized 335 dysregulated proteins involved in the four stages of fibrosis according to nCounter Fibrosis Panel (NanoSring Technologies), 179 of which are stage-specific proteins (Table S5). These 179 proteins formed 447 interactions according to String (Szklarczyk et al., 2019) and Cytoscape (Shannon et al., 2003) in our data (Figure S5 ). The dysregulated proteins associated with the fibrosis process in the lung have probably contributed to the pathological changes observed in these patients (Figure S1). Although the proteins involved in the modification stage were most dominant in the lung, the other organs exhibited relatively less perturbation in these proteins, consistent with the microscopic examination (Figure S1). Nevertheless, our data suggested the fibrosis processes have been triggered in these organs, although microscopically morphological changes were not discernable. These molecular changes might be exploited to instruct tissue fibrosis treatment for the COVID-19 patients.
Thrombospondin 1 (THBS1) is an extracellular glycoprotein involved in the inflammation and proliferation stages, and it is highly expressed by stromal fibroblasts and activated platelets (Adams and Lawler, 2011). Studies have reported its diverse roles in regulating cell-matrix interactions, platelet aggregation, angiogenesis, and formation of collagen matrix during wound healing (Bornstein, 2001; Sweetwyne and Murphy-Ullrich, 2012). In the COVID-19 patients, THBS1 was upregulated in the liver, heart, and kidney (Table S4), suggesting potential fibrosis in the COVID-19 patients.
In the modification stage, multiple lysosomal cathepsins, including CTSL and CTSD, have been reported to play a pro-fibrogenic role in the liver, kidney, heart, and lung, which regulates the ECM degradation and tissue remodeling (Fox et al., 2016; Manchanda et al., 2017). The upregulated CTSL and CTSD in the COVID-19 patients (Table S5) might contribute to fibrosis in the lung, spleen, thyroid, liver, and heart.
In addition, we detected 29 fibrosis-associated proteins in our dataset according to manual literature mining (Figure 3C; Table S5). SERPINE1 and Chitinase 3 Like 1 (CHI3L1) were upregulated in most organs from the COVID-19 patients (Figure 3C). SERPINE1 is a potent inhibitor of proteolytic urokinase and tissue plasminogen activator (uPA/tPA). Elevated SERPINE1 could inhibit degradation of ECM, contributing to multi-organ fibrogenesis (Ghosh and Vaughan, 2012). CHI3L1 is a secreted chitinase-like protein modulating fibroblasts proliferation, immune cell differentiation, ECM reorganization, and angiogenesis in response to cytokines and stresses such as hypoxia (Zhao et al., 2020). The upregulation of SERPINE1 and CHI3L1 were detected not only in the lung, but also in the liver, heart, and kidney, suggesting a multi-organ profibrotic state in the COVID-19 patients.
Dysregulated protein translation, glucose, and fatty acid metabolism
To obtain a systematic understanding of biological processes represented by 5,336 dysregulated proteins, we performed pathway enrichment analysis for each tissue type using IPA. Comparisons of the most enriched or dysregulated pathways (-log10 [p value] >10 or ratio >0.35 or absolute [Z score] >5) among seven organ types are shown in Figure 4 A and Table S6. EIF2 signaling is involved in the regulation of mRNA translation (Roux and Topisirovic, 2018), which has been reported to be affected by virus infection (Bojkova et al., 2020). The lung, liver, and thyroid shared a similar pattern of mRNA translation (Figure 4A), although there was little evidence of SARS-CoV-2 infection in the liver or thyroid. Most dysregulated proteins specific to the lung belonged to L13a-mediated translational silencing of ceruloplasmin expression (Figures 4B and 6A), which has been reported as an innate immune mechanism after the virus infection (Mazumder et al., 2014). We observed suppression of multiple metabolic processes including glycogenolysis, galactose degradation, and glycolysis (Figure 4A; Table S6). In contrast, fatty acid β oxidation (FAO) and oxidative phosphorylation were activated in most organs, suggesting a switch to high-efficiency energy production mode to support virus replication in the lung and mRNA translation in the liver (Heaton and Randall, 2011). In addition, dysregulated FAO and oxidative phosphorylation also led to excessive generation of reactive oxygen species (ROS) and release of pro-apoptotic proteins, which induced liver necrosis (Figure S1). In the kidney, FAO was inhibited, which is thought to be a contributor to acute kidney injury (AKI)-induced renal fibrogenesis (Kang et al., 2015). Indeed, AKI has been observed in most COVID-19 patients in our study (Table S1).
Figure 4.

Dysregulated pathways in multiple organs
(A) The top pathways dysregulated across multiple organs. Pathway analysis was performed using all dysregulated proteins in the specific organ using IPA. The size of circle represents the -log10(p value) and the color represents the Z score by IPA.
(B) The pathways enriched by Metascape for translation initiation relating proteins that are differentially expressed only in lung or liver, respectively.
(C) Translation-associated pathway comparison across multiple organs. The size of circle represents the -log10(P) and the color represents the Z score by IPA.
(D) Heatmap of SARS-CoV-2 interacting proteins dysregulated in the lung. The significance (“Sig.” as the short term in figures) was calculated using Student’s t test. B-H adjusted p value: ∗p < 0.05; ∗∗p < 0.01; ∗∗∗p < 0.001. The cutoff of dysregulated proteins has been set at B-H adjusted p value <0.05 and |log2(FC)| >log2(1.2).
Figure 6.

Dysregulated proteins and networks in six organs
(A) Significantly enriched networks from the dysregulated proteins in the six organs. Each protein is depicted with radar chart for the six organs. Different organs are labeled with different colors. The shadow area covering the circles indicates the FC values for each protein.
(B) A hypothetical systems view of the multiple organs’ responses to SARS-CoV-2 infection. In the lung, the virus and its released RNA could induce immune response and hijack the host translation mechanism. The innate and adaptive immune cells in the spleen and the cytokine induce acute phase proteins secreted by hepatic cells in response to antiviral defense. Such hyperinflammatory status across the whole body through circulatory system leads to multi-organ injuries. Red boxes, upregulated proteins/pathways; green boxes, downregulated proteins/pathways; blue boxes, pathological processes.
See also Figures S6 and S7.
SARS-CoV-2-associated protein regulation in the lung
The lung is the major target attacked by SARS-CoV-2. In our data, COVID-19 lung proteome showed unique enrichment of pathways that are known to be associated with virus infection, including mRNA decay and translation shutoff (Tanaka et al., 2012) (Figures 4C, 5A, and 6). The ARE-mediated mRNA degradation pathway was inhibited in the lung, while activated in all the other organs (Figure 4C). During coronavirus replication, the translation of nested subgenomic mRNAs is cap-dependent and required for the cap-binding protein, eukaryotic translation initiation factor 4E (EIF4E), which involves cap recognition in the translation initiation. In addition, EIF4E has been reported as a potential target to block human coronavirus 229E (HCoV-229E) infection (Cencic et al., 2011). Our data showed that EIF4E was upregulated only in the lung of the COVID-19 patients (Figure 5A), which might be perturbed and hijacked by SARS-CoV-2. Further, double-stranded RNA (dsRNA) and uncapped mRNA of the virus act as viral pathogen-associated molecular patterns (PAMPs) that trigger the innate immune response through recognition by pattern recognition receptors (PRRs) in the cytoplasm (Lin and Cao, 2020). By comparing with the SARS-CoV-2 protein interaction map (Gordon et al., 2020), 12 virus-host interacting proteins were dysregulated only in the lung, including stress granule-related factor G3BP1, mitochondrial protein TIMM10, transcription regulator eIF4H, RING-type E3 ubiquitin ligase MIB1, pro-inflammatory cytokine receptor IL17RA, and member of Cullin RING E3 ligase 2 complex ZYG11B (Figure 4D). These proteins have been reported to promote virus replication, inhibit host mRNA expression, mediate the delivery of viral DNA through viral nuclear pore complex, participate in pulmonary fibrosis, and degrade virus restriction factors (Gordon et al., 2020). G3BP1 was reported to interact with SARS-CoV-2 nucleocapsid (N) protein, which could be sequestered by viruses to promote their replication (Gordon et al., 2020). TIMM10 has been reported to be targeted by viruses to enhance their replication (Williamson et al., 2012). The interaction between SARS-CoV-2 Nsp9 and eIF4H may indicate the inhibition of host mRNA expression (Gordon et al., 2020). The interaction between Nsp9 and MIB1 may mediate the delivery of viral DNA through nuclear pore complex (Gordon et al., 2020). IL17RA is associated with elevation of collagen and pulmonary fibrosis, and its inhibitor has been reported to reduce fibrosis in SARS infection (Mi et al., 2011). The interaction between Orf10 and ZYG11B may be hijacked for degradation of virus restriction factors or be blocked to protect itself from degradation (Gordon et al., 2020).
Figure 5.

The heatmap of key dysregulated proteins in the lung, spleen, and liver, respectively
(A) The heatmap of key proteins in associated pathways in the lung and spleen.
(B) The heatmap of key proteins in associated pathways in the liver. The significance (Sig.) of them in lung, spleen, and liver was calculated using Student’s t test. B-H adjusted p value: ∗p < 0.05; ∗∗p < 0.01; ∗∗∗p < 0.001.
See also Figure S6.
Immune responses in multiple organs
We next investigated the multi-organ immune responses in the COVID-19 patients based on our proteomics data (Figures 5, 6, and S7). We found that spleen and lung exhibited similar immune response patterns (Figure 5A). In the lung, we detected upregulation of two immune checkpoint proteins, namely carcinoembryonic antigen-related cell adhesion molecule 1 (CEACAM1) and CD276 (Figure 5A). CEACAM1 is a cell-cell adhesion protein expressed in lymphocytes and suppresses cytokine production, proliferation, and cytotoxic activity of T cells in response to virus (Gray-Owen and Blumberg, 2006). Another immune checkpoint protein CD274 was upregulated in the spleen (Figure 5A). The elevation of checkpoint proteins suggests suppression of adaptive immunity in the lung and spleen of the COVID-19 patients. Further, in the lung and spleen, we detected downregulation of lymphocyte-specific tyrosine-protein kinase (LCK), which is enriched in T cells. Thus, the downregulated LCK suggests suppression of T cell-mediated immune response in the lung and spleen. Next, we performed pathway analysis of dysregulated proteins in the spleen, which highlighted activation of PD-1 and PD-L1 pathway, and inhibition of B cell receptor signaling (Figure 6A; Table S6), further consolidating decreased adaptive immune response in the COVID-19 patients.
Figure S7.

The key dysregulated proteins in the heart, renal cortex, renal medulla, and thyroid associated with the enriched pathways by IPA, related to Figures 4 and 6
The heatmap of key proteins in associated pathways in the heart (A), renal cortex (B), renal medulla (B), and thyroid (C). The significance (Sig.) of them in each type of organ was calculated using Student’s t test (B-H adjusted p value: ∗, < 0.05; ∗∗, < 0.01; ∗∗∗ < 0.001).
We further checked multiple markers for various immune cells in the spleen samples using immunohistochemistry (IHC) and found that the numbers of T and B lymphocytes were significantly reduced by IHC staining of CD3 for the total T cells, CD4 for CD4+ T cells, CD8 for CD8+ T cells, and CD20 for B cells, especially in the white pulp of COVID-19 patients, whereas the number of macrophages, M2 macrophages increased in the spleen of COVID-19 patients by IHC staining of CD68 and CD163, respectively (Figure S6 ). These findings agreed with our proteomic data (Figures 5A and 6A).
Figure S6.

Representative images of immunohistochemical staining for immune cells in the spleen of COVID-19 and non-COVID-19 patients, related to Figures 5 and 6
White pulp and red pulp samples were from patient P1 (COVID-19) and patient C57 (non-COVID-19), respectively. The multiple markers for various immune cells in the spleen samples using IHC including CD3 for total T cell, CD4 for CD4 positive T cell, CD8 for CD8 positive T cell, CD20 for B cell, CD68 for macrophage and CD163 for M2 macrophage were shown.
T cell exhaustion and upregulation of monocytes biomarkers in the spleen (Figures 5A and S6) suggested hyperinflammation, which may have damaged the integrity of the gas exchange barrier and induced hypoxia (Figure 6A). The hypoxia state would further stimulate the inflammatory responses (Eltzschig and Carmeliet, 2011). Interestingly, our pathway analysis for the immunological proteins from GSEA-immunologic gene sets highlighted activation of NF-κB signaling and acute phase response in the liver (Figures 5B, 6A, and 6B; Table S6), probably induced by increased cytokines in the circulation (Alonzi et al., 2001; Israël, 2010). We detected upregulation of the kinase subunit of IKK complex and its modulator subunit, namely IKBKG and IKBKB, in the liver. This also supports the activation of canonical NF-κB cascade. We observed vasogenic edema in the heart (Figure S1), which might be due to vascular hyperpermeability induced by circulating cytokines, acute phase proteins, and other molecules including histamine (Nagy et al., 2008). Our proteomic data did not measure metabolites, but we found downregulation of histamine N-methyltransferase (HNMT) (Figures 6B and S7 A), which catabolizes histamine, supporting accumulation of histamine.
Sepsis and its common complication, acute kidney injury (AKI), characterized by systemic inflammatory cascade (Poston and Koyner, 2019), were observed in most of the COVID-19 patients in our study (Table S1). In the renal cortex of the COVID-19 patients, we detected activation of multiple pathways involving inflammatory response, including the LPS/IL-1 mediated inhibition of RXR function, acute phase response, Toll-like receptor signaling, IL-6 signaling, and NF-κB signaling (Table S6). Of note, Toll-like receptor 2 (TLR2) and its co-receptor CD14, which were reported to recognize the pathogenic molecules and mediate host innate immune responses (Oliveira-Nascimento et al., 2012), were both upregulated in the renal cortex (Figures 6B and S7B).
The COVID-19 thyroid tissue exhibited lymphoid infiltration (Figure S1). Our data showed upregulation of stromal cell-derived factor 1 (CXCL12) (Figures 6B and S7C), which promotes chemotaxis for CXCR4-carrying lymphocytes and macrophages (Janssens et al., 2018).
Testicular injuries
Testis is one of the very few organs with immune privilege, and usually remains intact and unaffected from the host response during introduction of antigens (Zhao et al., 2014). Compared with the other organ types, the number of differentially expressed proteins in testes was small. Only ten proteins were regulated and all of them were downregulated (Figure 7 A), however, these changes suggest unusual pathological processes in the COVID-19 testis tissues. Insulin-like factor 3 (INSL3), the most abundantly expressed proteins in Leydig cells (Uhlén et al., 2015), was the most dramatically decreased protein in the COVID-19 testicular tissue (Figures 7A and 7D), suggesting impaired Leydig cell functions or a reduced Leydig cell population. Indeed, the histological examination revealed a reduction of Leydig cells (Figures 7B and 7C), consistent with our previous pathological report (Yang et al., 2020). We also found five downregulated proteins related to cholesterol biosynthesis (Figures 7A and 7D). All steroid hormones, including testosterone, are derived from cholesterol. E3 ubiquitin-protein ligase (RNF216) is essential for spermatogenesis and male fertility (Melnick et al., 2019). The dynein regulatory complex subunit 7 (DRC7) is a sperm motility factor and its deletion leads to aberrant tail formation in mouse spermatozoa that phenocopies patients with multiple morphological abnormalities of the sperm flagella (MMAF) (Morohoshi et al., 2020). These two proteins were reduced in the COVID-19 patients (Figures 7A and 7D), suggesting impairment of spermatogenesis and sperm motility caused by SARS-CoV-2 infection.
Figure 7.

Proteomic and histopathological characterization of COVID-19 testes and dysregulated proteins in the COVID-19 patients with CHD
(A) The heatmap of ten dysregulated proteins between COVID-19 and control testes. Pairwise comparison of each protein between COVID-19 and non-COVID-19 groups was performed with Student’s t test. B-H adjusted p value: ∗p < 0.05; ∗∗p < 0.01.
(B) The H&E staining of testis from a non-COVID-19 patient. Seminiferous tubules at high power (×200) showed normal spermatogenesis. Clusters of Leydig cells were seen in the interstitium (a).
(C) The H&E staining of testis from a COVID-19 patient. In the COVID-19 testes, seminiferous tubules at high power (×200) showed decreased number of Leydig cells in the interstitium (a) and sparse intratubular cells with swollen and vacuolated Sertoli cells (b).
(D) Diagram of the pathology in the COVID-19 testis with seven dysregulated proteins. The green boxes with black text font inside show the downregulated proteins. The downregulation pathway is in the green box with white text font.
(E) The top enriched pathways by upregulated proteins in the lung of COVID-19 patients with CHD.
(F) Dysregulated proteins in RIG-I signaling pathway in the lung. The y axis stands for the protein expression ratio by TMT-based quantitative proteomics. Pairwise comparison of each protein among the non-COVID-19, COVID-19 patients with CHD, and without CHD groups was performed using Student’s t test. The cutoff of dysregulated proteins has been set at B-H adjusted p value <0.05 and |log2(FC)| > log2(1.2). ∗p < 0.05; ∗∗p < 0.01; ∗∗∗p < 0.001.
See also Table S6.
Effect of coronary heart disease on SARS-CoV-2 infection
Coronary heart disease (CHD) has been reported as a high-risk factor for the COVID-19 associated mortality (Guan et al., 2020). We then compared the lung proteomes of COVID-19 patients with and without CHD, and identified 77 upregulated proteins and 309 downregulated ones (Table S4). The upregulated proteins are enriched in pathways including retinoic acid-inducible gene I (RIG-I) signaling pathway and ribosome biogenesis and its assembly (Figure 7E). Multiple proteins involved in the RIG-I signaling pathway were upregulated, including probable ATP-dependent RNA helicase (DHX58), pumilio homolog 1 (PUM1), LSM14 homolog A (LSM14A), SLP adaptor, and CSK-interacting membrane protein (SCIMP) in the CHD group (Figure 7F). Interestingly, none of these proteins were significantly regulated in the lung of COVID-19 patients without CHD compared with the non-COVID-19 patients (Figure 7F), suggesting that these changes might be CHD-specific in the COVID-19 patients. Both RIG-I-like receptor (RLR) and LSM14A belong to the PRR family, serving as sentinels for viral RNAs invasion and inducing the production of antiviral and proinflammatory cytokines, exerting both antiviral and tissue-damaging effects (Lee et al., 2019a; Li et al., 2012). On virus entry, the RLR family member protein DHX58 promotes the recognition of dsRNA by RLRs and enhances the production of IFN-beta and other antiviral genes including itself. Accumulation of DHX58 will then inhibit RLR signaling, which forms a negative feedback (Rehwinkel and Gack, 2020). The elevation of PUM1, a suppressor of DHX58, further exposes elegant modulation of the RIG-I pathway in the CHD patients (Liu et al., 2017). LSM14A has been reported to recognize the viral RNA and promote the expression of IFN-beta (Li et al., 2012). SCIMP is a transmembrane adaptor of TLR4, which triggers the production of proinflammatory cytokines, such as IL-6, in the macrophage (Luo et al., 2017). The upregulation of SCIMP and LSM14A suggests enhanced host defense and hyperinflammation in the lung of COVID-19 patients with CHD.
Limitations of study
This study is limited by the sample size. Due to the relatively small number of patients, the analyses of comorbidities await further investigation in larger independent cohorts. Despite the range of age between the COVID-19 patients and control individuals not being fully balanced, we did not find substantial proteomic difference between elder and younger patient groups (Table S4). Although the non-COVID-19 tissue samples are from surgeries of individuals with certain diseases (Table S1), they were histologically healthy as examined by two independent senior pathologists (Figure S1). In addition, future in-depth investigation of the perturbed pathways and the nominated therapeutics is needed.
Conclusions
In summary, we have quantified 11,394 proteins in seven types of organs from patients that died from COVID-19 and identified 5,336 significantly dysregulated proteins compared to non-COVID-19 patients. This proteomic atlas uncovered multiple biological and pathological processes regulated in COVID-19, which include, but not limited to, immune response, protein translation, coagulation disorder, angiogenesis, and profibrotic process. Crosstalk among multiple organs further linked the aforementioned processes by the hyperinflammatory environment with tissue hypoxia after SARS-CoV-2 infection. This systematic proteomic investigation provides a rich resource for improving our understanding of the molecular pathogenesis of SARS-CoV-2 infection and offers clues for therapeutics.
STAR★Methods
Key Resources Table
| REAGENT or RESOURCE | SOURCE | IDENTIFIER |
|---|---|---|
| Biological samples | ||
| Autopsy samples from 19 COVID-19 patients and 57 non-COVID-19 patients | Wuhan Union Hospital | This paper (Table S1) |
| Chemicals, peptides, and recombinant proteins | ||
| Triethylammonium bicarbonate buffer (TEAB) | Sigma-Aldrich | Cat # T7408 |
| Heptane | Sigma-Aldrich | Cat # 246654-2L |
| Hydroxylamine | Thermo Scientific | Cat # 90115 |
| Tris Base | Promega | Cat # H5133 |
| Urea | Sigma-Aldrich | Cat # U1250 |
| Thiourea | Sigma-Aldrich | Cat # T8656-500G |
| Tris (2-carboxyethyl) phosphine (TCEP) | Adamas-beta | Cat # 61820E |
| Iodoacetamide (IAA) | Sigma-Aldrich | Cat # I6125 |
| Trypsin | Hualishi Tech | Cat # HLS TRY001C |
| Trifluoroacetic acid (TFA) | Thermo Fisher Scientific | Cat # 85183 |
| Water | Thermo Fisher Scientific | Cat # W6-4 |
| Acetonitrile | Thermo Fisher Scientific | Cat # A955-4 |
| Formic acid (FA) | Thermo Fisher Scientific | Cat # A117-50 |
| Ammonium hydroxide solution | Sigma-Aldrich | Cat # 221228 |
| Methanol | Sigma-Aldrich | Cat # 34860 |
| Critical commercial assays | ||
| TMTpro 16plex reagents | Thermo Fisher Scientific | Cat # A44520 |
| Novel Coronavirus (2019-nCoV) Real Time Multiplex RT-PCR Kit | Shanghai Liferiver Biotechnology | Cat # Z-RR-0479-02-50 |
| FFPE RNA extraction kit | Amoy Diagnostics | Cat # ADx-FF04 |
| CD3 | DAKO | Cat # A0452; RRID:AB_2335677 |
| CD4 | DAKO | Cat # M7310; RRID:AB_2728838 |
| CD8 | DAKO | Cat # M7103; RRID:AB_2075537 |
| CD20 | ROCHE | Cat # 760-2531; RRID:AB_2335956 |
| CD68 | DAKO | Cat # M0876; RRID:AB_2074844 |
| CD163 | Cell Marque | Cat # 163M-16; RRID:AB_1159122 |
| Deposited data | ||
| Mass spectrometry data | This paper | https://www.iprox.org/ (IPX0002393000) |
| Software and algorithms | ||
| Xcalibur | Thermo Fisher Scientific | Cat # OPTON-30965 |
| Proteome Discoverer Version 2.4.1.15 | Thermo Fisher Scientific | https://www.thermofisher.com/us/en/home/industrial/mass-spectrometry/liquid-chromatography-mass-spectrometry-lc-ms/lc-ms-software/multi-omics-data-analysis/proteome-discoverer-software.html |
| R version 3.6.1 | R Project | https://www.r-project.org |
| Ingenuine pathway analysis (version 51963813) | Krämer et al., 2014 | https://www.qiagen.com/cn/ |
| Metascape | Zhou et al., 2019 | https://metascape.org/gp/index.html#/main/step1 |
| ClueGO 2.5.6 | (Bindea et al., 2009) | https://cytoscape.org/ |
| String | Szklarczyk et al., 2019 | https://string-db.org/ |
| Other | ||
| SOLAμ | Thermo Fisher Scientific | Cat # 62209-001 |
Resource availability
Lead contact
Further information should be directed to and will be fulfilled by the Lead Contact Tiannan Guo (guotiannan@westlake.edu.cn).
Materials availability
This study did not generate new unique reagents.
Data and code availability
All data are available in the manuscript or the supplementary material. The accession number for the proteomics data reported in this paper is iProX: IPX0002393000.
Experimental model and subject details
Clinical specimens and histological analysis
This study was approved by the Medical Ethics Committee of Union Hospital affiliated to Tongji Medical College of Huazhong University of Science and Technology (No.2020-0043-1) and Medical Ethical Committee of Westlake University (No.20200329GTN001).
All COVID-19 patients were diagnosed as COVID-19 according to the Diagnosis and Treatment Protocol for Novel Coronavirus Pneumonia (Trial 7th version) released by the National Health Commission & State Administration of Traditional Chinese Medicine on March 3, 2020 (National Health Commission, 2020). All the cases were from Wuhan city and admitted to Union Hospital, Tongji Medical College, Huazhong University of Science and Technology, according to their respiratory symptoms, chest imaging and SARS-CoV-2 nucleic acid test of oropharyngeal swabs. With the consent by the families of the late COVID-19 patients, ultrasound-guided percutaneous multi-point postmortem core biopsies were performed within two hours after death in a negative pressure isolation ward, from February to April 2020. Ultrasound examination was performed using an ultrasound scanner (Mindray M9, Shenzhen Mindray Bio-Medical Electronics Co., Ltd, Guangdong, China) equipped with a C5-1s/SP5-1s/L12-4s probe. All autopsies were performed using the large core (14-guage) needle by the multitask team consisting of pathologists, thoracic surgeons, and ultrasound doctors. Procured tissues were preserved in the 10% neutral formalin immediately after the procedure and fixed for over 24 hours, and then routinely processed for paraffin blocks. Histological slices were prepared using a microtome and stained with hematoxylin and eosin (H&E) as described previously (Su et al., 2020). Immunohistochemical stains (IHC) were performed for CD3 (Dako, Copenhagen, Denmark), CD4 (Dako), CD8 (Dako), CD20 (Roche, Tucson, AZ, USA), CD68 (Dako) and CD163 (Cell Marque, California, USA) according to the manufacturers’ protocols on a Dako Link 48 automated stainer (for CD3, CD4, CD8, CD68 and CD163) or a Roche Benchmark XT Ultra system (for CD20). All slides were examined by at least two senior pathologists independently. A total of 144 microscopy-guided dissection samples were analyzed from 73 specimens, including heart (9 specimens), lung (15 specimens), liver (10 specimens), kidney (10 specimens), spleen (9 specimens), testis (5 specimens), and thyroid (15 specimens), as shown in Tables S1 and S2.
We also collected 74 control samples from archived blocks of 56 non-COVID-19 patients (Tables S1 and S2). Control samples in our study were selected from patients who had undergone surgery in the Union Hospital, Tongji Medical College, Huazhong University of Science and Technology from November 2019 to March 2020. All control samples are histologically healthy tissue samples from the non-COVID-19 patients who were mostly victims of injuries. In case of lack of injured patients, benign lesions from cancer patients were procured. We only selected the tissue samples without bleeding, degeneration or any other pathological lesions. The appropriateness of these control samples has been confirmed by at least two senior pathologists independently, and their representative microscopic pictures are shown in Figure S1. More details of the patients including age, gender and other potential confounding clinical characteristics are provided in Tables S1 and S5.
Method details
Proteomics data acquisition
Around 1~1.5 mg FFPE tissue samples were processed to generate peptide samples using accelerated Pressure Cycling Technology (PCT) assisted sample preparation method as described previously (Gao et al., 2020; Zhu et al., 2019). Briefly, the samples were dewaxed by heptane and rehydrated by ethanol solution of different concentrations; then undergone acidic hydrolysis by 0.1% formic acid, and basic hydrolysis by 0.1 M Tris-HCl (pH 10.0); followed by lysis with 6 M urea/2M thiourea (Sigma) buffer, reduction by Tris(2 carboxyethyl)phosphine (TCEP, Sigma) and alkylation by iodoacetamide (IAA, Sigma) in PCT. Then the lysates were digested using PCT by a mix of Lys-C and trypsin (Hualishi Tech. Ltd, Beijing, China) and the digestion was quenched by trifluoroacetic acid. After C18 cleaning, 7 μg of peptides from each of the 218 tissue samples, and 37 technical replicates, 34 pooling samples including common pooled samples and tissue specific pooled samples (Table S2) were taken for the following TMTpro 16plex labeling based proteomics analysis. The common pooled samples were prepared by mixing equal amount of peptides from six different human organs including testis, lung, kidney, spleen, heart and liver. The tissue specific pooled samples were prepared by mixing equal amount of peptides from all samples of a specific organ. And then all these peptide samples were labeled with TMTpro 16plex reagent (Thermo Fisher Scientific, San Jose, USA) (Li et al., 2020). After quenching the labeling reaction by hydroxylamine, 16 TMT-labeled peptide samples were combined and cleaned by C18 columns (Waters, Sep-Pak Vac C18 1 cc, 50 mg). Fractionation was performed on Thermo Ultimate Dinex 3000 (Thermo Fisher Scientific, San Jose, USA) with an XBridge Peptide BEH C18 column (300Å, 5 μm × 4.6 mm × 250 mm) (Waters, Milford, MA, USA). The sample was separated using a 60 min LC gradient from 5% to 35% acetonitrile (ACN) in 10 mM ammonia (pH = 10.0) at a flow rate of 1 mL/min to 60 fractions. The fractions were combined using the following strategy: 1) combine the 1st to 12th, 59th and 60th fractions; 2) combine the 13rd, 20th and 52nd fractions; 3) combine the 14th, 19th 54th and 55th fractions; 4) combine the 15th, 18th and 58th fractions; 5) combine the 16th, 22nd and 53rd fractions; 6) combine the 17th, 21st, 56th and 57th fractions; 7) combine the 23rd and 50th fractions; 8) combine the 24th and 48th fractions; 9) combine the 25th and 47th fractions; 10) combine the 26th and 49th fractions; 11) combine the 27th and 51st fractions; 12) no combination for 28th to 46th fractions. Together, we got 30 combinations of fractions and dried them in vacuum. Dried peptides were re-dissolved in 2% ACN/0.1% formic acid and then analyzed by a Q Exactive HF-X hybrid Quadrupole-Orbitrap or a Q Exactive HF hybrid Quadrupole-Orbitrap with the same LC-MS/MS settings as described previously (Shen et al., 2020). The MS raw data were analyzed by Proteome Discoverer (Version 2.4.1.15, Thermo Fisher Scientific) using a combination of the FASTA file of 20,365 reviewed Homo sapiens proteins downloaded from UniProt website on 14 April, 2020 and the SARS-CoV-2 virus FASTA file of 10 SARS-CoV-2 proteins downloaded from NCBI (version MN908947.3). Precursor ion mass tolerance was set to 10 ppm, and product ion mass tolerance was set to 0.02 Da. Other parameters in Proteome Discoverer analysis are identical to our previous study (Shen et al., 2020). The grouped abundance ratio of tissue samples to the pooled sample in the same batch was selected as the value of proteins in the protein matrix for the statistical analysis. As for the lung, spleen, liver, heart, kidney and testis samples, the pooled sample for ratio calculation was chosen as the common pooled sample in the corresponding batch. As for the thyroid samples, the pooled sample for ratio calculation was chosen as the tissue specific pooled sample in the corresponding batch.
Quality control of proteomics data
The quality control (QC) of proteomics data was similar as described in Shen et al. (2020). We performed QC in the following levels: i) as to the batch design, one plex of TMTpro 16plex was set as a pooled sample for batch alignment and quantitative accuracy (as calculated in the grouped abundance ratio); ii) during the MS acquisition, we analyzed mouse liver protein digests for MS instrument performance evaluation every two batches, and analyzed MS buffer A (2% ACN/0.1% formic acid) as blanks every six LC-MS/MS injections; iii) we randomly distributed the peptide samples from every organ of the COVID-19 patients and the non-COVID-19 patients into each batch; iv) for data analysis, we calculated the median coefficient of variation (CV) of the proteomics data. As for the pooled controls, we calculated the CV by the log2(abundance) of quantified proteins in the pooled controls of each organ (Figure S3B). The pooled samples for CV calculation were the same as the ones for grouped ratio calculation. As for the technical replicates, we calculated the CV by expression ratio of quantified proteins in the technical replicates of each sample (Figure S3C). Besides, unsupervised clustering for the proteomics data were performed, including heatmap and t-SNE (Figures S3D and S3E). After the selection of differentially expressed proteins (adjusted p value by B-H correction < 0.05 and |log2(FC)| > log2(1.2)), the heatmap of each organ by the dysregulated proteins was performed and the few samples that could not be grouped correctly were excluded for further statistical analysis, probably due to uncharacterized pre-analytical reasons.
Statistical analysis
Log2 fold-change (FC) was calculated by the mean of proteins expression ratio in a specific organ between COVID-19 and non-COVID-19 groups. Student’s t test was performed for each pair of groups to be compared. Adjusted p values were calculated using B-H correction. The criteria for significantly dysregulated proteins selection was that the adjusted p value should be less than 0.05 and |log2(FC)| should be larger than log2(1.2). Statistical analysis was performed using R (version 3.6.3).
Pathway/network analysis
The pathway enrichment was analyzed by either IPA (Krämer et al., 2014) (with p value < 0.05, Z score > 0 or < 0), or Metascape web-based platform (Zhou et al., 2019) (with p value < 0.05), or string web-based platform (Szklarczyk et al., 2019). The immunological proteins were mapped against GSEA-immunologic gene sets in Metascape platform with our differentially expressed proteins and then the enriched pathways were distinguished by IPA analysis.
Acknowledgments
We thank Drs. D.S. Li and O.L. Kon and the Guomics team for helpful comments to this study, Westlake University Supercomputer Center for assistance in data generation and storage, and the Mass Spectrometry & Metabolomics Core Facility at the Center for Biomedical Research Core Facilities of Westlake University for sample analysis. This work is supported by grants from the National Key R&D Program of China (2020YFE0202200), the National Natural Science Foundation of China (81972492, 21904107, 81672086, 81773022, and 82072333), Zhejiang Provincial Natural Science Foundation for Distinguished Young Scholars (LR19C050001), the Key Special Project of Ministry of Science and Technology, China (2020YFC0845700), the Fundamental Research Funds for the Central Universities (2020kfyXGYJ101), Hangzhou Agriculture and Society Advancement Program (20190101A04), Westlake Education Foundation, and Tencent Foundation (2020).
Author contributions
T.G., X.N., Y.Z., Y.H., and J.X. designed and supervised the project. X.N., B.H., and X.D. summarized the pathological changes and SARS-COV-2 test. L.Q., R.S., Q.X., Q.Z., T.L., L.Y., Y.S., L.L., W.G., W.L., H.C., X.Y., M. Lyu., S.L., X.D., C.Y., L.X., J.H., M. Luo., X. Cai., H.G., J.Y., Z.X., and G.R. conducted proteomic analysis. X.L., J.Z., and S.W. collected the autopsies. X.L., J.Z., J.F., X.C., and D.Z. organized the clinical data. H.M., H.S., and M.X. participated in clinicopathological analysis. S.C., M.Y., L.P., G.X., X.X., J.W., and H.P. performed H&E and IHC analysis. D.L., B.H., and Y.L. (Union Hospital) performed SARS-CoV-2 detection for lungs and analyzed the relevant data. L.Q., R.S., Q.X., T.L., L.Y., X.N., Y.Z., and T.G. interpreted the data with inputs from all co-authors. L.Q., R.S., Q.X., T.L., L.Y., Y.Z., and T.G. wrote the manuscript with inputs from co-authors.
Declaration of interests
T.G. is a shareholder of Westlake Omics Inc. Q.Z., W.G., and H.C. are employees of Westlake Omics Inc. The remaining authors declare no competing interests.
Published: January 9, 2021
Footnotes
Supplemental Information can be found online at https://doi.org/10.1016/j.cell.2021.01.004.
Supplemental information
A. Clinical information of the COVID-19 patients. Baseline characteristics (age, gender, BMI, smoking history, preexisting medical conditions), course of disease (days), treatment, clinical cause of death, main pathologic findings, SARS-CoV-2 nucleic acid in lung samples, sepsis and results of lower extremity vascular ultrasound examination are listed. B. Clinical information of the non-COVID-19 patients. Baseline characteristics include age, gender, preexisting medical conditions. C. The effects of gender, smoking history and comorbidities on proteome landscape of the COVID-19 patients analyzed by Fisher’s exact test. D. Medication regimen for the COVID-19 patients during COVID-19 hospitalization. L, medication by long-term medical orders; S, medication by temporary medical orders.
A. Sample information of the COVID-19 patients. B. Sample information of the non-COVID-19 patients. The corresponding relation among samples, patients and sample subtypes. There are two types of Sample ID from clinic and MS batch design. Subtype is from anatomical structure. L_R means the sample from left side or right side. C. Batch design. A total of 255 samples containing 144 samples from the COVID-19 patients, 74 samples from the non-COVID-19 patients and 37 technique replicates were designed into 18 batches. Technical replicates are marked in green. 18 pooled samples for ratio calculation are marked in orange. Five samples excluded during quality control are marked in gray.
11,394 proteins have been quantified with a false discovery rate (FDR) less than 1% across 540 raw MS/MS data.
A. Differentially expressed proteins between the COVID-19 and non-COVID-19 groups across seven organs. 5,336 proteins have been shortlisted with |log2(FC)| greater than log2(1.2) and B-H adjusted p value less than 0.05. B. Differentially expressed proteins between MODS and Non-MODS groups of the COVID-19 patients across seven organs. 736 proteins have been shortlisted with |log2(FC)| greater than log2(1.2) and B-H adjusted p value less than 0.05. C. Differentially expressed proteins between samples from the COVID-19 patients with HT and Non-HT across seven organs. 144 proteins have been filtered with |log2(FC)| greater than log2(1.2) and B-H adjusted p value less than 0.05. D. Differentially expressed proteins between samples from the COVID-19 patients with CHD and Non-CHD across seven organs. 990 proteins have been shortlisted with |log2(FC)| greater than log2(1.2) and B-H adjusted p value less than 0.05. E. Differentially expressed proteins between samples from older and younger COVID-19 patients across five organs. 697 proteins have been shortlisted with |log2(FC)| greater than log2(1.2) and B-H adjusted p value less than 0.05.
. Proteins have been shortlisted with |log2(FC)| greater than log2(1.2) and B-H adjusted p value less than 0.05. Same trend of transcription factors means same change trend in the experimental fold-change and the predicted activation state by IPA. Y, Yes; N, No; NA, Not belonging to transcription factors. B. Data corresponding to Figure S2. Laboratory findings for the COVID-19 patients. C. Data corresponding to Figure S5. Fibrosis associated proteins dysregulated between the COVID-19 patients and non-COVID-19 groups. The sheet only shows the log2(FC) of significantly dysregulated proteins in the specific organ type.
A-G. The enriched pathways performed by IPA with dysregulated proteins in corresponding organs. H. Pathway analysis of 375 upregulated proteins and 204 downregulated proteins in the liver of MODS group by Metascape. I-K. The enriched pathways performed by IPA with the immunological proteins from GSEA-immunologic gene sets in corresponding organs.
References
- Ackermann M., Verleden S.E., Kuehnel M., Haverich A., Welte T., Laenger F., Vanstapel A., Werlein C., Stark H., Tzankov A., et al. Pulmonary Vascular Endothelialitis, Thrombosis, and Angiogenesis in Covid-19. N. Engl. J. Med. 2020;383:120–128. doi: 10.1056/NEJMoa2015432. [DOI] [PMC free article] [PubMed] [Google Scholar]
- Adams J.C., Lawler J. The thrombospondins. Cold Spring Harb. Perspect. Biol. 2011;3:a009712. doi: 10.1101/cshperspect.a009712. [DOI] [PMC free article] [PubMed] [Google Scholar]
- Alonzi T., Maritano D., Gorgoni B., Rizzuto G., Libert C., Poli V. Essential role of STAT3 in the control of the acute-phase response as revealed by inducible gene inactivation [correction of activation] in the liver. Mol. Cell. Biol. 2001;21:1621–1632. doi: 10.1128/MCB.21.5.1621-1632.2001. [DOI] [PMC free article] [PubMed] [Google Scholar]
- Babeu J.P., Boudreau F. Hepatocyte nuclear factor 4-alpha involvement in liver and intestinal inflammatory networks. World J. Gastroenterol. 2014;20:22–30. doi: 10.3748/wjg.v20.i1.22. [DOI] [PMC free article] [PubMed] [Google Scholar]
- Bao L., Deng W., Huang B., Gao H., Liu J., Ren L., Wei Q., Yu P., Xu Y., Qi F., et al. The pathogenicity of SARS-CoV-2 in hACE2 transgenic mice. Nature. 2020;583:830–833. doi: 10.1038/s41586-020-2312-y. [DOI] [PubMed] [Google Scholar]
- Baschant U., Tuckermann J. The role of the glucocorticoid receptor in inflammation and immunity. J. Steroid Biochem. Mol. Biol. 2010;120:69–75. doi: 10.1016/j.jsbmb.2010.03.058. [DOI] [PubMed] [Google Scholar]
- Bian X.-W. Autopsy of COVID-19 victims in China. Natl. Sci. Rev. 2020;7:1414–1418. doi: 10.1093/nsr/nwaa123. [DOI] [PMC free article] [PubMed] [Google Scholar]
- Bindea G., Mlecnik B., Hackl H., Charoentong P., Tosolini M., Kirilovsky A., Fridman W.-H., Pagès F., Trajanoski Z., Galon J. ClueGO: a Cytoscape plug-in to decipher functionally grouped gene ontology and pathway annotation networks. Bioinformatics. 2009;25:1091–1093. doi: 10.1093/bioinformatics/btp101. [DOI] [PMC free article] [PubMed] [Google Scholar]
- Bittmann S., Weissenstein A., Villalon G., Moschuring-Alieva E., Luchter E. Simultaneous Treatment of COVID-19 With Serine Protease Inhibitor Camostat and/or Cathepsin L Inhibitor? J. Clin. Med. Res. 2020;12:320–322. doi: 10.14740/jocmr4161. [DOI] [PMC free article] [PubMed] [Google Scholar]
- Bojkova D., Klann K., Koch B., Widera M., Krause D., Ciesek S., Cinatl J., Münch C. Proteomics of SARS-CoV-2-infected host cells reveals therapy targets. Nature. 2020;583:469–472. doi: 10.1038/s41586-020-2332-7. [DOI] [PMC free article] [PubMed] [Google Scholar]
- Bornstein P. Thrombospondins as matricellular modulators of cell function. J. Clin. Invest. 2001;107:929–934. doi: 10.1172/JCI12749. [DOI] [PMC free article] [PubMed] [Google Scholar]
- Bouhaddou M., Memon D., Meyer B., White K.M., Rezelj V.V., Correa Marrero M., Polacco B.J., Melnyk J.E., Ulferts S., Kaake R.M., et al. The Global Phosphorylation Landscape of SARS-CoV-2 Infection. Cell. 2020;182:685–712.e19. doi: 10.1016/j.cell.2020.06.034. [DOI] [PMC free article] [PubMed] [Google Scholar]
- Cairo S., Buendia M.A. How transient becomes stable: an epigenetic switch linking liver inflammation and tumorigenesis. J. Hepatol. 2012;57:910–912. doi: 10.1016/j.jhep.2012.05.017. [DOI] [PubMed] [Google Scholar]
- Carsana L., Sonzogni A., Nasr A., Rossi R.S., Pellegrinelli A., Zerbi P., Rech R., Colombo R., Antinori S., Corbellino M., et al. Pulmonary post-mortem findings in a series of COVID-19 cases from northern Italy: a two-centre descriptive study. Lancet Infect. Dis. 2020;20:1135–1140. doi: 10.1016/S1473-3099(20)30434-5. [DOI] [PMC free article] [PubMed] [Google Scholar]
- Cencic R., Desforges M., Hall D.R., Kozakov D., Du Y., Min J., Dingledine R., Fu H., Vajda S., Talbot P.J., Pelletier J. Blocking eIF4E-eIF4G interaction as a strategy to impair coronavirus replication. J. Virol. 2011;85:6381–6389. doi: 10.1128/JVI.00078-11. [DOI] [PMC free article] [PubMed] [Google Scholar]
- Chan V.S., Chan K.Y., Chen Y., Poon L.L., Cheung A.N., Zheng B., Chan K.H., Mak W., Ngan H.Y., Xu X., et al. Homozygous L-SIGN (CLEC4M) plays a protective role in SARS coronavirus infection. Nat. Genet. 2006;38:38–46. doi: 10.1038/ng1698. [DOI] [PMC free article] [PubMed] [Google Scholar]
- Chandrashekar A., Liu J., Martinot A.J., McMahan K., Mercado N.B., Peter L., Tostanoski L.H., Yu J., Maliga Z., Nekorchuk M., et al. SARS-CoV-2 infection protects against rechallenge in rhesus macaques. Science. 2020;369:812–817. doi: 10.1126/science.abc4776. [DOI] [PMC free article] [PubMed] [Google Scholar]
- Chapin J.C., Hajjar K.A. Fibrinolysis and the control of blood coagulation. Blood Rev. 2015;29:17–24. doi: 10.1016/j.blre.2014.09.003. [DOI] [PMC free article] [PubMed] [Google Scholar]
- Côté M., Misasi J., Ren T., Bruchez A., Lee K., Filone C.M., Hensley L., Li Q., Ory D., Chandran K., Cunningham J. Small molecule inhibitors reveal Niemann-Pick C1 is essential for Ebola virus infection. Nature. 2011;477:344–348. doi: 10.1038/nature10380. [DOI] [PMC free article] [PubMed] [Google Scholar]
- Deng W., Bao L., Liu J., Xiao C., Liu J., Xue J., Lv Q., Qi F., Gao H., Yu P., et al. Primary exposure to SARS-CoV-2 protects against reinfection in rhesus macaques. Science. 2020;369:818–823. doi: 10.1126/science.abc5343. [DOI] [PMC free article] [PubMed] [Google Scholar]
- Dyson N.J. RB1: a prototype tumor suppressor and an enigma. Genes Dev. 2016;30:1492–1502. doi: 10.1101/gad.282145.116. [DOI] [PMC free article] [PubMed] [Google Scholar]
- Eltzschig H.K., Carmeliet P. Hypoxia and inflammation. N. Engl. J. Med. 2011;364:656–665. doi: 10.1056/NEJMra0910283. [DOI] [PMC free article] [PubMed] [Google Scholar]
- Etzerodt A., Moestrup S.K. CD163 and inflammation: biological, diagnostic, and therapeutic aspects. Antioxid. Redox Signal. 2013;18:2352–2363. doi: 10.1089/ars.2012.4834. [DOI] [PMC free article] [PubMed] [Google Scholar]
- Fox C., Cocchiaro P., Oakley F., Howarth R., Callaghan K., Leslie J., Luli S., Wood K.M., Genovese F., Sheerin N.S., Moles A. Inhibition of lysosomal protease cathepsin D reduces renal fibrosis in murine chronic kidney disease. Sci. Rep. 2016;6:20101. doi: 10.1038/srep20101. [DOI] [PMC free article] [PubMed] [Google Scholar]
- Gao H., Zhang F., Liang S., Zhang Q., Lyu M., Qian L., Liu W., Ge W., Chen C., Yi X., et al. Accelerated Lysis and Proteolytic Digestion of Biopsy-Level Fresh-Frozen and FFPE Tissue Samples Using Pressure Cycling Technology. J. Proteome Res. 2020;19:1982–1990. doi: 10.1021/acs.jproteome.9b00790. [DOI] [PubMed] [Google Scholar]
- Garten A., Schuster S., Penke M., Gorski T., de Giorgis T., Kiess W. Physiological and pathophysiological roles of NAMPT and NAD metabolism. Nat. Rev. Endocrinol. 2015;11:535–546. doi: 10.1038/nrendo.2015.117. [DOI] [PubMed] [Google Scholar]
- Ghosh A.K., Vaughan D.E. PAI-1 in tissue fibrosis. J. Cell. Physiol. 2012;227:493–507. doi: 10.1002/jcp.22783. [DOI] [PMC free article] [PubMed] [Google Scholar]
- Göbel K., Eichler S., Wiendl H., Chavakis T., Kleinschnitz C., Meuth S.G. The Coagulation Factors Fibrinogen, Thrombin, and Factor XII in Inflammatory Disorders-A Systematic Review. Front. Immunol. 2018;9:1731. doi: 10.3389/fimmu.2018.01731. [DOI] [PMC free article] [PubMed] [Google Scholar]
- Gordon D.E., Jang G.M., Bouhaddou M., Xu J., Obernier K., White K.M., O’Meara M.J., Rezelj V.V., Guo J.Z., Swaney D.L., et al. A SARS-CoV-2 protein interaction map reveals targets for drug repurposing. Nature. 2020;583:459–468. doi: 10.1038/s41586-020-2286-9. [DOI] [PMC free article] [PubMed] [Google Scholar]
- Gray-Owen S.D., Blumberg R.S. CEACAM1: contact-dependent control of immunity. Nat. Rev. Immunol. 2006;6:433–446. doi: 10.1038/nri1864. [DOI] [PubMed] [Google Scholar]
- Greenbaum L.E., Li W., Cressman D.E., Peng Y., Ciliberto G., Poli V., Taub R. CCAAT enhancer- binding protein beta is required for normal hepatocyte proliferation in mice after partial hepatectomy. J. Clin. Invest. 1998;102:996–1007. doi: 10.1172/JCI3135. [DOI] [PMC free article] [PubMed] [Google Scholar]
- Guan W.J., Liang W.H., Zhao Y., Liang H.R., Chen Z.S., Li Y.M., Liu X.Q., Chen R.C., Tang C.L., Wang T., et al. China Medical Treatment Expert Group for COVID-19 Comorbidity and its impact on 1590 patients with COVID-19 in China: a nationwide analysis. Eur. Respir. J. 2020;55:2000547. doi: 10.1183/13993003.00547-2020. [DOI] [PMC free article] [PubMed] [Google Scholar]
- Hassan A.O., Case J.B., Winkler E.S., Thackray L.B., Kafai N.M., Bailey A.L., McCune B.T., Fox J.M., Chen R.E., Alsoussi W.B., et al. A SARS-CoV-2 Infection Model in Mice Demonstrates Protection by Neutralizing Antibodies. Cell. 2020;182:744–753.e4. doi: 10.1016/j.cell.2020.06.011. [DOI] [PMC free article] [PubMed] [Google Scholar]
- Hayhurst G.P., Lee Y.H., Lambert G., Ward J.M., Gonzalez F.J. Hepatocyte nuclear factor 4alpha (nuclear receptor 2A1) is essential for maintenance of hepatic gene expression and lipid homeostasis. Mol. Cell. Biol. 2001;21:1393–1403. doi: 10.1128/MCB.21.4.1393-1403.2001. [DOI] [PMC free article] [PubMed] [Google Scholar]
- He L., Vicente C.P., Westrick R.J., Eitzman D.T., Tollefsen D.M. Heparin cofactor II inhibits arterial thrombosis after endothelial injury. J. Clin. Invest. 2002;109:213–219. doi: 10.1172/JCI13432. [DOI] [PMC free article] [PubMed] [Google Scholar]
- Heaton N.S., Randall G. Multifaceted roles for lipids in viral infection. Trends Microbiol. 2011;19:368–375. doi: 10.1016/j.tim.2011.03.007. [DOI] [PMC free article] [PubMed] [Google Scholar]
- Hess J., Angel P., Schorpp-Kistner M. AP-1 subunits: quarrel and harmony among siblings. J. Cell Sci. 2004;117:5965–5973. doi: 10.1242/jcs.01589. [DOI] [PubMed] [Google Scholar]
- Hilgendorf K.I., Leshchiner E.S., Nedelcu S., Maynard M.A., Calo E., Ianari A., Walensky L.D., Lees J.A. The retinoblastoma protein induces apoptosis directly at the mitochondria. Genes Dev. 2013;27:1003–1015. doi: 10.1101/gad.211326.112. [DOI] [PMC free article] [PubMed] [Google Scholar]
- Hoffmann M., Kleine-Weber H., Schroeder S., Krüger N., Herrler T., Erichsen S., Schiergens T.S., Herrler G., Wu N.H., Nitsche A., et al. SARS-CoV-2 Cell Entry Depends on ACE2 and TMPRSS2 and Is Blocked by a Clinically Proven Protease Inhibitor. Cell. 2020;181:271–280.e8. doi: 10.1016/j.cell.2020.02.052. [DOI] [PMC free article] [PubMed] [Google Scholar]
- Hotchkiss R.S., Moldawer L.L., Opal S.M., Reinhart K., Turnbull I.R., Vincent J.L. Sepsis and septic shock. Nat. Rev. Dis. Primers. 2016;2:16045. doi: 10.1038/nrdp.2016.45. [DOI] [PMC free article] [PubMed] [Google Scholar]
- Israël A. The IKK complex, a central regulator of NF-kappaB activation. Cold Spring Harb. Perspect. Biol. 2010;2:a000158. doi: 10.1101/cshperspect.a000158. [DOI] [PMC free article] [PubMed] [Google Scholar]
- Janssens R., Struyf S., Proost P. The unique structural and functional features of CXCL12. Cell. Mol. Immunol. 2018;15:299–311. doi: 10.1038/cmi.2017.107. [DOI] [PMC free article] [PubMed] [Google Scholar]
- Jeffers S.A., Tusell S.M., Gillim-Ross L., Hemmila E.M., Achenbach J.E., Babcock G.J., Thomas W.D., Jr., Thackray L.B., Young M.D., Mason R.J., et al. CD209L (L-SIGN) is a receptor for severe acute respiratory syndrome coronavirus. Proc. Natl. Acad. Sci. USA. 2004;101:15748–15753. doi: 10.1073/pnas.0403812101. [DOI] [PMC free article] [PubMed] [Google Scholar]
- Jiang R.D., Liu M.Q., Chen Y., Shan C., Zhou Y.W., Shen X.R., Li Q., Zhang L., Zhu Y., Si H.R., et al. Pathogenesis of SARS-CoV-2 in Transgenic Mice Expressing Human Angiotensin-Converting Enzyme 2. Cell. 2020;182:50–58.e8. doi: 10.1016/j.cell.2020.05.027. [DOI] [PMC free article] [PubMed] [Google Scholar]
- Kang H.M., Ahn S.H., Choi P., Ko Y.A., Han S.H., Chinga F., Park A.S., Tao J., Sharma K., Pullman J., et al. Defective fatty acid oxidation in renal tubular epithelial cells has a key role in kidney fibrosis development. Nat. Med. 2015;21:37–46. doi: 10.1038/nm.3762. [DOI] [PMC free article] [PubMed] [Google Scholar]
- Krämer A., Green J., Pollard J., Jr., Tugendreich S. Causal analysis approaches in Ingenuity Pathway Analysis. Bioinformatics. 2014;30:523–530. doi: 10.1093/bioinformatics/btt703. [DOI] [PMC free article] [PubMed] [Google Scholar]
- Kudose S., Batal I., Santoriello D., Xu K., Barasch J., Peleg Y., Canetta P., Ratner L.E., Marasa M., Gharavi A.G., et al. Kidney Biopsy Findings in Patients with COVID-19. J. Am. Soc. Nephrol. 2020;31:1959–1968. doi: 10.1681/ASN.2020060802. [DOI] [PMC free article] [PubMed] [Google Scholar]
- Lawrence T. The nuclear factor NF-kappaB pathway in inflammation. Cold Spring Harb. Perspect. Biol. 2009;1:a001651. doi: 10.1101/cshperspect.a001651. [DOI] [PMC free article] [PubMed] [Google Scholar]
- Lee H.C., Chathuranga K., Lee J.S. Intracellular sensing of viral genomes and viral evasion. Exp. Mol. Med. 2019;51:1–13. doi: 10.1038/s12276-019-0299-y. [DOI] [PMC free article] [PubMed] [Google Scholar]
- Lee J.W., Ko J., Ju C., Eltzschig H.K. Hypoxia signaling in human diseases and therapeutic targets. Exp. Mol. Med. 2019;51:1–13. doi: 10.1038/s12276-019-0235-1. [DOI] [PMC free article] [PubMed] [Google Scholar]
- Li Y., Chen R., Zhou Q., Xu Z., Li C., Wang S., Mao A., Zhang X., He W., Shu H.B. LSm14A is a processing body-associated sensor of viral nucleic acids that initiates cellular antiviral response in the early phase of viral infection. Proc. Natl. Acad. Sci. USA. 2012;109:11770–11775. doi: 10.1073/pnas.1203405109. [DOI] [PMC free article] [PubMed] [Google Scholar]
- Li J., Van Vranken J.G., Pontano Vaites L., Schweppe D.K., Huttlin E.L., Etienne C., Nandhikonda P., Viner R., Robitaille A.M., Thompson A.H., et al. TMTpro reagents: a set of isobaric labeling mass tags enables simultaneous proteome-wide measurements across 16 samples. Nat. Methods. 2020;17:399–404. doi: 10.1038/s41592-020-0781-4. [DOI] [PMC free article] [PubMed] [Google Scholar]
- Lin H., Cao X. Nuclear innate sensors for nucleic acids in immunity and inflammation. Immunol. Rev. 2020;297:162–173. doi: 10.1111/imr.12893. [DOI] [PubMed] [Google Scholar]
- Liu Y., Qu L., Liu Y., Roizman B., Zhou G.G. PUM1 is a biphasic negative regulator of innate immunity genes by suppressing LGP2. Proc. Natl. Acad. Sci. USA. 2017;114:E6902–E6911. doi: 10.1073/pnas.1708713114. [DOI] [PMC free article] [PubMed] [Google Scholar]
- Liu P.P., Blet A., Smyth D., Li H. The Science Underlying COVID-19: Implications for the Cardiovascular System. Circulation. 2020;142:68–78. doi: 10.1161/CIRCULATIONAHA.120.047549. [DOI] [PubMed] [Google Scholar]
- Liu T., Luo S., Libby P., Shi G.P. Cathepsin L-selective inhibitors: A potentially promising treatment for COVID-19 patients. Pharmacol. Ther. 2020;213:107587. doi: 10.1016/j.pharmthera.2020.107587. [DOI] [PMC free article] [PubMed] [Google Scholar]
- Lobo S.M., Lobo F.R., Bota D.P., Lopes-Ferreira F., Soliman H.M., Mélot C., Vincent J.L. C-reactive protein levels correlate with mortality and organ failure in critically ill patients. Chest. 2003;123:2043–2049. doi: 10.1378/chest.123.6.2043. [DOI] [PubMed] [Google Scholar]
- Luo L., Bokil N.J., Wall A.A., Kapetanovic R., Lansdaal N.M., Marceline F., Burgess B.J., Tong S.J., Guo Z., Alexandrov K., et al. SCIMP is a transmembrane non-TIR TLR adaptor that promotes proinflammatory cytokine production from macrophages. Nat. Commun. 2017;8:14133. doi: 10.1038/ncomms14133. [DOI] [PMC free article] [PubMed] [Google Scholar]
- Manchanda M., Das P., Gahlot G.P.S., Singh R., Roeb E., Roderfeld M., Datta Gupta S., Saraya A., Pandey R.M., Chauhan S.S. Cathepsin L and B as Potential Markers for Liver Fibrosis: Insights From Patients and Experimental Models. Clin. Transl. Gastroenterol. 2017;8:e99. doi: 10.1038/ctg.2017.25. [DOI] [PMC free article] [PubMed] [Google Scholar]
- Mazumder B., Poddar D., Basu A., Kour R., Verbovetskaya V., Barik S. Extraribosomal l13a is a specific innate immune factor for antiviral defense. J. Virol. 2014;88:9100–9110. doi: 10.1128/JVI.01129-14. [DOI] [PMC free article] [PubMed] [Google Scholar]
- Mazure N.M., Nguyen T.L., Danan J.L. Severe hypoxia specifically downregulates hepatocyte nuclear factor-4 gene expression in HepG2 human hepatoma cells. Tumour Biol. 2001;22:310–317. doi: 10.1159/000050632. [DOI] [PubMed] [Google Scholar]
- Melnick A.F., Gao Y., Liu J., Ding D., Predom A., Kelly C., Hess R.A., Chen C. RNF216 is essential for spermatogenesis and male fertility. Biol. Reprod. 2019;100:1132–1134. doi: 10.1093/biolre/ioz006. [DOI] [PMC free article] [PubMed] [Google Scholar]
- Messner C.B., Demichev V., Wendisch D., Michalick L., White M., Freiwald A., Textoris-Taube K., Vernardis S.I., Egger A.S., Kreidl M., et al. Ultra-High-Throughput Clinical Proteomics Reveals Classifiers of COVID-19 Infection. Cell Syst. 2020;11:11–24.e4. doi: 10.1016/j.cels.2020.05.012. [DOI] [PMC free article] [PubMed] [Google Scholar]
- Mi S., Li Z., Yang H.Z., Liu H., Wang J.P., Ma Y.G., Wang X.X., Liu H.Z., Sun W., Hu Z.W. Blocking IL-17A promotes the resolution of pulmonary inflammation and fibrosis via TGF-beta1-dependent and -independent mechanisms. J. Immunol. 2011;187:3003–3014. doi: 10.4049/jimmunol.1004081. [DOI] [PubMed] [Google Scholar]
- Morohoshi A., Miyata H., Shimada K., Nozawa K., Matsumura T., Yanase R., Shiba K., Inaba K., Ikawa M. Nexin-Dynein regulatory complex component DRC7 but not FBXL13 is required for sperm flagellum formation and male fertility in mice. PLoS Genet. 2020;16:e1008585. doi: 10.1371/journal.pgen.1008585. [DOI] [PMC free article] [PubMed] [Google Scholar]
- Muszbek L., Bereczky Z., Bagoly Z., Komáromi I., Katona É. Factor XIII: a coagulation factor with multiple plasmatic and cellular functions. Physiol. Rev. 2011;91:931–972. doi: 10.1152/physrev.00016.2010. [DOI] [PubMed] [Google Scholar]
- Nagy J.A., Benjamin L., Zeng H., Dvorak A.M., Dvorak H.F. Vascular permeability, vascular hyperpermeability and angiogenesis. Angiogenesis. 2008;11:109–119. doi: 10.1007/s10456-008-9099-z. [DOI] [PMC free article] [PubMed] [Google Scholar]
- National Health Commission Translation: Diagnosis and Treatment Protocol for Novel Coronavirus Pneumonia (Trial Version 7) Chin. Med. J. (Engl.) 2020;133:1087–1095. doi: 10.1097/CM9.0000000000000819. [DOI] [PMC free article] [PubMed] [Google Scholar]
- Oliveira-Nascimento L., Massari P., Wetzler L.M. The Role of TLR2 in Infection and Immunity. Front. Immunol. 2012;3:79. doi: 10.3389/fimmu.2012.00079. [DOI] [PMC free article] [PubMed] [Google Scholar]
- Orlowski G.M., Colbert J.D., Sharma S., Bogyo M., Robertson S.A., Rock K.L. Multiple Cathepsins Promote Pro-IL-1β Synthesis and NLRP3-Mediated IL-1β Activation. J. Immunol. 2015;195:1685–1697. doi: 10.4049/jimmunol.1500509. [DOI] [PMC free article] [PubMed] [Google Scholar]
- Ou X., Liu Y., Lei X., Li P., Mi D., Ren L., Guo L., Guo R., Chen T., Hu J., et al. Characterization of spike glycoprotein of SARS-CoV-2 on virus entry and its immune cross-reactivity with SARS-CoV. Nat. Commun. 2020;11:1620. doi: 10.1038/s41467-020-15562-9. [DOI] [PMC free article] [PubMed] [Google Scholar]
- Palta S., Saroa R., Palta A. Overview of the coagulation system. Indian J. Anaesth. 2014;58:515–523. doi: 10.4103/0019-5049.144643. [DOI] [PMC free article] [PubMed] [Google Scholar]
- Peyvandi F., Garagiola I., Baronciani L. Role of von Willebrand factor in the haemostasis. Blood Transfus. 2011;9(Suppl 2):s3–s8. doi: 10.2450/2011.002S. [DOI] [PMC free article] [PubMed] [Google Scholar]
- Poston J.T., Koyner J.L. Sepsis associated acute kidney injury. BMJ. 2019;364:k4891. doi: 10.1136/bmj.k4891. [DOI] [PMC free article] [PubMed] [Google Scholar]
- Rayet B., Gélinas C. Aberrant rel/nfkb genes and activity in human cancer. Oncogene. 1999;18:6938–6947. doi: 10.1038/sj.onc.1203221. [DOI] [PubMed] [Google Scholar]
- Rehwinkel J., Gack M.U. RIG-I-like receptors: their regulation and roles in RNA sensing. Nat. Rev. Immunol. 2020;20:537–551. doi: 10.1038/s41577-020-0288-3. [DOI] [PMC free article] [PubMed] [Google Scholar]
- Roux P.P., Topisirovic I. Signaling Pathways Involved in the Regulation of mRNA Translation. Mol. Cell. Biol. 2018;38:e00070-18. doi: 10.1128/MCB.00070-18. [DOI] [PMC free article] [PubMed] [Google Scholar]
- Schroder K., Hertzog P.J., Ravasi T., Hume D.A. Interferon-gamma: an overview of signals, mechanisms and functions. J. Leukoc. Biol. 2004;75:163–189. doi: 10.1189/jlb.0603252. [DOI] [PubMed] [Google Scholar]
- Shannon P., Markiel A., Ozier O., Baliga N.S., Wang J.T., Ramage D., Amin N., Schwikowski B., Ideker T. Cytoscape: a software environment for integrated models of biomolecular interaction networks. Genome Res. 2003;13:2498–2504. doi: 10.1101/gr.1239303. [DOI] [PMC free article] [PubMed] [Google Scholar]
- Shao W., Guo T., Toussaint N.C., Xue P., Wagner U., Li L., Charmpi K., Zhu Y., Wu J., Buljan M., et al. Comparative analysis of mRNA and protein degradation in prostate tissues indicates high stability of proteins. Nat. Commun. 2019;10:2524. doi: 10.1038/s41467-019-10513-5. [DOI] [PMC free article] [PubMed] [Google Scholar]
- Shen B., Yi X., Sun Y., Bi X., Du J., Zhang C., Quan S., Zhang F., Sun R., Qian L., et al. Proteomic and Metabolomic Characterization of COVID-19 Patient Sera. Cell. 2020;182:59–72.e15. doi: 10.1016/j.cell.2020.05.032. [DOI] [PMC free article] [PubMed] [Google Scholar]
- Su H., Yang M., Wan C., Yi L.X., Tang F., Zhu H.Y., Yi F., Yang H.C., Fogo A.B., Nie X., Zhang C. Renal histopathological analysis of 26 postmortem findings of patients with COVID-19 in China. Kidney Int. 2020;98:219–227. doi: 10.1016/j.kint.2020.04.003. [DOI] [PMC free article] [PubMed] [Google Scholar]
- Sweetwyne M.T., Murphy-Ullrich J.E. Thrombospondin1 in tissue repair and fibrosis: TGF-β-dependent and independent mechanisms. Matrix Biol. 2012;31:178–186. doi: 10.1016/j.matbio.2012.01.006. [DOI] [PMC free article] [PubMed] [Google Scholar]
- Szklarczyk D., Gable A.L., Lyon D., Junge A., Wyder S., Huerta-Cepas J., Simonovic M., Doncheva N.T., Morris J.H., Bork P., et al. STRING v11: protein-protein association networks with increased coverage, supporting functional discovery in genome-wide experimental datasets. Nucleic Acids Res. 2019;47(D1):D607–D613. doi: 10.1093/nar/gky1131. [DOI] [PMC free article] [PubMed] [Google Scholar]
- Tanaka T., Kamitani W., DeDiego M.L., Enjuanes L., Matsuura Y. Severe acute respiratory syndrome coronavirus nsp1 facilitates efficient propagation in cells through a specific translational shutoff of host mRNA. J. Virol. 2012;86:11128–11137. doi: 10.1128/JVI.01700-12. [DOI] [PMC free article] [PubMed] [Google Scholar]
- Tcherkezian J., Cargnello M., Romeo Y., Huttlin E.L., Lavoie G., Gygi S.P., Roux P.P. Proteomic analysis of cap-dependent translation identifies LARP1 as a key regulator of 5’TOP mRNA translation. Genes Dev. 2014;28:357–371. doi: 10.1101/gad.231407.113. [DOI] [PMC free article] [PubMed] [Google Scholar]
- Tian S., Xiong Y., Liu H., Niu L., Guo J., Liao M., Xiao S.Y. Pathological study of the 2019 novel coronavirus disease (COVID-19) through postmortem core biopsies. Mod. Pathol. 2020;33:1007–1014. doi: 10.1038/s41379-020-0536-x. [DOI] [PMC free article] [PubMed] [Google Scholar]
- Tsai J.C., Zelus B.D., Holmes K.V., Weiss S.R. The N-terminal domain of the murine coronavirus spike glycoprotein determines the CEACAM1 receptor specificity of the virus strain. J. Virol. 2003;77:841–850. doi: 10.1128/JVI.77.2.841-850.2003. [DOI] [PMC free article] [PubMed] [Google Scholar]
- Uhlén M., Fagerberg L., Hallström B.M., Lindskog C., Oksvold P., Mardinoglu A., Sivertsson Å., Kampf C., Sjöstedt E., Asplund A., et al. Proteomics. Tissue-based map of the human proteome. Science. 2015;347:1260419. doi: 10.1126/science.1260419. [DOI] [PubMed] [Google Scholar]
- Wichmann D., Sperhake J.P., Lutgehetmann M., Steurer S., Edler C., Heinemann A., Heinrich F., Mushumba H., Kniep I., Schroder A.S., et al. Autopsy Findings and Venous Thromboembolism in Patients With COVID-19. Ann. Intern. Med. 2020;173:1030. doi: 10.7326/M20-2003. [DOI] [PMC free article] [PubMed] [Google Scholar]
- Williamson C.D., DeBiasi R.L., Colberg-Poley A.M. Viral product trafficking to mitochondria, mechanisms and roles in pathogenesis. Infect. Disord. Drug Targets. 2012;12:18–37. doi: 10.2174/187152612798994948. [DOI] [PMC free article] [PubMed] [Google Scholar]
- Wu J.H., Li X., Huang B., Su H., Li Y., Luo D.J., Chen S., Ma L., Wang S.H., Nie X., Peng L. [Pathological changes of fatal coronavirus disease 2019 (COVID-19) in the lungs: report of 10 cases by postmortem needle autopsy] Zhonghua Bing Li Xue Za Zhi. 2020;49:568–575. doi: 10.3760/cma.j.cn112151-20200405-00291. [DOI] [PubMed] [Google Scholar]
- Wynn T.A. IL-13 effector functions. Annu. Rev. Immunol. 2003;21:425–456. doi: 10.1146/annurev.immunol.21.120601.141142. [DOI] [PubMed] [Google Scholar]
- Xia C., Anderson P., Hahm B. Viral dedication to vigorous destruction of interferon receptors. Virology. 2018;522:19–26. doi: 10.1016/j.virol.2018.06.017. [DOI] [PMC free article] [PubMed] [Google Scholar]
- Xu X., Chang X.N., Pan H.X., Su H., Huang B., Yang M., Luo D.J., Weng M.X., Ma L., Nie X. [Pathological changes of the spleen in ten patients with coronavirus disease 2019(COVID-19) by postmortem needle autopsy] Zhonghua Bing Li Xue Za Zhi. 2020;49:576–582. doi: 10.3760/cma.j.cn112151-20200401-00278. [DOI] [PubMed] [Google Scholar]
- Yang Z.Y., Huang Y., Ganesh L., Leung K., Kong W.P., Schwartz O., Subbarao K., Nabel G.J. pH-dependent entry of severe acute respiratory syndrome coronavirus is mediated by the spike glycoprotein and enhanced by dendritic cell transfer through DC-SIGN. J. Virol. 2004;78:5642–5650. doi: 10.1128/JVI.78.11.5642-5650.2004. [DOI] [PMC free article] [PubMed] [Google Scholar]
- Yang M., Chen S., Huang B., Zhong J.M., Su H., Chen Y.J., Cao Q., Ma L., He J., Li X.F., et al. Pathological Findings in the Testes of COVID-19 Patients: Clinical Implications. Eur. Urol. Focus. 2020;6:1124–1129. doi: 10.1016/j.euf.2020.05.009. [DOI] [PMC free article] [PubMed] [Google Scholar]
- Yao X.H., Li T.Y., He Z.C., Ping Y.F., Liu H.W., Yu S.C., Mou H.M., Wang L.H., Zhang H.R., Fu W.J., et al. [A pathological report of three COVID-19 cases by minimal invasive autopsies] Zhonghua Bing Li Xue Za Zhi. 2020;49:411–417. doi: 10.3760/cma.j.cn112151-20200312-00193. [DOI] [PubMed] [Google Scholar]
- Yap J.K.Y., Moriyama M., Iwasaki A. Inflammasomes and Pyroptosis as Therapeutic Targets for COVID-19. J. Immunol. 2020;205:307–312. doi: 10.4049/jimmunol.2000513. [DOI] [PMC free article] [PubMed] [Google Scholar]
- Yu H., Pardoll D., Jove R. STATs in cancer inflammation and immunity: a leading role for STAT3. Nat. Rev. Cancer. 2009;9:798–809. doi: 10.1038/nrc2734. [DOI] [PMC free article] [PubMed] [Google Scholar]
- Zhao S., Zhu W., Xue S., Han D. Testicular defense systems: immune privilege and innate immunity. Cell. Mol. Immunol. 2014;11:428–437. doi: 10.1038/cmi.2014.38. [DOI] [PMC free article] [PubMed] [Google Scholar]
- Zhao T., Su Z., Li Y., Zhang X., You Q. Chitinase-3 like-protein-1 function and its role in diseases. Signal Transduct. Target. Ther. 2020;5:201. doi: 10.1038/s41392-020-00303-7. [DOI] [PMC free article] [PubMed] [Google Scholar]
- Zhou Y., Zhou B., Pache L., Chang M., Khodabakhshi A.H., Tanaseichuk O., Benner C., Chanda S.K. Metascape provides a biologist-oriented resource for the analysis of systems-level datasets. Nat. Commun. 2019;10:1523. doi: 10.1038/s41467-019-09234-6. [DOI] [PMC free article] [PubMed] [Google Scholar]
- Zhu Y., Weiss T., Zhang Q., Sun R., Wang B., Yi X., Wu Z., Gao H., Cai X., Ruan G., et al. High-throughput proteomic analysis of FFPE tissue samples facilitates tumor stratification. Mol. Oncol. 2019;13:2305–2328. doi: 10.1002/1878-0261.12570. [DOI] [PMC free article] [PubMed] [Google Scholar]
Associated Data
This section collects any data citations, data availability statements, or supplementary materials included in this article.
Supplementary Materials
A. Clinical information of the COVID-19 patients. Baseline characteristics (age, gender, BMI, smoking history, preexisting medical conditions), course of disease (days), treatment, clinical cause of death, main pathologic findings, SARS-CoV-2 nucleic acid in lung samples, sepsis and results of lower extremity vascular ultrasound examination are listed. B. Clinical information of the non-COVID-19 patients. Baseline characteristics include age, gender, preexisting medical conditions. C. The effects of gender, smoking history and comorbidities on proteome landscape of the COVID-19 patients analyzed by Fisher’s exact test. D. Medication regimen for the COVID-19 patients during COVID-19 hospitalization. L, medication by long-term medical orders; S, medication by temporary medical orders.
A. Sample information of the COVID-19 patients. B. Sample information of the non-COVID-19 patients. The corresponding relation among samples, patients and sample subtypes. There are two types of Sample ID from clinic and MS batch design. Subtype is from anatomical structure. L_R means the sample from left side or right side. C. Batch design. A total of 255 samples containing 144 samples from the COVID-19 patients, 74 samples from the non-COVID-19 patients and 37 technique replicates were designed into 18 batches. Technical replicates are marked in green. 18 pooled samples for ratio calculation are marked in orange. Five samples excluded during quality control are marked in gray.
11,394 proteins have been quantified with a false discovery rate (FDR) less than 1% across 540 raw MS/MS data.
A. Differentially expressed proteins between the COVID-19 and non-COVID-19 groups across seven organs. 5,336 proteins have been shortlisted with |log2(FC)| greater than log2(1.2) and B-H adjusted p value less than 0.05. B. Differentially expressed proteins between MODS and Non-MODS groups of the COVID-19 patients across seven organs. 736 proteins have been shortlisted with |log2(FC)| greater than log2(1.2) and B-H adjusted p value less than 0.05. C. Differentially expressed proteins between samples from the COVID-19 patients with HT and Non-HT across seven organs. 144 proteins have been filtered with |log2(FC)| greater than log2(1.2) and B-H adjusted p value less than 0.05. D. Differentially expressed proteins between samples from the COVID-19 patients with CHD and Non-CHD across seven organs. 990 proteins have been shortlisted with |log2(FC)| greater than log2(1.2) and B-H adjusted p value less than 0.05. E. Differentially expressed proteins between samples from older and younger COVID-19 patients across five organs. 697 proteins have been shortlisted with |log2(FC)| greater than log2(1.2) and B-H adjusted p value less than 0.05.
. Proteins have been shortlisted with |log2(FC)| greater than log2(1.2) and B-H adjusted p value less than 0.05. Same trend of transcription factors means same change trend in the experimental fold-change and the predicted activation state by IPA. Y, Yes; N, No; NA, Not belonging to transcription factors. B. Data corresponding to Figure S2. Laboratory findings for the COVID-19 patients. C. Data corresponding to Figure S5. Fibrosis associated proteins dysregulated between the COVID-19 patients and non-COVID-19 groups. The sheet only shows the log2(FC) of significantly dysregulated proteins in the specific organ type.
A-G. The enriched pathways performed by IPA with dysregulated proteins in corresponding organs. H. Pathway analysis of 375 upregulated proteins and 204 downregulated proteins in the liver of MODS group by Metascape. I-K. The enriched pathways performed by IPA with the immunological proteins from GSEA-immunologic gene sets in corresponding organs.
Data Availability Statement
All data are available in the manuscript or the supplementary material. The accession number for the proteomics data reported in this paper is iProX: IPX0002393000.