Abstract
Cellular plasticity describes cells’ ability to transition from one set of phenotypes to another. In melanoma, transient fluctuations in the molecular state of tumor cells mark the formation of rare cells primed to survive BRAF inhibition and reprogram into a stably drug resistant fate. However, the biological processes governing cellular priming remain unknown. We used CRISPR/Cas9 genetic screens to identify genes that affect cell fate decisions by altering cellular plasticity. We found that many factors can independently affect cellular priming and fate decisions. We discovered a novel, plasticity-based mode of increasing resistance to BRAF inhibition that pushes cells towards a more differentiated state. Manipulating cellular plasticity through inhibition of DOT1L before the addition of the BRAF inhibitor resulted in more therapy resistance than concurrent administration. Our results indicate that modulating cellular plasticity can alter cell fate decisions and may prove useful for treating drug resistance in other cancers.
Plasticity describes the ability of cells to transition from one phenotype to another, enabling cells to adapt and survive in the face of a variety of stimuli and challenges. Examples include regeneration, wound healing, and the induction of pluripotency. Plasticity can be decomposed into stimulus-independent and subsequent stimulus-dependent phases. The first typically consists of (often rare) cells within the population being “primed” for the cell fate transition. Then, upon the stimulus, these primed cells are selectively reprogrammed to adopt the new phenotype. A major question in single cell biology has been determining the molecular differences specific to these primed cells and connecting those differences to their ultimate fate after the stimulus reprograms them. Recent studies have developed the link between cellular priming and cell fate that underlies plasticity in a number of contexts1–8. However, little is known about pathways that can manipulate the fluctuations that drive priming and whether those pathways can affect their subsequent fates, leaving potential therapeutic applications largely unrealized.
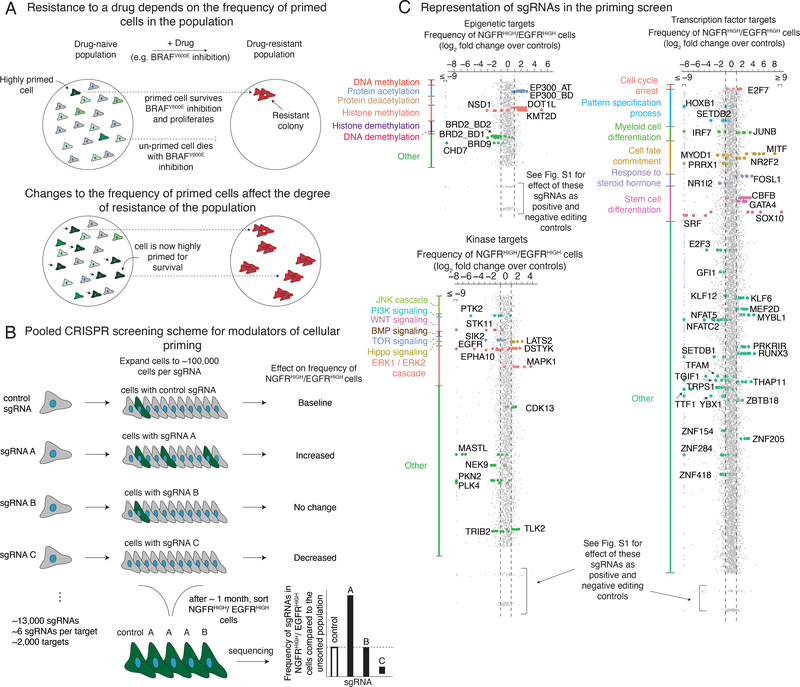
Therapy resistance in melanoma is an excellent example of cellular plasticity9,10. Therapies such as vemurafenib that inhibit particular oncogenic targets often kill most tumor cells, but a few remaining cells continue to proliferate, ultimately repopulating the tumor. While the mechanisms underlying this therapy resistance often emerge from a genetic mutation, many recent studies, both in melanoma and other cancers, suggest a role for non-genetic mechanisms driving cellular plasticity, in particular right after the application of therapy. Plasticity here refers to the rare cells that are transiently primed to survive drug treatment that are then reprogrammed into a more stably resistant state by the drug itself8,11–21. In melanoma, this primed cellular state, which we have also previously referred to as the pre-resistant cellular state, is often marked by transiently high expression of resistance marker genes such as EGFR, NGFR and AXL (Fig. 1a, top). Exposure to drug reprograms these cells by converting the transient primed phenotype into a stably drug-resistant phenotype characterized by massive changes in signaling and gene expression profiles. (Note that if one removes drug from stably resistant cells for a period of three weeks, the cells are still completely resistant upon re-exposure14.) A notable difference between this paradigm of resistance and more conventional models of drug resistance caused by mutation is that, while genetic mutations largely arise spontaneously, the non-genetic fluctuations driving primed states could result from the activity of specific biological pathways. Targeting these pathways could potentially enhance or inhibit the formation of primed cells in the primed state. We wanted to dissect the molecular regulators of priming and determine how they might affect the overall acquisition of resistance.
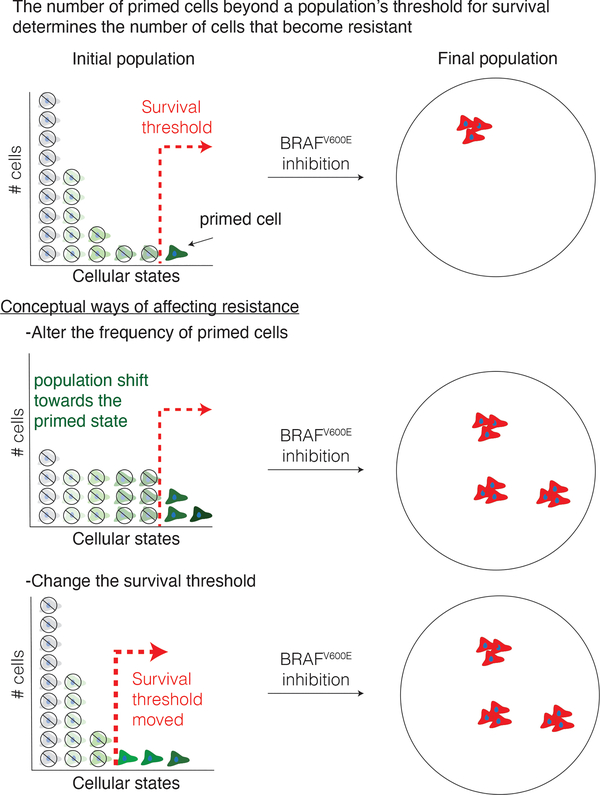
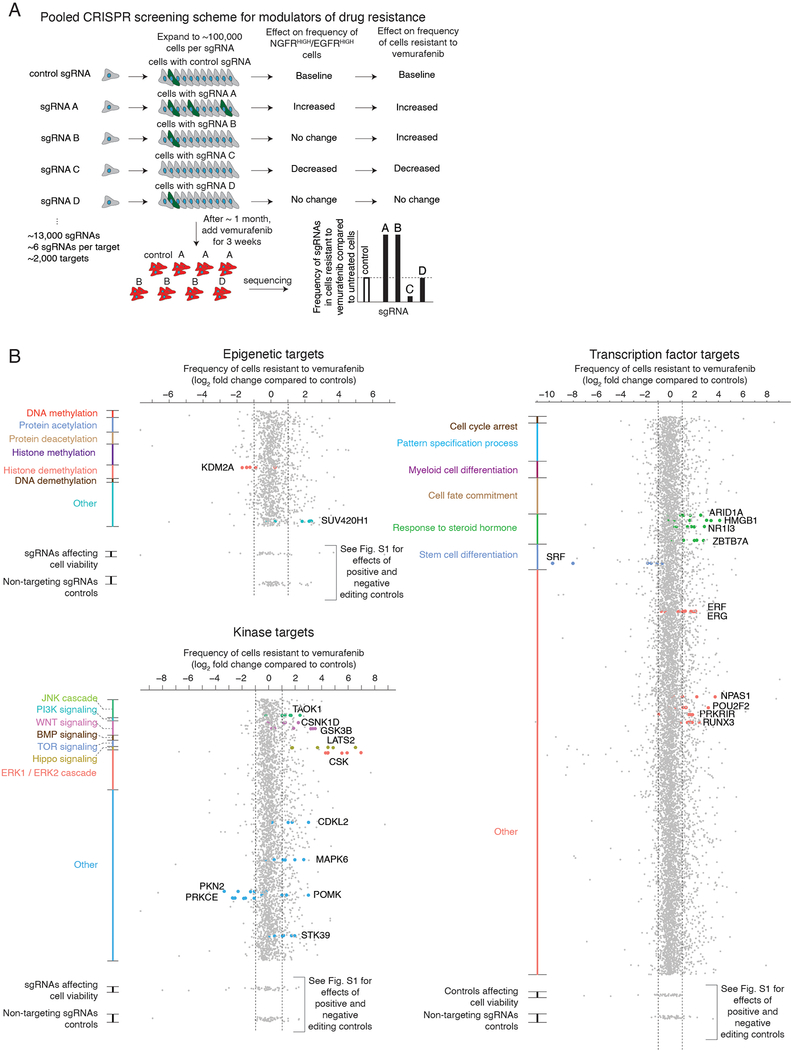
Figure 1 |. Pooled CRISPR screen design to identify modulators of cellular priming in the context of drug resistance to targeted therapies in melanoma.
a, In melanoma, the initial molecular profile of a cell (primed vs. unprimed) within an otherwise homogeneous population, indicated by green vs. gray coloring of cell, dictates the ultimate fate of the cell (e.g. proliferation vs. death) when exposed to therapy (top). Changing the number of cells in a given state (bottom) can alter the number of resistant colonies that form upon addition of the BRAFV600E inhibitor vemurafenib. b, We designed a pooled CRISPR screen to detect modulators of the cellular priming that leads to drug resistance. After transducing a library of single guide RNAs and expanding the population, we isolated cells with high expression of both NGFR and EGFR, then sequenced the single guide RNAs to determine which gene knockouts alter the frequency of these cells. Changes in the frequency of a given single guide RNA in this population (e.g. targets A and C) indicate that these targets may affect the frequency of NGFRHIGH/EGFRHIGH cells in the population, and thus may affect frequency of cellular priming. c, After transducing a population of melanoma cells and isolating NGFRHIGH/EGFRHIGH cells (see b), we quantified the frequency of each single guide RNA in the resulting population. Our screening scheme utilized three separate pooled single guide RNA libraries: one targeting epigenetic domains (top left), another targeting kinases (bottom left), and a final one targeting transcription factors (right). We organized the targets within each single guide RNA library by biological process. (While a given target could fall into several categories, each target is assigned to a single group and plotted only once.) Each dot represents a single guide RNA, grouped by gene target (5–6 single guide RNAs per target), with the log2 fold change representing the number of times the single guide RNA was detected in the sorted population versus an unsorted population of melanoma cells transduced with the same library. For display purposes, all single guide RNAs with fold changes beyond the axis limits were placed at the edge of the axis as indicated. For targets considered “hits” by our rubric (see Methods), we labeled the single guide RNA dot by the color assigned to that biological process. Dots at the bottom of each pane correspond to non-targeting controls (single guide RNAs not targeting any loci in the genome) and cell viability controls (e.g. proteins required for cell survival and proliferation, but not specifically associated with rare-cell behavior). Extended Data Figure 2 provides details on the effect of these editing controls.
CRISPR/Cas9 technology enables genetic screens to identify regulators of such molecular processes. For most cell fate transitions, including therapy resistance, virtually all screens have been designed to detect changes to the ultimate fate only—i.e., changes in the final number of resistant cells, typically measured as a proliferation phenotype22–25. However, such screens do not explicitly target priming, which may in principle have distinct regulatory mechanisms to that of the acquisition of resistance as a whole. These mechanisms may then also affect the overall degree of drug resistance, but potentially through new, previously undiscovered pathways that affect drug resistance in ways not revealed by classical resistance screens (Fig. 1a, bottom).
We here performed pooled CRISPR/Cas9 genetic screens designed to capture modulators of priming for drug resistance in single melanoma cells. This screen identified several new factors that affect the frequency of primed cells in clonal melanoma populations, and consequently resistance to targeted therapies. The transcriptome profiles induced by knocking out these factors revealed a novel mechanism that can increase or reduce drug resistance by increasing or decreasing the activity of differentiation pathways, respectively, as opposed to increasing drug resistance by decreasing differentiation. Drugs targeting these factors display a variety of synergistic effects when coupled with therapy, which can be dependent on the relative timing of drug application. Together, our results indicate that modulating cellular plasticity can alter cell fate decisions and may provide a new avenue for treating drug resistance.
Results
CRISPR/Cas9 genetic screens identify factors that affect primed cellular states.
We wanted to identify factors that affected the fluctuations in cellular state that lead to single cells being primed to be drug resistant. We used a clonal BRAFV600E-mutant melanoma cell line (WM989 A6-G3) that exhibits resistance behavior in cell culture14 that is broadly comparable to that displayed in patients14,21,26. Phenomenologically, we observe that, upon addition of a roughly cytotoxic dose of the BRAFV600E inhibitor vemurafenib (1 μM)14, the vast majority of cells die or stop growing, but around 1 in 2,000–3,000 cells continues to proliferate, ultimately forming a resistant colony after 2–3 weeks in culture in vemurafenib14. Prior to the application of drug, there is a rare subpopulation of cells that are primed to become resistant14, and these cells are marked by the expression of a set of priming marker genes, like NGFR and EGFR. To identify modulators of the fluctuations that lead to the formation of this subpopulation of primed cells, we designed a loss-of-function pooled CRISPR genetic screen (dubbed the “priming screen”) composed of ~13,000 single guide RNAs (sgRNAs) targeting functionally relevant domains of ~2,000 proteins, with roughly six distinct single guide RNAs per domain (1,402 transcription factor targets, 481 kinase targets, 176 epigenetic targets; see Supplementary Tables 1–3)27–29. To conduct the screen, we stably integrated Streptococcus pyogenes Cas9 (spCas9) into the WM989-A6-G3 cell line, creating the clonal line WM989-A6-G3-Cas9–5a3 (Extended Data Figs. 1 and 2 show a comparison to the parental line and validation of spCas9 functionality).
To screen for factors affecting cellular priming, we transduced these cells with the pooled library of single guide RNAs. To ensure adequate sampling of the frequency of rare primed cells, we expanded the culture to around 50,000–250,000 cells per each single guide RNA, or roughly a billion cells total. We combined magnetic sorting and flow cytometry to isolate cells expressing both EGFR and NGFR, which are well-validated markers of primed cells: sorting out cells expressing each marker produces far more resistant colonies, with doubly-positive cells being even more resistant14,19. (Note that these markers may not induce the primed state per se; indeed, inhibition of EGFR did not affect priming14.) We sequenced the single guide RNAs in this sorted subpopulation to determine which ones were over- or under-represented compared to the unsorted population. Over-representation suggests that knockout of the gene increases the frequency of NGFRHIGH/EGFRHIGH cells and vice versa (Fig. 1b). We selected “hits” via a series of criteria that ranked candidates into confidence tiers (see Methods for selection criteria).
Our screen identified several factors that affect priming. We obtained a set of 61 high-confidence targets that affected the frequency of NGFRHIGH/EGFRHIGH cells (Fig. 1c and Supplementary Table 4). Of these, 25 increased the frequency of NGFRHIGH/EGFRHIGH cells and 36 decreased the frequency. Beyond known factors such as SOX10 and MITF26,30–32, we identified several factors not previously known to affect resistance to BRAFV600E inhibition. These include DOT1L, which encodes an H3K79 methyltransferase associated with melanoma oncogenesis33, and BRD2, a member of the BET family often overexpressed in melanoma34. In a secondary targeted screen of the 34 high-confidence targets, 25 replicated in the original WM989-A5-G3-Cas9 line, and 20 showed similar effects in another melanoma line (451Lu-Cas9) (Extended Data Fig. 3 and Supplementary Table 4). Together, these hits represented potential candidates for modulating priming and thus resistance. (Note that EGFR can be regarded as a positive control: our assay involves sorting for EGFRHIGH cells, so many genetic disruptions of EGFR would lead to a loss of EGFR protein.)
Changes in drug resistance can occur by priming-dependent and independent mechanisms.
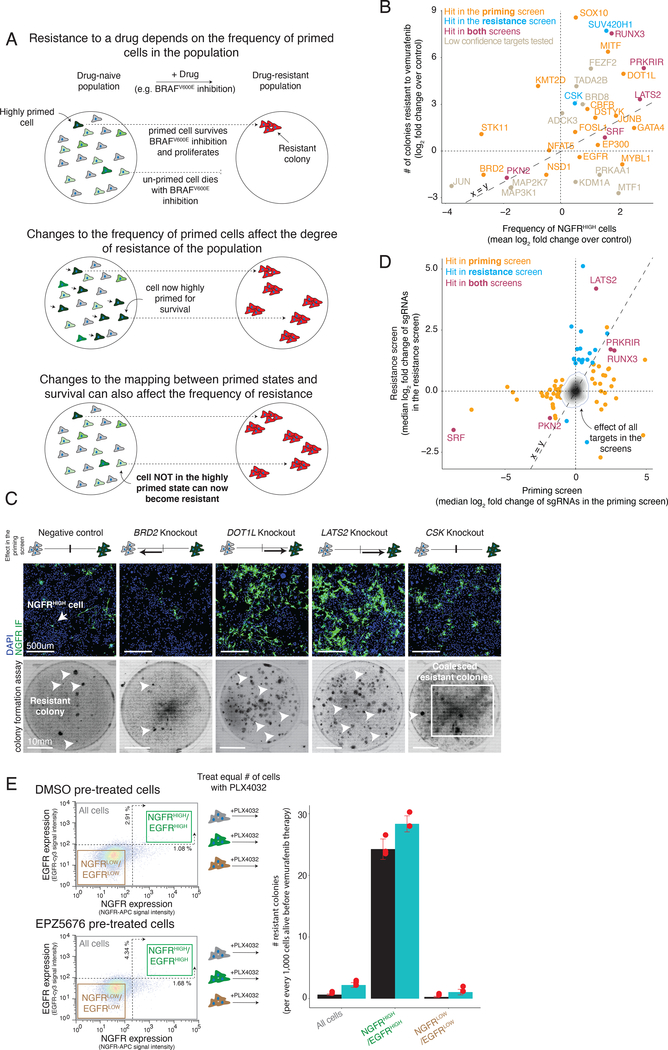
The priming screen was designed to identify candidate factors that would either increase or decrease the percentage of cells with a “primed” transcriptional profile (high expression of EGFR and NGFR). Conceptually, a factor could also affect the number of resistant colonies without affecting priming, that is, without forcing cells to adopt the characteristic primed transcriptional profile. Instead, a factor could, say, increase the number of resistant colonies by lowering the priming “threshold” needed for cells to become resistant, for instance by lowering the level of residual MAPK signaling required for cells to proliferate in vemurafenib, allowing the survival of “sub-primed” cells that would normally not survive in drug. Thus, any particular factor could increase resistance either by increasing the frequency of primed cells (Fig. 2a, middle) or by allowing more partially-primed cells to become resistant, i.e., lowering the putative threshold (Fig. 2a, bottom) (or both).
Figure 2 |. Effects of modulators of cellular priming on resistant colony formation.
a, In melanoma, the frequency of primed cells in the population dictates the degree of resistance to BRAFV600E inhibition. Changes to the mapping between cellular priming and a cell’s response to the drug can alter the number of resistant colonies that form upon addition of the BRAFV600E inhibitor vemurafenib. b, Relationship between the frequency of NGFRHIGH cells (x-axis) and the number of resistant colonies (y-axis). We plot the frequency of NGFRHIGH cells as the mean log2 fold change over three replicates in the number of NGFRHIGH cells following knockout of the gene indicated, normalized by cells with non-targeting sgRNAs. (For variability of the effect size across replicates of a given target, see Extended Data Fig. 5). We quantified the log2 fold change in the number of resistant colonies in the knockout cell line as compared to the non-targeting control cell lines. Orange points are targets identified as high confidence hits (Tier 1 and Tier 2) in the cellular priming screen; blue are those identified as high confidence hits in the resistance screen; purple are those identified as high confidence hits in both screens; gray, those that may have shown an effect in either or both screens, but were not classified as high confidence hits in either screen. c, To validate the phenotypic effect of targets identified by our genetic screens, we knocked out 83 of the targets and quantified both the frequency of NGFRHIGH cells by immunofluorescence using anti-NGFR antibodies (top) and the number of resistant colonies (bottom) that form upon BRAFV600E inhibition. Here we show example validation of BRD2 and LATS2 knockouts (hits in the cellular priming screen) and of CSK knockouts (hit in the resistance screen only). The schematic represents the effect of the knockout in the priming screen on the frequency of NGFRHIGH/EGFRHIGH cells. The immunofluorescence data was captured in three biological replicates. The colony formation assays for this specific experiment were carried out once (see Extended Data Fig. 5a,b). Of note, the number of colonies reported for the CSK knockout is an underestimate due to difficulties in accurately counting colonies in highly-confluent plates. d, Effect overlap between hits from the cellular priming and resistance screens. Each target’s position (dots) represents the number of times (as median log2 fold change) the single guide RNAs were detected in the NGFRHIGH/EGFRHIGH population vs. an unsorted population of melanoma cells (priming screen, x-axis), or in the population of cells resistant to vemurafenib vs. the population of cells prior to treatment (resistance screen, y-axis). Orange labels correspond to high confidence targets (Tier 1 and Tier 2) in the cellular priming screen; blue corresponds to high confidence targets in the resistance screen; purple corresponds to high confidence targets in both screens. The effects of all targets in both screens are displayed as a density histogram. e, To compare the resistance potential of primed cells (marked by NGFR and EGFR expression) resulting from inhibition of DOT1L (a target from the priming screen) to those from control populations, we first pre-treated cells with either a DOT1L inhibitor (EPZ5676) or DMSO for seven days. We then sorted cells by NGFR and EGFR expression using FACS. Then, we treated an equal number of cells with vemurafenib and quantified the resulting number of drug-resistant colonies. Individual data points are presented as dots. The bars represent the average number of colonies in each population across triplicates, normalized to every 1,000 cells present before addition of vemurafenib. Error bars represent the standard deviation across triplicates.
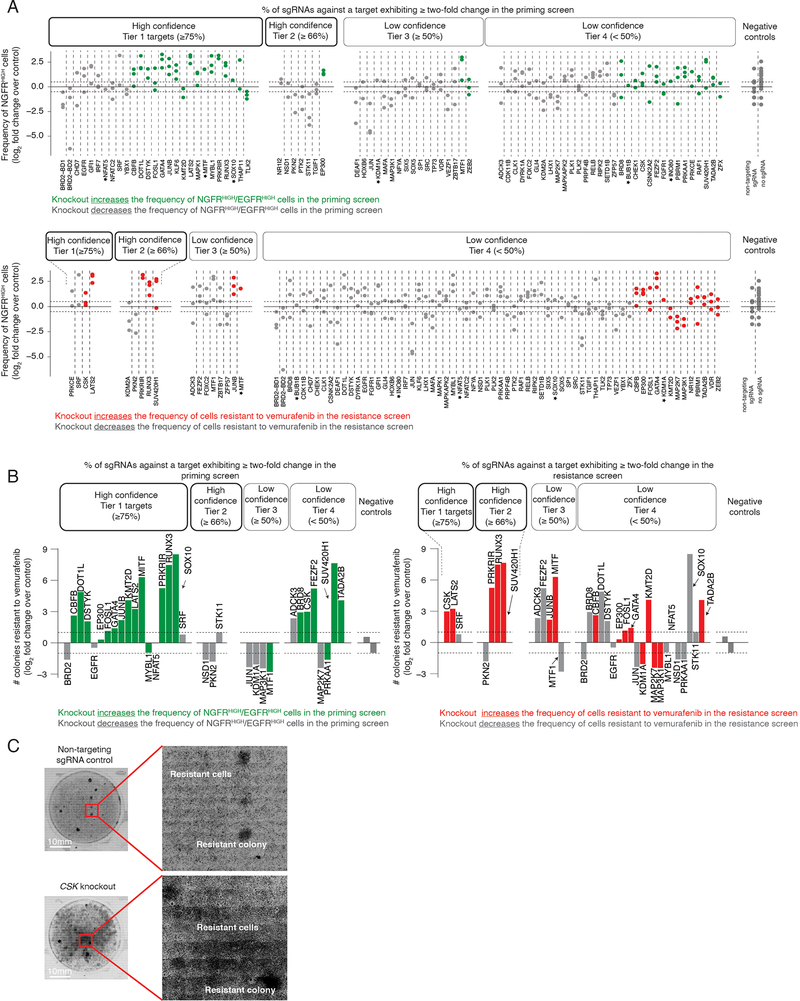
We wanted to measure how much these factors affected either priming frequency or resistance threshold. First, we ran a conventional survival screen (also, a secondary targeted screen with another melanoma line) based on the number of resistant colonies (“resistance screen”) (Extended Data Figs. 3 and 4, and Supplementary Table 4). We identified 20 high confidence factors that, when knocked out, increased the number of resistant cells, and 4 that reduced the number of resistant cells. The hits included signaling pathways elements like MAPK (CSK)35, Wnt/β-catenin (KDM2A)36, and Hippo (LATS2)37.
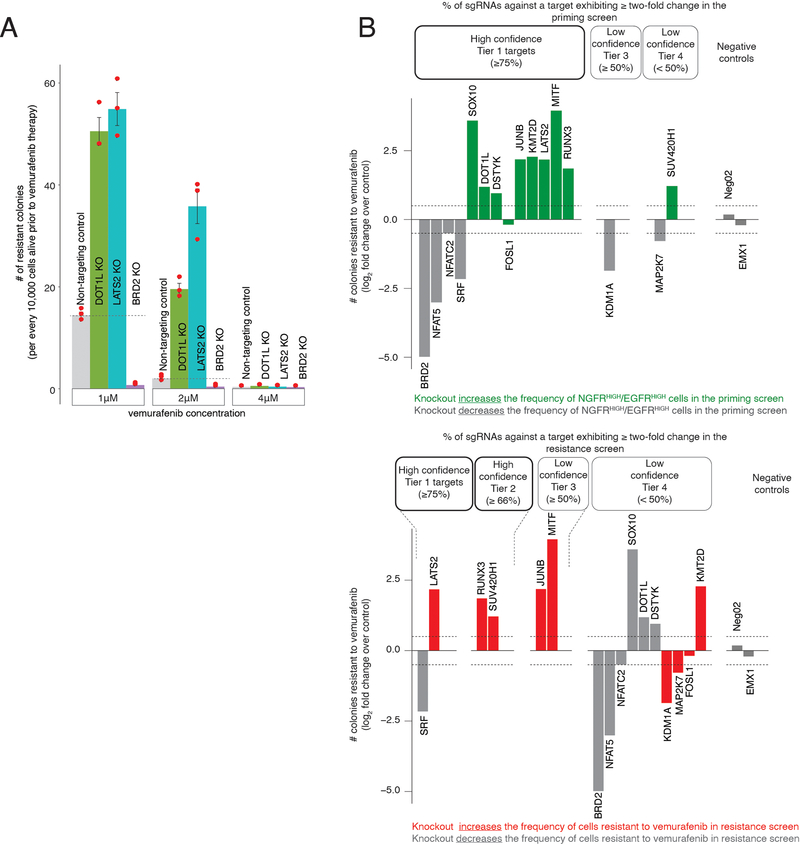
It is important to note that neither the priming screen nor the resistance screen were run to saturation to identify all factors that affected either priming frequency or resistance threshold. Thus, even if a factor was identified in, say, the priming screen, it may also affect the number of resistant colonies even if it did not appear as a hit in the resistance screen (we discuss this point more later). Therefore, the only way to systematically evaluate whether knocking out a factor would affect either priming frequency or resistance threshold (or both) was to measure, on a knockout-by-knockout basis, changes in the frequency of NGFR positivity and number of resistant colonies produced, respectively. We measured NGFR positivity in 83 different targets taken from both screens, and further looked for changes in resistance in 35 of those (Fig. 2b and Extended Data Fig. 5). Individual knockouts exhibited a range of changes in both the frequency of NGFRHIGH cells and the number of resistant colonies formed. Many hits from the priming screen (15/21 tested by both immunofluorescence and resistant colony formation) showed the predicted change in frequency of priming and, concomitantly, to the number of resistant colonies (e.g. LATS2, BRD2; Fig. 2c), even over a range of drug concentrations (Extended Data Fig. 6a). Thus, knocking out factors that changed the frequency of cells expressing NGFR (a proxy for the primed cellular state) were associated with concordant changes in the number of resistant colonies.
It was possible that removal of a factor could increase the frequency of NGFRHIGH/EGFRHIGH cells and the frequency of resistant colonies (Fig. 2c), but that the newly NGFRHIGH/EGFRHIGH cells were not actually resistant and rather some other population was now responsible for the additional resistant colonies. To demonstrate that the newly NGFRHIGH/EGFRHIGH cells were indeed driving the increased number of resistant colonies, we isolated NGFRHIGH/EGFRHIGH cells from DOT1L-inhibited cells and added vemurafenib, finding that this now larger population of highly expressing cells had a similar if not higher propensity to become resistant; thus, the change in priming accounted for most of the resistant phenotype (Fig. 2e).
While there was an overall concordance between changes in priming and resistance, knockouts of many genes varied widely in the degree to which this relationship held (Fig. 2b). For instance, knockout of EP300 increased NGFRHIGH by ~2 fold, but only slightly increased the number of resistant colonies, while knockout of CSK only slightly increased the number of NGFRHIGH, but increased in the number of resistant colonies over six-fold (Fig. 2b,c). (Note that knocking out CSK increased resistance to the point of producing a lawn of resistant cells, making it difficult to accurately count colonies and explaining why it was the dominant hit in the resistance screen.) As mentioned, hits like CSK that affect resistance without affecting priming may be affecting the resistance threshold (see Discussion).
Of the factors identified by the resistance screen, only 5 were also identified in our priming screen (Fig. 2d), suggesting that hits from the priming screen may not affect resistance. However, upon testing priming factors individually for their effects on the number of resistant colonies, most of the hits in the priming screen (15 of the 21 tested) affected the number of resistant colonies (Extended Data Fig. 5b). This discordance highlights the utility of designing a screen focused on priming rather than resistance as a whole. In principle, if the resistance screen could isolate all possible factors affecting every aspect of resistance, then it would have found priming factors that also affect resistance. In practice, however, the number of cells required make it difficult to run these screens to saturation, and so dominant hits that change resistance alone (e.g. CSK) comprised so many cells in the pooled resistance screen that priming factors became difficult to detect. Thus, screens targeting priming can potentially reveal novel hits that may elude detection by other modes of screening.
Changes in the frequency of primed cellular states lead to differences in tumor growth in vivo.
We wondered whether the factors we identified could affect resistance in vivo, which has complex microenvironmental factors38. We tested three factors: DOT1L and LATS2, which increased the frequency of NGFRHIGH/EGFRHIGH cells in vitro, and BRD2, which decreased the frequency of these cells.
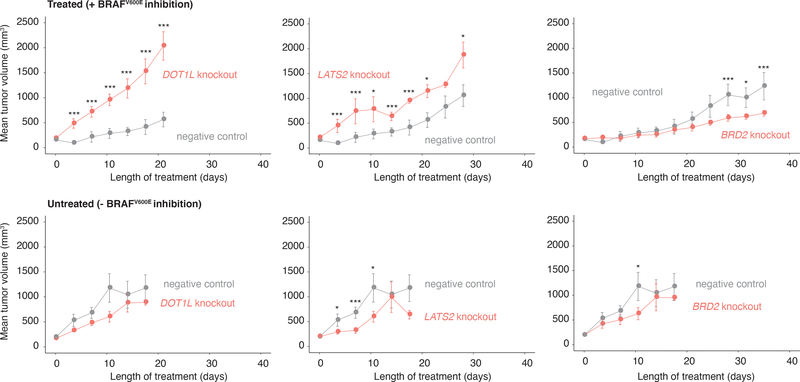
After knocking out these targets in WM989-A6-G3-Cas9–5a3 cells, we injected the cells into NOD/SCID mice (n = 12 mice per knockout) and allowed tumors to develop (Fig. 3). The tumor volumes over time were consistent with our in vitro results: at the treatment endpoint (see Methods), DOT1L knockout tumors treated with a BRAFV600E inhibitor were roughly 3.5 times larger than controls (P = 0.010), and LATS2 knockout tumors were 1.6 times larger than controls (P = 0.062). Meanwhile, BRD2 knockout tumors were approximately half as big as controls (P = 0.045). In the absence of drug, both knockout and control melanoma cells showed roughly similar growth dynamics (Fig. 3, bottom). Thus, priming factors also affect the response of tumors to BRAFV600E inhibition in vivo.
Figure 3 |. Effect of modulators of cellular priming on growth of BRAFV600E-resistant tumors in vivo.
Tumor volume as a function of time in xenografts (NOD/SCID mice) treated with a BRAFV600E inhibitor (top) or vehicle control (bottom). Here, we inject each mouse with DOT1L-, LATS2-, or BRD2-knockout WM989-A6-G3-Cas9 cells (orange) or with the same cell line without a gene knockout (gray). The values plotted represent the mean tumor volume across mice carrying the same knockout. Error bars represent the standard error of the mean. All p values were obtained with a one-sided t-test. *** are timepoints at which the difference in tumor volume between knockout and control groups reached P ≤ 0.05. Similarly, * represents P = 1 ≤≥ 0.05 (see Methods). Each group started with n = 6 mice, and we plotted the mean tumor volume up until both knockout and negative control groups have at least n = 3 each. The n at each timepoint and the respective P value at each timepoint are presented in Supplementary Tables 7 and 8.
Relative timing of targeting variability can affect drug resistance.
Priming factors may affect resistance through mechanisms that may interact with BRAFV600E inhibition in novel ways. For instance, a factor could affect the number of primed cells before BRAFV600E inhibition but not after, once the cells begin reprogramming towards stable resistance. Inhibiting such a factor before inhibiting BRAFV600E would be critical.
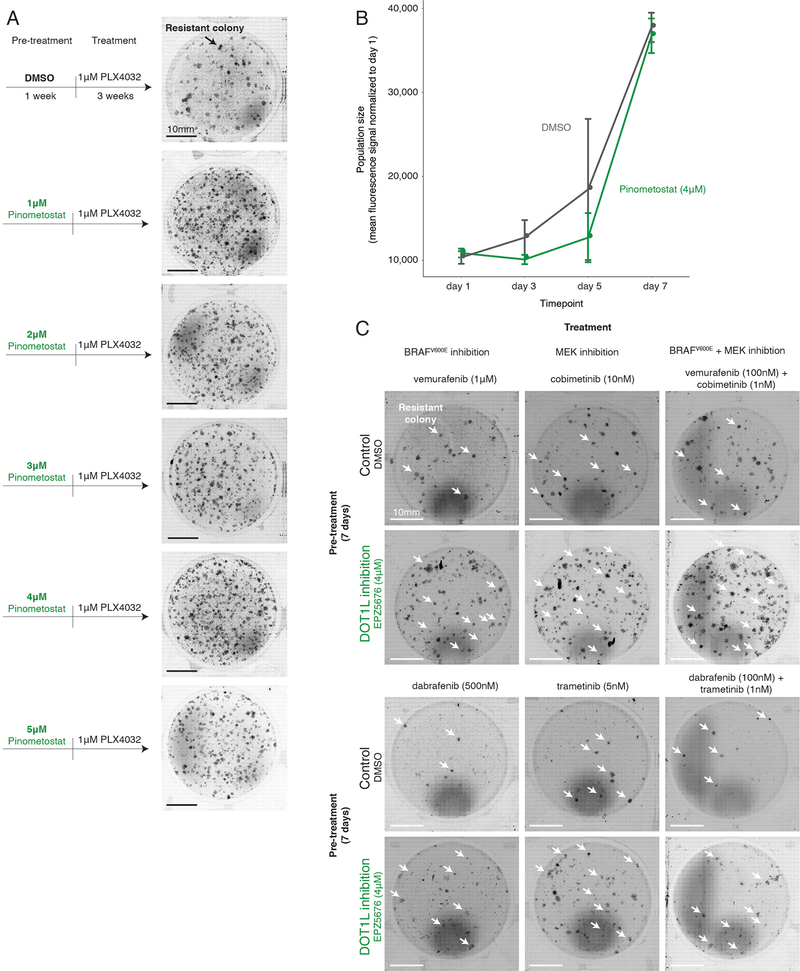
To test this possibility, we used the DOT1L inhibitor pimenostat39,40 (which increases the number of colonies resistant to BRAFV600E and MEK inhibitors; Extended Data Fig. 7a–c) to see if the relative timing of DOT1L inhibition affected resistant colony formation. In addition to vemurafenib treatment, we both pre-treated with the DOT1L inhibitor for seven days and co-treated with the DOT1L inhibitor concurrently with vemurafenib (Fig. 4a). Pre-inhibition of DOT1L resulted in three-fold more colonies, but co-treatment led to no change in the number of resistant colonies (Fig. 4b). Thus, the relative timing of inhibition of cellular priming vis-à-vis mainline therapy can have a profound effect on resistance.
Figure 4 |. Effect of targeting cellular priming at different times relative to BRAFV600E inhibition.
a, To assess the effect of DOT1L inhibition (green arrows, pinometostat at 4 μM) at different times on a cell’s ability to survive BRAFV600E inhibition, we first established a baseline number of colonies that grow when WM989-A6-G3 cells are exposed to 1 μM of vemurafenib for 3 weeks (leftmost panel). Then, in a separate population, we either inhibited BRAFV600E and DOT1L simultaneously (co-treatment), inhibited DOT1L first (7 days) and then BRAFV600E (3 additional weeks; pre-treatment), or inhibited DOT1L before (7 days) and during 3 weeks of vemurafenib treatment (pre-treatment and co-treatment). b, Number of resistant colonies that result from each therapeutic regimen in Figure 2c as the fold change over baseline (vemurafenib alone) for three replicates normalized to the number of cells in culture prior to BRAFV600E inhibition. Individual data points are presented at dots. The bars quantify the mean fold change across the three replicates. Error bars indicate the standard error.
Knockout of novel genes that increase the frequency of primed cell states also increase cellular differentiation.
Our priming screens identified factors that operate via a variety of signaling pathways and transcriptional regulatory mechanisms. Interestingly, a priori, no particular pathway dominated the set of identified factors; however, seemingly unrelated genes nevertheless could affect priming through common biological processes.
To look for such commonalities, we used RNA sequencing to measure genome-wide transcript levels for 266 knockout cell lines targeting 80 different proteins taken from both the priming and resistance screens (see Supplementary Table 4 and Extended Data Figs. 8 and 9 for information regarding validation rates of the targets used), reasoning that genes participating in a particular biological process may exhibit similar patterns of differential expression when knocked out.
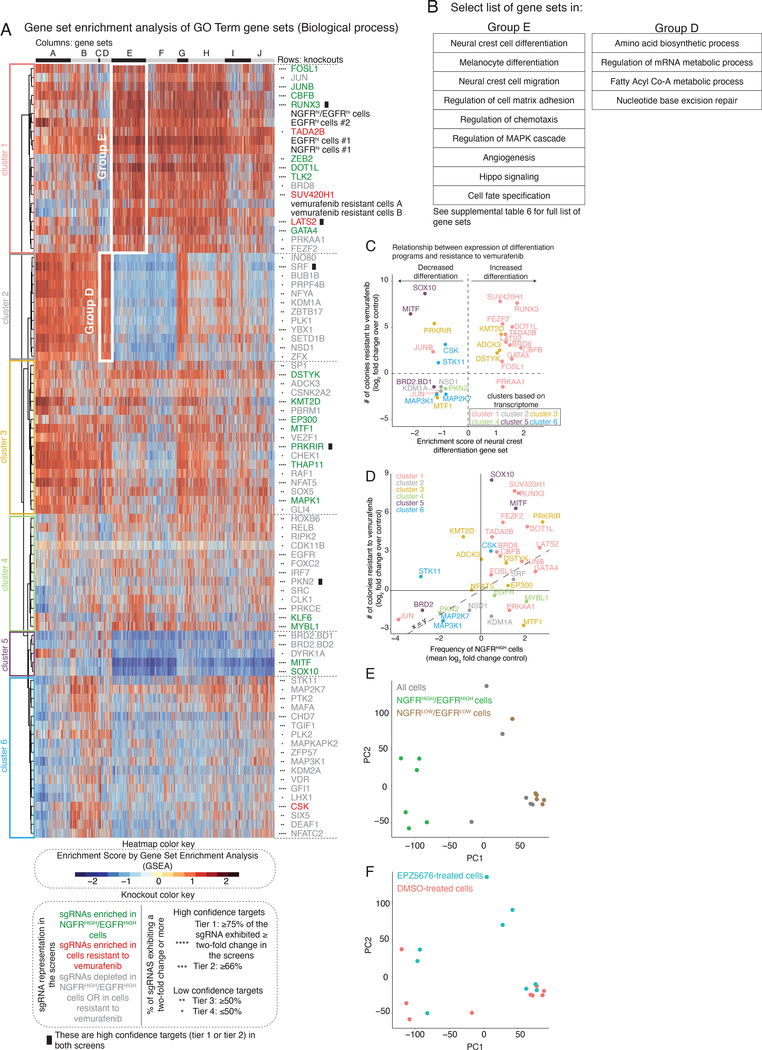
Clustering the transcriptome profiles from the different knockout cell lines (Extended Data Fig. 10a) showed that, while the transcriptomes induced by some gene knockouts were clearly distinct (such as MITF, SOX10 and KDM1A), many others appeared to show only relatively small differences from the parental cell line. We reasoned that, while the sets of differentially expressed genes may be non-overlapping, they could still belong to the same pathway. Using the transcriptome of each knockout, we performed a gene set enrichment analysis (GSEA, see Methods) and obtained an enrichment score for biological processes from the Gene Ontology (GO) terms database (Fig. 5a)41. Using these enrichment scores, the knockout lines clustered in a more coherent pattern. Notable associations include cluster 5, containing the canonical melanocyte master regulators MITF and SOX10, and cluster 1, containing DOT1L, LATS2, RUNX3 and GATA4.
Figure 5 |. Gene set enrichment analysis of the transcriptional effects induced by the knockout of select screen targets.
a, The heatmap represents biclustering analysis of different knockout cell lines (rows) based on the Gene Set Enrichment Analysis score of Gene Ontology gene sets (Biological process GO terms, columns in heatmap). Within the heatmap, red indicates enrichment in the sense that there are more differentially upregulated genes in knockout vs. control in that gene set than expected by chance, whereas blue indicates enrichment of downregulated genes (shade indicates degree of enrichment). Each target knockout (rows) represents transcriptomes of biological triplicates (unless otherwise stated in Supplementary Table 4). Target labels (rows) in green indicate genes whose knockout increased the frequency of NGFRHIGH/EGFRHIGH cells in the screen, while red indicates targets whose knockout increased the number of cells resistant to vemurafenib, and gray indicates targets that decreased the frequency of either NGFRHIGH/EGFRHIGH cells or of cells resistant to vemurafenib. As before, we organized targets into high confidence hits (Tier 1 and Tier 2) and low confidence hits (Tiers 3 and Tier 4) based on the percentage of single guide RNAs against a target that showed at least a two-fold change in the initial screen (see knockout color key). The asterisks next to the label indicate the tier (Tier 1, ****; Tier 2, ***; Tier 3, **; Tier 4, *). Information regarding validation rates of each tier can be found in Extended Data Figures 8 and 9. Based on the dendrogram on the left, we grouped targets into six clusters. We also clustered gene sets (columns) into groups, labeled by the letters on top of the heatmap. The white boxes inside the heatmap demark groups of gene sets specifically upregulated in a given cluster. b, Select list of gene sets in groups D and E from a. For a complete list of gene sets within each group, see Supplementary Table 6. c, Relationship between the expression of genes involved in neural crest differentiation (x-axis) and the number of colonies resistant to vemurafenib (y-axis) following the knockout of a target. For each knockout, we plot the expression of neural crest differentiation genes as the enrichment score obtained through gene set enrichment analysis for the neural crest differentiation gene set (GO term). We quantified the log2(fold change) in the number of resistant colonies in the knockout cell line as compared to the non-targeting control cell lines. Colors represent the cluster grouping of each knockout based on a. d, Relationship between the frequency of NGFRHIGH cells (x-axis) and the number of resistant colonies (y-axis). We plot the frequency of NGFRHIGH cells as the median log2(fold change) over three replicates in the number of NGFRHIGH cells following knockout of the indicated gene normalized by cells with non-targeting single guide RNAs. (For variability of the effect size across replicates of a given target, see Extended Data Fig. 5.) We quantified the log2(fold change) in the number of resistant colonies in the knockout cell line as compared to the non-targeting control cell lines. We color-coded all targets by groupings based on their transcriptomes (see a) following knockout of the gene indicated. e,f, We performed principal component analysis of the transcriptome of different subpopulations of primed and unprimed cells, in either control melanoma populations, or in cells where we inhibited DOT1L. We used as input the gene expression levels of all expressed genes (normalized to reads per million) to identify primary axes that account for the greatest degree of transcriptome variability between these populations of cells. In e, the color indicates the phenotype of the population, meaning a mixture of all the melanoma cells (gray), only cells expressing NGFR and EGFR (green), or only cells with low levels of NGFR and EGFR (brown). In f, the color indicates whether the cells were pre-treated with the DOT1L inhibitor EPZ5676 (blue) or with DMSO (pink).
Interestingly, knocking out MITF and SOX10 increased drug resistance, as did knocking out most members of cluster 1, but the transcriptome profiles of these two clusters appeared to be roughly opposite of each other. The GO gene sets in Group E, which appeared maximally different between MITF/SOX10 and cluster 1, included several related to differentiation, including sets for melanocyte differentiation and neural crest differentiation (Fig. 5b). Knockout of MITF and SOX10 decreased the expression of these genes, matching the general consensus that drug resistance is typically driven by dedifferentiation8,26. It was thus unexpected that most elements of cluster 1 increased resistance by further promoting differentiation (Fig. 5c), suggesting a possible novel mechanism by which one could affect drug resistance; the latter has further support from the importance of timing in DOT1L inhibition (Fig. 4). This axis of differentiation was coordinated across several gene sets (Extended Data Fig. 10b). (Note that the role of MITF in therapy resistance is complex in general42.)
The knockout of targets that led to differentiation and de-differentiation had characteristic changes in priming and resistance. Knockouts in cluster 1 (differentiation) mimicked many aspects of the transcriptomes of NGFRHIGH, EGFRHIGH, NGFRHIGH/EGFRHIGH, and even vemurafenib-resistant melanoma cells (expression of genes involved in cell-matrix adhesion, angiogenesis, and cell migration; Fig. 5a,b). Knockouts of these targets showed a strong and often proportional correspondence between the frequency of NGFRHIGH cells and the number of colonies that developed under BRAF inhibition, suggesting that the increase/decrease in the frequency of primed cells was the cause of increased/decreased resistance (Fig. 5d) (e.g. LATS2, JUNB, FOSL1, and CBFB). For MITF and SOX10 (cluster 5), however, the frequency of NGFRHIGH cells did not change nearly as much as the number of resistant colonies.
Different categories of knockouts resulted in a reduction (as opposed to increase) of the number of resistant colonies. Some resistance-reducing knockouts (BRD8 and PRKAA1) clustered with DOT1L, while another (BRD2) clustered with MITF/SOX10. It is possible that these factors work in inverse ways to reduce drug resistance by either affecting differentiation or dedifferentiation. Meanwhile, the majority of resistance reducing knockouts appeared to cluster separately. Cluster 2 was associated with metabolism (e.g. biosynthesis of amino acids and acylCoA metabolism), suggesting that metabolic processes may reduce drug resistance (Supplementary Table 6). The other clusters did not show any coherent set of biological processes affected (e.g. SRC, IRF7, PKN2, among others).
We also wanted to check what inhibiting these factors did to the transcriptomes of specifically the NGFRHIGH/EGFRHIGH cells. We isolated NGFRHIGH/EGFRHIGH cells both from WM989-A6-G3 cells pre-treated with a DOT1L inhibitor (pinometostat) and from WM989-A6-G3 cells pre-treated with DMSO and then measured the transcriptomes of these subpopulations. A principal component analysis of these transcriptomes showed that DOT1L inhibition led to newly primed cells that were transcriptionally similar to the primed cells in the DMSO-treated population (which we extensively explored and described in Shaffer et al.), suggesting that the changes we induced indeed led to new primed cells that are transcriptomically similar to those in non-DOT1L inhibited cells (Fig. 5e,f).
Discussion
We have here demonstrated, using high-throughput genetic screening, that there are genetic factors that can alter cellular plasticity in cancer cells, thereby affecting their resistance to targeted therapeutics. These factors revealed new vulnerabilities beyond conventional genetic screens, demonstrating the potential of screens designed to target cellular priming. Drug screens targeting gene expression “noise” have also shown similar therapeutic potential43.
Some priming factors (SOX10, MITF) play critical roles in differentiation and drug resistance26,30–32, while others (LATS2, RUNX3) are involved in “stemness” and drug resistance37,44,45. Note, however, that no single factor or pathway dominated, i.e., there was no “smoking gun”. This may be the result of the fact that our screen did not target all potential regulators. Alternatively, it may be that the biology of cellular variability is intrinsically multifactorial15.
The technical challenges associated with performing rare-cell screens at full depth provides motivation for screening for priming. In principle, a resistance screen would reveal all factors affecting resistance, including those that affect priming, but there was relatively little overlap between our priming and resistance screens. The fact that the majority of the genes identified in our priming screen did in fact affect resistance when tested individually suggests that they may have been identified were it possible to run resistance screens to saturation.
Knocking out some factors led to discordant changes in the frequency of NGFRHIGH cells and resistant colonies. The former may primarily affect cellular priming—i.e., the cellular state—while the latter may affect the mapping between initial cellular states and their fates upon addition of vemurafenib. (Here, the “mapping” refers to the connections between states like “AXLHIGH” and fates like “drug resistant” or “drug sensitive”.) In one simple model, cells occupy a distribution of states, and those above a threshold survive drug and those below do not (Fig. 6). In this model, some knockouts may alter the distribution of cells in the initial population, or the threshold itself, or some combination of both. It is wise to caution against this simple interpretation, however. NGFR expression is just a marker for the primed state, and factors may affect the frequency of primed cells without showing any effect on NGFR expression. (Arguing against this is the fact that the transcriptomes of knockouts such as DOT1L that increase the frequency of NGFR and resistance appear to be similar to the profile of NGFRHIGH cells themselves; Fig. 5a). It is also likely that there are a number of different types of resistant cells (anecdotally, we have noticed that resistant cells from some of our knockout lines do appear morphologically different). Such results suggest a mapping from a continuum of initial cellular states to multiple cellular fates.
Figure 6 |. Model of survival threshold and cellular priming in the development of resistance to targeted therapies.
Variability in the expression of various markers are associated with an individual cell’s probability to survive drug treatment. In one simple model, cellular variability occurs along a single ordinate, which can be conceptualized as the degree of “greenness”. In this model, there is a threshold (red line, top panel) that divides cells along this axis into those that adapt to the drug and become resistant vs. those that no longer proliferate when challenged with drug. Here, there are at least two ways by which one could conceivably alter the number of cells that survive the drug. In one scenario (middle), the distribution of “greenness” could change, leading to more cells being above the threshold, leading to more resistant colonies. In another scenario, the distribution of phenotypes remains unchanged, but the threshold itself moves, also leading to more resistant colonies. Our results suggest (but do not prove) that both scenarios may play out to varying degrees as a result of different genes being knocked out.
We have observed similar rare-cell variability in primary melanocytes14, raising the possibility that the same variability may also play a role in normal biological processes. The factors we have isolated may play a role in regulating variability in these normal biological contexts. Uncovering the regulators of the mapping between variable cellular states and ultimate phenotypic fates may prove fruitful, both conceptually and practically.
Online Methods
Cell culture.
We obtained patient-derived melanoma cells (WM989 and 451Lu, female and male, respectively) from the lab of Meenhard Herlyn. Both the WM989 and the 451Lu cell lines contain the V600E mutation at codon 600 in the BRAF gene. This mutation causes constitutively active kinase activity and activation of the MEK and ERK signaling pathway. The WM989 cell line expresses wild-type N-RAS, c-KIT, and CDK4. 451Lu is wild-type for PTEN, N-RAS, c-KIT, and CDK4. For WM989, we derived a single cell subclone (A6-G3) in our lab14. We grew these cells at 37 °C in Tu2% media (78% MCDB, 20% Leibovitz’s L-15 media, 2% FBS, and 1.68 mM CaCl2). We authenticated all cell lines via Human STR profiling. We periodically tested all cell lines for mycoplasma infections.
Plasmid construction and single guide RNA cloning.
All the Cas9-positive melanoma cell lines in this study were derived by lentiviral transduction with a Cas9 expression vector (EFS-Cas9-P2A-Puro, Addgene: 108100). All the single guide RNAs were cloned into a lentiviral expression vector LRG2.1 (Addgene: #108098), which contains an optimized single guide RNA backbone. The annealed single guide RNA oligos were T4 ligated to the BsmB1-digested LRG2.1 vector. To improve U6 promoter transcription efficiency, an additional 5’ G nucleotide was added to all single guide RNA oligo designs that did not already start with a 5’ G.
Construction of domain-focused single guide RNA pooled library.
Gene lists of transcription factors, kinases, and epigenetic regulators in the human genome were manually curated based on the presence of DNA binding domain(s), kinase domains, and epigenetic enzymatic/reader domains. The protein domain sequence information was retrieved from NCBI Conserved Domains Database. Approximately six independent single guide RNAs were designed against individual DNA binding domains (Supplementary Tables 1–3)27–29. The design principle of single guide RNA was based on previous reports, and the single guide RNAs with the predicted high off-target effect were excluded46. For the initial pooled CRISPR screens, all of the single guide RNAs oligos, including positive and negative control single guide RNAs, were synthesized in a pooled format (Twist Bioscience) and then amplified by PCR. PCR amplified products were cloned into BsmB1-digested LRG2.1 vector using Gibson Assembly kit (NEB#E2611). For the targeted pooled validation screens, individual single guide RNAs were synthesized, cloned, and verified via Sanger sequencing in a 96-well array platform (Supplementary Table 5). Individual single guide RNAs were pooled together in an equal molar ratio. To verify the identity and relative representation of single guide RNAs in the pooled plasmids, a deep-sequencing analysis was performed on a MiSeq instrument (Illumina) and confirmed that 100% of the designed single guide RNAs were cloned in the LRG2.1 vector and the abundance of >95% of individual single guide RNA constructs was within 5-fold of the mean (data not shown).
Lentivirus preparation.
We produced lentivirus containing single guide RNAs using HEK293T cells cultured in DMEM supplemented with 10% fetal bovine serum and 1% penicillin/streptomycin. When the cells reached 90–100% confluency, we mixed the single guide RNA vectors with the packaging vector psPAX2 and envelope vector pVSV-G in a 4:3:2 ratio in OPTI-MEM (ThermoFisher Scientific: #31985070) and polyethylenimine (PEI, Polysciences: #23966). We collected viral supernatants for up to 72 hours twice daily.
Transduction of spCas9.
We introduced the stable expression of spCas9 via spinfection of lentivirus along with 5 μg/ml polybrene for 25 min at 1,750 rpm. We exchanged the media ~6 h post-transduction and selected for cells expressing spCas9 via puromycin selection (1–2 μg/ml, 1 week). For WM989-A6-G3, we generated two cell lines, WM989-A6-G3-Cas9 and WM989-A6-G3-Cas9–5a3, the latter being a single cell isolate of the bulk Cas9-expressing population. We verified that this cell line remained sensitive to PLX4032, that it still contained primed cells marked by the expression of drug-resistance markers, and that it was capable of editing the genome (Extended Data Fig. 2). Following the same methodology, we generated a 451Lu-Cas9 cell line from 451Lu cells.
Transduction of lentivirus containing single guide RNAs.
For transfection of melanoma cells, we infected cells with lentivirus and 5 μg/ml polybrene for 25 min at 1,750 rpm. We exchanged the media ~6 h post-transfection. We quantified the percent of the population transfected by measuring the number of GFP-positive cells at day 5 post-transfection. For the screens, we aimed to transfect 30% of the population. For all other experiments, we aimed to transfect >95% of the population.
Initial pooled CRISPR screens.
We worked with three main pooled single guide RNA libraries in WM989-A6-G3-Cas9–5a3 cells. These libraries targeted ~2,000 different kinases, transcription factors, and proteins involved in epigenetic regulation. In total, the libraries contained ~13,000 different single guide RNAs including non-targeting and cell-viability editing controls (Supplementary Tables 1–3). We aimed to transfect > 1,000 cells per single guide RNA and isolated ~1,000 cells per single guide RNA about a week post-transfection and prior to any selection. These baselines allowed us to validate the efficiency of our screen by single guide RNA enrichment/depletion of non-targeting controls and of controls that affect cell viability (Extended Data Fig. 2). Additionally, these baselines helped us identify single guide RNAs with lethal effects in our cells. Given that we were interested in rare cell phenotypes that exist in 1:2,000 cells or less, throughout our screens we significantly expanded the population of cells to 50,000–250,000 cells per single guide RNA, often surpassing a billion cells per screen. This scale allowed us to observe the rare cell phenotypes dozens-to-hundreds of times in each of our controls (and in each of our single guide RNAs).
The priming screen aimed to identify perturbations that altered the frequency of NGFRHIGH/EGFRHIGH cells. To this end, one month after we transfected and expanded the cells, we isolated the NGFRHIGH/EGFRHIGH cells via magnetic cell sorting (MACS) followed by fluorescence-activated cell sorting (FACS) (see below). We also collected an additional ~1,000 cells per single guide RNA, without any selection, for comparison. Then, we isolated DNA from the cells and built sequencing libraries (see below) to quantify the representation of each single guide RNA in the NGFRHIGH/EGFRHIGH population and compare it to the unsorted baseline.
In the resistance screen, we aimed to identify proteins important for the development of resistance to vemurafenib. Here, we treated the cells as above, except that instead of isolating NGFRHIGH/EGFRHIGH cells we grew cells resistant to vemurafenib (see below) by exposing the cells to vemurafenib for three weeks. As above, we isolated DNA from the resulting population of cells and built sequencing libraries to quantify the representation of each single guide RNA. The raw output of all screens was reads per single guide RNA.
To select hits in our screens, we first normalized the output of our screens to reads per million, and then calculated the fold change in single guide RNA representation between different samples. For our priming screen, we focused on the fold change in single guide RNA representation between NGFRHIGH/EGFRHIGH cells and the bulk population of melanoma cells. For the resistance screen, we focused on the fold change in single guide RNA representation between cells treated for three weeks with 1 μM vemurafenib (a BRAFV600E inhibitor) and cells never exposed to the drug. After normalizing the change in single guide RNA representation of each single guide RNA by the median change across all single guide RNAs, we organized our hits into tiers (1 through 4) based on the percent of single guide RNAs against the target exhibiting at least a two-fold change in representation. We considered high confidence hits those targets where (i) ≥ 75% (Tier 1) or ≥ 66% (Tier 2) of its single guide RNAs showed at least a two-fold enrichment/depletion throughout the screen, and (ii) no two single guide RNAs showed a significant change (two-fold change) in opposing directions (i.e. one single guide RNA is significantly enriched in the selected population while another one is significantly depleted). Other targets that showed a two-fold enrichment/depletion throughout the screen, but in less than 66% of its single guide RNAs, were considered lower confidence hits (Tier 3 and Tier 4). Note that we excluded from analysis any single guide RNA with less than 10 raw reads in all samples.
Secondary, targeted pooled CRISPR screen.
To validate the replicability and generality of our hits, we designed a pool of single guide RNAs for targeted screening that targeted proteins that either emerged as hits in our initial screens or did not pass our hit-selection criteria but changed the frequency of NGFRHIGH/EGFRHIGH cells or the frequency of cells resistant to vemurafenib (Supplementary Table 5). In this pool, we included ~3 single guide RNAs per protein target, and carried out the screen in WM989-A6-G3-Cas9–5a3 cells as well as in another BRAFV600E melanoma cell line, 451Lu-Cas9. As before, we conducted a priming screen where we isolated NGFRHIGH/EGFRHIGH cells as well as a resistance screen where we exposed cells to 1 μM vemurafenib for three weeks. Here too we first normalized the output of our screens to reads per million, and then calculated the fold change in single guide RNA representation between different samples. Unlike on our initial screens, here we normalized the change in single guide RNA representation to the median change in representation of the 10 non-targeting single guide RNA controls included in the screen.
Tumor growth assays in xenografts.
All animal experiments were approved by the Institutional Animal Care and Use Committee (IACUC) (IACUC #112503X_0) and were performed in an Association for the Assessment and Accreditation of Laboratory Animal Care (AAALAC) accredited facility. WM989-A6-G3-Cas9–5a3 human melanoma cells (1 × 10⁶ cells) suspended in 100 μl of PBS were subcutaneously injected into 8-week-old NOD/SCID mice (Charles River Laboratories). When resulting tumors reached 150 mm3, mice were fed either AIN-76A chow (untreated group, placebo) or AIN-76A chow containing 417 mg/kg PLX4720 (treated group). Tumor sizes were measured every 3–4 days using digital calipers, and tumor volumes were calculated using the following formula: volume = 0.5 × (length × width2). Mice were euthanized when tumors reached ~1,500 mm3 or upon development of skin necrosis. Throughout this time, the animal facility holding rooms were maintained between 70–73 °F and a humidity of 30–35%. The animal holding room light schedules were on a 12 h on and a 12 h off schedule with lights coming on at 6:00 am and off at 6:00 pm.
To assess growth differences between knockout and control tumors, we first quantified for each mouse the change in tumor size from the initial time point to the time point in question as a log2 fold change in tumor volume. We determined statistical significance of the differences observed between a knockout and controls at each therapy timepoint with a one-tailed t-test. For each knockout cell line, we then calculated the mean tumor volume and standard error of the mean, which we report in Figure 3. Note that within a given knockout-to-control comparison within each of the treatment arms we defined the endpoint as the last point in time at which the number of mice in each group (knockout and control cell line) is at least three. The n at each timepoint and the respective P value are presented in Supplementary Table 7.
Immunostaining.
For NGFR staining of fixed cells, after fixation and permeabilization, we washed the cells for 10 min with 0.1% BSA-PBS, and then stained the cells for 10 min with 1:500 anti-NGFR APC-labelled clone ME20.4 (Biolegend, 345107). After two final washes with PBS, we kept the cells in PBS. For EGFR and NGFR staining of live cells, we incubated melanoma cells in suspension for 1 h at 4 °C with 1:200 mouse anti-EGFR antibody, clone 225 (Millipore, MABF120) in 0.1% BSA PBS. We then washed twice with 0.1% PBS-BSA and then incubated for 30 min at 4 °C with 1:500 donkey anti-mouse IgG-Alexa Cy3 (Jackson Laboratories, 715–545-150). We washed the cells again (twice) with 0.1% BSA-PBA and incubated for 10 min with 1:500 anti-NGFR APC-labelled clone ME20.4 (Biolegend, 345107). We again washed the cells twice with 0.1% BSA-PBS and finally re-suspended them in 1% BSA-PBS.
Isolation of NGFRHIGH/EGFRHIGH cells.
To enrich for NGFRHIGH/EGFRHIGH cells, we first immunostained melanoma cells as detailed above. Then, we used a Manual Separator for Magnetic Cell Isolation (MACS, with LS columns and Anti-APC microbeads). In short, following the manufacturer’s instructions, we incubated cells and microbeads at 4 °C for 15 min, then washed and pelleted the cells via centrifugation. After resuspending the cells, we passed them through LS magnetic columns. After enriching for NGFRHIGH cells, we proceeded to select only the cells expressing both NGFR and EGFR via Fluorescent-Activated Cell Sorting (FACS, MoFlo Astrios EQ).
Growth of resistant colonies.
To grow melanoma cells resistant to BRAFV600E inhibition, we exposed melanoma cells to 1 μM vemurafenib (PLX4032, Selleckchem S1267) for 2–3 weeks. For the BRAFV600E and MEK co-inhibition assays, we also used dabrafenib at 500 nM and 100 nM (GSK2118436, Selleckchem S2807), trametinib at 5 nM and 1 nM (GSK1120212, Selleckchem S2673), and cobimetinib at 10 nM and 1 nM (GDC-0973, Selleckchem S8041).
Inhibition of DOT1L via small molecule inhibitor.
For all assays involving pharmacological inhibition of DOT1L, we used pinometostat at concentrations ranging from 1 μM to 5 μM (EPZ5676, Selleckchem S.7062).
MiSeq library construction and sequencing.
In order to quantify the single guide RNA representation following selection in our screen, we sequenced the single guide RNAs as per Shi et al.47. In short, we isolated genomic DNA using the Quick-DNA Midiprep Plus Kit (Zymo Research: #D4075) per manufacturer specifications. We then PCR-amplified the single guide RNAs using Phusion Flash High Fidelity Master Mix Polymerase (Thermo Scientific: #F-548L) and primers that incorporate a barcode and a sequencing adaptor to the amplicon. Our amplification strategy consisted of an initial round of parallel PCRs (23–29 cycles of up to 200 parallel reactions per sample. We then pooled the PCR reactions and purified them using the NucleoSpin® Gel and PCR Clean-up kit (Macherey-Nagel: #740609.250). We continued with eight PCR cycles using Phusion Flash High Fidelity Master Mix Polymerase, followed by column purification with the QIAquick PCR Purification Kit (QIAGEN: #28106). We quantified the single guide RNA libraries with the DNA 1000 Kit (Agilent: #5067–1504) on a 2100 Bioanalyzer Instrument (Agilent: #G2939BA). We pooled the barcoded single guide RNA libraries and sequenced via 150-cycle paired-end sequencing (MiSeq Reagent Kit v3, Illumina: #MS-102–3001). We then mapped the resulting sequences to our reference single guide RNA library and proceeded to select hits.
Cell fixation and permeabilization.
For our imaging assays we fixed cells for 10 min with 4% formaldehyde and permeabilized them with 70% ethanol overnight.
Colony formation assays.
For each condition tested, we first split cells into two-to-four plates (~10–50,000 cells per well of a 6-well plate). We fixed and permeabilized one of the replicates to use as a baseline (number of cells plated before testing) and exposed the rest to the test condition. At the endpoint, we fixed and permeabilized the other rest of the samples.
Image analysis of NGFR immunostains.
We developed a custom MATLAB pipeline for counting cells and quantifying immunofluorescence signal of DAPI-stained and NGFR-stained cells (https://github.com/arjunrajlaboratory). The software stitches together a large tiled image, then uses DAPI to identify cells. Using the nuclear area, it then looks at a set of pixels near the nucleus to quantify fluorescence intensity of the NGFR staining. After quantifying the expression level of NGFR following knockout of select screen targets and of non-targeting controls, we quantified the minimum expression level needed to be considered an NGFRHIGH cell. First, we selected the top 1% highest expressors of NGFR in each of our non-targeting negative controls. Then, within that top 1%, we obtained the median expression level of the lowest expressor across all controls, and used that as a threshold to quantify the frequency of NGFRHIGH cells in each of our knockout samples. Then, we calculated the change in frequency of NGFRHIGH cells in each test condition compared to controls and obtained a median fold change and standard deviation across all samples with knockout of one same protein (~3 different biological samples per protein). In total, we targeted ~86 different proteins across ~258 different knockout biological samples.
Image analysis of colony formation.
We developed a custom MATLAB pipeline for counting cells and colonies in tiled images of DAPI-stained cells (https://github.com/arjunrajlaboratory). First, the software stitches the individual image tiles into one large image by automatically (or with user input) determining the amount of overlap between each individual image. Then, the software identifies the location of each cell in the stitched image by searching for local maxima. We then manually identify the colony boundaries and quantify the number of colonies in each sample. We then calculate the frequency of resistant colonies by dividing the number of colonies by the total number of cells present in culture prior to BRAFV600E inhibition. Finally, we scale the frequency of colonies to colonies per 10,000 cells and calculate the change in frequency between each sample and the median change across controls.
RNA-sequencing and identification of differential expression.
We sequenced mRNA in bulk from WM989-A6-G3 and WM989-A6-G3-Cas9 populations as per Shaffer et al. In addition to quantifying the transcriptome of EGFRHIGHcells, NGFRHIGH, NGFRHIGH/EGFRHIGH cells and vemurafenib-resistant cells, we quantified the transcriptional changes following the knockout of many tier 1 and tier 2 hits from both the priming and resistance screens. In addition to hits from our screens, we also quantified the transcriptome of targets that were not tier 1 or tier 2 hits, but showed a change in the frequency of NGFRHIGH/EGFRHIGH cells or of cells resistant to vemurafenib. In total, we targeted ~83 different proteins, each in triplicate (using different single guide RNAs) for a total of 280+ RNA sequencing samples. For each sample, we isolated mRNA and built sequencing libraries using the NEBNext Poly(A) mRNA Magnetic Isolation Module and NEBNext Ultra RNA Library Prep Kit for Illumina per manufacturer instructions. We then sequenced the libraries via paired-end sequencing (36×2 cycles) on a NextSeq 500. We aligned reads to hg19 and quantified reads per gene using STAR and HTSeq. We then used DEseq2 to identify differentially expressed genes.
Gene set enrichment analysis.
To identify “biological signatures” enriched or depleted following the knockout of a given target, we used the GSEA software (http://software.broadinstitute.org/gsea/index.jsp). We focused in the Biological Process ontology of the Gene Ontology gene sets (c5.bp.v6.2.symbols from https://www.gsea-msigdb.org/gsea/msigdb/collections.jsp#C5) to obtain enrichment scores.
Grouping of targets based on transcriptomic analysis.
To group targets into classes based on their transcriptional effects, we clustered all RNA-seq samples (hierarchical clustering via pheatmap in R) based on the change in expression (as obtained by DEseq2) of any gene differentially expressed (two-fold change over control, with an adjusted P ≤ 0.05) in at least one of the 83+ knockouts. We also grouped targets via pheatmap based on the enrichment scores obtained via GSEA. To identify the axes that account for the variability between each knockout, we also performed principal component analysis based on the gene set enrichment scores of each knockout. Note that in the aforementioned analysis we included the transcriptomes of primed cells (marked by the expression of EGFR alone, NGFR alone, and NGFR and EGFR in combination) and of cells resistant to vemurafenib.
Data availability.
All data used in this work can be found at https://www.dropbox.com/sh/t08558cl4mepfm6/AABBvbtlTPSNNPoMC9NTro-9a?dl=0. RNA-sequencing data are also deposited at GEO (GSE151825, GSE149280). The gene sets used for analysis were obtained at https://www.gsea-msigdb.org/gsea/msigdb/collections.jsp#C5.
Code availability.
All custom code used in this work can be found at https://github.com/edatorre/2020_TorreEtAl_data.git as well as at https://www.dropbox.com/sh/t08558cl4mepfm6/AABBvbtlTPSNNPoMC9NTro-9a?dl=0. The software used for image analysis can be found at https://github.com/arjunrajlaboratory.
Extended Data
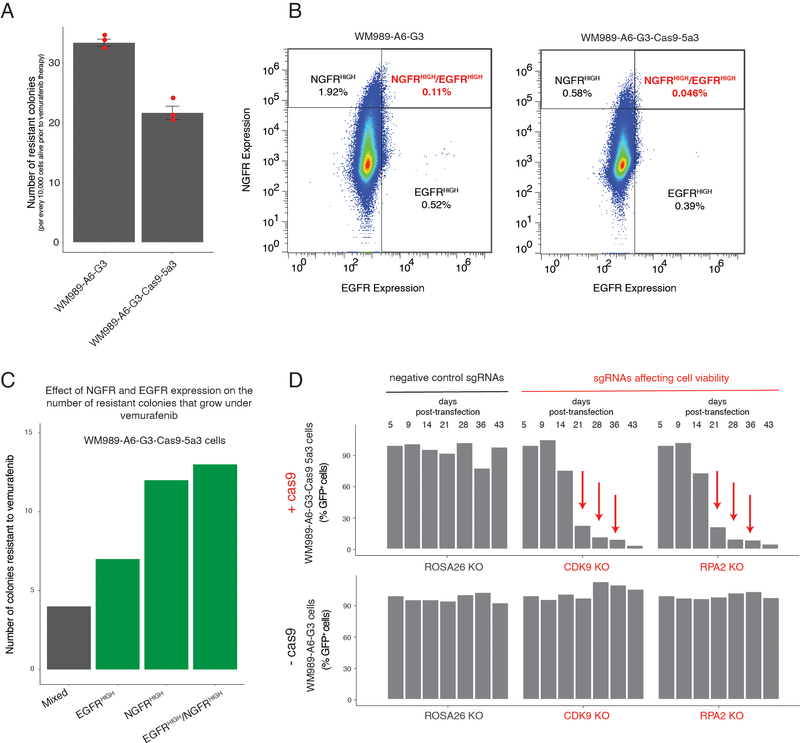
Extended Data Fig. 1. Technical validation of WM989-A6-G3-Cas9–5a3 cell line.
a, To compare the frequency of drug resistance between WM989-A6-G3 and its daughter cell line WM989-A6-G3-Cas9–5a3, we cultured an equal number of cells from each cell line in 1 μM vemurafenib for 3 weeks. Then, we counted the number of colonies that resulted from each cell line. Each dot represents the number of resistant colonies normalized to 10,000 cells alive in each sample before the addition of vemurafenib. The bars represent the mean number of colonies over triplicates, normalized to 10,000 cells alive in each sample before the addition of vemurafenib. Error bars represent the standard error of the mean. b, To compare the frequency of NGFRHIGH/EGFRHIGH cells between WM989-A6-G3 and its daughter cell line WM989-A6-G3-Cas9–5a3, we looked at the distribution of expression of NGFR and EGFR using immunofluorescence. c, WM989-A6-G3-Cas9–5a3 cells expressing NGFR, EGFR, and both NGFR and EGFR are more likely to survive and proliferate in the presence of vemurafenib14. Here we show the number of colonies that grew upon vemurafenib exposure in a mixed population of WM989-A6-G3-Cas9–5a3 or in the same population but enriched for EGFRHIGH cells, NGFRHIGH cells, or NGFRHIGH/EGFRHIGH cells. d, In this plot, we show the single guide RNA representation (as percent GFP-positive cells) of controls over time in WM989-A6-G3 cells with or without Cas9 expression. Negative controls (black) are single guide RNAs aimed at ROSA26, a non-expressing gene in human melanoma. Positive controls (red) target proteins necessary for cell viability. Only cells expressing both Cas9 and a positive control single guide RNA should disappear from the population over time.
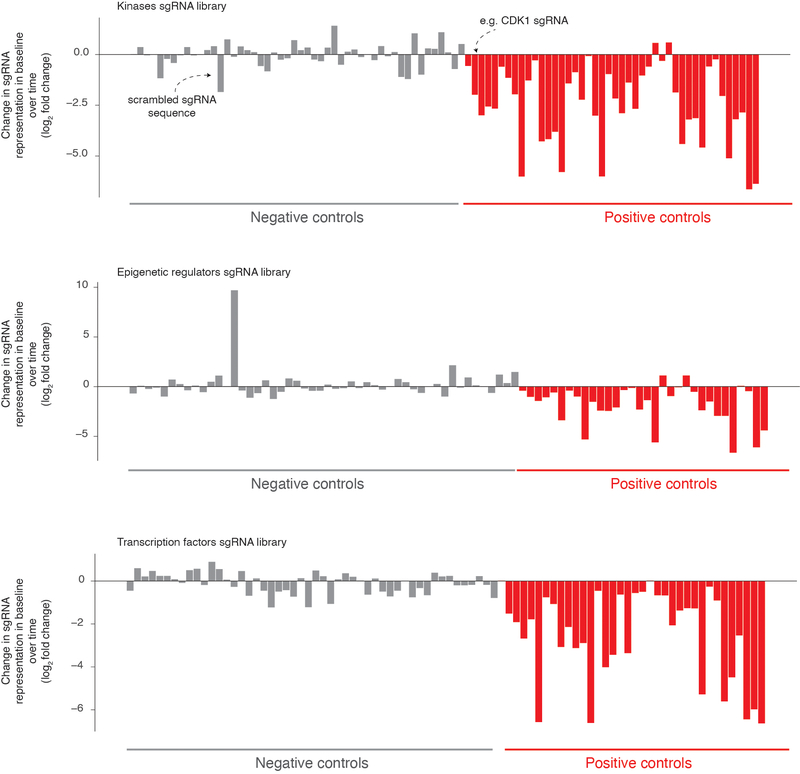
Extended Data Fig. 2: Effect of negative and positive control single RNAs in the CRISPR screens.
Our pooled CRISPR screen included non-targeting single guide RNAs as negative controls (gray bars, 50+ single guide RNAs) as well as single guide RNAs affecting cell viability as positive controls (red bars, 25+ single guide RNAs). We quantified the change in representation of these single guide RNAs over time and report the log2 fold change in representation from 6 days after transfection to right before selection (vemurafenib exposure or selection by NGFR and EGFR expression). We expect positive controls to lose representation over time more often than negative controls. Our screening scheme utilized three separate pooled single guide RNA libraries, one targeting kinases (top), another targeting epigenetic domains (middle), and a final one targeting transcription factors (bottom).
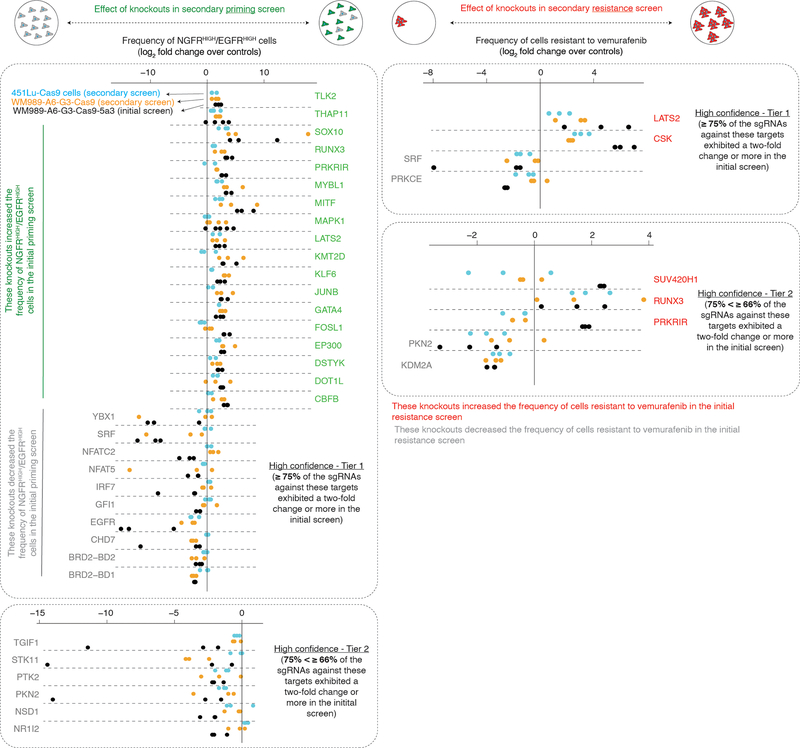
Extended Data Fig. 3: Secondary validation of hits across multiple cell lines by secondary targeted CRISPR screening.
We assessed the robustness and generality of the effect of hits identified in the priming and resistance screens (WM989-A6-G3-Cas9–5a3, black bars) by carrying out secondary priming (left) and resistance screens (right) targeting 86 different proteins in WM989-A6-G3-Cas9 (orange bars) as well as in another BRAFV600E melanoma cell line (451Lu-Cas9, blue). On the left, we plot the log2 fold change in frequency of NGFRHIGH/EGFRHIGH cells (normalized by non-targeting controls) for each sgRNA (dots) targeting 34 of the high confidence hits (Tiers 1 and 2) we identified in the priming screen. We found that 25 of the 34 high confidence hits showed at least a two fold change (as a median across sgRNA triplicates; see Supplementary Table 4) in the frequency of NGFRHIGH/EGFRHIGH cells concordant with the effects detected in the original screening clonal cell line (WM989-A6-G3-Cas9–5a3). In 451Lu-Cas9 cells, 20 of the 34 targets also showed a change in the frequency of NGFRHIGH/EGFRHIGH cells, with 11 of those exhibiting at least a two-fold change (as a median across sgRNA triplicates; see Supplementary Table 4). On the right, we plot the log2 fold change in frequency of cells resistant to vemurafenib (normalized by non-targeting controls) for each sgRNA (dots) targeting 9 of the high confidence hits (Tiers 1 and 2) identified through the resistance screen. In WM989-A6-G3-Cas9, we found that 7 of the 9 targets replicated the effect we observed originally. For 451Lu-Cas9, the same 7 factors showed similar effects. Within each plot, the color of the target label indicates the effect observed in the primary screens. See Supplementary Table 4 for the results of Tier 3 and Tier 4 targets.
Extended Data Fig. 4: Screen for factors modulating number of resistant colonies upon BRAFV600E inhibition.
a, We performed a pooled CRISPR screen to detect modulators of the number of drug-resistant cells that grow in the presence of the BRAFV600E inhibitor vemurafenib. After transducing a library of single guide RNAs and expanding the population, we exposed the cells to the BRAFV600E inhibitor vemurafenib (1 μM) for 3 weeks, after which we sequenced the single guide RNAs in the surviving population. Changes in the frequency of detection of a given single guide RNA indicates that its target may affect the ability of a cell to survive and proliferate upon BRAFV600E inhibition. b, After transfecting a population of melanoma cells, we exposed them to vemurafenib (BRAFV600E inhibitor, 1 μM) for 3 weeks to grow resistant colonies. We then sequenced the DNA to quantify the single guide RNA representation of each target in the resulting population, using the same libraries as in Figure 1. As before, we ranked the targets into tiers based on the percent of single guide RNAs that exhibited at least a two-fold change in representation throughout the screen (Tier 1, ≥ 75%; Tier 2, ≥ 66%; Tier 3, ≥ 50%; Tier 4, < 50%), thus reflecting the degree of confidence we have in the hit (High confidence hits: Tiers 1 and 2; Low confidence hits: Tiers 3 and 4). In this screen, we identified 24 high confidence factors. For a more detailed description, see the Methods section.
Extended Data Fig. 5: Validation of effects of hits from priming and resistance screens by via NGFR immunofluorescence and resistant colony formation.
a, Frequency of NGFRHIGH cells following the knockout of select targets. Dots represent the change in number of NGFRHIGH cells (as the log2 fold change over non-targeting sgRNA controls). A star indicates targets where, after excluding samples with low cell numbers (< 500 cells), n = 1. Tier refers to the degree of confidence we have in each particular hit (see Methods). We performed this analysis for hits from both the priming screen (top) and the resistance screen (bottom). 21 of 34 high confidence showed at least a 50% increase or decrease in the frequency of NGFRHIGH cells (see Supplementary Table 4). 21 of 49 targets from Tiers 3 and 4 increased or decreased the frequency of NGFRHIGH cells by ≥ 50%. b, Resistance phenotype of melanoma cells following the knockout of hits. Bars represent the log2 fold change over non-targeting control in the number colonies able to grow in vemurafenib. The number of colonies is normalized to the number of cells present before BRAFV600E inhibition (see Methods). In the left panel, we labeled in green and gray the effect a given target has on the frequency of NGFRHIGH/EGFRHIGH cells (based on the initial priming screen). In the right panel, we labeled in red and gray the effect a given target has on the number of cells that resist BRAFV600E inhibition (based on the initial resistance screen). Each bar represents one experimental replicate (see Extended Data Fig. 6b for replicates). c, These images show the effect of CSK knockout on a cell’s ability to develop resistance to BRAFV600E inhibition. We exposed CSK-knockout WM989-A6-G3-Cas9–5a3 cells to 1 μM vemurafenib for 3 weeks and counted the number of resulting colonies. The number of resistant cells is too large to accurately identify individual colonies; thus, the number of colonies reported is an underestimate.
Extended Data Fig. 6: Validation of effects of hits by resistant colony formation.
a, Effect of vemurafenib concentration on the formation of drug-resistant colonies. The dots represent the number of resistant colonies that grow after 3 weeks of treatment with 1 μM, 2 μM, or 4 μM of PLX4032 (vemurafenib). The bars represent the mean over three biological replicates. Error bars represent the standard error. At each concentration, we treated cells that contain either a non-targeting sgRNA, or a sgRNA targeting DOT1L, LATS2, or BRD2. b, Resistance phenotype of melanoma cells following the knockout of hits from the initial screens. Each bar represents the log2 fold change over non-targeting control in the number of colonies able to grow following knockout of the gene indicated. The number of colonies for each target is normalized to the number of cells present in culture before BRAFV600E inhibition, reported as number of colonies per every 10,000 pre-treatment cells (see Methods). As before, the different tiers represent the percent of single guide RNAs against a given target exhibiting at least a two-fold change throughout the initial (top) priming or (bottom) resistance screens. In the top panel, we labeled in green and gray the effect a given target has in the frequency of NGFRHIGH/EGFRHIGH cells (based on the initial priming screen). In the bottom panel, we labeled in red and gray the effect a given target has in the number of cells that resist BRAFV600E inhibition (based on the resistance screen). In this plot, each bar represents one experimental replicate (distinct from the one in Extended Data Fig. 5b).
Extended Data Fig. 7: Effect of pharmacological inhibition of DOT1L on resistance to BRAFV600E and MEK inhibition.
a, Resistance phenotype of melanoma cells following pharmacological inhibition of DOT1L. We pre-treated melanoma cells for seven days with either DMSO, or various concentrations of the DOT1L inhibitor pinometostat (EPZ5676). Then, we exposed the cells to 1 μM vemurafenib for 3 weeks. b, To assess the effect of DOT1L inhibition on cellular proliferation, we compared the population size of WM989-A6-G3 cells over time treated with either 4 μM of pinometostat (DOT1L inhibitor) or DMSO. The population size is estimated by the amount of nucleic acids present in the population using a CyQuant GR dye. The values represent mean fluorescent signal over triplicates. Error bars represent standard error of the mean. c, Resistance phenotype of melanoma cells to BRAFV600E and MEK inhibitors following pharmacological inhibition of DOT1L. We pre-treated melanoma cells for seven days with either DMSO or 4 μM of pinometostat. We then exposed the cells to one of two BRAFV600E inhibitors (vemurafenib and dabrafenib, left panels), to one of two MEK inhibitors (cobimetinib and trametinib, middle panels), or to a combination of a BRAFV600E and MEK inhibitor (vemurafenib + cobimetinib; dabrafenib + trametinib, right panels). White arrows point to a few of the many colonies that grew under each condition.
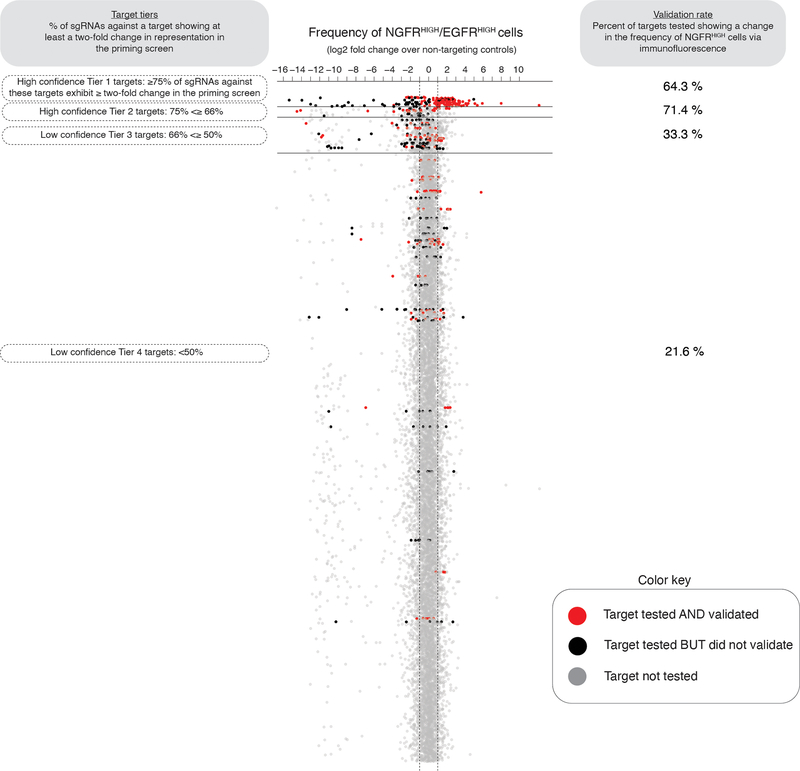
Extended Data Fig. 8: Percent of targets from the priming screen that validate.
To assess the sensitivity of our screen, we validated the effect observed in the initial priming screen for a select group of targets via NGFR immunofluorescence. Here, each dot represents an individual single guide RNA, and we plot the change in single guide RNA representation between NGFRHIGH/EGFRHIGH cells and controls (as measured in the priming screen). We then organize all sgRNAs into tiers (y-axis, Tiers 1 through 4) based on the percent of single guide RNAs against a target showing at least a two-fold change in representation on NGFRHIGH/EGFRHIGH cells. In red, we labeled targets that when tested again produced at least a 50% change in the frequency of NGFRHIGH cells. In black, we labeled targets that we tested but did not validate, and in gray we show targets we did not test. We display the percent of genes tested and validated at each tier on the right.
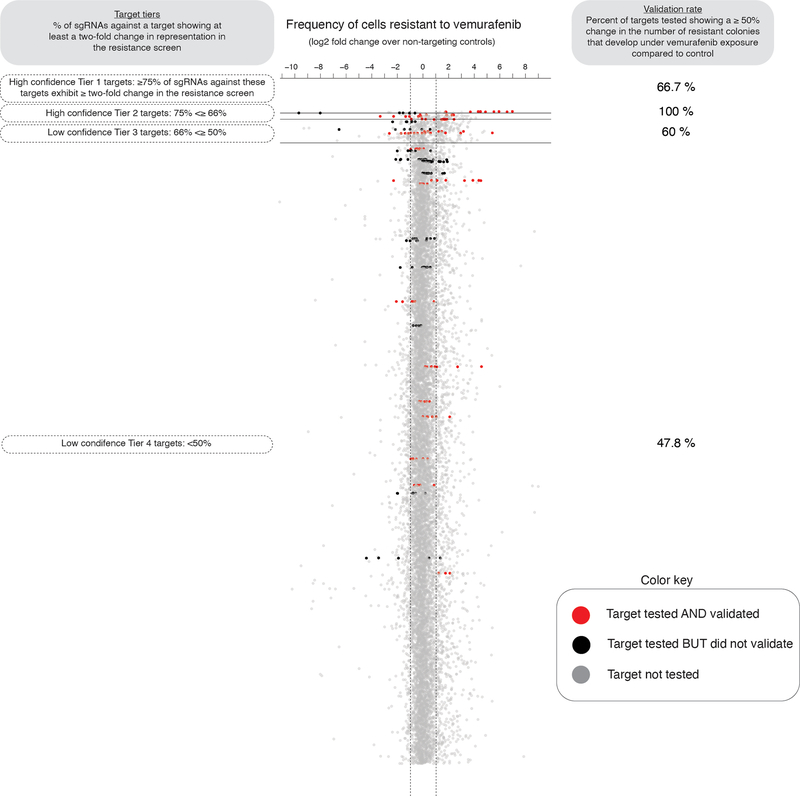
Extended Data Fig. 9: Percent of targets from the resistance screen that validate.
To assess the sensitivity of our screen, we validated the effect observed in the initial resistance screen for a select group of targets via colony formation assays. Here, each dot represents an individual single guide RNA, and we plot the change in single guide RNA representation between cells resistant to vemurafenib and cells that have never been exposed to the drug (as measured in the resistance screen). We then organize all single guide RNAs into tiers (y-axis, Tiers 1 through 4) based on the percent of single guide RNAs against a target showing at least a two-fold change in representation on drug resistant cells. In red, we labeled targets that when tested again produced at least a 50% change in the frequency colonies resistant to BRAFV600E inhibition. In black, we labeled targets that we tested but did not validate, and in gray we show targets we did not test. We display the percent of genes tested and validated at each tier on the right.
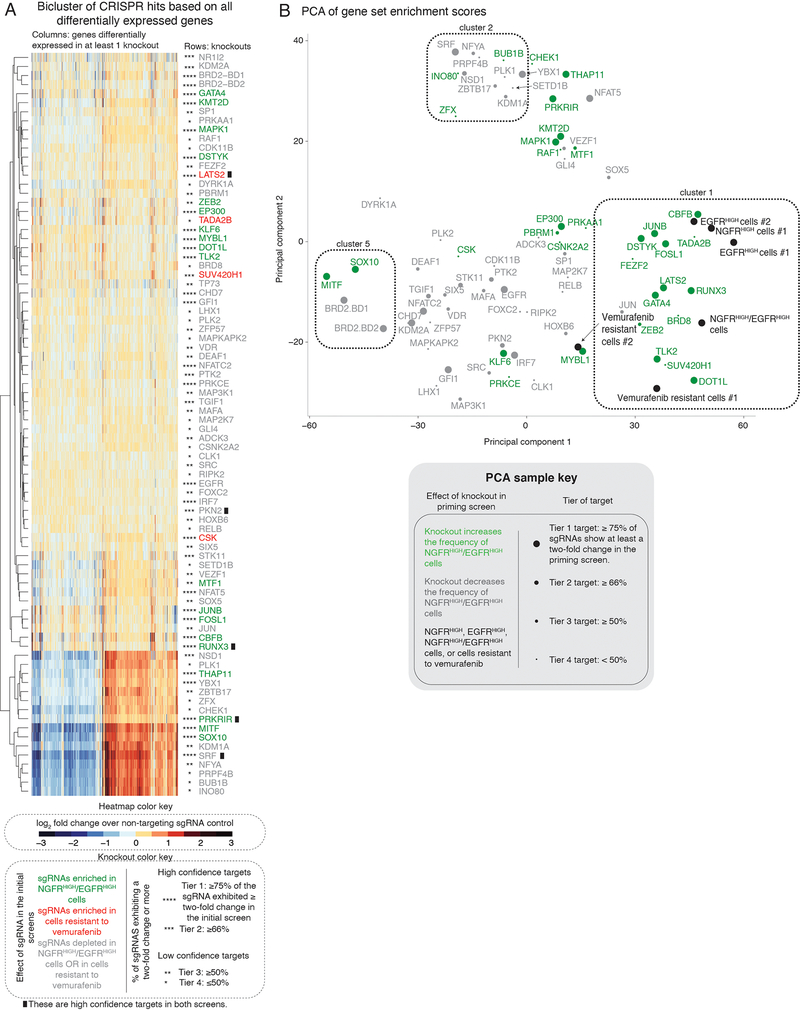
Extended Data Fig. 10: Transcriptional effects induced by knockout of select screen targets.
a, The heatmap represents the biclustering analysis of different screen targets (rows) based on the change in expression of all genes differentially expressed in at least one knockout (columns). Within the heatmap, red indicates an increase in expression following the knockout, while blue indicates a decrease in gene expression (see heatmap color key). Each target (rows) represents transcriptomes of biological triplicates (unless otherwise stated in Supplementary Table 4). Target labels (rows) in green indicate genes whose knockout increased the frequency of NGFRHIGH/EGFRHIGH cells in the initial screen. In red are those whose knockout increased the number of cells resistant to vemurafenib, and in gray are those that decreased the frequency of either NGFRHIGH/EGFRHIGH cells or of cells resistant to vemurafenib. As before, we organized targets into confidence tiers indicated by the number of asterisks, based on the percent of single guide RNAs against that target that showed an effect in the initial screen (see knockout color key). b, We performed principal component analysis of the transcriptional effects induced by the knockout of select screen targets. We used as input the gene set enrichment scores from Figure 5a to identify primary axes that account for the greatest degree of transcriptome variability across knockout cell lines. The color indicates the effect of the knockout in the initial priming screen. The size of the dot indicates the degree of confidence we have in each particular hit based on the percent of the single guide RNAs against a target that passed a threshold of two-fold change in the initial priming screen. In black, we labeled melanoma cells where we did not knockout any targets but either enriched for EGFRHIGH cells, NGFRHIGH cells, EGFRHIGH/NGFRHIGH cells, or for cells resistant to vemurafenib.
Supplementary Material
Acknowledgements
We thank Meenhard Herlyn for always providing excellent advice and guidance. We also thank the Flow Cytometry core, especially Florin Tuluc, at CHOP for all their advice and help. We also thank all members of the Raj Lab as well as John Murray for their comments and suggestions. We thank Christopher Vakoc for providing the transcription factor, epigenetic regulator, and kinase domain-focused sgRNA library. C.L.J. acknowledges NIH T32 DK007780 and F30 HG010822. B.L.E. acknowledges support from NIH training grants F30 CA236129, T32 GM007170 and T32 HG000046. S.M.S. acknowledges support from DP5 OD028144. I.A.M. acknowledges NIH/NINDS F30NS100595. A.T.W. and M.E.F. are supported by R01CA207935. A.T.W. and G.M.A. are supported by P01 CA114046, and A.T.W. is supported by CA227550, CA232256, the E.V. McCollum Chair, and a Bloomberg Distinguished Professorship. Core facilities used in this grant are supported by P30CA010815 and P30CA006973. J.S. acknowledges support from Linda Pechenik Montague Investigator Award and Cold Spring Harbor Laboratory sponsored research. A.R. acknowledges R01 CA238237, NIH/NCI PSOC award number U54 CA193417, NSF CAREER 1350601, P30 CA016520, SPORE P50 CA174523, NIH U01 CA227550, NIH 4DN U01 HL129998, NIH Center for Photogenomics (RM1 HG007743), and the Tara Miller Foundation.
Footnotes
Competing Interests
A.R. and S.M.S. receive patent royalty income from LGC/Biosearch Technologies related to Stellaris RNA FISH probes. All other authors declare no competing interests.
References
- 1.Symmons O & Raj A What’s luck got to do with it: single cells, multiple fates, and biological nondeterminism. Mol. Cell 62, 788–802 (2016). [DOI] [PMC free article] [PubMed] [Google Scholar]
- 2.Raj A & van Oudenaarden A Nature, nurture, or chance: stochastic gene expression and its consequences. Cell 135, 216–226 (2008). [DOI] [PMC free article] [PubMed] [Google Scholar]
- 3.Raj A, Rifkin SA, Andersen E & van Oudenaarden A Variability in gene expression underlies incomplete penetrance. Nature 463, 913–918 (2010). [DOI] [PMC free article] [PubMed] [Google Scholar]
- 4.Wernet MF et al. Stochastic spineless expression creates the retinal mosaic for colour vision. Nature 440, 174–180 (2006). [DOI] [PMC free article] [PubMed] [Google Scholar]
- 5.Süel GM, Kulkarni RP, Dworkin J, Garcia-Ojalvo J & Elowitz MB Tunability and noise dependence in differentiation dynamics. Science 315, 1716–1719 (2007). [DOI] [PubMed] [Google Scholar]
- 6.Maamar H, Raj A & Dubnau D Noise in gene expression determines cell fate in Bacillus subtilis. Science 317, 526–529 (2007). [DOI] [PMC free article] [PubMed] [Google Scholar]
- 7.Mojtahedi M et al. Cell fate decision as high-dimensional critical state transition. PLoS Biol. 14, e2000640 (2016). [DOI] [PMC free article] [PubMed] [Google Scholar]
- 8.Rambow F et al. Toward minimal residual disease-directed therapy in melanoma. Cell 174, 843–855.e19 (2018). [DOI] [PubMed] [Google Scholar]
- 9.Garraway LA & Jänne PA Circumventing cancer drug resistance in the era of personalized medicine. Cancer Discov 2, 214–226 (2012). [DOI] [PubMed] [Google Scholar]
- 10.Trunzer K et al. Pharmacodynamic effects and mechanisms of resistance to vemurafenib in patients with metastatic melanoma. J. Clin. Oncol 31, 1767–1774 (2013). [DOI] [PubMed] [Google Scholar]
- 11.Sharma SV et al. A chromatin-mediated reversible drug-tolerant state in cancer cell subpopulations. Cell 141, 69–80 (2010). [DOI] [PMC free article] [PubMed] [Google Scholar]
- 12.Gupta PB et al. Stochastic state transitions give rise to phenotypic equilibrium in populations of cancer cells. Cell 146, 633–644 (2011). [DOI] [PubMed] [Google Scholar]
- 13.Pisco AO & Huang S Non-genetic cancer cell plasticity and therapy-induced stemness in tumour relapse: ‘What does not kill me strengthens me’. Br. J. Cancer 112, 1725–1732 (2015). [DOI] [PMC free article] [PubMed] [Google Scholar]
- 14.Shaffer SM et al. Rare cell variability and drug-induced reprogramming as a mode of cancer drug resistance. Nature 546, 431–435 (2017). [DOI] [PMC free article] [PubMed] [Google Scholar]
- 15.Shaffer SM et al. Memory sequencing reveals heritable single cell gene expression programs associated with distinct cellular behaviors. Cell 182, 947–959.e17 (2020). [DOI] [PMC free article] [PubMed] [Google Scholar]
- 16.Cohen AA et al. Dynamic proteomics of individual cancer cells in response to a drug. Science 322, 1511–1516 (2008). [DOI] [PubMed] [Google Scholar]
- 17.Weinreb C, Rodriguez-Fraticelli A, Camargo FD & Klein AM Lineage tracing on transcriptional landscapes links state to fate during differentiation. Science 367, eaaw3381 (2020). [DOI] [PMC free article] [PubMed] [Google Scholar]
- 18.Su Y et al. Single-cell analysis resolves the cell state transition and signaling dynamics associated with melanoma drug-induced resistance. Proc. Natl. Acad. Sci. U. S. A 114, 13679–13684 (2017). [DOI] [PMC free article] [PubMed] [Google Scholar]
- 19.Fallahi-Sichani M et al. Adaptive resistance of melanoma cells to RAF inhibition via reversible induction of a slowly dividing de-differentiated state. Mol. Syst. Biol 13, 905 (2017). [DOI] [PMC free article] [PubMed] [Google Scholar]
- 20.Torre E et al. Rare cell detection by single-cell RNA sequencing as guided by single-molecule RNA FISH. Cell Syst 6, 171–179.e5 (2018). [DOI] [PMC free article] [PubMed] [Google Scholar]
- 21.Tirosh I et al. Dissecting the multicellular ecosystem of metastatic melanoma by single-cell RNA-seq. Science 352, 189–196 (2016). [DOI] [PMC free article] [PubMed] [Google Scholar]
- 22.Shalem O et al. Genome-scale CRISPR-Cas9 knockout screening in human cells. Science 343, 84–87 (2014). [DOI] [PMC free article] [PubMed] [Google Scholar]
- 23.Konermann S et al. Genome-scale transcriptional activation by an engineered CRISPR-Cas9 complex. Nature 517, 583–588 (2015). [DOI] [PMC free article] [PubMed] [Google Scholar]
- 24.Strub T et al. SIRT6 haploinsufficiency induces BRAFV600E melanoma cell resistance to MAPK inhibitors via IGF signalling. Nat. Commun 9, 3440 (2018). [DOI] [PMC free article] [PubMed] [Google Scholar]
- 25.Joung J et al. Genome-scale activation screen identifies a lncRNA locus regulating a gene neighbourhood. Nature 548, 343–346 (2017). [DOI] [PMC free article] [PubMed] [Google Scholar]
- 26.Sun C et al. Reversible and adaptive resistance to BRAF(V600E) inhibition in melanoma. Nature 508, 118–122 (2014). [DOI] [PubMed] [Google Scholar]
- 27.Huang Y-H et al. POU2F3 is a master regulator of a tuft cell-like variant of small cell lung cancer. Genes Dev 32, 915–928 (2018). [DOI] [PMC free article] [PubMed] [Google Scholar]
- 28.Tarumoto Y et al. LKB1, salt-inducible kinases, and MEF2C are linked dependencies in acute myeloid leukemia. Mol. Cell 69, 1017–1027.e6 (2018). [DOI] [PMC free article] [PubMed] [Google Scholar]
- 29.Brien GL et al. Targeted degradation of BRD9 reverses oncogenic gene expression in synovial sarcoma. Elife 7, e41305 (2018). [DOI] [PMC free article] [PubMed] [Google Scholar]
- 30.Almeida FV, Douglass SM, Fane ME & Weeraratna AT Bad company: Microenvironmentally mediated resistance to targeted therapy in melanoma. Pigment Cell Melanoma Res 32, 237–247 (2019). [DOI] [PMC free article] [PubMed] [Google Scholar]
- 31.Hartman ML & Czyz M MITF in melanoma: mechanisms behind its expression and activity. Cell. Mol. Life Sci 72, 1249–1260 (2015). [DOI] [PMC free article] [PubMed] [Google Scholar]
- 32.Wellbrock C & Arozarena I Microphthalmia-associated transcription factor in melanoma development and MAP-kinase pathway targeted therapy. Pigment Cell Melanoma Res 28, 390–406 (2015). [DOI] [PMC free article] [PubMed] [Google Scholar]
- 33.Zhu B et al. The protective role of DOT1L in UV-induced melanomagenesis. Nat. Commun 9, 259 (2018). [DOI] [PMC free article] [PubMed] [Google Scholar]
- 34.Segura MF et al. BRD4 sustains melanoma proliferation and represents a new target for epigenetic therapy. Cancer Res 73, 6264–6276 (2013). [DOI] [PMC free article] [PubMed] [Google Scholar]
- 35.Okada M, Nada S, Yamanashi Y, Yamamoto T & Nakagawa H CSK: a protein-tyrosine kinase involved in regulation of src family kinases. J. Biol. Chem 266, 24249–24252 (1991). [PubMed] [Google Scholar]
- 36.Lu L et al. Kdm2a/b lysine demethylases regulate canonical Wnt signaling by modulating the stability of nuclear β-catenin. Dev. Cell 33, 660–674 (2015). [DOI] [PubMed] [Google Scholar]
- 37.Harvey KF, Zhang X & Thomas DM The Hippo pathway and human cancer. Nat. Rev. Cancer 13, 246–257 (2013). [DOI] [PubMed] [Google Scholar]
- 38.Kaur A et al. sFRP2 in the aged microenvironment drives melanoma metastasis and therapy resistance. Nature 532, 250–254 (2016). [DOI] [PMC free article] [PubMed] [Google Scholar]
- 39.Daigle SR et al. Selective killing of mixed lineage leukemia cells by a potent small-molecule DOT1L inhibitor. Cancer Cell 20, 53–65 (2011). [DOI] [PMC free article] [PubMed] [Google Scholar]
- 40.Basavapathruni A et al. Conformational adaptation drives potent, selective and durable inhibition of the human protein methyltransferase DOT1L. Chem. Biol. Drug Des 80, 971–980 (2012). [DOI] [PubMed] [Google Scholar]
- 41.Subramanian A et al. Gene set enrichment analysis: a knowledge-based approach for interpreting genome-wide expression profiles. Proc. Natl. Acad. Sci. U. S. A 102, 15545–15550 (2005). [DOI] [PMC free article] [PubMed] [Google Scholar]
- 42.Bai X, Fisher DE & Flaherty KT Cell-state dynamics and therapeutic resistance in melanoma from the perspective of MITF and IFNγ pathways. Nat. Rev. Clin. Oncol 16, 549–562 (2019). [DOI] [PMC free article] [PubMed] [Google Scholar]
- 43.Dar RD, Hosmane NN, Arkin MR, Siliciano RF & Weinberger LS Screening for noise in gene expression identifies drug synergies. Science 344, 1392–1396 (2014). [DOI] [PMC free article] [PubMed] [Google Scholar]
- 44.Aylon Y, Sarver A, Tovy A, Ainbinder E & Oren M Lats2 is critical for the pluripotency and proper differentiation of stem cells. Cell Death Differ 21, 624–633 (2014). [DOI] [PMC free article] [PubMed] [Google Scholar]
- 45.Kulkarni M et al. RUNX1 and RUNX3 protect against YAP-mediated EMT, stem-ness and shorter survival outcomes in breast cancer. Oncotarget 9, 14175–14192 (2018). [DOI] [PMC free article] [PubMed] [Google Scholar]
Methods-only references
- 46.Hsu PD et al. DNA targeting specificity of RNA-guided Cas9 nucleases. Nat. Biotechnol 31, 827–832 (2013). [DOI] [PMC free article] [PubMed] [Google Scholar]
- 47.Shi J et al. Discovery of cancer drug targets by CRISPR-Cas9 screening of protein domains. Nat. Biotechnol 33, 661–667 (2015). [DOI] [PMC free article] [PubMed] [Google Scholar]
Associated Data
This section collects any data citations, data availability statements, or supplementary materials included in this article.
Supplementary Materials
Data Availability Statement
All data used in this work can be found at https://www.dropbox.com/sh/t08558cl4mepfm6/AABBvbtlTPSNNPoMC9NTro-9a?dl=0. RNA-sequencing data are also deposited at GEO (GSE151825, GSE149280). The gene sets used for analysis were obtained at https://www.gsea-msigdb.org/gsea/msigdb/collections.jsp#C5.


