

Abstract
Phosphatidylinositol transfer proteins (PITPs) regulate the interface between lipid metabolism and cellular functions. We now report that ablation of PITPα function leads to aponecrotic spinocerebellar disease, hypoglycemia, and intestinal and hepatic steatosis in mice. The data indicate that hypoglycemia is in part associated with reduced proglucagon gene expression and glycogenolysis that result from pancreatic islet cell defects. The intestinal and hepatic steatosis results from the intracellular accumulation of neutral lipid and free fatty acid mass in these organs and suggests defective trafficking of triglycerides and diacylglycerols from the endoplasmic reticulum. We propose that deranged intestinal and hepatic lipid metabolism and defective proglucagon gene expression contribute to hypoglycemia in PITPα−/− mice, and that hypoglycemia is a significant contributing factor in the onset of spinocerebellar disease. Taken together, the data suggest an unanticipated role for PITPα in with glucose homeostasis and in mammalian endoplasmic reticulum functions that interface with transport of specific luminal lipid cargoes.
PITPs1 mobilize PtdIns or PtdCho between membrane bilayers in vitro (1, 2). In vivo studies demonstrate that PITPs control the interface between membrane trafficking and lipid metabolic pathways in yeast (3–6). By contrast, the physiological functions for mammalian PITPs, which are structurally unrelated to yeast PITPs (7, 8), are not understood at either the cellular or organismal levels.
Mammals express at least three soluble PITPs: PITPα, PITPβ, and rdgBβ (9–11). PITPα and PITPβ share 77% primary sequence identity, are encoded by distinct genes, and exhibit biochemical differences. Yet both PITPα and PITPβ (and even yeast PITPs) function as soluble factors that stimulate various reconstitutions of PIP-dependent functions in permeabilized mammalian cells. These functions include regulated and constitutive membrane trafficking and phospholipase C-dependent signaling through G-protein-coupled receptors (12–14). Given the lack of PITP specificity in these assays, it remains unclear how faithful such reconstitutions are in reporting physiological functions for mammalian PITPs.
Genetic studies are providing initial clues regarding PITP function in metazoans. An inherited form of light-enhanced retinal degeneration in Drosophila results from inactivation of a membrane-bound PITP (15). In mice, reduction of PITPα to 18% of wild-type levels is the basis for the vibrator neurodegenerative disorder (16, 26). Gene ablation approaches suggest PITPβ plays an essential housekeeping function, whereas PITPα is nonessential for ES cell viability and is not a quantitatively significant factor in membrane trafficking, PIP metabolism, or growth factor signaling in ES cells (17).
In this report, we describe the consequences associated with ablation of PITPα function in the mouse. We find that PITPα, although dispensable for prenatal development, is required for neonatal survival. PITPα−/− neonates suffer from a severe spinocerebellar neurodegenerative disease and exhibit defects in dietary fat and α-tocopherol transport across the small intestine. This intestinal steatosis in some respects resembles CRD, a human disorder of unknown molecular etiology (18, 19). Liver steatosis is also prominent in the mutant mice, suggesting the possibility that PITPα nullizygosity also compromises lipoprotein assembly and/or neutral lipid secretion in hepatocytes. Finally, PITPα−/− mice are severely hypoglycemic. Our results suggest a novel and unanticipated role for PITPα in regulating cargo-specific lipid transport from the enterocyte and hepatocyte ER, endocrine pancreas function, and glycogen metabolism.
EXPERIMENTAL PROCEDURES
Generation and Genotyping of PITPα−/− Mice—
AB1-derived +/PITPαΔ1::neo* ES cells have been described previously (17). The +/PITPα::neo/puro ES cells corresponded to the OST 1152 line (Lexicon Genetics OmniBank™ library (20)). Mice were generated by injection of ES cells into C57BL/6 blastocysts, implantation of blastocysts into pseudopregnant foster mothers, and identification of male chimeric mice competent for germ line transmission of each allele. Genotypes for PITPαΔ1::neo* mice (JG line) were determined by using a three-primer PCR assay. We employed a primer specific for the homozygous PITPα+/+ genotype (AB-2; 5′-GCGAGGCATCACTCTTCCCCTC-3′), the heterozygous PITPα−/+ genotype (AB-1B; 5′-CACCATCCCCCACGGTGACTG-3′), and the PITPα−/− genotype (PG-1; 5′-GAATGTGTGCGAGGCCAGAGG-3′) in a 33-cycle reaction (53 °C annealing temperature). Genotypes for PITPα::neo/puro mice (L1 line) were determined in two steps. First, a two primer assay that monitored Neo distinguishes PITPα+/+ from PITPα−/+ and PITPα−/− mice. Primers GE-UP (5′-GGGCGCCCGGTTCTTT TTGTGA-3′) and GE-DO (5′-TTGGTGGTCGAATGGGCAGGTAGC-3′) were used in a 28-cycle reaction (60 °C annealing temperature). To distinguish PITPα−/+ from PITPα−/− L1 mice, we resorted to immunoblot analyses of mouse brain using PITPα-specific serum (17).
Serum Analyses—
Blood was collected from mice immediately after heart puncture and clotted, and serum was clarified by centrifugation. Serum glucose was determined by using either the Trinder assay (Sigma) or was measured by Antech Diagnostics (Farmingdale, NY). Insulin and β-hydroxybutyrate were determined using the Immunoassay System (Crystal Chem Inc.) and the β-hydroxybutyrate assay kit (Sigma), respectively. All other serum analyses were performed by Antech Diagnostics (Farmingdale, NY).
Carcass Analyses—
Carcass analyses were as described previously (21). Gastrointestinal tracts were removed (stomach, small and large intestine, and cecum) and carcasses weighed. Body water content of eviscerated carcasses was determined by drying to constant weight in a 60 °C oven and measuring differences between the pre- and post-drying carcass mass. Dried carcasses were minced, ground to a homogeneous mixture, and extracted with petroleum ether in a Soxhlet apparatus to determine fat mass and fat-free dry mass. Fat-free dry mass was burned overnight at 600 °C (>8 h) to determine eviscerated carcass ash.
Histological Analysis—
Mice were anesthetized with 1.25% Avertin and perfused with phosphate-buffered saline, 4% paraformaldehyde. Duodenum, ileum, cerebellum, pancreas, and spinal cord were harvested, flushed with fixative (duodenum and ileum only), dissected, and infused with fixative for 24 h. Samples were mounted in paraffin, and 5-μm-thick sections were stained and mounted. These sections were rehydrated by serial transfer from xylene to 50% EtOH, stained with hematoxylin/eosin, and mounted in Permount (Fisher). Where osmium staining was employed, duodenal and liver sections were stained in 5% potassium dichromate, 2% osmium tetroxide for 8 h prior to paraffin embedding (22) and counterstained with toluidine blue O.
Whole brains were extracted from mice perfused with 4% paraformaldehyde and 2.5% glutaraldehyde, washed for several days in phosphate-buffered saline, and mounted in paraffin. Brains were sliced in half along the sagittal plane; each half was embedded in paraffin; and 5- or 8-μm-thick slices were mounted onto treated slides. Sections were rehydrated to 50% EtOH. For visualization of Purkinje cells, slices were incubated with goat anti-calbindin antibodies (Santa Cruz Biotechnology; Santa Cruz, CA) and developed with the Vectastain ABC kit (Vector Laboratories, Burlingame, CA). After incubation in 2% osmium fumes for 10 min, slices were counterstained with toluidine blue O.
For Oil Red O staining, livers were extracted from mice perfused with 4% paraformaldehyde, washed with phosphate-buffered saline, and frozen at −20 °C. Frozen livers were mounted, sectioned (8 μm), fixed to a histological slide, and placed in absolute propylene glycol (2 min). Slides were moved into Oil Red O solution (Newcomer Supply, Middleton, WI, catalog number 12722) for 1 h, differentiated in 85% propylene glycol (1 min), rinsed 2× in distilled water, counterstained with hematoxylin (10 s), and mounted in glycerin.
Electron Microscopy—
Mice were perfused with 4% formaldehyde, 2.5% glutaraldehyde. Biopsies from intestine, liver, and spinal cord were post-fixed with 1% OsO4, dehydrated with acetone, embedded in epoxy (23), sectioned (65 nm-thick), and stained with 4% uranyl acetate and Sato’s lead mixture (24). Samples were viewed at 80 kV in a Phillips Tecnai 12 microscope (FEI Co., Eindhoven, The Netherlands) and imaged with a Gatan MultiScan model 794 digital camera (Gatan, Pleasanton, CA).
Epoxy-embedded samples were sectioned for histological analysis (2-μm thickness) and stained with 1% toluidine blue O in 1% sodium borate. Digital images were collected with a SPOT RT digital camera (Diagnostic Instruments, Inc., Sterling Heights, MI), using Plan Fluor Nikon objectives mounted in a Nikon Eclipse E400 microscope (Nikon Inc., Melville, NY). Morphometric analysis of spinal cord sections was carried out with Scion Image software (Scion Corp., Frederick, MD).
α-Tocopherol Analyses—
Brain α-tocopherol was extracted as described (25), injected onto a 250 × 4.6 mm Phenomenex ODS 20 reversed phase C18 column (5-μm particle diameter), and eluted with methanolic 0.05% ammonium acetate using a flow rate of 1.5 ml/min. The high pressure liquid chromatography system consisted of a PerkinElmer Life Sciences model LC200 gradient pump, an AS 200 Autosampler, and an LC 295 programmable UV-visible light detector set at 292 nm.
Liver Glycogen Analysis—
Quantification of liver glycogen was by the method of Passonneau and Lauderdale (26). Glycogen was extracted from acidified liver homogenates and hydrolyzed to glucose with amyloglucosidase (Sigma). Glucose was determined by a glucose oxidase-coupled Trinder assay (Sigma).
Adenylate Nucleotide Analysis—
ATP and ATP/ADP ratios were measured using the ApoGlow™ kit (BioWhittaker Molecular Applications; Rockville, MD). Samples (0.5 mg tissue) were collected and rapidly frozen. Tissues were thawed and homogenized in the presence of a nucleotide-releasing mixture supplied by the manufacturer. Acid-extracted ATP was assayed with a luciferase-based system with picomolar sensitivity. ADP was converted to ATP and measured after a 5-min incubation at 22 °C.
Pancreatic Histology—
Whole pancreas from mice perfused with 4% paraformaldehyde was embedded in paraffin and serially sectioned (thickness = 5 μm). Islet numbers were assessed by sequential observation of hematoxylin/eosin-stained sections. Care was exercised to separate islets from patches of connecting ducts and intervening connective tissue, and not to re-score the same islet in successive sections. Islet-like, encapsulated structures larger than 100 μm that were detected in at least three consecutive sections were scored as islets. The total pancreatic area studied was similar in all sections.
RESULTS
PITPα−/− Mice Develop to Term—
Ablation of PITPα function in the mouse was achieved using two independent null alleles. First, a homologous recombination vector was constructed where exons 8–10 of the PITPα gene are replaced with a neo cassette (Fig. 1A). This mutation (PITPαΔ::neo*) deletes PITPα residues 162–257, a region critical for PITPα function (17). Second, survey of the Lexicon Genetics OmniBank™ gene trap library (see “Experimental Procedures”) identified an insertion mutation in the PITPα structural gene (PITPα::neo/puro). This allele is genetically similar (although not identical) to PITPαΔ::neo* as it also truncates PITPα after residue 162 (Fig. 1B). Mice were derived from each targeted ES cell line. PITPα−/+ offspring are phenotypically normal and fertile, and mice homozygous for either of these two mutations exhibit indistinguishable phenotypes. The phenotypic data presented below were obtained from both PITPαΔ1::neo* and PITPα::neo/puro homozygous animals.
Fig. 1. Generation and characterization of PITPα-deficient mice.

A, targeted replacement of the wild-type PITPα locus with PITPαΔ::neo*. Organization of the targeting vector is shown. Probe 1 represents a 500-bp DNA fragment that resides outside the bounds of the targeting vector and is employed for diagnosis of targeting events. Exons 7–10 of the PITPα structural gene are indicated as closed bars and are numbered accordingly. Restriction enzyme sites: E, EcoRI; X, XbaI; K, KpnI; S, SacI. B, OmniBank™ gene trap library at the PITPα locus. Retroviral construct VICTR20 is depicted (20). The PITPα::neo/puro mutation represents integration of VICTR20 between PITPα exons 7 and 8 and truncates PITPα after residue 162. The abbreviations used are as follows: LTR, long terminal repeat; PGK, phosphoglycerate kinase-1 promoter; puro, puromycin N-acetyltransferase gene; SD, spice donor sequence; SA, splice acceptor sequence; IRES, internal ribosome entry site; geo, galactosidase/neomycin phosphotransferase fusion gene; pA, polyadenylation sequence. C, distribution of PITPα genotypes in the F1. The number of live births obtained for each PITPα genotype (indicated at top), from a dedicated set of 408 F1 progeny of PITPα−/+ intercrosses, is given above the corresponding bar. D, confirmation of viable PITPα−/− progeny. Upper left panel, diagnostic PCR profiles of PITPα+/+, PITPα−/+, and PITPα−/− progeny derived from a PITPα+/− intercross. Upper right panel, total brain lysates (20 μg) harvested from each of five sibling pups (genotypes indicated) derived from a PITPα+/− intercross were resolved by SDS-PAGE and developed by immunoblotting with PITPα-specific antibodies. Lower panel, immunoblot of PITPβ in brain lysates (20 μg) from neonates of indicated genotype.
Intercrosses with heterozygous mice carrying either PITPαΔ1::neo* or the PITPα::neo/puro allele yielded genotypes consistent with a fully penetrant autosomal recessive mutation. From a dedicated pool of 408 live births, 89 PITPα−/− progeny were recovered (Fig. 1C). The genotypic distribution of 106 PITPα+/+, 213 PITPα−/+, 89 PITPα−/− corresponds to a 1.000:2.009:0.840 ratio that approximates closely the 1:2:1 ratio predicted by Mendel’s rules. Correct gene targeting in the progeny was verified by PCR genotyping and immunoblotting of brain extracts with a specific PITPα antiserum (Fig. 1D). Antibodies directed against the PITPα N terminus failed to detect a truncation product in mice homozygous for PITPαΔ1::neo* or PITPα::neo/puro, suggesting that both alleles represent null mutations. Finally, we find that relative PITPβ levels are unchanged in PITPα+/+ and PITPα−/− brain (Fig. 1D), indicating that PITPα−/− mice do not activate compensatory processes that increase PITPβ expression.
Neonatal Mortality of PITPα−/− Mice—
PITPα−/− mice failed to thrive and died at a very young age. In a sample pool of 57 PITPα−/− mice, 40% died within 48 h after birth (Fig. 2A). These early P0 and P1 deaths were not characterized by obvious external abnormalities. Moreover, postmortem analyses revealed that the stomachs of the expired PITPα−/− mice contained copious quantities of milk, indicating that mutant animals had nursed. Of the PITPα−/− progeny that survived past P1, a steady incidence of mortality was observed between P2 and P11. Almost all mice expired by P11, and only one PITPα−/− mouse lived to P14 (Fig. 2A).
Fig. 2. Overt phenotypes of PITPα−/− mice.

A, mortality profile derived from a pool of 57 PITPα−/− mice generated from 5 mating pairs over a period of 5 mating cycles. Data are presented as percentage of surviving progeny (+/+, open circles; −/−, closed circles) as a function of time (postnatal day). B, rates of body mass increase of PITPα+/+ and PITPα−/− littermates. Values represent averages for two sibling mice of each genotype (+/+, open circles; −/−, closed circles). The data are representative. C, visual comparison of PITPα+/+ and PITPα−/− littermates. Genotypes are at bottom. D, stomachs (S) of age-matched PITPα+/+ and PITPα−/− mice (P7) are filled with milk. Subcutaneous axillary (AF) and inguinal (IF) fat pads are indicated. E, comprehensive chemical analysis of eviscerated carcasses. Measurements represent the averages from six P6 and three P8 PITPα+/+ animals (solid bars) and six P6 and three P8 PITPα−/− mice (hatched bars). The abbreviations used are as follows: total, eviscerated carcass mass; FFDM, fat-free dry mass; and ASH, non-combustible carcass bone ash.
PITPα−/− progeny that survived past P1 were initially indistinguishable from PITPα+/+ and PITPα−/+ littermates in size, external morphology, and behavior. By P4, however, two phenotypes rapidly asserted themselves. First, most PITPα−/− mice were moribund and exhibited little spontaneous movement. These mice did respond to touch, however. By contrast, ~10% of the PITPα−/− mice experienced spontaneous seizures. All PITPα−/− mice were severely ataxic and were generally incapable of maintaining themselves upright. We also observed coarse action tremors upon limb extension in PITPα−/− mice. Second, these mutant mice failed to thrive. Although the PITPα−/− mice gained body mass, they did so slowly (Fig. 2B). By P10, surviving PITPα−/− mice were 2.5-fold less massive than their PITPα+/+ and PITPα−/+ littermates (Fig. 2C).
PITPα−/− Mice Suckle Effectively—
Several lines of evidence indicate that the failure of PITPα−/− mice to thrive is not the simple consequence of neurological defects. We observed PITPα−/− mice in the act of suckling, and postmortem analyses indicated both copious quantities of milk in stomachs of these mice (Fig. 2D) and substantial amounts of digested matter throughout the PITPα−/− intestinal tract (not shown). The suckling competence of PITPα−/− mice notwithstanding, the mutant animals exhibited pathologically low body fat levels. This reduction is obvious when the subcutaneous fat pads of PITPα+/+ and PITPα−/− mice are compared. Whereas PITPα+/+ controls exhibit large axillary and inguinal fat pads, these structures are absent from PITPα−/− animals (Fig. 2D). Chemical analyses of eviscerated carcasses quantified these differences; PITPα+/+ and PITPα−/− mice exhibited total body fat contents of 15.0 ± 1.1 and 4.0 ± 0.5% of total body mass, respectively (Fig. 2E). Significantly, the relative water contents of PITPα+/+ and PITPα−/− carcasses are similar (Fig. 2E), indicating that PITPα−/− mice are not dehydrated, as would be expected if there were substantial suckling defects. The relative fat-free dry mass contents and carcass bone ash contents are also comparable (Fig. 2E). Consistent with those measurements, we find that organ/total body mass ratios in PITPα−/− mice for brain, liver, and other major organs are also proportional to total body mass (not shown).
Elevated Apoptosis and Purkinje Cell Defects in PITPα−/− Cerebellum—
Nissl staining does not reveal obvious defects in development or morphology of PITPα−/− cerebrum, thalamus, hippocampus, or cerebellum. Normal cellularity was observed in all regions examined (data not shown). However, PITPα insufficiencies evoked functional defects in the cerebellum. These defects were apparent at several levels. Whereas TUNEL staining showed a sparse and random distribution of apoptotic foci in wild-type brain, apoptosis was more prevalent throughout PITPα−/− cerebellum. This is particularly evident in the external granule layer of mutant cerebellum (Fig. 3A).
Fig. 3. Cerebellar injury in PITPα-deficient mice.

A, TUNEL staining of cerebellum. Genotypes are indicated. The ApopTag Fluorescein in Situ Detection Kit (Intergen Co.) was used as instructed by the manufacturer. B, Purkinje cell defects in PITPα−/− cerebellum. The Purkinje cell layer was revealed by staining with calbindin antibodies and counterstaining with toluidine blue O. C, reactive gliosis in PITPα−/− cerebellum. Sagittal sections of PITPα+/+ and PITPα−/− cerebellum (as indicated) were stained with anti-GFAP antibodies with or without counterstaining with toluidine blue O (right and left columns, respectively). D, higher magnification images of PITPα+/+ and PITPα−/− cerebellum stained with anti-GFAP antibodies and counterstained with toluidine blue O. Genotypes are at top.
Second, we find Purkinje cell defects in PITPα−/− animals. Purkinje cells normally align themselves into a sharply defined monolayer that lies between the molecular and external granular layers of the cerebellum (Fig. 3B). These cells elaborate well developed apical dendritic stalks which arborize into luxurious branches that penetrate into the molecular layer of the cerebellum. PITPα−/− Purkinje cells, while retaining normal flask-shaped cell body morphologies, exhibit either abbreviated apical dendritic stalks or no obvious stalks at all (Fig. 3B). Moreover, the dendritic branches emanating from the abbreviated apical stalks are less arborized than those of PITPα+/+ Purkinje cells. We also observed cases where these cells exhibit defects in spatial alignment, reside off of the defined layer, or are otherwise misoriented.
Degenerative Disease in PITPα−/− Cerebellum—
PITPα−/− cerebellum suffered major degenerative insult as judged by the extent of reactive gliosis. Wild-type cerebellum shows low levels of GFAP, a specific marker for activated astrocytes (Fig. 3C). By contrast, PITPα−/− cerebellum exhibits a dramatic staining for GFAP, and reactive gliosis is especially prominent in the white matter trunk of this organ (Fig. 3C). Even in these relatively less affected areas, GFAP immunohistochemistry suggests some 10% of the cells represent activated astrocytes that are frequently seen to be enveloping neuron cell bodies (Fig. 3D). Reactive gliosis is not observed throughout the mutant brain. Whereas PITPα−/− cerebellum and brain stem are heavily infiltrated with activated glial cells, and the subthalamic region is also involved, significant gliosis is not observed in the neocortex, striatum, hippocampal formation, and other forebrain regions (not shown).
Finally, electron microscopy reveals ER defects in cerebellar neurons of PITPα−/− mice. These defects manifest themselves as significant vacuolations of the smooth ER region, even though adjacent regions of rough ER retain normal morphology (not shown). Such vacuolations are not observed in smooth ER of PITPα+/+ cerebellar neurons.
Neurodegeneration and Inflammation in PITPα−/− Spinal Cord—
We consistently observed WM deficits in PITPα−/− cervical, thoracic, and lumbar spinal cord. Whereas ventral WM is well developed in PITPα+/+ cervical spinal cord, the corresponding WM regions are thin and sparse in PITPα−/− animals (Fig. 4A). WM to GM area ratios in cervical spinal cord are 0.45 ± 0.1 for PITPα+/+ and 0.32 ± 0.02 for PITPα−/− mice, respectively (p < 0.01; n = 6). In addition to the WM deficits, evidence of inflammation pervades all regions of the PITPa−/− spinal cord. Toluidine blue O-staining reveals areas of abnormally heavy staining in the ventral horn where motor neuron cell bodies reside, suggesting cell damage in these areas (Fig. 4A). Moreover, whereas the WM/GM interface of PITPα+/+ cervical spinal cord presents normal vascular structures, neurons, and accessory cells, corresponding regions of the PITPα−/− spinal cord exhibit densely stained cells and damaged neurons (Fig. 4B). These pathologies encompass a spectrum of cell death events. These range from occasional apoptotic neurons (condensed nuclei, fragmented cytoplasm; not shown) to large numbers of neurons undergoing aponecrotic processes (Fig. 4B). Aponecrosis is a form of cell death associated with reductions in cellular ATP and increases in ADP levels (27, 28). Analyses from six PITPα−/− mice indicate that 18 ± 1% of the total motor neuron cell bodies in the ventral horn exhibit properties of aponecrosis. These include pericytoplasmic vacuolation, reduced cytoplasmic contents, and cytoplasmic proliferation of irregular electron-translucent vesicles (Fig. 4B).
Fig. 4. Neurodegenerative and inflammatory changes in PITPα−/− spinal cord.

A, complete spinal cord sections were generated by reconstructing images from 2-μm-thick, epoxy resin-embedded sections of PITPα+/+ stained with toluidine blue O (left, number of images n = 30) and PITPα−/− spinal cord (right, n = 22). Bars are 0.15 mm. B, images from the ventral interface between gray and white matter (GM/WM interface) of cervical spinal cord sections. Top panels, representative images of PITPα+/+ motor neuron cell bodies (left, open arrows) and abnormally dark staining PITPα−/− motor neuron cell bodies (right, dark arrows) are indicated. Bars are as follows: left, 50 μm; right, 100 μm. WM regions are indicated. Bottom panels, additional images from GM/WM interface of PITPα−/− cervical spinal cord are shown. Characteristic neurodegenerative symptoms include highly vacuolated cells (center panel, solid arrow), dark cells (right panel, solid arrows), and abnormally lightly stained cells without discrete intracellular structure (right panel, *). Bars are as follows: left, 100 μm; center, 50 μm; right, 20 μm. C, inflammatory cells in PITPα−/− thoracic spinal cord. Left panel, mast cell (MC) and capillary lumen (C) are indicated. Right panel, macrophage (MF) and capillary lumen (C) are indicated. Bars are as follows: left, 20 μm; right, 5 μm. D, electron micrographs of myelin from the WM/GM interface of PITPα+/+ (left) and PITPα−/− spinal cord (center). Examples of myelinated axons are indicated by arrows. Right panel, cells that may be remodeling myelin are present in large numbers in PITPα−/− mice and an example is indicated (*). Bars are as follows: left, 15 μm; center, 10 μm; right, 6 μm.
We did not observe aponecrotic motor neurons in the ventral horn of PITPα+/+ spinal cord. Extensive vacuolation and membrane blebbing is prevalent in cells that line the vasculature of PITPα−/− spinal cord (not shown). Axons surrounding capillaries and small vessels in the GM are enlarged and often damaged. This is unlikely to represent a perfusion artifact, as this phenotype was not recorded in any of the spinal cord sections analyzed from 14 PITPα+/+ mice.
Toluidine blue O-staining reveals the presence of cells containing an abundance of purple intracellular granules in the perivascular matrix (Fig. 4C, left panel). This obvious purple metachromasia is diagnostic of inflammatory mast cells (29, 30). Accordingly, we find extratissular macrophages in perivascular tissue or even in the vessels themselves (Fig. 4C, right panel), suggesting the blood/brain barrier of PITPα−/− mice is itself compromised. Finally, spinocerebellar injury in PITPα−/− mice also includes processes that resemble those of other myelin-related central nervous system inflammatory disorders (31). First, macroscopic swelling in the dorsal spinal columns is apparent. The nonneuronal area (neuropil) comprises 54 ± 3% in PITPα+/+ spinal cord (n = 6; p = 0.01) and 70 ± 6% of total area in PITPα−/− spinal cord, respectively. Degenerative processes in neuropil, typified by swollen axons lacking organelles and cytoskeletal filaments, are also obvious (not shown). Second, demyelination is scored in both WM and GM areas of PITPα−/− mice and especially in the dorsal spinal columns. Supporting cells that may be remodeling myelin are also observed (Fig. 4D).
The fragility of the mutant central nervous system notwithstanding, a variety of PITPα−/− neurons are amenable to primary culture. Cultured cortical neurons, cerebellar granule cells, and spinal cord dorsal root ganglion neurons from PITPα−/− mice are not more fragile than their PITPα+/+ counterparts in any obvious way. Indeed, titration of nerve growth factor concentrations from 50 to 5 ng/ml revealed no differences in the thresholds of trophic factor required to sustain viability of PITPα−/− versus PITPα+/+ dorsal root ganglion neurons in culture (not shown). PITPα−/− cerebellar granule cells are similarly robust. These data suggest a significant cause of neuronal injury in PITPα−/− mice is a hostile physiological environment, rather than some overriding cell autonomous defect.
Lipid Dysregulation in PITPα−/− Enterocytes—
Failure of PITPα−/− mice to thrive suggests a malabsorption disorder. Histological analyses of duodenum indicate the architecture of this organ and its muscle layers are similar in PITPα+/+ and PITPα−/− mice. Moreover, intestinal motility also appears normal (not shown). There are obvious anomalies in PITPα−/− intestinal epithelium, however. Most strikingly, PITPα−/− enterocytes exhibit an obviously heavy impregnation with the lipophilic agent osmium relative to PITPα+/+ enterocytes (Fig. 5A). These histological properties are consistent with an abnormal accumulation of intracellular lipid in mutant enterocytes. If the accumulated lipid is derived from dietary fat, rather than manifestation of some other cellular pathology, active feeding is expected to be required for the loading of mutant enterocytes with lipid. Indeed, enterocytes harvested from PITPα−/− mice subjected to a 10-h fast are clear of accumulated lipid (not shown).
Fig. 5. Accumulation of lipid in PITPα−/− duodenal epithelium.

A, intracellular lipid in enterocytes of PITPα−/− duodenum. Sections (5 μm thick) of duodenum from PITPα+/+ and PITPα−/− P5 siblings were stained with osmium and counterstained with toluidine blue O. Black granules identify lipid. Relevant genotypes are given. B, electron micrographs of duodenal epithelium from PITPα+/+ (left) and PITPα−/− (right) P8 mice are shown. Bars are 5 μm. C, electron micrographs of enterocytes from PITPα+/+ and PITPα−/− mice as indicated. Bars are 2 μm. D, electron micrographs of lipid bodies from PITPα+/+ (left panels) and PITPα−/− enterocytes (right panels) as indicated. Dimensions of the lipid bodies aside, the general morphologies of these structures exhibit many similarities in wild-type versus mutant enterocytes, and most are membrane-enclosed. Boundary membranes are indicated by arrows. A cytoplasmic lipid droplet (L) with a fuzzy border is shown for contrast. Bars are 0.2 μm. E, distribution histogram of vesicle perimeters in PITPα+/+ (solid symbols) and PITPα−/− mice (open symbols). Perimeter measurements were made for 428 and 398 lipid bodies from PITPα+/+ and PITPα−/− enterocytes, respectively. F, enlargement of smooth ER in PITPα−/− duodenal enterocytes as revealed by electron microscopy. Lipid-engorged regions are identified by arrows. These smooth ER luminal regions are contiguous with the lumen of adjacent rough ER that is easily recognized by the associated ribosomes (not shown). Bar is 0.4 μm. G, PITPα−/− mice exhibit reduced brain α-tocopherol and post-prandial TG levels. Parameters are indicated. Measurements were made from nine PITPα+/+ and nine PITPα−/− mice. Averages ± S.D. are given.
Closer inspection of PITPα+/+ duodenal enterocytes by electron microscopy demonstrates that these cells contain a heterogeneous population of lipid bodies (Fig. 5B). Even at this high resolution, these structures stain with osmium in a manner consistent with a lipid interior, and these vesicles exhibit an average diameter of 300–700 nm. Inspection of the borders of these lipid bodies at very high magnifications reveals a classical trilaminar membrane surrounding these structures (not shown). PITPα−/− enterocytes, on the other hand, are packed with vesicles that are also membrane-enclosed but are much larger than those observed in PITPα+/+ enterocytes. Moreover, the structures that accumulate in PITPα−/− enterocytes often appear multilobed (Fig. 5C). Representative profiles of such structures from PITPα+/+ and PITPα−/− enterocytes are shown at higher magnification in Fig. 5D. The size differences of the structures in wild-type and nullizygous enterocytes notwithstanding, these share many structural features. It is therefore likely that the biogenesis of the lipid bodies initially follows a common course in PITPα+/+ and PITPα−/− enterocytes.
Morphometric measurements indicate a rather unimodal frequency distribution of vesicle perimeters from PITPα+/+ mice (average is ~2 μm; Fig. 5E). By contrast, the accumulated structures in PITPα−/− enterocytes are much larger and have multimodal size distributions. Perimeters of 20 μm are often observed, and perimeters in excess of 50 μm are also encountered (Fig. 5E). Finally, our results indicate that the lipid structures in PITPα−/− enterocytes reside predominantly in dilated regions of smooth ER (Fig. 5F).
α-Tocopherol and Plasma TG Deficiency in PITPα−/− Mice—
The failure of PITPα−/− mice to thrive, when coupled with their retention of lipid in the enterocyte smooth ER, predicts a malabsorption-mediated deficit in fat-soluble vitamins, particularly α-tocopherol (vitamin E), and reduced levels of post-prandial plasma TGs. We find PITPα−/− mice are deficient in α-tocopherol. Whereas PITPα+/+ brain exhibits 19.48 ± 3.41 μg of α-tocopherol/gm tissue, values for PITPα−/− brain are ~10-fold reduced (2.11 ± 0.04 μg of α-tocopherol/g of tissue; Fig. 5G). Post-prandial plasma TG levels in PITPα−/− mice are also ~3-fold reduced relative to PITPα+/+ mice (55 ± 13 versus 183 ± 15 mg/dl).
By contrast, PITPα+/+ and PITPα−/− plasma cholesterol levels are similar. Indeed, comprehensive blood chemistry analyses demonstrate many (although not all) parameters are largely normal for PITPα−/− mice (Table I). Immunoblot experiments indicate that apolipoprotein B48 and microsomal triglyceride transfer protein, two components required for chylomicron assembly, are expressed in PITPα−/− mice and that serum apoB levels are similar to those recorded for PITPα+/+ mice (not shown).
Table I. Serum analyses.
Serum pooled from six PITPα+/+ and PITPα−/− mice each, varying in age from P6 to P9, were subjected to a comprehensive mammalian chemistry panel performed by Antech Diagnostics (Farmingdale, NY). Values represent the averages of triplicate measurements obtained from three different sets of mice. Parameters that differ significantly between PITPα+/+ and PITPα−/− mice are highlighted at top of the table. The abbreviations used are: APase, alkaline phosphatase; AST, aspartate aminotransferase; CPK, creatinine phosphokinase; ALT, alanine aminotransferase.
| Parameter | PITPα+/+ | PITPα−/− |
|---|---|---|
| Bilirubin | 0.84 ± 0.16 mg/dl | 1.54 ± 0.10 mg/dl |
| APase | 809 ± 160 units/liter | 1497 ± 179 units/liter |
| AST | 135 ± 9 units/liter | 250 ± 18 units/liter |
| CPK | 4892 ± 42 units/liter | 6439 ± 147 units/liter |
| Creatinine | 0.44 ± 0.08 mg/dl | 0.44 ± 0.08 mg/dl |
| Total protein | 3.10 ± 0.34 g/dl | 3.10 ± 1.33 g/dl |
| ALT | 52.4 ± 18.3 units/liter | 46.1 ± 13.2 units/liter |
| Albumin | 1.70 ± 0.18 g/dl | 1.60 ± 0.17 g/dl |
| Cholesterol | 134 ± 14 mg/dl | 137 ± 11 mg/dl |
| Calcium | 7.04 ± 0.24 mg/dl | 8.28 ± 1.70 mg/dl |
| Phosphorus | 11.4 ± 1.5 mg/dl | 11.3 ± 1.3 mg/dl |
| Sodium | 115 ± 14 Meq/liter | 113 ± 8 Meq/liter |
| Potassium | 7.2 ± 1.2 Meq/liter | 7.3 ± 0.9 Meq/liter |
| Chloride | 50.6 ± 11.9 Meq/liter | 45.3 ± 3.0 Meq/liter |
| Globulin | 1.20 ± 0.25 g/dl | 1.50 ± 32 g/dl |
| Urea N2 | 22.0 ± 5.0 mg/dl | 25.0 ± 7.5 mg/dl |
PITPα−/− Mice Exhibit Microvesicular Steatosis in Liver—
The pathways for lipid transport from the ER lumen to the cell surface are similar in enterocytes and hepatocytes. In that regard, PITPα−/− liver also exhibits obvious microvesicular steatosis, as evidenced by its dramatically enhanced staining with osmium (Fig. 6A) and with the lipophilic dye Oil Red O (Fig. 6B). Because Oil Red O exhibits specific affinity for neutral lipids (e.g. TG, DAG, and CE), we conclude that the accumulated lipid is largely of the neutral class. These histochemical data are extended by electron microscopy. Relative to wild-type hepatocytes, PITPα−/− cells exhibit an abundance of large intracellular lipid bodies. We often detect such structures in the nuclear matrix of mutant hepatocytes, a circumstance we have yet to encounter in wild-type cells (Fig. 6C).
Fig. 6. Microvesicular steatosis in PITPα−/− hepatocytes.
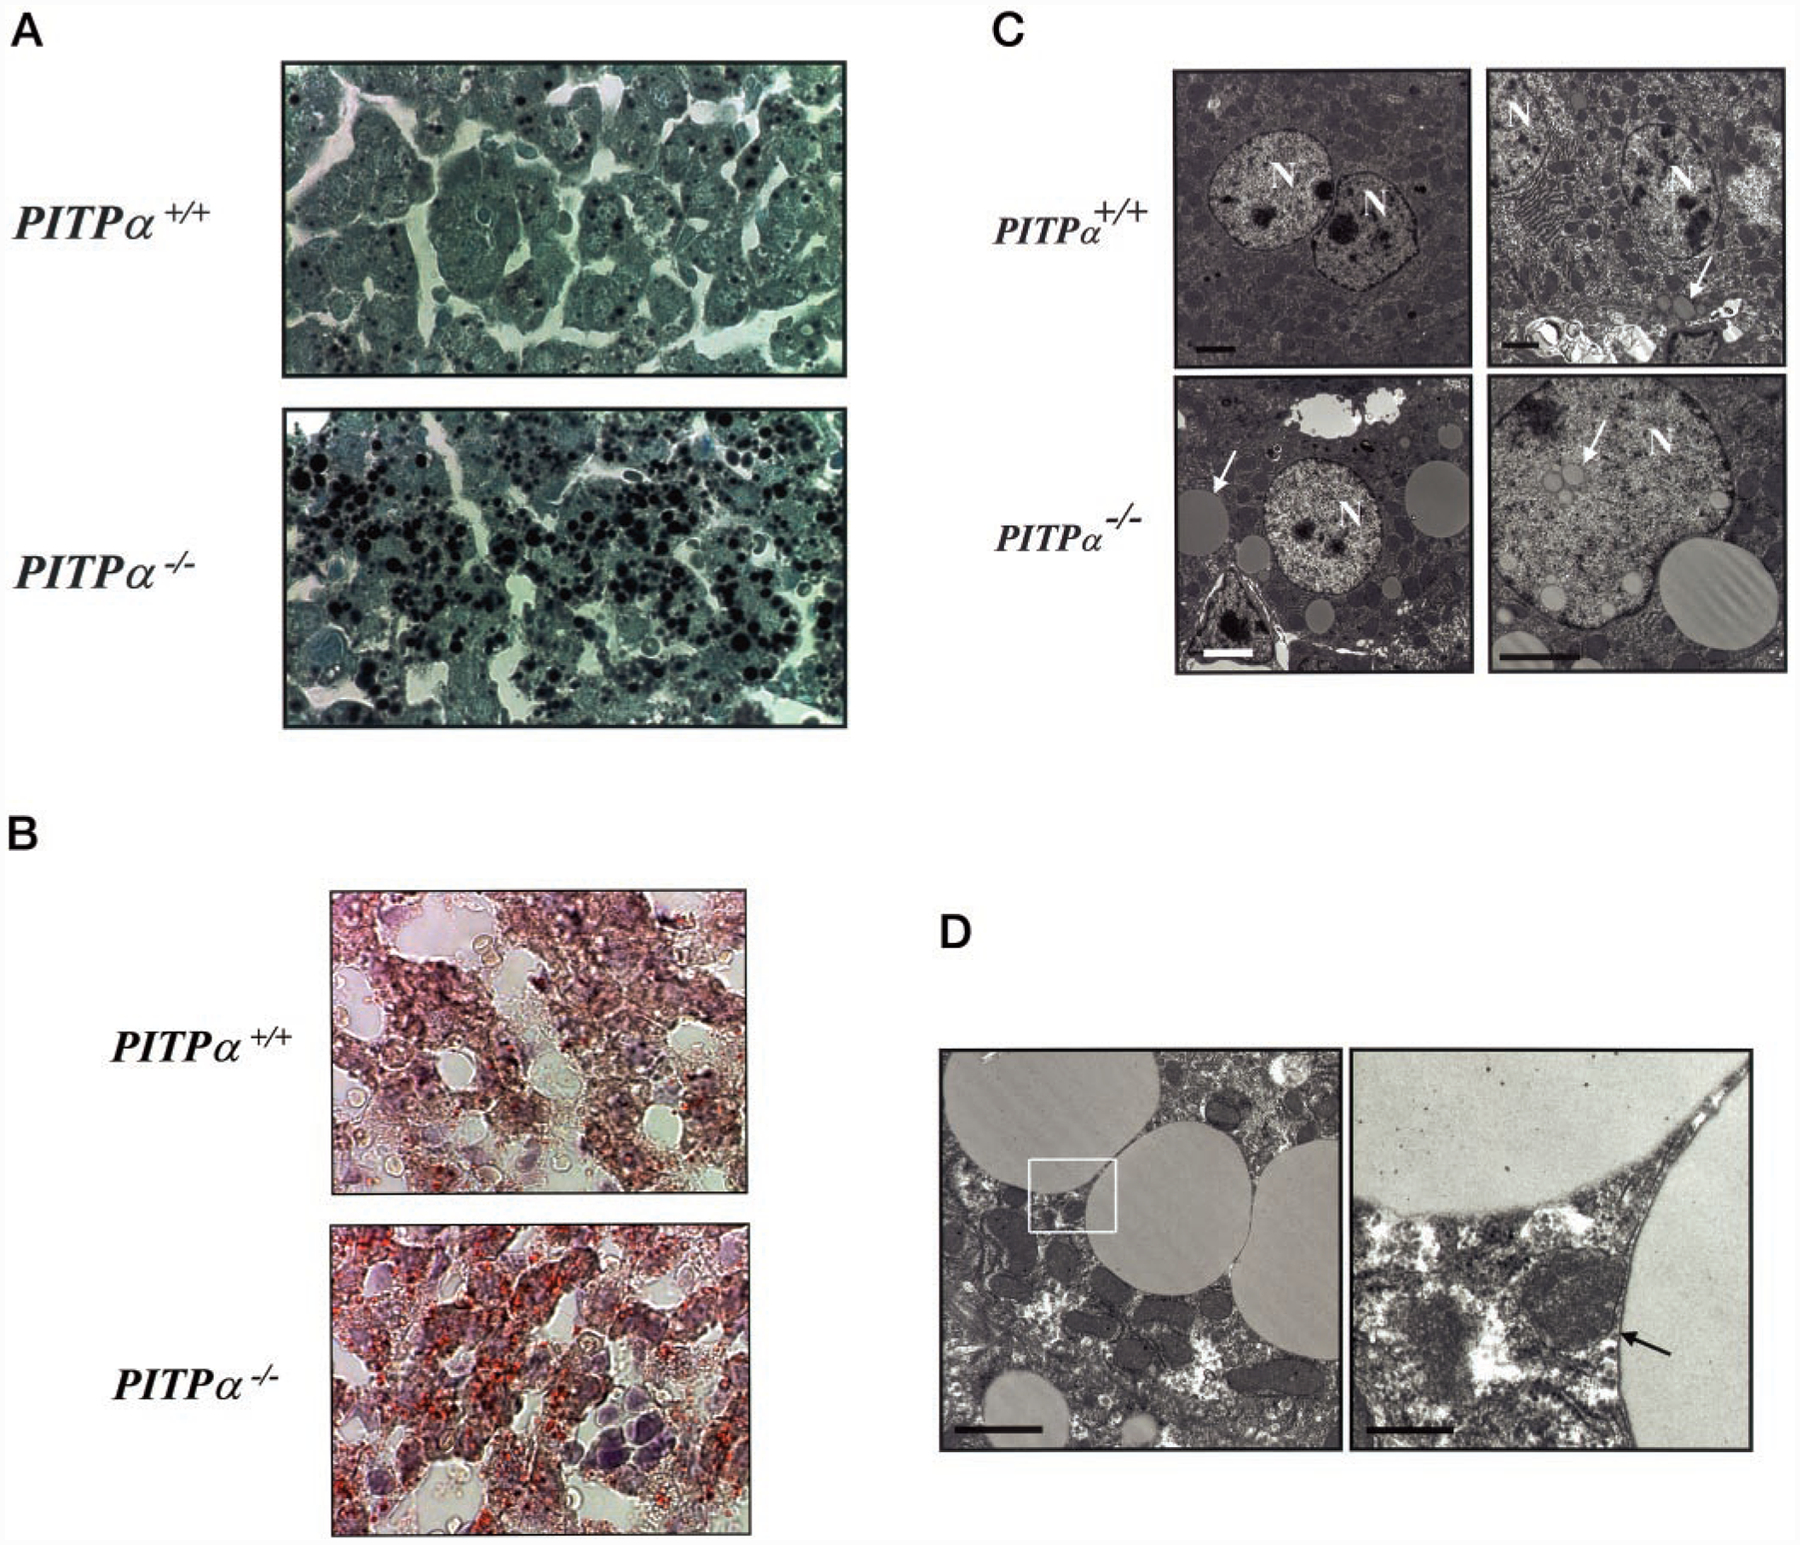
A, liver sections from PITPα+/+ and PITPα−/− P5 siblings were stained with osmium and counterstained with toluidine blue O. Black granules identify lipid. Relevant genotypes are given at left. B, liver sections from mice of the indicated genotype were stained with Oil Red O and counterstained with hematoxylin/eosin. The red globules prevalent in sections of PITPα nullizygous liver identify neutral lipid bodies. C, electron micrographs of PITPα+/+ and PITPα−/− liver sections are shown. Nuclei (N) and examples of lipid bodies are highlighted by arrows. Bars (clockwise from upper left) are 2, 2, 3, and 2 μm, respectively. D, electron micrograph of lipid bodies that accumulate in PITPα nullizygous hepatocytes. The right panel is a magnification of the region identified by the box in the left panel. One lipid body is membrane-enclosed (arrow), whereas the other lacks a distinct border and is interpreted to represent a large cytoplasmic lipid droplet. Bars (from left) are 2 and 0.4 μm, respectively.
The lipid bodies are either membrane-bound or represent large cytoplasmic lipid droplets (Fig. 6D). Unlike in mutant enterocytes, where accumulated lipid is predominantly found in membrane-enclosed compartments, ~60% of the lipid bodies in PITPα−/− hepatocytes represent what we interpret to be cytosolic lipid droplets due to lack of identifiable boundary membrane (Fig. 6D). This raises the possibility that the mechanism of hepatic steatosis differs from that of the PITPα−/− enterocytes. Although we cannot yet exclude the possibility that allocation of fatty acids and lipids between storage pools and lipoprotein pools is deranged in PITPα−/− liver, at least some key fatty acid and lipid biosynthetic enzymes (acetyl-CoA carboxylase, stearyl-CoA reductase, and fatty-acid synthase) are not transcriptionally up-regulated in this mutant tissue (not shown). Moreover, the hepatic microvesicular steatosis, although qualitatively resistant to a short 6-h fast, is reversed by fasting mutant mice for 17 h (not shown).
Quantitative Analyses of Lipids and Fatty Acids in PITPα−/− Liver and Brain—
The lipid derangement in PITPα−/− duodenum and liver suggests increased neutral lipid mass. To test this interpretation directly, the mass of a variety of lipid species in PITPα+/+ and PITPα−/− liver and brain was quantified. The intestine provides technical challenges in this assay as the mice analyzed are neither fasted nor germ-free. We assume analysis of liver lipid mass is generally representative of the situation in intestine.
As shown in Fig. 7A, although the relative TG, DAG, and CE contents are very similar in matched wild-type and PITPα nullizygous brain tissue, bulk neutral lipid mass is dramatically elevated in PITPα nullizygous liver. Bulk TG and FFA mass is 2.0- and 2.6-fold increased relative to the respective values recorded for wild-type liver. Bulk CE and DAG mass is also increased in PITPα−/− liver. Unexpectedly, PITPα−/− brain exhibits a 3.3-fold increase in FFA mass relative to PITPα+/+ brain (Fig. 7A).
Fig. 7. Quantification of lipid mass in PITPα+/+ and PITPα−/− brain and liver.
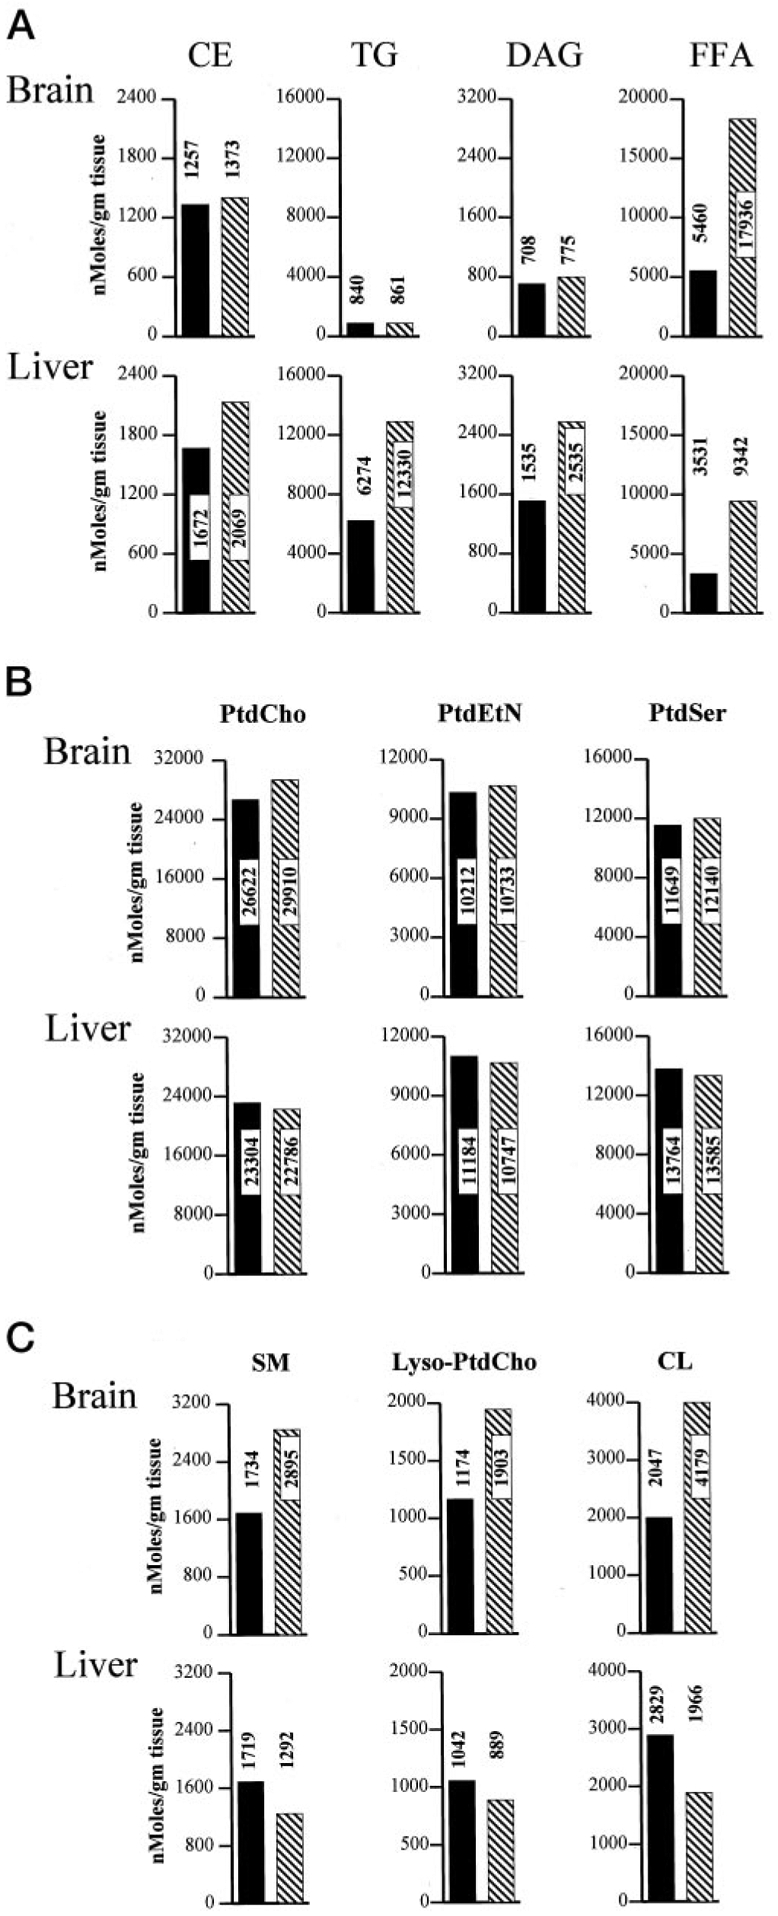
Brains and livers were collected from each of four freshly euthanized non-fasted PITPα+/+ and PITPα−/− mice and combined to generate defined tissue pools for each genotype. Pools were frozen and quantified for individual lipid species and FFAs via the Lipomics Technologies, Inc., TrueMass™ protocol. Individual lipid species are given at the top, and brain and liver values for each lipid species are given in a vertical column below each heading. Brain values are represented in the top panels, and the liver values are in the bottom panels as indicated. All lipid species are quantified as nanomoles per g of tissue. PITPα+/+ and PITPα−/− values are indicated by solid bars and hatched bars, respectively. Numerical values for each bar are given. A, neutral lipid mass measurements. B, polar lipids whose mass is unaltered in PITPα+/+ versus PITPα−/− tissues. C, polar lipids whose mass is altered in PITPα+/+ versus PITPα−/− tissues. SM, sphingomyelin; PtdEtn, phosphatidylethanolamine; PtdSer, phosphatidylserine.
The derangements in neutral lipid/FFA content in PITPα−/− tissues do not reflect a universal derangement of lipid homeostasis. PtdCho, phosphatidylethanolamine, and phosphatidylserine mass values are similar in matched wild-type and PITPα nullizygous brain and liver tissue (Fig. 7B). We do note, however, that mass of specific polar lipids such as sphingomyelin and lyso-PtdCho are elevated in PITPα nullizygous brain, and CL levels are altered in both mutant brain and liver relative to matched wild-type tissues (Fig. 7C).
Fatty acid compositions of the CE, DAG, TG, FFA, sphingomyelin, and CL pools of PITPα+/+ and PITPα−/− brain (Table II) and liver (Table III) were also compared. The most striking qualitative and quantitative difference is the reduced content of 18:2n6 (9,12-octadecadienoic acid) in mutant brain TG, DAG, and CL pools (Table II), and an increase in 18:1n9 (9-octadenoic acid) in CE, DAG, and FFA pools in nullizygous liver (Table III). Fatty acid profiles of brain and liver lyso-PtdCho were determined for PITPα+/+ and PITPα−/− mice, and no differences were scored (not shown).
Table II. Acyl chain compositions of bulk brain lipids.
Fatty acid compositions of the lipid classes analyzed from pooled brain tissue samples depicted in Fig. 7 were determined by Lipomics TrueMass™ technology. Profiles of the indicated fatty acid species (at left) for the indicated lipid species (at top) are presented in nanomoles of fatty acid/total moles of fatty acid in each lipid class. The data are presented as PITPα+/+ value/PITPα−/− value. Some differences between corresponding PITPα+/+ and PITPα−/− values are indicated in boldfase. Omega fatty acid nomenclature is employed. The t prefix indicates trans-double bond, and the dm prefix indicates plasmalogen-linked fatty acid. SM indicates sphingomyelin. A precise molecular description of each fatty acid species analyzed is provided at www.lipomics.com/Fatty%20Acids/fatty_acid.htm.
| Acyl species | CE | TG | DAG | FFA | SM | CL |
|---|---|---|---|---|---|---|
| 14:0 | 5.4/6.0 | 3.3/0.0 | 4.1/5.4 | 4.1/4.2 | 2.6/3.5 | 1.9/2.0 |
| 14:1n5 | 0.0/0.0 | 0.7/1.0 | 0.0/0.0 | 0.0/0.0 | 0.1/0.2 | 0.0/0.0 |
| 15:0 | 1.0/1.6 | 1.6/2.8 | 0.8/1.1 | 1.3/1.0 | 0.5/1.1 | 1.2/1.7 |
| dm16:0 | 1.7/3.3 | 0.7/1.3 | 0.0/0.4 | 0.0/0.3 | 0.2/0.3 | 2.6/3.1 |
| 16:0 | 23.2/21.4 | 27.2/28.5 | 28.9/36.0 | 33.4/33.9 | 17.1/16.8 | 16.1/16.9 |
| t16:1n7 | 0.9/1.8 | 0.7/1.3 | 3.1/3.3 | 5.4/5.5 | 1.6/2.6 | 0.5/2.2 |
| 16:1n7 | 9.1/13.2 | 3.7/5.6 | 1.3/1.4 | 1.2/0.9 | 1.3/1.8 | 3.3/1.8 |
| dm18:0 | 0.0/0.0 | 0.9/0.7 | 0.0/0.0 | 0.4/0.7 | 0.2/0.1 | 1.8/2.1 |
| dm18:1n9 | 1.9/2.0 | 0.0/0.0 | 0.0/0.0 | 0.0/0.0 | 0.0/0.0 | 0.1/0.2 |
| dm18:1n7 | 0.0/0.0 | 0.8/1.0 | 0.0/0.0 | 0.0/0.0 | 0.0/0.0 | 0.2/0.2 |
| 18:0 | 16.4/11.9 | 15.4/18.8 | 23.4/27.9 | 27.4/30.4 | 28.7/23.2 | 21.8/18.9 |
| t18:1n9 | 0.0/0.0 | 0.0/0.0 | 0.0/0.4 | 0.0/0.0 | 0.3/0.9 | 0.0/0.0 |
| 18:1n9 | 12.3/11.5 | 17.3/18.2 | 15.2/8.7 | 12.2/10.7 | 18.4/25.0 | 6.0/6.0 |
| 18:1n7 | 0.6/0.0 | 1.5/1.2 | 1.6/1.0 | 1.5/1.3 | 1.7/1.7 | 2.1/1.5 |
| t18:2n6 | 0.0/0.0 | 0.0/0.0 | 0.2/0.3 | 0.0/0.1 | 0.0/0.0 | 0.0/0.0 |
| 18:2n6 | 7.2/6.8 | 16.3/8.9 | 9.1/4.8 | 6.1/4.2 | 2.7/3.1 | 8.4/2.8 |
| 18:3n6 | 0.0/0.6 | 0.3/0.6 | 0.3/0.0 | 0.2/0.0 | 0.0/0.0 | 0.0/0.0 |
| 18:3n3 | 0.2/0.0 | 0.6/0.4 | 0.8/0.8 | 0.3/0.4 | 0.4/0.4 | 0.4/0.3 |
| 18:4n3 | 0.0/0.3 | 0.3/0.5 | 0.0/0.0 | 0.0/0.0 | 0.0/0.0 | 0.2/0.2 |
| 20:0 | 0.4/1.0 | 0.8/0.4 | 0.8/0.7 | 0.9/0.9 | 0.4/0.3 | 0.2/0.2 |
| 20:1n15 | 0.0/0.0 | 0.0/0.0 | 0.0/0.0 | 0.0/0.0 | 0.0/0.0 | 0.0/0.0 |
| 20:1n12 | 0.0/0.0 | 0.0/0.0 | 0.0/0.0 | 0.0/0.0 | 0.0/0.0 | 0.0/0.0 |
| 20:1n9 | 6.2/5.6 | 1.1/2.0 | 0.4/0.0 | 0.2/0.3 | 0.5/0.4 | 0.4/0.2 |
| 20:3n9 | 0.0/0.0 | 0.0/0.0 | 0.3/1.4 | 0.5/0.4 | 0.1/0.1 | 0.0/0.1 |
| 20:2n6 | 0.7/0.9 | 0.8/0.3 | 0.3/0.5 | 0.4/0.4 | 0.1/0.2 | 16.9/25.2 |
| 20:3n6 | 0.0/0.0 | 1.0/0.3 | 0.4/0.0 | 0.4/0.3 | 0.6/0.5 | 0.5/0.4 |
| 20:4n6 | 1.1/0.0 | 1.4/0.4 | 7.7/2.8 | 3.5/1.9 | 4.5/3.3 | 4.4/4.1 |
| 20:3n3 | 0.0/0.0 | 0.0/0.0 | 0.0/0.0 | 0.0/0.0 | 0.0/0.1 | 0.1/0.0 |
| 20:4n3 | 0.0/0.0 | 0.3/0.2 | 0.0/0.0 | 0.0/0.0 | 0.0/0.0 | 0.3/0.3 |
| 20:5n3 | 0.0/0.0 | 0.3/0.0 | 0.2/0.0 | 0.0/0.1 | 0.0/0.0 | 0.0/0.1 |
| 22:0 | 1.1/1.8 | 0.3/0.3 | 0.0/0.0 | 0.0/1.1 | 0.6/0.4 | 0.1/0.2 |
| 22:1n9 | 9.3/8.6 | 1.3/0.3 | 0.0/1.1 | 0.0/0.4 | 0.4/0.3 | 0.3/0.4 |
| 22:2n6 | 0.0/0.3 | 0.0/0.0 | 0.0/2.1 | 0.0/0.2 | 0.0/0.1 | 0.7/0.6 |
| 22:4n6 | 0.0/0.0 | 0.0/0.0 | 0.0/0.0 | 0.0/0.0 | 0.2/0.2 | 0.4/0.0 |
| 22:5n6 | 0.0/0.0 | 0.0/0.0 | 0.0/0.0 | 0.0/0.0 | 0.0/0.0 | 0.0/0.0 |
| 22:5n3 | 0.0/0.0 | 0.0/0.0 | 0.0/0.0 | 0.0/0.0 | 0.6/0.4 | 0.1/0.2 |
| 22:6n3 | 0.0/0.0 | 0.3/0.3 | 1.1/0.0 | 0.0/0.0 | 15.9/12.4 | 8.5/7.3 |
| 24:0 | 1.3/1.5 | 0.8/0.3 | 0.0/0.0 | 0.5/0.6 | 0.2/0.3 | 0.2/0.4 |
| 24:1n9 | 0.0/0.0 | 0.0/0.0 | 0.0/0.0 | 0.0/0.0 | 0.2/0.4 | 0.2/0.3 |
| 24:6n3 | 0.0/0.0 | 0.2/0.0 | 0.0/0.0 | 0.0/0.0 | 0.0/0.0 | 0.0/0.0 |
Table III. Acyl chain compositions of bulk liver lipids.
Fatty acid compositions of the lipid classes analyzed from pooled liver tissue samples depicted in Fig. 7 were analyzed. See the legend to Table II for essential details.
| Acyl species | CE | TG | DAG | FFA | SM | CL |
|---|---|---|---|---|---|---|
| 14:0 | 3.3/2.8 | 4.5/3.4 | 5.3/5.0 | 4.2/3.5 | 2.2/2.0 | 1.0/1.2 |
| 14:1n5 | 0.1/0.0 | 0.1/0.1 | 0.1/0.1 | 0.3/0.0 | 0.2/0.1 | 0.0/0.0 |
| 15:0 | 0.5/0.2 | 0.2/0.1 | 0.4/0.2 | 0.4/0.3 | 0.5/0.4 | 0.4/0.6 |
| dm16:0 | 0.6/0.5 | 0.0/0.0 | 0.1/0.0 | 0.0/0.0 | 0.1/0.1 | 0.9/0.9 |
| 16:0 | 38.3/35.9 | 28.4/28.4 | 27.8/24.3 | 35.4/37.6 | 19.3/20.0 | 17.5/15.2 |
| t16:1n7 | 1.0/0.5 | 0.4/0.5 | 1.0/0.8 | 1.4/1.2 | 1.0/0.5 | 0.6/0.6 |
| 16:1n7 | 5.3/5.8 | 2.1/1.8 | 1.6/1.6 | 1.7/1.2 | 1.7/1.4 | 0.7/0.9 |
| dm18:0 | 0.0/0.1 | 0.1/0.1 | 0.0/0.0 | 0.1/0.1 | 0.0/0.0 | 0.3/0.3 |
| dm18:1n9 | 0.8/0.0 | 0.0/0.0 | 0.0/0.0 | 0.0/0.0 | 0.0/0.1 | 0.1/0.1 |
| dm18:1n7 | 0.1/0.4 | 0.0/0.0 | 0.0/0.0 | 0.0/0.0 | 0.0/0.0 | 0.1/0.1 |
| 18:0 | 9.5/5.8 | 4.1/3.3 | 9.0/6.2 | 9.4/10.5 | 22.5/22.3 | 15.9/14.5 |
| t18:1n9 | 0.0/0.0 | 0.0/0.0 | 0.0/0.0 | 0.0/0.0 | 0.6/0.5 | 0.0/0.0 |
| 18:1n9 | 17.3/26.3 | 24.2/28.0 | 16.5/22.5 | 15.4/22.6 | 23.0/20.6 | 3.1/4.2 |
| 18:1n7 | 1.0/1.4 | 2.1/2.7 | 1.8/2.2 | 1.8/2.8 | 1.5/1.5 | 3.1/3.9 |
| t18:2n6 | 0.1/0.0 | 0.0/0.0 | 0.0/0.0 | 0.0/0.0 | 0.1/0.2 | 0.0/0.0 |
| 18:2n6 | 11.5/11.8 | 21.8/23.4 | 18.9/23.2 | 15.8/12.1 | 5.0/4.5 | 29.5/36.9 |
| 18:3n6 | 0.3/0.3 | 0.4/0.4 | 0.4/0.5 | 0.2/0.1 | 0.1/0.1 | 0.1/0.1 |
| 18:3n3 | 0.7/0.6 | 0.6/0.4 | 0.8/0.7 | 0.5/0.1 | 0.5/0.4 | 0.5/0.4 |
| 18:4n3 | 0.0/0.0 | 0.1/0.1 | 0.0/0.1 | 0.0/0.0 | 0.0/0.0 | 0.0/0.0 |
| 20:0 | 0.2/0.1 | 0.1/0.0 | 0.3/0.2 | 0.2/0.2 | 0.3/0.5 | 0.1/0.2 |
| 20:1n15 | 0.0/0.0 | 0.0/0.0 | 0.0/0.0 | 0.0/0.0 | 0.0/0.0 | 0.0/0.0 |
| 20:1n12 | 0.0/0.0 | 0.0/0.0 | 0.0/0.0 | 0.0/0.0 | 0.0/0.0 | 0.0/0.0 |
| 20:1n9 | 0.3/0.2 | 0.6/0.5 | 0.2/0.4 | 0.3/0.6 | 0.4/0.3 | 0.1/0.3 |
| 20:3n9 | 0.0/0.0 | 0.2/0.2 | 0.3/0.3 | 0.2/0.4 | 0.0/0.0 | 0.0/0.1 |
| 20:2n6 | 0.4/0.2 | 0.7/0.6 | 0.7/0.6 | 0.9/1.0 | 0.2/0.2 | 6.6/3.6 |
| 20:3n6 | 0.8/0.6 | 1.0/0.7 | 1.0/1.0 | 1.2/0.7 | 0.8/0.9 | 0.6/0.6 |
| 20:4n6 | 3.2/2.7 | 2.4/1.5 | 4.5/3.7 | 7.3/4.0 | 9.8/11.2 | 5.6/5.2 |
| 20:3n3 | 0.0/0.0 | 0.0/0.0 | 0.1/0.1 | 0.1/0.0 | 0.1/0.1 | 0.1/0.1 |
| 20:4n3 | 0.2/0.0 | 0.1/0.0 | 0.1/0.1 | 0.1/0.0 | 0.0/0.0 | 0.1/0.1 |
| 20:5n3 | 0.4/0.3 | 0.3/0.2 | 0.4/0.3 | 0.5/0.1 | 0.4/0.4 | 0.3/0.2 |
| 22:0 | 0.3/0.3 | 0.0/0.0 | 0.1/0.0 | 0.0/0.0 | 0.6/0.4 | 0.1/0.1 |
| 22:1n9 | 1.3/0.9 | 0.2/0.1 | 0.0/0.1 | 0.1/0.2 | 0.4/0.2 | 0.6/0.4 |
| 22:2n6 | 0.0/0.0 | 0.1/0.0 | 0.0/0.2 | 0.1/0.1 | 0.0/0.0 | 0.0/0.0 |
| 22:4n6 | 0.0/0.0 | 0.0/0.0 | 0.0/0.0 | 0.0/0.0 | 0.0/0.0 | 0.0/0.0 |
| 22:5n6 | 0.0/0.0 | 0.0/0.0 | 0.0/0.0 | 0.0/0.0 | 0.0/0.0 | 0.0/0.0 |
| 22:5n3 | 0.2/0.1 | 1.0/0.4 | 1.0/0.7 | 0.0/0.4 | 0.7/0.7 | 0.3/0.3 |
| 22:6n3 | 1.8/1.5 | 4.1/1.7 | 7.6/5.1 | 1.6/0.2 | 6.4/7.2 | 11.4/8.7 |
| 24:0 | 0.6/0.5 | 0.1/0.1 | 0.0/0.0 | 0.3/0.1 | 0.3/0.6 | 0.1/0.1 |
| 24:1n9 | 0.1/0.0 | 0.0/1.0 | 0.0/0.0 | 0.0/0.0 | 1.3/2.6 | 0.1/0.1 |
| 24:6n3 | 0.0/0.0 | 0.2/0.2 | 0.0/0.0 | 0.0/0.0 | 0.0/0.0 | 0.0/0.0 |
Reduced ATP Content in PITPα−/− Cerebellum and Liver—
Electron microscopic analyses reveal not only lipid accumulation but also indications of aponecrosis in mutant hepatocytes. These indications resemble those observed in the PITPα−/− spinocerebellar system (see above) and include the significantly increased proliferation of electron-dense autophagic bodies throughout the cytoplasm (cytolysosomes) and regions of dilated smooth ER (not shown). Aponecrosis in the spinocerebellar system and in liver suggests a fundamental defect in energy metabolism in PITPα nullizygous mice. Indeed, ATP levels are diminished in PITPα−/− relative to PITPα+/+ liver (40.4 ± 8.6 versus 98.1 ± 9.3 pmol of ATP/mg of tissue; Fig. 8A). ATP/ADP ratios further emphasize this reduction (2.8 ± 0.5 for PITPα−/− and 9.1 ± 3.1 for PITPα+/+ liver; Fig. 8B). Similarly, PITPα+/+ and PITPα−/− animals exhibit 83.3 ± 5.3 and 44.9 ± 5.9 pmol of ATP/mg of cerebellum, respectively (Fig. 8A). Reduced cerebellar ATP/ADP ratios are measured as well (7.7 ± 1.0 for wild-type versus 4.2 ± 0.5 for mutant; Fig. 8B). Interestingly, PITPα+/+ and PITPα−/− brain ATP levels (40 ± 59 and 343 ± 65 pmol of ATP/mg of brain, respectively) and ATP/ADP ratios (13.6 ± 2.3 versus 9.1 ± 0.7, respectively) are comparable, thereby regionally correlating neuronal and hepatic injury with reduced cellular ATP (Fig. 8, A and B). The significant decrease in mass of the mitochondrial lipid CL in PITPα−/− liver is consistent with energetic compromise (Fig. 7C). The mass increase of CL in PITPα−/− brain may reflect compensatory attempts by this tissue to enhance mitochondrial activity in response to an unfavorable energy status (Fig. 7C).
Fig. 8. Tissue-specific energy deficits in PITPα−/− mice.

A, tissue ATP levels in PITPα−/− mice. Measurements were averaged for three determinations from each of three independent P4-P6 PITPα+/+ (solid bars) and PITPα−/− animals (hatched bars). B, ATP/ADP ratios for the indicated tissues. ADP was measured indirectly by conversion to ATP and measurement of ADP-derived ATP. No significant differences in ATP or ATP/ADP ratio were observed between measurements of cerebellar hemispheres, or selected brain or liver regions, and those of whole-organ homogenates. PITPα+/+ and PITPα−/− data are in solid and hatched bars, respectively.
Hypoglycemia in PITPα−/− Mice—
The aponecrotic cell death observed in the PITPα−/− spinocerebellar system and liver diagnoses a systemic problem. In this regard, we find PITPα−/− neonates are severely hypoglycemic. We measure 9-fold reductions in serum glucose levels of PITPα−/− mice (9.6 ± 3.6 mg/dl) relative to PITPα+/+ siblings (88.0 ± 6.6 mg/dl serum; Fig. 9A). This reduction in serum glucose is of similar magnitude to that measured for PITPα+/+ mice that are fasted overnight, despite the fact that stomachs of all PITPα−/− mice analyzed were filled with milk at the time of analysis (not shown).
Fig. 9. Hypoglycemia in PITPα−/− mice.

A, serum glucose, insulin, and β-hydroxybutyrate levels. Serum was collected from age-matched PITPα+/+ (closed bars) and PITPα−/− (hatched bars) mice. Glucose data are averaged from six age-matched PITPα+/+ and PITPα−/− mice of each genotype. Serum insulin and β-hydroxybutyrate values represent averages of triplicate measurements obtained from three mice of each genotype. Values from fasted PITPα+/+ mice (18 h) are indicated by F. B, Glc-6-Pase, phosphoenolpyruvate carboxykinase (PEPCK), and β-actin mRNA levels in PITPα+/+ and PITPα−/− liver, and proglucagon and β-actin mRNA levels in pancreas. Data are representative of at least three independent mRNA extractions and hybridizations. RNA load was normalized to 10 μg total mRNA per lane, and the β-actin data serve as indicators of normalization quality. C, glycogen was quantified for non-fasted and fasted PITPα+/+ and PITPα−/− liver, as indicated. D, kinetics of liver glycogen depletion. Age-matched PITPα+/+ (●) and PITPα−/− (□) mice with stomachs full of milk were fasted as indicated, sacrificed, and liver glycogen measured. Mean glycogen values are given for PITPα+/+ and PITPα−/− liver as solid and open bars, respectively, and statistical significance of the mean differences is given above each data set.
Reduction in serum glucose is not secondary to hyperinsulinemia. Circulating insulin levels in PITPα−/− mice are 9-fold lower than those of PITPα+/+ siblings (0.5 ± 0.2 versus 4.5 ± 0.2 ng/ml, respectively; Fig. 9A). Given the hypoglycemia of PITPα−/− mice, these low insulin levels are appropriate (see below). We also measured an increase in circulating β-hydroxybutyrate in PITPα−/− versus PITPα+/+ serum (19.1 ± 1.2 and 11.2 ± 1.8 mg/dl, respectively; Fig. 9A), and this increase is recapitulated in serum of PITPα+/+ mice that were fasted overnight (20.2 ± 0.1 mg/dl). β-Hydroxybutyrate is generated by mitochondrial oxidation of fatty acids and serves as an alternative energy source for hypoglycemic tissue. Modest elevations are scored for bilirubin and alkaline phosphatase in PITPα−/− mice (consistent with modest hepatic stress), and a 2-fold increase in the gluconeogenic enzyme aspartate aminotransferase is also measured (Table I).
Reduced Proglucagon Gene Expression in PITPα−/− Mice—
Mice normally effect dramatic changes in circulating insulin, corticosteroid, and glucagon levels to activate hepatic gluconeogenesis late in gestation. This reprogramming of hormonal signaling serves as a protective mechanism for the impending loss of the glucose source provided by the maternal circulatory system in utero (33). Mutant animals are appropriately responding to hypoglycemia as evidenced by elevated levels of circulating corticosteroids, a hormonal stimulus for gluconeogenesis. Levels of plasma corticosteroid are highly elevated in PITPα−/− mice relative to PITPα+/+ littermates (51.64 versus 19.58 ng/ml, respectively). We also compared expression of the gluconeogenic enzymes Glc-6-Pase and phosphoenolpyruvate carboxykinase in PITPα+/+ and PITPα−/− mice. Expression of both genes in PITPα−/− liver compares favorably to PITPα+/+ control as their corresponding mRNA levels in PITPα+/+ liver are 1.3 ± 0.1- and 1.1 ± 0.2-fold increased relative to those of PITPα−/− liver (Fig. 9B). Thus, transcriptional control of key gluconeogenic enzymes also appears intact in the mutant mice. Elevated serum levels of the gluconeogenic enzyme aspartate aminotransferase in PITPα−/− further support this conclusion (Table I).
By contrast, proglucagon gene expression is inappropriately depressed in PITPα−/− animals (Fig. 9B). By using β-actin mRNA as a normalizing factor, proglucagon gene expression in pancreas is reduced 11.7 ± 0.1-fold in PITPα−/− mice relative to PITPα+/+ siblings. In independent agreement with the Northern data, we record a 5-fold reduction in circulating glucagon levels in mutant animals (246.68 and 49.32 pg of glucagon/ml of plasma for PITPα+/+ and PITPα−/− mice, respectively).
Glycogen Metabolism in PITPα−/− Mice—
Normally, liver glycogen is rapidly consumed in response to hypoglycemia. Reductions in plasma glucagon therefore predict defects in glycogenolysis in PITPα−/− mice. Periodate acid-Schiff staining and visualization of glycogen rosettes by electron microscopy indicate substantial and inappropriate glycogen stores in PITPα−/− liver (not shown). Quantitative analyses support these observations. As expected, PITPa+/+ liver contains 109.0 ± 15.3 μmol of glycogen-derived glucose/g of tissue, and liver glycogen stores are depleted by a 10-h fast (Fig. 9C). Strikingly, the hypoglycemia of the mutant mice notwithstanding, PITPa−/− liver contains 107.0 ± 12.2 μmol of glycogen-derived glucose/g of tissue (Fig. 9C). This compares favorably to wild-type values.
To characterize further the derangement in glycogen metabolism, we tested whether glycogen stores in PITPα−/− liver are resistant to depletion by fast. We found that a 10-h fast evokes complete depletion of glycogen from mutant liver (Fig. 9C). When levels of liver glycogen are measured as a function of duration of fast in PITPα−/− and PITPα+/+ animals, we found the rate of glycogen depletion from fasted PITPα−/− liver is delayed. Whereas PITPα+/+ mice deplete ~50 and 70% of their liver glycogen stores by 2 and 4 h of fast, respectively, PITPα−/− mice effect only a modest 23 and 27% depletion in liver glycogen stores after 2 and 4 h of fast, respectively (Fig. 9D). Taken together, these results are not consistent with an absolute block in PITPα−/− liver glycogen catabolism. Rather, the data indicate PITPα−/− liver exhibits kinetic defects in the rate of glycogenolysis and additionally suggest an inappropriate channeling of glucose to glycogen synthesis in the hypoglycemic mutant mouse.
Morphological Alterations in PITPα−/− Pancreas—
Reduced proglucagon gene expression could reflect specific derangement of proglucagon gene expression in the mutant animals or could arise indirectly from generalized pancreatic dysfunction. Although exocrine pancreas morphologies of PITPα+/+ and PITPα−/− mice are similar, PITPα−/− pancreas exhibits obvious structural defects in that pancreatic islets are not at all prominent. Serial sectioning of PITPα+/+ and PITPα−/− pancreas, and quantification of total islets in the organ, revealed a greater than 2-fold reduction in absolute islet number in PITPα−/− pancreas relative to wild type (Fig. 10A). In addition to the significant reduction in the number of islets, the morphology of identifiable islets in PITPα−/− pancreas is also highly abnormal. Islet cells are sparse and shrunken, and large vacuolations are abundant in the islets themselves (Fig. 10B). The damage of pancreatic islets in PITPα−/− mice provides a direct rationale for reduced proglucagon expression and defective gluconeogenesis in PITPα−/− animals. Moreover, the very low levels of circulating insulin measured for PITPα−/− mice (see above) may also result from islet β-cell insufficiencies and not simply from the hypoglycemic state of these animals.
Fig. 10. Pancreatic islet cells and the unfolded protein response in PITPα−/− mice.

A, number of pancreatic islets in whole pancreas from PITPα+/+ and PITPα−/− mice. Whole pancreata were recovered from each of two PITPα+/+ and PITPα−/− mice. The individual PITPα+/+ pancreata were serially sectioned into 48 and 60 consecutive sections, respectively, whereas both PITPα−/− pancreata were each sectioned into 48 serial sections. Islets were then comprehensively counted for every section of each individual pancreas so that the total number of islets per organ was determined. The data represent the averages of the two reconstructions for PITPα+/+ and PITPα−/− pancreas (solid and open bars, respectively). B, histology of endocrine pancreas. Images from hematoxylin/eosin-stained sections of PITPα+/+ and PITPα−/− pancreas. Bars are 50 μm. C, viability of PITPα+/+ (solid bars) and PITPα−/− (hatched bars) ES cells and MEFs as a function of period of glucose starvation is indicated. Living cells were identified by a trypan blue exclusion assay. D, ER stress-induced inhibition of protein synthesis. MEFs of appropriate genotype (PITPα+/+, solid bars; PITPα−/−, hatched bars) were incubated in the presence or absence of 10 mM dithiothreitol (DTT; 15 min) or 1 μm thapsigargin (Tg; 30 min) prior to and during a 20-min pulse-radiolabeling with [35S]methionine (100 μCi/ml). Relative incorporation of radiolabel into protein was quantified as trichloroacetic acid-precipitable radioactivity and is presented as an average percentage of that measured for mock-treated control cells (100%). Values are derived from triplicate determinations from three independent experiments. PITPα+/+ and PITPα−/− MEFs exhibit essentially indistinguishable rates of incorporation of [35S]methionine into protein. E, CHOP and calnexin expression. Cell-free extracts were prepared from PITPα+/+ and PITPα−/− MEFs after an 18-h incubation with 0, 10, 20, and 50 μg/ml tunicamycin (at bottom). Equivalent amounts of protein were loaded for each sample (20 μg) and resolved by SDS-PAGE. Proteins were transferred to nitrocellulose, and the resulting blot was probed with anti-CHOP and anti-calnexin antibodies (Santa Cruz Biotechnology) and developed by enhanced chemiluminescence.
PITPα−/− Cells Are Not Generally Defective in UPR—
A linkage between activation of UPR and survival of pancreatic secretory islet cells has been demonstrated (34, 35). The ER abnormalities in PITPα-deficient enterocytes, hepatocytes, and neurons, when coupled with loss of functional pancreatic islets in mutant mice, suggested the possibility that PITPα−/− cells are intrinsically defective in UPR.
First, we compared the response of PITPα+/+ and PITPα−/− ES cells and MEFs to glucose deprivation. Cells defective in UPR are sensitive to such a challenge (34). In neither case do we record an unusual sensitivity of PITPα−/− cells to glucose deprivation. PITPα+/+ ES cells maintain levels of viability that are 71 ± 5 and 55 ± 8% of control after 42 and 72 h of glucose starvation, respectively. The corresponding viability levels for isogenic PITPα−/− ES cells are 71 ± 4 and 54 ± 10% (Fig. 10C). Similarly, PITPα+/+ MEFs exhibit viabilities of 82 ± 5 and 73 ± 10% after glucose deprivations of 42 and 72 h, respectively. Isogenic PITPα−/− MEFs exhibit corresponding viabilities of 84 ± 4 and 76 ± 8% (Fig. 10C).
Second, 35S-labeled amino acid pulse-radiolabeling experiments demonstrate that treatment of PITPα+/+ and isogenic PITPα−/− ES cells with agents that activate UPR (i.e. dithiothreitol) evoke reduced incorporation of 35S-labeled amino acids into nascent protein in both wild-type and mutant ES cells. The rate of protein synthesis in the face of dithiothreitol is 7.2 ± 0.7 and 5.2 ± 0.7% of unchallenged control for PITPα+/+ and PITPα−/− ES cells, respectively (Fig. 10D). This effect is a result of a UPR-mediated translational block (34). These findings are qualitatively reproduced in other experiments that employed thapsigargin challenge to induce UPR (Fig. 10D).
Finally, we assessed whether challenge of PITPα+/+ and PITPα−/− MEFs and ES cells with the UPR-activating agent tunicamycin leads to a differential response in expression of the ER stress-induced transcription factor CHOP and the chaperone protein calnexin. Expression of these two polypeptides is potently enhanced by induction of the UPR. Thus, CHOP and calnexin serve as reliable reporters of the UPR status in cells. As shown in Fig. 10E, CHOP is normally expressed at very low levels in PITPα+/+ and PITPα−/− MEFs, but challenge with tunicamycin evokes a robust induction of CHOP expression in MEFs of either genotype. Similarly, calnexin levels increase in both PITPα+/+ and PITPα−/− MEFs upon tunicamycin challenge (Fig. 10E). Congruent results are recorded with PITPα+/+ and PITPα−/− ES cells (not shown). We conclude PITPα−/− cells are not only competent for induction of UPR but that the nullizygous cells are not subject to constitutive activation of the UPR.
DISCUSSION
Loss of PITPα activity in mice manifests itself in spinocerebellar disease characterized by reactive gliosis of the cerebellum and brain stem and WM and GM deficits in spinal cord. The spinal cord pathologies include infiltration by inflammatory cells, aponecrosis of motor neuron cell bodies in the ventral horn, and pervasive demyelination that is particularly apparent in the dorsal columns. PITPα is also required for proper absorption of dietary fat and fat-soluble vitamins through duodenal enterocytes into the circulation and for proper lipid homeostasis in the liver. Finally, PITPα−/− mice are severely hypoglycemic. The hypoglycemia is associated with reduced proglucagon gene expression, compromise of pancreatic islet integrity, and defects in liver glycogen metabolism. These findings suggest unanticipated roles for PITPα in signaling pathways that interface with trafficking of luminal lipid cargo from the ER and glucose homeostasis in mammals.
PITPα and Neonatal Survival—
The development of PITPα−/− mice to term supports our finding that PITPα-deficient ES cells maintain pluripotency and competence for membrane trafficking and growth factor signaling (17). Rather, the neonatal mortality of PITPα−/− mice indicates a role for PITPα in regulating physiological functions that are critical in the context of the whole mouse. We conclude PITPα nullizygosity manifests itself primarily upon extinction (by birth) of the nutritional resource provided by maternal circulation in utero, and reliance of the neonate on assimilation of its own dietary intake.
PITPα Deficiency and Steatosis—
The most energy-rich component of the neonatal diet is TG, and the evidence suggests PITPα−/− mice are unable to effectively avail themselves of this nutrient source. In mammals, long chain TGs of maternal milk are hydrolyzed to monoacylglycerols and fatty acids. These compounds are transported across the apical enterocyte plasma membrane and reassembled into TG cores in the smooth ER lumen. The TG cores are then co-assembled with other lipids, fat-soluble vitamins, and apolipoproteins into chylomicrons either in the ER or in the Golgi complex. Subsequently, chylomicrons are transported across the enterocyte basolateral plasma membrane via the secretory pathway (37). Enterocytes and hepatocytes share analogous pathways for assembly and secretion of lipoproteins into the circulation. The suckling-dependent microvesicular steatosis of PITPα−/− intestine and liver suggests that PITPα plays a common role in both intestinal and hepatic pathways for secretion of dietary lipids. A failure in transport early in the secretory pathway is indicated as electron microscopy suggests neutral lipids accumulate in smooth ER of PITPα nullizygous enterocytes and in hepatocytes.
The intestinal steatosis of PITPα−/− mice exhibits similarities with human CRD, a family of autosomal recessive disorders. Human CRD patients are characterized by pediatric failure to thrive, accumulation of chylomicrons within villus-associated enterocytes of the duodenum, reductions in post-prandial plasma TG and α-tocopherol levels, and spinocerebellar involvement (18, 19, 32, 38). Similarly, PITPα−/− mice gain body mass slowly and are deficient in body fat. Moreover, villus-associated PITPα−/− enterocytes accumulate intracellular lipid in a suckling-dependent manner. Finally, PITPα−/− mice exhibit large reductions in both post-prandial plasma TG and in brain α-tocopherol. These data suggest PITPα−/− mice hydrolyze dietary TG in the lumen of the duodenum, transport the products into the enterocyte, and properly reassemble dietary TG in the ER lumen but are defective in transport of re-esterified TGs across the PITPα−/− enterocyte to the basolateral plasma membrane. The microvesicular hepatic steatosis we observe in PITPα−/− mice is not a symptom associated with human CRD, however.
PITPα Deficiency and Glucose Homeostasis—
PITPα−/− neonates are hypoglycemic, even though key gluconeogenic enzymes appear to be expressed normally. However, gluconeogenesis is an energetically expensive process as 4ATP, 2GTP, 2NADH, and 4H2O are consumed in conversion of 2 pyruvate units to 1 glucose molecule (39). Fatty acid oxidation is a potent engine that drives production of the ATP, GTP, and NADH utilized in glucose synthesis and is also involved in production of ketone bodies that serve as energy sources under conditions of low glucose availability. We suggest that the inability to effectively deliver lipid from enterocytes and hepatocytes to peripheral tissues imposes a heavy metabolic burden on PITPα−/− neonates by compromising fatty acid oxidation as a pathway for powering both gluconeogenesis and ketone production. Reductions in PITPα−/− liver ATP are consistent with this interpretation of the data.
In addition, PITPα−/− animals exhibit kinetic defects in glycogenolysis, and these maintain substantial liver glycogen in the face of hypoglycemia. These defects coincide with dramatic reductions in proglucagon gene expression in PITPα−/− pancreas. Presently, we do not believe that dysregulation of proglucagon expression reflects a direct transcriptional involvement of a nuclear PITPα pool in regulating proglucagon promoter function. Rather, we hypothesize that glucagon deficit in PITPα−/− mice more likely represents an indirect manifestation of the structurally compromised endocrine pancreas that characterizes such mutants. Yet, because the glycogen stores of PITPα−/− liver are consumed during a modest fast, we conclude that regulation of glucose allocation into the glycogen synthesis pathway must also be deranged in PITPα−/− mice.
PITPα Deficiency and Integrity of the Spinocerebellar System—
PITPα−/− neonates develop a spinocerebellar neurodegenerative disease characterized by aponecrotic cell death. In this regard, we find a correlation between site of neuronal injury and regional specificity of dramatic reduction in cellular ATP. Neonatal cerebellum may be particularly sensitive to injury in PITPα−/− mice because it attempts to sustain the extraordinary rates of cell proliferation that accompany the postnatal development of this organ in the face of a challenging energetic environment. Similarly, Purkinje cells and motor neurons are very large and metabolically active cells that are sensitive to a variety of insults. We suggest PITPα−/− Purkinje cell and motor neuron defects also represent manifestations of energy deficit in these cells, thereby raising the possibility that a significant component of the spinocerebellar disorder arises from the intrinsic hypoglycemia and/or the intestinal and hepatic steatosis of PITPα−/− mice.
Cellular Mechanisms for PITPα Function in the Mouse?—
The lines of evidence linking PITPα to potentiation of PIP synthesis suggest that the tissue defects of PITPα−/− mice result from deranged PIP metabolism. A demonstration that this is indeed the case remains elusive as such derangements are not apparent in bulk PtdIns, PtdIns-3-phosphate, PtdIns-4-phosphate, or PtdIns-4,5-bisphosphate levels in PITPα−/− ES cells (17) or MEFs (this study, not shown). Our data indicate that PITPα does not play a critical role in regulating dynamics of cell-essential phospholipid pools in most cell types.
With regard to dysregulation of cellular homeostasis in PITPα nullizygous mice, we find that derangement of ER function is a common theme. PITPs are classically invoked to function as lipid carriers that ferry PtdIns from its ER site of synthesis to signaling membranes (plasma membrane and Golgi) so that dynamic PIP pools can be replenished. In its simplest form, this model predicts that PITPα deficiency will compromise signaling in membranes distinct from the ER. Although it remains possible that disruptions of PITPα-mediated signaling in non-ER compartments manifest themselves indirectly in an ER pathology, the consistent smooth ER abnormalities of PITPα−/− spinal and cerebellar neurons, enterocytes, and hepatocytes suggest that the ER may itself represent a primary target of PITPα function. In this regard, PITPα-dependent egress of PtdIns from the cytoplasmic leaflet of ER membranes may be required for ER function via unanticipated mechanisms. Alternatively, PITPα may play unforeseen ER signaling functions that do not require PITPα-mediated transfer of lipid between organelles.
With regard to ER functions for PITPα, we entertained the idea that coupling of induction of UPR to ER secretory load is PITPα-dependent and is compromised in PITPα−/− cells. Although our finding that PITPα−/− ES cells and MEFs are UPR-competent argues against this idea, we cannot exclude the possibility that UPR defects in PITPα−/− mice are manifested only in professional secretory tissues (e.g. pancreatic islet cells, Purkinje cells, enterocytes, and hepatocytes) where high levels of cargo processing in the ER must occur efficiently.
An alternative possibility is that PITPα plays a direct and specific role in membrane trafficking from the ER in professional secretory cells by playing a direct role in facilitating membrane trafficking at the level of budding of specific ER-derived transport vesicles. This proposed activity is congruent with the role of PITPs in yeast membrane trafficking (1, 3–5). The accumulation of dietary neutral lipids in the lumen of the enterocyte and hepatocyte ER is consistent with such a function. Although constitutive and regulated secretory pathway function is normal in PITPα−/− ES cells (17), and development of PITPα−/− mice to term is also inconsistent with wholesale defects in membrane trafficking from the ER of nullizygous cells, we propose that the ER membrane trafficking function of PITPα exhibits a large degree of cargo specificity.
Is there independent supporting evidence for such a proposal? It was recently demonstrated that inactivation of the SARA2 isoform of the Sar1p GTPase forms a genetic basis for human CRD (40). Sar1p is required for the budding of COPII vesicles from ER membranes and for the concentration of cargo into such transport vesicles (41). Our data, when coupled with the demonstrations of a role for Sar1p in human CRD, suggest the attractive hypothesis that PITPα regulates the Sar1p GTPase cycle in ER membranes. We propose that a dedicated PITPα/Sar1p interface is required to optimize assembly and packaging of unusual luminal cargoes (such as large TG cores) into ER-derived transport vesicles. This model shares common features with previous proposals positing that the Sec14p PITP regulates the activity of specific ADP-ribosylation factor GTPase-activating proteins required for biogenesis of secretory cargo-laden transport vesicles from trans-Golgi membranes in yeast (6, 42).
Acknowledgments—
We acknowledge Douglas Cyr, Andrew Morris, Patrick Brennwald, Peter Petrusz, John York, Tushar Patel, William Snider, Virginia Godfrey, Scott Traske, and Rosalind Coleman for helpful discussions. We are particularly grateful to Gail Grossman for expert assistance in histochemistry; Hal Mekeel for helpful advice on electron microscopy; Patricia Gallagher for expert assistance in α-tocopherol measurements (University of North Carolina Clinical Nutrition Research Center supported by National Institutes of Health Grant DK56350); David Brenner and Joe Grisham for expert advice on liver histopathology; Lisa M. Bain for brain histology; and Heather Collins and Bryan Wolf (University of Pennsylvania Diabetes Center) for glucagon and corticosteroid measurements. Support for body composition assays were provided by grants from the National Institutes of Health to the University of Alabama at Birmingham Clinical Nutrition Research Center.
This work was supported in part by National Institutes of Health Grant NS37723 (to V. A. B.). The costs of publication of this article were defrayed in part by the payment of page charges. This article must therefore be hereby marked “advertisement” in accordance with 18 U.S.C. Section 1734 solely to indicate this fact.
Footnotes
The abbreviations used are: PITPs, phosphatidylinositol transfer proteins; CHOP, CCAAT/enhancer-binding protein homology protein; CL, cardiolipin; CRD, chylomicron retention disease; DAG, diacylglycerol; ER, endoplasmic reticulum; ES cells, embryonic stem cells; FFA, free fatty acids; GFAP, glial fibrillary acidic protein; GM, gray matter; Glc-6-Pase, glucose-6-phosphatase; MEFs, murine embryonic fibro-blasts; PIP, phosphoinositide; PtdCho, phosphatidylcholine; PtdIns, phosphatidylinositol; TG, triglyceride; TUNEL, terminal deoxynucleotidyltransferase-mediated dUTP nick-end-labeling; UPR, unfolded protein response; WM, white matter; CE, cholesteryl ester.
REFERENCES
- 1.Cleves AE, McGee TP, and Bankaitis VA (1991) Trends Cell Biol. 1, 30–34 [DOI] [PubMed] [Google Scholar]
- 2.Wirtz KWA (1991) Annu. Rev. Biochem 60, 73–99 [DOI] [PubMed] [Google Scholar]
- 3.Bankaitis VA, Aitken JR, Cleves AE, and Dowhan W (1990) Nature 347, 561–562 [DOI] [PubMed] [Google Scholar]
- 4.Cleves AE, McGee TP, Whitters EA, Champion KM, Aitken JR, Dowhan W, Goebl M, and Bankaitis VA (1991) Cell 64, 789–800 [DOI] [PMC free article] [PubMed] [Google Scholar]
- 5.Kearns BG, Alb JG Jr., and Bankaitis VA (1998) Trends Cell Biol. 8, 276–282 [DOI] [PubMed] [Google Scholar]
- 6.Yanagisawa L, Marchena J, Xie Z, Li X, Poon PP, Singer R, Johnston G, Randazzo PA, and Bankaitis VA (2002) Mol. Biol. Cell 13, 2193–2206 [DOI] [PMC free article] [PubMed] [Google Scholar]
- 7.Sha B, Phillips SE, Bankaitis VA, and Luo M (1998) Nature 391, 506–510 [DOI] [PubMed] [Google Scholar]
- 8.Yoder MD, Thomas LM, Tremblay JM, Oliver RL, Yarbrough LR, and Helmkamp GM Jr. (2001) J. Biol. Chem 276, 9246–9252 [DOI] [PubMed] [Google Scholar]
- 9.Dickeson SK, Lim CN, Schuyler GT, Dalton TP, Helmkamp GM Jr., and Yarbrough LR (1989) J. Biol. Chem 264, 16557–16564 [PubMed] [Google Scholar]
- 10.Tanaka S, and Hosaka K (1994) J. Biochem. (Tokyo) 115, 981–984 [DOI] [PubMed] [Google Scholar]
- 11.Fullwood Y, dos Santos M, and Hsuan JJ (1999) J. Biol. Chem 274, 31553–31558 [DOI] [PubMed] [Google Scholar]
- 12.Hay JC, and Martin TFJ (1993) Nature 366, 572–575 [DOI] [PubMed] [Google Scholar]
- 13.Ohashi M, de Vries KJ, Frank R, Snoek G, Bankaitis V, Wirtz K, and Huttner WB (1995) Nature 377, 544–547 [DOI] [PubMed] [Google Scholar]
- 14.Cunningham E, Tan SK, Swigart P, Hsuan J, Bankaitis VA, and Cockcroft S (1996) Proc. Natl. Acad. Sci. U. S. A 93, 6589–6593 [DOI] [PMC free article] [PubMed] [Google Scholar]
- 15.Milligan SC, Alb JG Jr., Elagina RB, Bankaitis VA, and Hyde DR (1997) J. Cell Biol 139, 351–363 [DOI] [PMC free article] [PubMed] [Google Scholar]
- 16.Hamilton BA, Smith DJ, Mueller KL, Kerrebrock AW, Bronson RT, van Berkel V, Daly MJ, Kruglyak L, Reeve MP, Nemhauser JL, Hawkins TL, Rubin EM, and Lander ES (1997) Neuron 18, 711–722 [DOI] [PubMed] [Google Scholar]
- 17.Alb JG Jr., Phillips SE, Rostand K, Cotlin L, Pinxteren J, Manning T, Guo S, York JD, Sontheimer H, Collawn JF, and Bankaitis VA (2002) Mol. Biol. Cell 13, 739–754 [DOI] [PMC free article] [PubMed] [Google Scholar]
- 18.Levy E (1996) Clin. Invest. Med 19, 317–324 [PubMed] [Google Scholar]
- 19.Aguglia U, Annesi G, Pasquinelli G, Spadafora P, Gambarella A, Annesi F, Pasqua AA, Cavalcanti F, Crescibene L, Bagala A, Bono F, Oliveri RL, Valentino P, Zappia M, and Quattrone A (2000) Ann. Neurol 47, 260–264 [PubMed] [Google Scholar]
- 20.Zambrowicz BP, Friedrich GA, Buxton EC, Lilleberg SL, Person C, and Sands AT (1998) Nature 392, 608–611 [DOI] [PubMed] [Google Scholar]
- 21.Nagy TR, Gower BA, and Stetson MH (1994) Can. J. Zool 72, 1726–1734 [Google Scholar]
- 22.Luna L (1968) Manual of Histological Staining Methods of the Armed Forces Institute of Pathology, pp. 143–145, Armed Forces Institute of Pathlogy, Washington, DC [Google Scholar]
- 23.Mascorro JA, and Kirby GS (1986) Proceedings of the 44th Annual Meeting of the Electron Microscopy Society of America, pp. 222–223 [Google Scholar]
- 24.Sato T (1968) J. Electron Microsc 17, 158–159 [PubMed] [Google Scholar]
- 25.Jishage K, Arita M, Igarashi K, Iwata T, Watanabe M, Ogawa M, Ueda O, Kamada N, Inoue K, Arai H, and Suzuki H (2001) J. Biol. Chem 276, 1669–1672 [DOI] [PubMed] [Google Scholar]
- 26.Passonneau J, and Lauderdale V (1974) Anal. Biochem 60, 405–412 [DOI] [PubMed] [Google Scholar]
- 27.Formigli L, Papucci L, Tani A, Schiavone N, Tempestini A, Orlandini GE, Capaccioli S, and Zecchi Orlandini S (2000) J. Cell. Physiol 182, 41–49 [DOI] [PubMed] [Google Scholar]
- 28.Sperandio S, de Belle I, and Bredesen DE (2000) Proc. Natl. Acad. Sci. U. S. A 97, 14376–14381 [DOI] [PMC free article] [PubMed] [Google Scholar]
- 29.Galli SJ, Dvorak AM, and Dvorak HF (1984) Prog. Allergy 34, 1–141 [PubMed] [Google Scholar]
- 30.Bebo BF Jr., Yong T, Orr EL, and Linthicum DS (1996) J. Neurosci. Res 45, 340–348 [DOI] [PubMed] [Google Scholar]
- 31.Pender MP, Stanley GP, Yoong G, and Nguyen KB (1990) Acta Neuropathol. 80, 172–183 [DOI] [PubMed] [Google Scholar]
- 32.Roy CC, Levy E, Green PHR, Sniderman A, Letarte J, Buts J-P, Orquin J, Brochu P, Weber AM, Morin CL, Marcel Y, and Deckelbaum RJ (1987) Gastroenterology 92, 390–399 [DOI] [PubMed] [Google Scholar]
- 33.Hanson RW, and Reshef L (1997) Annu. Rev. Biochem 66, 581–611 [DOI] [PubMed] [Google Scholar]
- 34.Harding HP, Zeng H, Zhang Y, Jungries R, Chung P, Plesken H, Sabatini DD, and Ron D (1983) Mol. Cell 7, 1153–1163 [DOI] [PubMed] [Google Scholar]
- 35.Scheuner D, Song B, McEwen E, Liu C, Laybutt R, Gillespie P, Saunders T, Bonner-Weir S, and Kaufman RJ (2001) Mol. Cell 7, 1165–1176 [DOI] [PubMed] [Google Scholar]
- 36.Weimar WR, Lane PW, and Sidman RL (1982) Brain Res. 251, 357–364 [DOI] [PubMed] [Google Scholar]
- 37.Hussain MM, Kanch RK, Zhou Z, Luchmoon J, Zu H, and Bakillah A (1996) Biochim. Biophys. Acta 1300, 151–170 [DOI] [PubMed] [Google Scholar]
- 38.Gauthier S, and Sniderman A (1983) Ann. Neurol 14, 591. [DOI] [PubMed] [Google Scholar]
- 39.Nelson DL, and Cox MM (2000) Lehninger Principles of Biochemistry, 3rd Ed., p. 729, Worth Publishers, New York [Google Scholar]
- 40.Jones B, Jones EL, Bonney SA, et al. (2003) Nat. Genet 34, 29–31 [DOI] [PubMed] [Google Scholar]
- 41.Schekman R, and Orci L (1996) Science 271, 1526–1533 [DOI] [PubMed] [Google Scholar]
- 42.Li X, Rivas MP, Fang M, Marchena J, Mehrotra B, Chaudhary A, Feng L, Prestwich GD, and Bankaitis VA (2002). J. Cell Biol 157, 63–77 [DOI] [PMC free article] [PubMed] [Google Scholar]