Abstract
Many experimental and bioinformatics approaches have been developed to characterize the human T cell receptor (TCR) repertoire. However, the unknown functional relevance of TCR profiling significantly hinders unbiased interpretation of the biology of T cells. To address this inadequacy, we developed tessa, a tool to integrate TCRs with gene expression of T cells, in order to estimate the effect that TCRs confer upon the phenotypes of T cells. Tessa leveraged techniques combining single cell RNA-sequencing with TCR-sequencing. We validated tessa and showed its superiority over existing approaches that investigate only the TCR sequences. With tessa, we demonstrated that TCR similarity constrains the phenotypes of T cells to be similar, and dictates a gradient in antigen targeting efficiency of T cell clonotypes with convergent TCRs. We showed this constraint could predict a functional dichotomization of T cells post-immunotherapy treatment, and is weakened in tumor contexts.
Keywords: T cell function, TCR, transcriptomics, integration, scRNA-Seq
INTRODUCTION
T cells are defined by their T cell receptor (TCR) sequences, which help T cells achieve highly specific TCR-dependent antigen recognition1-4. The antigen recognition triggers downstream signaling of T cells, which is a crucial biological process in normal and dysregulated conditions, such as cancers5 and autoimmune diseases6. As a result, profiling the TCR repertoire has been the core interest of many studies. Tools have been developed to enable reconstruction of TCR sequences from RNA-Seq or whole exome-Seq data (TraCer7, TRUST8 and VDJ Puzzle9), to cluster TCRs into groups by similarity, with each group likely targeting the same antigens(GLIPH10) or to measure similarities between TCRs (TCRdist11). . .
However, a fundamental limitation of these approaches is that all conclusions are drawn based on solely interrogating the TCR sequences, which oversimplifies how T cells execute their functions in the context of their microenvironment. Tubo et al12 and Buchholz et al13 showed that the intrinsic TCR-mediated signals and extrinsic cues both impact the functions of T cells. Therefore, an integrative investigation of the TCRs and their transcriptomics is in critical need, and will facilitate unbiased interpretation of the functional relevance of the TCR repertoire.
Given the high dimensional nature of TCR and transcriptomic data, it is imperative to develop statistical models that can simultaneously digest these two types of data. Several recent single cell RNA sequencing (scRNA-Seq) technologies have enabled the creation of such statistical models, eg.SMART-Seq214 and MATQ-Seq15 which are full-length scRNA-Seq protocols enabling reconstruction of the TCR The 10x Genomics Chromium Platform and the SMARTer TCR profiling kit directly amplify the TCRs, while capturing the expression of the other genes at the same time. Furthermore, the pMHC feature barcoding techniques from 10x Genomics can measure the antigen binding affinities of T cells, adding another layer of information. Similarly, ECCITE-Seq16 allows the capture of transcriptomes, TCR sequences, and cell surface protein expression for each T cell in one setting.
We developed a Bayesian model named tessa (TCR functional landscape estimation supervised with scRNA-Seq analysis) to jointly model TCRs with T cell transcriptomics at single cell resolution. We applied tessa on 100,288 T cells on 19 single T cell sequencing datasets (Supplementary Table 1) and showed that tessa enables mapping the functional landscape of the TCR repertoire and propels a comprehensive characterization of TCR sequences in the context of T cell functionality.
RESULTS
Annotating the functional relevance of the TCR repertoire
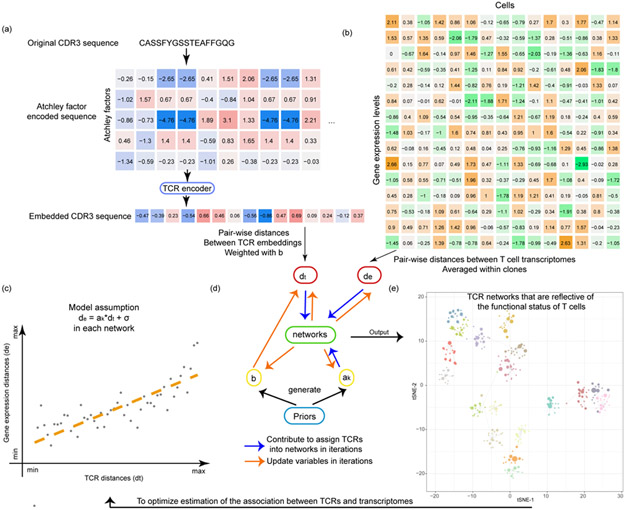
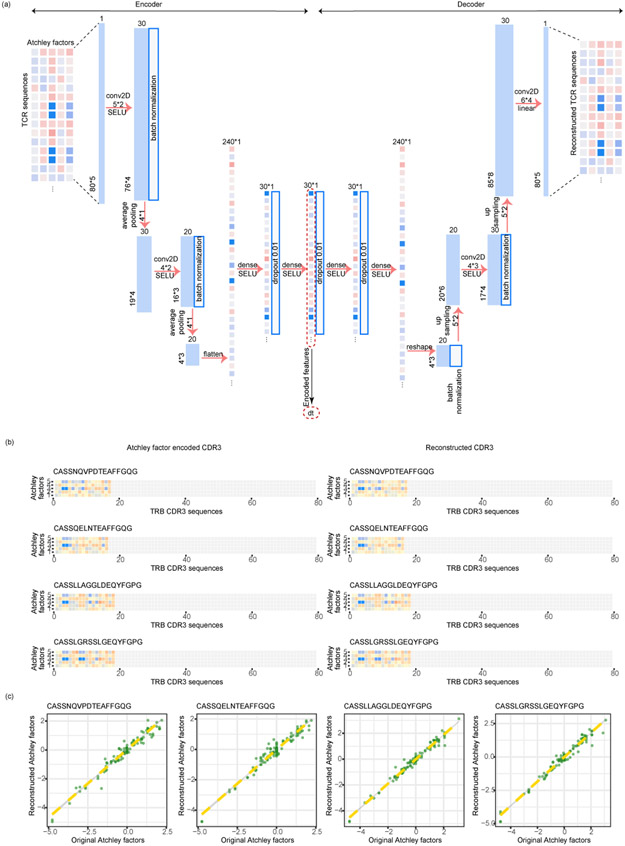
First we created a numeric embedding of TCRs, where each numeric vector represented a TCR CDR3β sequence (Fig. 1a, Extended Data Fig. 1a). In short, we encoded each amino acid of the TCR CDR3β sequences by five numbers representing the Atchley factors17, and then fed the “Atchley matrices” to a stacked auto-encoder18 (Extended Data Fig. 1a).. Atchley factors have been shown to be suitable for embedding immune cell receptor sequences19-22 In the end, the TCR sequences are represented by a 30-dimension numerical vector, which is the smallest bottleneck layer in the middle of the auto-encoder. We showed that the “Atchley matrix” versions of the TCR sequences reconstructed from the embeddings are very similar to the “Atchley matrices” of the input TCRs (Extended Data Fig. 1bc), validating our embedding methodology (Online Methods).
Fig. 1.
The tessa algorithm. (a) A flowchart shows how the TCR sequences are encoded into numeric vectors that are amenable for mathematical operations. (b) A heatmap indicating the scRNA-Seq expression matrix, which was used to calculate the expression distances, and serves as another input into the tessa model. (c) The core rationale of tessa: to combine the information from TCR and RNA expression. (d) The two key processes of the tessa model to combine the information iteratively: updating variables to maximize the association in (c) and updating TCR network assignments according to the updated variables. (e) A t-SNE plot intuitively shows tessa-identified networks of TCRs, which has incorporated expression information, and can help achieve more refined estimation of the association in (c) within each network.
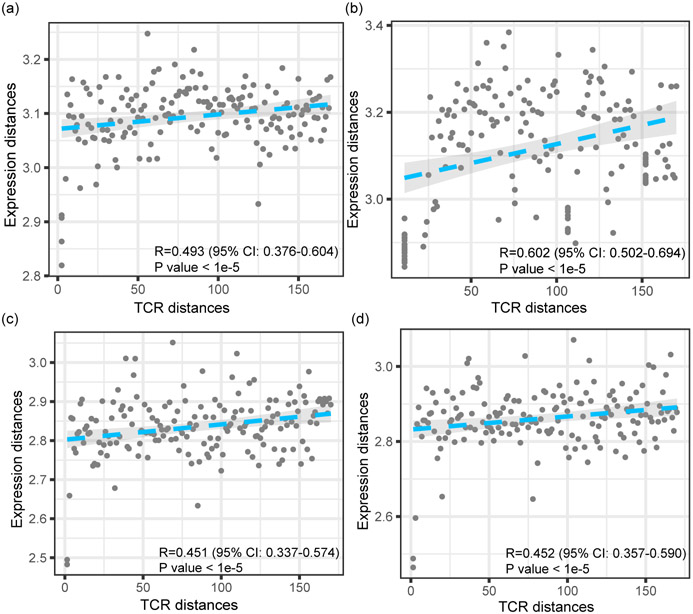
Next we investigated the correlation between TCR repertoire embeddings (Fig. 1a) and gene expression (Fig. 1b) in 19 single T cell sequencing datasets (Supplementary Table 1)10,11,16,23-31. For each dataset, we choose to investigate the correlation between the pairwise Euclidean distances between TCRs and those of the expression of T cells, which were averaged within TCR clones. Interestingly, for the majority of the datasets we studied, we observed a positive correlation between TCR distances and expression distances. Typical examples are shown in Extended Data Fig. 2, and the average correlation is 0.438 across all datasets. This indicates that T cells sharing similar TCRs are also phenotypically regulated in a similar manner. This also matches the findings by P Dash et al11 and J Glanville et al10 that T cells of similar TCR sequences often target the same antigen, although these prior works, mostly based on examining the TCR sequences alone, do not directly confirm or further investigate the functional relevance of their findings.
To fill in this void, we introduce tessa (Supplementary Note 1) to empirically map the functional relevance of the TCR repertoire. Our core rationale (Fig. 1c) is to take the expression profiles of the T cells and their TCR embeddings as input, and maximize the association between them through a parametric model, to capture the part of the functional variation of T cells accounted for by TCRs. In tessa, each digit of the 30-digit TCR embedding is adjusted by a weight to maximize the correlation between the expression of T cells and the TCR embeddings (Fig. 1d). Simultaneously, similar TCRs defined by the weighted embeddings are grouped into TCR networks reflective of antigen specificity (Fig. 1e). These two steps are alternated until tessa achieves convergence. In each alteration, we adjust weights of the embedding according to the TCR-expression correlations calculated from only the T cell clones within the same networks.
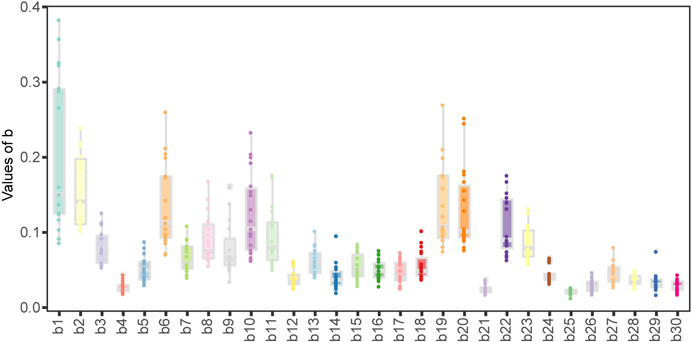
We applied tessa on the single cell sequencing datasets that we collected, and discovered that the adjusted weights of the TCR embeddings independently determined from each dataset are similar to each other (Extended Data Fig. 3). The adjusted weights can be regarded as a characterization of the latent space where TCRs and expressions are best aligned. The pairwise Pearson Correlation Coefficients of the weight vectors from all datasets ranged from 0.783 to 0.993. This suggests that tessa likely infused relevant phenotypic information, gleaned from single T cell gene expression, into interpretation of the TCR sequences, rather than irrelevant random noises.
Convergent TCR recombinations form a gradient of targeting efficiency
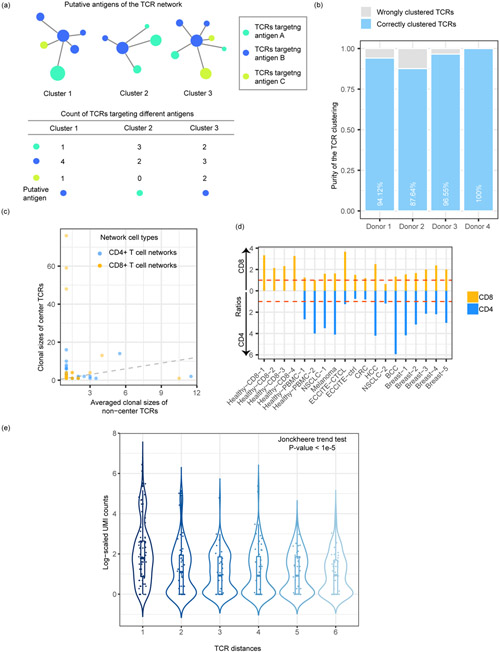
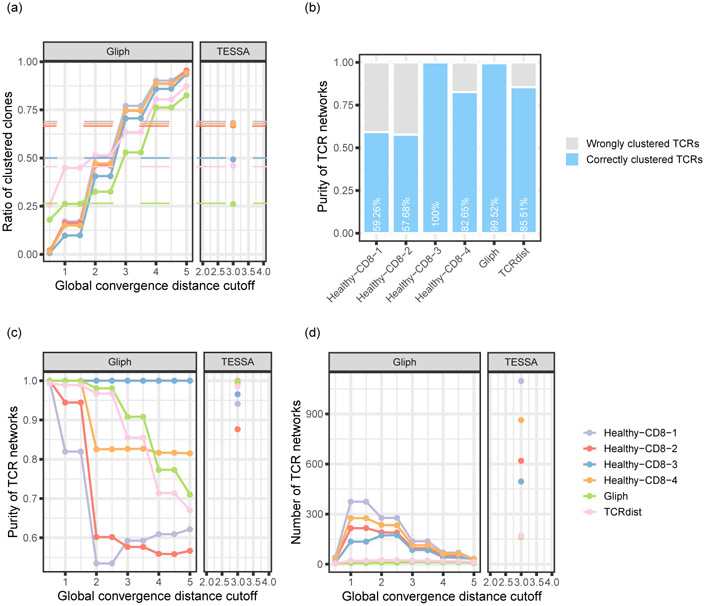
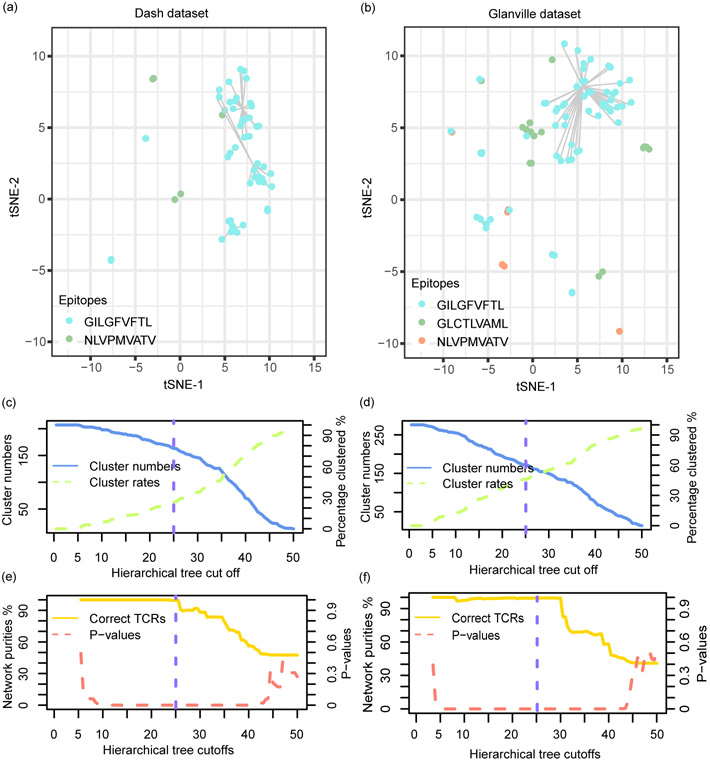
We first questioned whether the TCR networks detected by tessa indeed reflect antigen specificity. We investigated four 10x Genomics single T cell sequencing datasets, in which the expression of genes, TCR sequences, and the antigen binding specificity in the context of 44 pMHCs were profiled simultaneously for each T cell. We applied tessa on these datasets, and calculated the ‘purity’ of the constructed networks. This purity was calculated by counting the number of TCRs of the largest subset of TCR clonotypes that target the same antigen (the ‘putative antigen’, Fig. 2a) in each network. Fig. 2b shows that in each of the 4 datasets, the purity ranges between 87.64%−100%. We also applied GLIPH and observed an average purity of 61.65% (Extended Data Fig. 4) at about the same clustering rate. Furthermore, we analyzed two other TCR datasets10,11 with known epitope-binding specificity. As these two were not scRNA-seq datasets and could not be analyzed by tessa directly, we performed hierarchical clustering of the TCRs in each dataset based on the scaled TCR embeddings inferred from the scRNA-Seq datasets by tessa (the average scaling in Extended Data Fig. 3). We found that the TCR network purities achieved 99.52% and 98.55% for each dataset (Extended Data Fig. 5), with a cutoff to split the hierarchical clustering that results in clustering rates comparable to those of tessa on the scRNA-Seq datasets. GLIPH achieved purities of 85.51% and 99.51% at about the same clustering rate (Extended Data Fig. 4).
Fig. 2.
TCR networks demonstrate a gradient of targeting efficiency. (a) The calculation of TCR network purity. (b) Clustering purities in the four 10X Healthy-CD8 datasets. Unexpanded clones with only one T cell and networks with only one clone were excluded. The numbers of unique TCRs were 119, 364, 87 and 62, respectively. (c) One typical example (Breast-5) to show the clonal sizes of center TCRs and the median clonal sizes of non-centered TCRs for each network. The dashed line represents the X=Y line. 79 CD8+ and 150 CD4+ TCR networks with at least three clones were included. (d) Ratios representing central clones’ expansion levels of the CD8/CD4 clones in each dataset. (e) The decreasing gradient of antigen binding strength for TCRs, along with increasing dissimilarity to the center TCRs. The TCR clonotypes from each dataset were divided into six groups of equal size (N=198). Unexpanded clones with only one T cell and networks with only one clone were excluded.
Next, we asked whether tessa networks help to differentiate the antigen binding efficiency among different TCRs that target the same antigen. The different TCR clonotypes from the same TCR networks are generated from multiple VDJ recombinations. We hypothesize that the TCR clonotype that is closest to the “average” of all the clonotypes, within the same networks, should have better antigen targeting efficiency, which is a phenomenon sometimes referred to as “the wisdom of the crowds”32-34. To confirm this hypothesis, we divided the TCRs in the same networks into center T cells (the TCR that is closest to the average of all TCRs in each network) and non-center T cells. For each TCR network, we calculated the median of the clonal sizes of the non-center clones and compared the medians with the clone sizes of the center clones (Fig. 2c, representative example) For each of our datasets, we counted the numbers of TCR networks with a larger/smaller center clonal size than the corresponding non-center median, and the former was divided by the latter to obtain a ratio to represent the central clone’s expansion level. We found that, in 17 out of 19 datasets, more T cell networks demonstrate the phenotype that the center T cell clones are more expanded (Fig. 2d). This conforms to the theory of convergent VDJ recombinations, where TCRs in the same TCR networks are similar and the TCRs of the center T cells have better avidity towards the target antigens than the other non-center T cells, and thus are more strongly activated and more proliferative.
We further confirmed this hypothesis via directly examining the antigen binding strength of the TCRs, by analyzing the antigen binding data captured by pMHC feature barcodes for each T cell. The feature barcode technology of 10X is a method for adding extra channels of information to cells by running scRNA-seq in parallel with other assays. Binding strength of each T cell was measured by the Unique Molecular Identifier (UMI) barcode count for the pMHC targeted by the majority of the TCRs in the same networks. Medians of the UMI counts of different T cells sharing the same TCR were taken. For each TCR network identified by tessa, we divided its different TCR clonotypes into six groups of equal size depending on their dissimilarity from the TCRs of the center T cells (Fig. 2e). We observed a decreasing gradient of binding strengths along with increasing dissimilarity of TCRs from the center TCRs. In other words, the TCRs that are more similar to the center TCR are most efficient in antigen binding, while the other more divergent TCRs have less binding affinity.
TCR-dependent dichotomization of T cells post-immune checkpoint inhibitor treatment
We investigated whether tessa could reveal insights into the human T cell machinery under therapeutic interventions. We examined the tumor infiltrating T cells of 11 basal cell carcinoma (BCC) patients (6 responders and 5 non-responders)31. Yost et al demonstrated that the T cell clones in tumors before anti-PD-1 therapy had limited proliferation capacity, while the expanded T cell clones in response to the immunotherapy were derived mostly from newly-infiltrated T cells. However, in their work, TCRs are mainly used as a marker of clonal expansion.
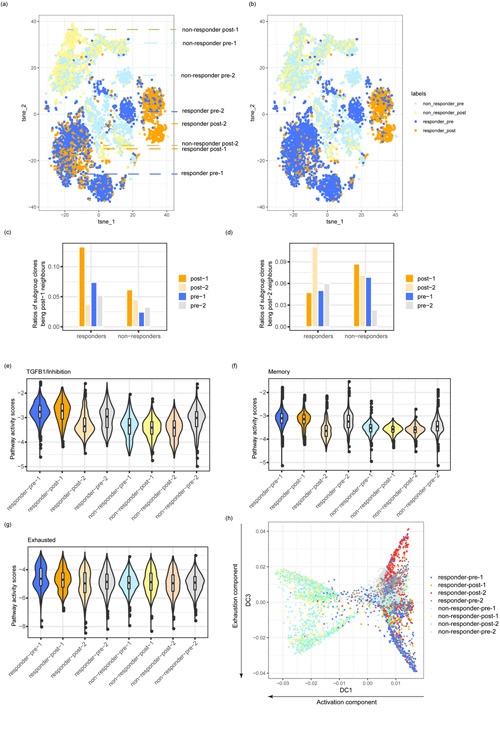
To analyze these data with tessa, we defined the TCR clonotypes of all T cells in the post-treatment library as ‘post-treatment’ clonotypes. All other T cell clonotypes were defined as ‘pre-treatment’. Then through majority voting based on clonotype-level labels, we defined pre-/post-treatment tessa networks (Materials and Methods). We performed t-SNE analyses of the T cells, and assigned a pre/post-treatment clonotype (Fig. 3a) and a pre/post-treatment network (Fig. 3b) label to each T cell. We observed that the T cells from the responders formed three distinct clusters, with one cluster mostly comprised of post-treatment clones (post-2), the second cluster comprised of both pre- and post-treatment clones (pre-1 and post-1 respectively), and the third cluster consisted mostly of pre-treatment clones (pre-2) (Fig. 3a). Interestingly, labeling the T cells with their network identities showed that most T cells that belong to the post-1 clones and infiltrated the pre-1/post-1 cluster actually belong to pre-treatment networks (Fig. 3b). By examining the most similar TCR clones (‘neighbours’) based on Euclidean distances of TCR embeddings, we found that, in responders, other than to post-1 clones themselves, post-1 clones are next most similar to the pre-1 clones explaining their presence in the pre-treatment networks (Fig. 3c). We applied the same analysis on post-2 clones from responders (Fig. 3d), and showed that pre-1 clones are not their closest “neighbors”. Therefore, our analysis offers a much more detailed view than Yost et al that the post-treatment T cells in responders actually consist of two distinct populations due to their differential TCR profiles.
Fig. 3.
TCR similarity determines fate of T cells post-immunotherapy treatment. (a,b) T-SNE plots of the post-treatment and pre-treatment cells from all the BCC patients (dataset BCC, Supplementary Table 1). The colors represent either clonal level labels (a) or network level labels (b). TCR networks were built separately for cells from each patient. The post-1, post-2, pre-1 and pre-2 subgroups were described in the result section. (c,d) The ratios of clones of the neighbors of post-1 (c) and post-2 (d) in each subgroup. (e-g) Pathway activity scores including TGFB1/inhibition gene pathway (e), memory gene pathway (f), and exhausted gene pathway (g) of the different cell subgroups. (h) Diffusion map analysis showing the cell subgroup distribution along the activation diffusion component and the exhaustion diffusion component. The numbers of T cells in the eight subgroups analyzed in Fig. 3 were: responders: N(post-1) =389, N(post-2) =841, N(pre-1) =1321, N(pre-2) =787; non-responders: N(post-1) =550, N(post-2) =757, N(pre-1) =892, N(pre-2) =670.
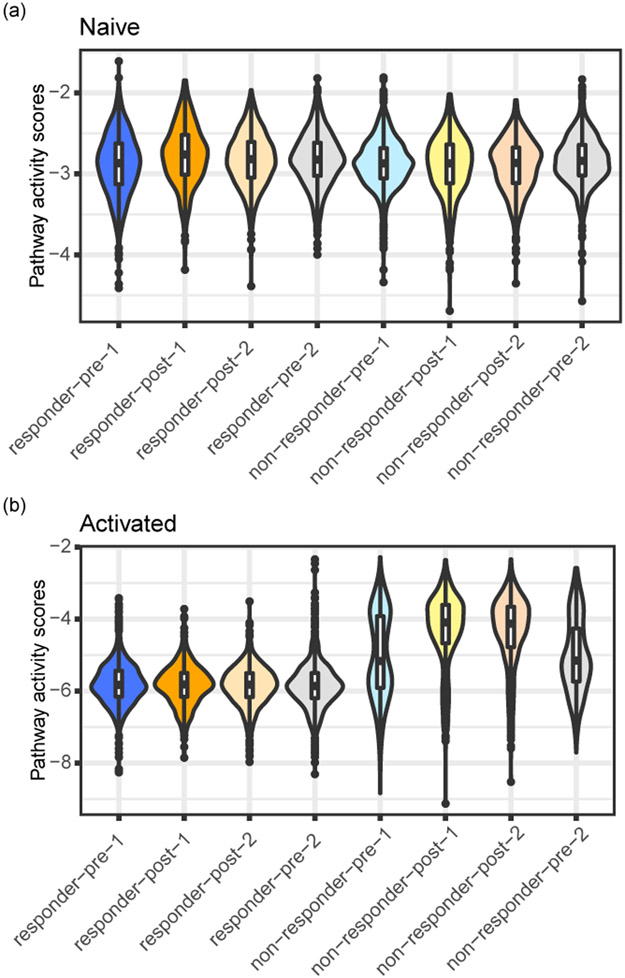
We examined the genes that are differentially expressed in responder post-1 cells compared with post-2 cells. We identified TGFB1 as the top differentially expressed gene that is related to immune pathways, which was shown to be a strong inhibitor of CD8+ T cell functions and also a marker of exhaustion35. We identified a TGFB1/inhibition signature by including genes that are highly correlated with the expression of TGFB1. In responders, this inhibition pathway is highly expressed in pre-1 and post-1 cells, compared with post-2 cells (Fig. 3e). Furthermore, we examined pathway activities (naive, memory, activated, and exhausted) derived from the pathway signature genes defined by Yost et al31. In alignment with our observation above, post-1 and pre-1 T cells in responders had similar memory and exhaustion pathway activity levels, which are higher than post-2 T cells (Fig. 3f, g). Post-1, post-2, pre-1, and pre-2 T cells from the responders had similar levels of naive and activated pathway activities (Extended Data Fig. 6).
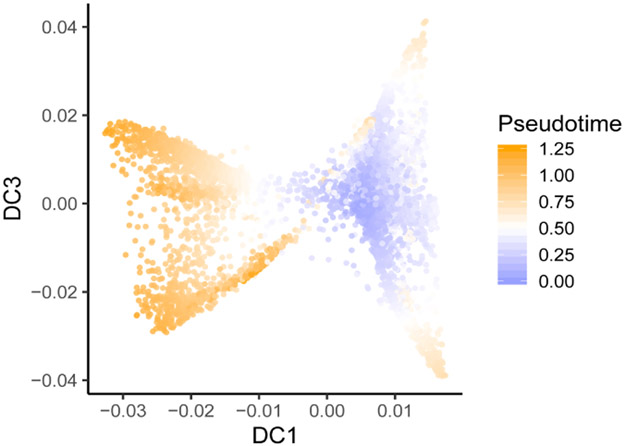
Furthermore, we employed diffusion map analysis (Fig. 3h) and ordered cells in pseudotime (Extended Data Fig. 7). The first diffusion component (DC1) was highly correlated with the activation status and it separated post-1 and post-2 cells of non-responders from the other T cells. The third diffusion component (DC3) represented the exhaustion levels and we observed that pre-1 and post-1 cells were separated from post-2 cells of the responders, which is consistent with our pathway analyses.
Overall, tessa discovered that the TCRs of post-immunotherapy treatment T cells determined that only some of them are truly “new” to the tumor microenvironment, and these T cells are probably the real functional effectors. In comparison to responders, this dichotomization of post-treatment T cells is not observed in non-responders (Fig. 3), which could underlie the lack of response in these patients.
TCR-dependent constraint on T cell phenotype is weakened in tumor contexts
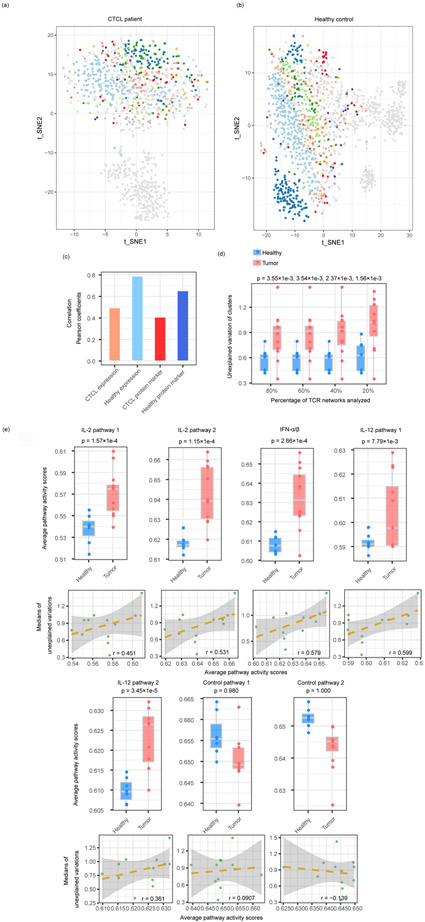
Tessa enables a comprehensive comparison of the functional implication of the TCR repertoire on the T cells in different contexts. We first examined two datasets16, where T cells from a healthy donor and a patient with Cutaneous T-cell lymphoma (CTCL) were processed by ECCITE-Seq. In the t-SNE plots of the CD8+ T cells of both datasets, we highlighted the top ten TCR clonotypes with the largest clonal sizes (Fig. 4a, b). Interestingly, different T cells in the same clones from the healthy donor are clustered rather closely by clone identity, while T cell clones from the CTCL patient are distributed much more diffusely. This observation hints that, compared with the T cells from the healthy control, those from the CTCL patient are more homogeneous functionally regardless of clonotypes.
Fig. 4.
CD8+ T cells are functionally constrained by TCRs differently in healthy donors and tumor patients. (a,b) t-SNE plots of the T cells from a CTCL patient (a) and a healthy donor (b). Cells in each of the top 10 largest clones were labeled in non-grey colors, and the other cells were labeled in grey. The total numbers of cells were 1,103 for (a) and 1,462 for (b). (c) Correlation between the TCR distances and the RNA/protein expression distances of CTCL and healthy donor T cells datasets. (d) The boxplots show the unexplained variance of TCR networks from the twelve tumor samples of different cancer types and the seven healthy samples combined (Supplementary Table 1). X-axis indicates the percentages of TCR networks analyzed with cutoffs. The P values were generated from one-sided Student’s T-tests. (e) Differences between the pathway activities calculated from the different cancer and healthy datasets, as in (d) (upper panel) and the correlation between average pathway activity scores and medians of unexplained gene expression variances by TCR in all tumor datasets (lower panel) (Supplementary Table 1). The P values were generated from one-sided Student’s T-tests. The shaded areas denote the 95% confidence intervals for linear regressions.
We applied tessa to study this phenomenon more quantitatively. Based on the tessa-weighted TCR embeddings, we calculated the pairwise TCR distances and the pairwise expressional distances of TCR clonotypes as we did in Extended Data Fig. 2. We found that, although T cell clones with more similar TCRs are more likely to share similar expressional profiles, the correlation between TCR and gene expression for the CTCL patient was much smaller compared with that in the healthy donor (Fig. 4c). Taken together, in CTCL, the T cell clonotypes are less constrained by their TCRs and demonstrate a more homogenized pattern.
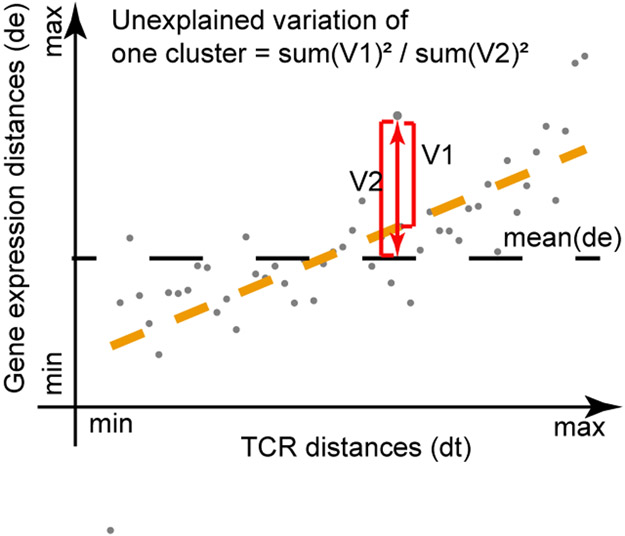
We further investigated the whole panel of CD8+ T cells from the 19 single T cell RNA-sequencing datasets (seven healthy PBMC samples and twelve tumor samples of different cancer types). For each dataset, we calculated the ‘unexplained variations’, which are the part of variations left after deducting the TCR-constrained variations from the total gene expression variations (Extended Data Fig. 8). Interestingly, we found that the unexplained variations by TCRs are much larger for the tumor datasets than the normal datasets (Fig. 4d, Student’s T-test P-values from 0.0036 to 0.0016). To test the robustness of this observation, we set a series of cutoffs on the tessa network sizes (minimum number of TCR clonotypes in each network), and chose to only consider the larger networks in each subset. We observed the same phenomenon regardless of cutoffs (Fig. 4d). These results confirmed that, across a panel of tumor types/datasets, the functions of T cells were less constrained by TCRs in tumor patients when compared with healthy donors.
Other than TCR binding, another factor that regulates T cell function is the cytokines secreted by a variety of immune cells, especially in the tumor microenvironment36. Typical cytokines that influence CD8+ T cells include IL-2, IL-12, and IFN-α/β37-39, and we examined the activity of their downstream signaling pathways in the T cells (Online Methods). Activity scores for each pathway were calculated for each T cell and averaged in each dataset. As expected, these pathways’ activities in the T cells of the tumor datasets were overall higher than those of the healthy datasets (Fig. 4e, upper panel). According to our hypothesis, we anticipate that the stronger these pathways’ activities are, the more the T cells are regulated by these pathways, and less by the TCRs proportionally. Indeed, we observed that the upregulation of these cytokine downstream pathways is positively correlated with the high TCR-independent expression variations, across the tumor T cell cohorts of different cancer types (Fig. 4e, lower panel).
DISCUSSION
In this work, we developed the tessa model to quantitatively interpret the functional relevance of T cell repertoire. The function of T cells is determined by the overall contribution from a number of factors, such as TCR-antigen interaction, the environmental cytokine/chemokine, etc. After antigen exposure, the naive T cells become activated, which is followed by exhaustion and formation of memory T cells40,41. Using tessa as a tool, we showed that TCR similarity/dissimilarity determines a significant portion of the functional variation of T cells. Our results are in alignment with Tubo et al12, who revealed that each naive T cell has a tendency to produce certain types of effector cells, in part due to the nature of its unique TCR. They are also in alignment with Buchholz et al13, who similarly revealed that complex biological systems tend to balance the stochastic processes (intrinsic and extrinsic cues) and a robust outcome with a shared theme, when distinct variations of individual T cells with the same TCR are averaged out. Counter-intuitively, in tumors, the proportion of the functional variance controlled by TCRs is lower than that of the healthy donors. This could be a result of the high levels of cytokines and chemokines secreted into the tumor microenvironment37, which possibly influence all T cells simultaneously, and thus have tuned different clones of T cells to follow a similar distribution transcriptomically.
Tessa revealed insights into the behavior of the TCR repertoire that could have impactful translational value. Kalergis et al42 and Course et al43 demonstrated that when the binding affinity of the TCRs toward target antigens is too high, it hinders, rather than promotes, the activity and efficiency of T cells. Our approach of examining expression together with the TCRs of T cells could provide a more fine-grained resolution to the identification of the most promising TCRs for immunotherapies such as TCR transgenic T cells.
Our observations do not indicate that all T cells of the same TCR clonotype will have the same expressional profile. Instead, the different T cells of the same TCR clone can be either naive, memory, activated or exhausted, which is the part of functional variation of T cells that cannot be explained by TCRs. In the future, it could be of interest to further develop tessa to jointly model the TCR repertoire together with these other factors, such as cytokine/chemokine exposure, for a more comprehensive characterization of the functions of T cells in various contexts. Another future direction would be to incorporate the CDR3α sequences and V/J genes into the modeling process, whereas our work currently only considers the CDR3β chains.
In conclusion, we developed tessa, which bridges the gap between the field of TCR repertoire analysis and the field of single cell sequencing. Tessa enabled an insightful interpretation of the TCRs with empirical evidence, and can answer a variety of research questions regarding T cell biology that could not be asked before.
ONLINE METHODS
Embedding TCR sequences
First, we encoded the amino acids in TCR peptide sequences with the “Atchley factor”17 to give each TCR sequence an initial numerical representation. Atchley et al compressed a set of over 500 amino acid properties by dimensionality reduction to simplify the 500 attributes into 5 combined features in the latent space that faithfully represent the features of amino acids. The five Atchley factors correspond loosely to polarity, secondary structure, molecular volume, codon diversity, and electrostatic charge.
The resulting embedded ‘Atchley matrix’ has each row representing one digit of the ‘Atchley factor’ and each column representing one amino acid in the TCR sequence. The Atchley factor matrices are large and they are also in matrix-format, where the neighboring relationship between residues contain critical information regarding the feature of the TCRs. Thus, an algorithm will need to be used to digest the Atchley factor matrices to generate a much smaller numeric vector that has captured the critical information contained in the TCR ‘Atchley matrices’ to simplify the following steps. Stacked auto-encoders can naturally perform this task. We added zero padding to the columns to fix the shape of the matrices to 5×80. Then a stacked auto-encoder, which is capable of reconstructing the input data and capturing their inherent structural features in an unsupervised manner, was applied to the encoded TCR “Atchley matrices” (Extended Data Fig. 1a). The input and the output of the auto-encoder are exactly the same, the “Atchley matrices”. The extracted structural features are captured in the smallest fully connected layer in the middle (the bottleneck layer). In our case, the bottleneck layer outputs are a 30-neuron numeric vector embedding of the original CDR3s. The training dataset consisted of 286,477 TCRs derived from bulk RNA sequencing data and 35,374 single-cell TCR sequences, and the total number of unique TCR sequences for training was 243,747 (Supplementary Table 1).
Here we chose an 80 (x5) embedding of the CDR3β sequences for two reasons: (1) We leave room here for potentially adding the CDR3α chains in the future. CDR1 or 2 may also be added. This could be convenient for us as the structure of the auto-encoder does not need to be changed or just needs to be changed minimally, even when the other CDRs are added. In the current study, not all sequenced T cells in these scRNA-seq datasets will have matched CDR3α and 3β sequences. If we limit ourselves to CDR3αβ matched cells, we will have a modestly reduced sample size in our analyses, which is one reason why we focused on CDR3β only so far. (2) In our datasets, the longest CDR3β has 50 amino acids. If we create an embedding that is shorter, say 30(x5), it means some (though a small number) CDR3βs will need to be truncated, which is not ideal.
Alternatively, we can encode amino acids by one-hot encoding. But this way of encoding has lost the biological context, and cannot reflect the fact that some amino acids are more similar to each other than others. One might also consider more sophisticated techniques such as word2vec44. However, such models will need to be trained on a set of biologically meaningful data to be able to embed the amino acids reasonably. This would be essentially replicating the work of Atchley et al to some extent.
A brief description of the tessa model
The input to tessa are two matrices, the embedded TCR matrix of all T cells (T cells x 30-dimensional embedding) and the expression matrix for all the T cells (genes x T cells). In our study, we used our own TCR embedding described above to preprocess the original TCR sequences. However, the user is free to use any other embeddings of the TCRs, and our software implementation has taken this flexibility in input into consideration. To preprocess the expression of genes, we calculated the variation of the expression levels of each gene across all cells. Only the top 10% genes with the highest variation were kept.
Tessa is a parametric Bayesian hierarchical model. There are two major steps that are iteratively performed in the model: (1) the Dirichlet Process step, which is employed to determine the TCR networks, and (2) the parameter updating step, which updates model parameters to achieve the optimal estimation of the association between TCRs and expression.
As the input to the Dirichlet Process, in each network, we defined the TCR distances between the center TCR (the TCR closest to the average of the embeddings of all the unique TCRs) and the non-center TCRs as dt, which were the Euclidean-like distances scaled with the weights b. We also defined the expression distances between the center clones and the non-center clones as de, using Euclidean distance between T cells and averaged within clones. We assumed that there was a linear regression between dt and de,
where k = 1, …, K represents different networks. ak is the regression coefficient capturing the expression-TCR correlation for each network, ek is a random error. Key parameters, b and ak, are to be updated in the second step. In each iteration, the Dirichlet Process re-assigns each TCR into either an existing or a newly-built network, based on similarity of this TCR to the other TCRs, in order to reduce the regression error above. Therefore, after the first step, the network labels of the TCRs are updated.
In the parameter updating step, according to the newly-assigned networks we update within-network distances and for each network k. The center of each network is re-considered by drawing one from the TCRs of the network, following the probabilities inversely correlated to their dts to the averaged embedding of all the TCRs in the network. The regression coefficient ak and the embedding weights b are updated according to their posteriors. We iteratively perform the two steps above, and through this process tessa essentially searches for the parameters that can maximize the correlation between and .
It is important to note that, during the estimation process, the same weight, b, is applied within networks and across networks. We hypothesize that some of the features of our 30-dim embedding could always be more important or less important for all TCRs. For example, the middle of CDR3s tend to bulge out and come into closer contact with the epitopes/MHCs, and therefore could be more important. This likely holds true for most, if not all, CDR3s. Therefore, a uniform weighting could likely find these features and scale up or down their influences for all TCRs. On the other hand, we also allowed some flexibility when correlating the transcriptomic features of the cells and the embedded TCRs, within each network. This is reflected by ak in the formula above. We adopted the so-called random effect model where we assumed the correlation, between expression and TCR, of each network, to closely follow the same population correlation, with a certain degree of network-specific deviance allowed. This ensures that a general rule is found to correlate expression and TCR, but the characteristics of different TCR networks are also taken into consideration.
A detailed description of the tessa model can be found in Supplementary Note 1 along with simulation and diagnostics.
Correlation between TCRs in embedding space and expression of T cells
For Fig. 4c, TCR embeddings adjusted by the weights estimated by tessa were used to calculate the pair-wise TCR distances. The TCR distances and expression distances were binned by every 5,000 TCRs with the closest TCR distances. For Extended Data Fig. 2, the distance calculation method was the same as in Fig. 4c, but without the weight scaling by tessa. The TCR distances and expression distances were binned and ranked before plotting.
Assignment of antigen specificity of TCRs of the 10x Genomics scRNA-Seq datasets
The single cell immune profiling datasets released by the 10x Genomics consist of single cell 5’ gene expression libraries, TCR sequencing libraries, and antigen binding affinity measurements of CD8+ T cells from 4 healthy donors. The antigen binding affinity between the TCR of one T cell and pMHCs is determined by measuring the number of short sequences (‘UMIs’) specifically counted for each one of the 44 pMHC dCODE™ Dextramers® under investigation. In the application note released by the company (https://www.10xgenomics.com/resources/application-notes/a-new-way-of-exploring-immunity-linking-highly-multiplexed-antigen-recognition-to-immune-repertoire-and-phenotype/), their scientists validated the antigen specificities inferred from the UMIs by comparing the inferred pMHC-specific TCRs with those that have been confirmed with experiments in VDJdb (https://vdjdb.cdr3.net/), and they found exactly matching and closely similar sequence pairs (their Fig. 5 and Table 1). In another report by the 10X Genomics on the same technology (https://www.immudex.com/media/118671/tf119302-sitc-2018-immudex-poster-in-collaboration-with-10x-genomics-dcode-dextramer-technology.pdf), their research team found that flow cytometry and their feature barcoding technology identify similar dCODE Dextramer®-binding cell populations (their Fig. 4). Strikingly, that figure shows that distributions of the flow cytometry intensities (top panel) and the UMI counts (bottom panel) closely resemble each other. Therefore, that figure proves that the UMI counts are rather quantitative (at least as quantitative as conventional flow cytometry), rather than qualitative.
Our methodology to assign antigen specificity basically follows that of the original 10x report. For a T cell to be called antigen specific for one pMHC, that pMHC’s UMI count has to be >=10 and it has to be the largest across all 44 pMHCs. To give a context for the cutoff of 10, the four 10X datasets also include pMHC UMI measurements of six irrelevant peptides as negative controls to assist the detection of specific binding events. Across all cells in the four datasets, 92~97% negative control UMIs are zeros, and the average negative control counts range from 0.05 to 0.16. Importantly, for Fig. 2e, the UMI counts numbers we showed are log-scaled “clone level” UMI counts. For clones that have multiple cells sharing the same TCR, we calculated median UMI counts as clone level UMIs. It is very common for a clone to have, say, 20 cells, but only 10 cells have a specific pMHC that can be assigned according to the rule above. One clone of T cells has the same TCR, so it’s unlikely for these T cells to have different antigen specificity. In such cases, the antigen specificity for this T cell clone will be assigned according to these 10 cells’ antigen specificity (a >90% concordance has to be reached for these 10 cells). Importantly, the “clone”-level UMI counts reported in Fig. 2e will be the median of all T cells’ UMI counts in each clone. We cannot take max of the cell-level UMI counts for each clone, as bigger clones will have higher UMI counts just due to sampling size, which will bring bias into the analysis.
Hierarchical clustering of TCRs based on the weighted embedding and correlation with antigen specificity for the Dash and Glanville datasets
We analyzed the two antigen-specificity datasets (Dash and Glanville)10,11, which provided 276 and 207 TCR sequences with known antigen specificity. In these studies, single T cells from healthy donor PBMCs with known HLA types and infections of common viruses were incubated with engineered pMHCs and sorted with FACS before obtaining TCR sequences from a series of nested PCRs. Unlike scRNA-seq, these T cells do not have matched expression data. Therefore, for these two datasets, we performed hierarchical clustering based on the scaled TCR embeddings with weights learned from the single cell sequencing datasets (the b used for scaling is an average of the bs from all the single T cell sequencing datasets in Extended Data Fig. 3). The clustering also resulted in TCR networks that are similar to the TCR networks detected by tessa. Different tree height cutoffs were employed to test the stability of the results. We randomized the cluster labels and performed the same calculation 10,000 times to examine whether the clustering purity was achieved by chance. P-values were calculated as the number of trials that achieved a higher purity than the true hierarchical clustering results, divided by 10,000.
Identifying the T cell neighbours based on tessa-weighted TCR similarity
We identified the ‘neighbours’ for each of the TCR clones in the post-1 and the post-2 subgroups in Fig. 3c, d. For each clone, we calculated the tessa-weighted TCR distances between that clone and all the other clones with different TCRs from the same patient, and we selected the clone with the smallest TCR distance as the ‘neighbour’ of the previous clone. We counted the number of the neighbours that belong to each subgroup (pre-1, pre-2, post-1, and post-2), and divided those numbers by the total number of clones in that subgroup to obtain percentages.
Construction of gene modules and calculation of gene pathway activity scores
In Fig. 3e-g and Extended Data Fig. 6ab, we first selected 11 previously established individual marker genes representing 5 key T cell function pathways, including naive T cell markers (IL7R), memory T cell markers (CXCR3, GZMK), activated T cell markers (IFNG, TNF, FOS, JUN), and exhausted T cell markers (ITGAE, ENTPD1, GZMB, LAG3) defined by Yost et al31. We also examined the differentially expressed genes between post-1 cells and post-2 cells from responders. We identified TGFB1 as the top highly expressed gene in the post-1 cells that is related to immune pathways35. To increase the stability of our analyses, we expanded these individual genes to pathways by including the 13 genes that show the highest levels of positive correlations for each individual gene marker.
In Fig. 4e, the IL-2 signaling pathway #1 included 13 genes from Conley et al38 and Cho et al39. The other four pathways, including the IL-2 pathway #2 (GSE39110_UNTREATED_VS_IL2_TREATED_CD8_TCELL_DAY3_POST_IMMUNIZATION_DN), the IFN-α/β pathway (GSE15930_STIM_VS_STIM_AND_IFNAB_24H_CD8_T_CELL_DN), the IL-12 pathway #1 (GSE22443_NAIVE_VS_ACT_AND_IL12_TREATED_CD8_TCELL_DN) and #2 (GSE13173_UNTREATED_VS_IL12_TREATED_ACT_CD8_TCELL_DN), were selected from version 7.0 of the molecular signature database (MSigDB) (http://www.broadinstitute.org/gsea/msigdb/index.jsp): the c7 immunologic signatures. The two negative control pathways were generated with 200 randomly selected genes from all unique genes included in the c7 immunologic signatures. These selected genes in each pathway were shown in Supplementary Table 2. To determine the pathway activity scores, we normalized the RNA-expression raw counts by dividing raw counts of each gene and each cell by the sum of raw counts of each corresponding cell. The normalized expression values of the genes belonging to the same pathway were then log scaled, summed for each cell, and served as the pathway activity score in that cell. The activity scores of each pathway were scaled by their tenth roots for a better representation.
Diffusion map and pseudotime analysis
For the CD8+ T cells from BCC samples, the top 10% genes with the highest expression variations across all cells were used to calculate the diffusion components. The R package ‘destiny’ (version 3.0.1) was used to compute a neighborhood graph using 40 neighbors and the first 20 principal components. We then employed SCINA45 to detect naive CD8+ T cells with the marker gene IL7R and five genes with the highest correlation with IL7R. Three randomly selected naive T cells were used as the root cell for diffusion pseudotime prediction with the ‘dpt’ function in the ‘destiny’ package using all 20 diffusion components and a window width of 0.1 to decide the branch cutoff.
Calculating the variations of gene expression unexplained by TCRs
As described before in tessa, the TCRs were grouped into K networks. In each network, the TCR distances between the center TCR and the non-center TCRs were defined as dt, their expression distances were defined as de. tessa assumed a linear regression relationship between dt and de, which is
where k = 1, …, K represents the k-th network. We defined the unexplained variations as,
The unexplained variations were calculated separately for each of the networks in each dataset.
Benchmarking analysis with GLIPH
In Extended Data Fig. 4 we performed a series of benchmarking analysis using GLIPH10. We performed the analysis on six datasets including the four Healthy-CD8 datasets from 10x Genomics, the Glanville10 dataset, and the Dash dataset11 (Supplementary Table 1). The command ‘gliph --tcr TCR_TABLE --gccutoff = n’ was used to generate clusters from the TCR sequences of these datasets. We adjusted the value of the “gccutoff” parameter from 0.5 to 5 with a step-length of 0.5 and calculated the ‘network purities’ for each choice of the parameter.
Statistical analyses
All computations and statistical analyses were carried out in the R computing environment (version 3.5.1). We employed SCINA45 to detect the CD8+ T cells and CD4+ T cells from single T cell sequencing data, based on two gene signatures that are genes specifically expressed in the CD8+ T cells and the CD4+ T cells, respectively. Within each single cell dataset to be analyzed, we defined the CD8 gene signature as the 10 genes with the highest correlation with CD8A, and the CD4 gene signature as top 10 genes most highly correlated with CD4. For all boxplots appearing in this study, box boundaries represent interquartile ranges, whiskers extend to the most extreme data point which is no more than 1.5 times the interquartile range, and the line in the middle of the box represents the median. The t-SNE analysis was performed with the ‘Rtsne’ package (version 0.15). Specifically, for Fig. 3ab and Fig. 4ab, we used the RNA expression of the T cells as the input. For Fig. 1e and Extended Data Fig. 5ab, we used the embedded TCR sequences as the input. PCA preprocessing was applied to both types of data, and the first 50 Principle Components (the default parameter of the function ‘Rtsne’) were employed to calculate the 2-dimensional (default) t-SNE representations, and they were plotted as principles ‘tSNE-1’ and ‘tSNE-2’. We applied Pearson correlation tests for all correlation analyses. Student’s T-test with two tails was used to calculate all the P-values (unless otherwise specified). The function ‘geom_smooth’ (method=‘lm’) in the package ‘ggplot2’ (version 3.1.0) was applied to calculate the regression trend lines and 95% confidence intervals. The one-sided jonckheere trend test was applied to calculate the P-value in the analysis of Fig. 2e, with the function ‘jonckheere.test’ in the package ‘clinfun’ (version 1.0.15). The hierarchical clustering was performed with the ‘hclust’ function (method = ‘manhattan’) from the package ‘stats’.
Data availability
The bulk RNA-Seq datasets used for deriving TCRs and then for the auto-encoder training are publicly available at https://gdc.cancer.gov/about-data/publications/panimmune (TCGA23), https://www.iedb.org/database_export_v3.php (IEDB), and http://friedmanlab.weizmann.ac.il/McPAS-TCR/ (McPAS25). We made the Kidney-bulkRNA24 dataset available in csv format at https://github.com/jcao89757/TESSA/tree/master/Tessa_released_data. All scRNA-seq/TCR-seq datasets are publicly available. The NSCLC-1 and healthy-PBMC-1 datasets are available on the 10X website https://support.10xgenomics.com/single-cell-vdj/datasets/2.2.0. The healthy-CD8 1-4 datasets are available on https://www.10xgenomics.com/resources/application-notes/a-new-way-of-exploring-immunity-linking-highly-multiplexed-antigen-recognition-to-immune-repertoire-and-phenotype/. The healthy-PBMC-2 dataset is also available on the 10X website https://support.10xgenomics.com/single-cell-vdj/datasets/3.0.0. The NSCLC-226, CRC27, and HCC28 datasets are downloaded from the European Genome-Phenome Archive (EGA) under accession numbers, EGAS00001002430, EGAS00001002791, and EGAS00001002072, respectively. The Breast 1-529 datasets are available on the Gene Expression Omnibus (GEO) under accession numbers, GSE114727 and GSE114724. The Melanoma30, BCC31 and ECCITE-seq16 datasets are also on the GEO database under study numbers, GSE123139, GSE113590 and GSE126310. The Glanville10 dataset is downloaded from https://doi.org/10.1038/nature22976. The Dash11 dataset is available in the NCBI Sequence Read Archive (SRA) under accession number SRP101659. The details of the data used, including sample size, role in the analysis, and references, are shown in Supplementary Table 1. All scRNA-seq data were involved in Fig. 2 (directly or indirectly mentioned), the BCC scRNA-seq data were used in Fig. 3, and all scRNA-seq data were used in Fig. 4.
Code availability
The tessa model: https://github.com/jcao89757/tessa (doi: 10.5281/zenodo.4161819)46
The SCINA model: https://github.com/jcao89757/SCINA (doi: 10.3390/genes10070531)45
Reporting Summary
Please refer to Life Sciences Reporting Summary regarding detailed information on experimental design.
Extended Data
Extended Data Fig. 1.
Details of the stacked auto-encoder for TCR embedding. (a) The structure of the auto-encoder, with the configurations of each layer shown. (b) Typical examples of TCR CDR3b sequences, heatmaps of the initially embedded ‘Atchley’ matrices of TCRs, and heatmaps of the auto-encoder-reconstructed ‘Athley’ matrices. The TCR sequence examples were not used in the training step of the auto-encoder. (c) Scatterplots showing the consistency between the ‘Atchley factor’ values of the original and re-constructed TCRs. Green points represent tiles in the heatmaps in (b).
Extended Data Fig. 2.
Scatterplots showing the relationships between the distances of TCRs and the distances of RNA expression levels for several more datasets. Both distances are calculated in a pair-wise manner between all the T cell clonotypes of each dataset. Four example datasets are shown: Healthy-CD8-3 (a), Healthy-CD8-4 (b), Breast-1 (c), and Breast-2 (d) (Supplementary Table 1). The P values indicate the significance of the Pearson correlation coefficients. The shaded areas denote the 95% confidence intervals for linear regressions.
Extended Data Fig. 3.
The weights of the TCR embeddings learned from tessa. The X axis shows the digits of the 30-dimensional embeddings, and the Y axis shows the weights learned for all datasets. Each bar represents one digit of the weights and shows the values of that digit obtained from all the 19 scRNA datasets in the Supplementary Table 1.
Extended Data Fig. 4.
Benchmarking results using GLIPH. (a) Clustering rates of the four Healthy-CD8 datasets from 10x Genomics, the Glanville dataset, and the Dash dataset under different global convergence distance cutoff (‘gccutoff’) values (Supplementary Table 1). The dashed lines represented the tessa clustering rates of the corresponding datasets. (b) Clustering purities of GLIPH when the ‘gccutoff’ equals to 3. The cutoff value was selected so that the GLIPH clusters achieved clustering rates that are most similar to the tessa networks. The clustering purities were calculated with the same method as in Fig. 2. (c, d) The GLIPH network purities (c) and number of networks (d) with different ‘gccutoff’ values, compared with the tessa network purities and the number of networks.
Extended Data Fig. 5.
The antigen binding specificity of 207 Human TCRβ chains from 704 T cells were profiled against two epitopes in the Dash dataset, and 276 TCRs from 415 T cells against three epitopes in the Glanville dataset. (a, b) T-SNE plots showing the TCR clonotypes in the space of the TCR embeddings, with the embeddings adjusted by the tessa-inferred weights. The hierarchical clustering tree cutoff used in the two plots was represented with green dashed lines in c-f. Each point in the plots represents one TCR clonotype, and the size of the point refers to the clone size. Points are colored by the true antigens that the corresponding TCRs target according to the original report. Points are connected if they are clustered into the same network based on hierarchical clustering of the TCR embeddings. T cell clones with only one cell were deemed as having low confidence and unclustered clones, which does not affect the calculation of the purities, were excluded from visualization. (c, d) The numbers of TCR networks and the clustering rates with different hierarchical tree cutoffs in the Dash dataset (c) and in the Glanville dataset (d). Cluster rates were calculated as the number of TCR clonotypes that are clustered with at least another TCR clonotype, divided by the total number of TCR clonotypes. (e, f) The network purities and p-values testing the significance of the purities with different hierarchical tree cutoffs in the Dash dataset (c) and the Glanville dataset (d). The network purity and P value calculations were described in the Online Methods section.
Extended Data Fig. 6.
T cell pathway activity scores of the different T cell subsets in the BCC dataset. The naive and activated pathways are shown, to be compared against the inhibition, memory and exhausted pathways shown in Fig. 3. The T cell subsets were the same as those in Fig. 3e-g.
Extended Data Fig. 7.
Pseudotime analysis of the different T cell subsets in the BCC dataset. The T cell subsets were the same as those in Fig. 3e-g.
Extended Data Fig. 8.
A cartoon sketch shows how the unexplained variance in gene expression of the TCR networks were determined. Details were described in the Materials and Methods section.
Supplementary Material
Supplementary Note 1 Detailed description of tessa, along with simulation and diagnostic analyses
Supplementary Note 2 More bioinformatics analyses and discussion of tessa
Supplementary Table 1 Data cohorts and details.
Supplementary Table 2 The genes in the T cell pathways used in this study.
ACKNOWLEDGEMENTS
We would like to thank Dr. LHR Xu for his valuable input on the manuscript writing. This study was supported by the National Institutes of Health (NIH) [CCSG 5P30CA142543/TW, R15GM131390/XW], and Cancer Prevention Research Institute of Texas [CPRIT RP190208/TW].
Footnotes
COMPETING INTERESTS
The authors declare no conflicts of interest.
References
- 1.Oettinger MA V(D)J recombination: on the cutting edge. Curr. Opin. Cell Biol 11, 325–329 (1999). [DOI] [PubMed] [Google Scholar]
- 2.Jung D & Alt FW Unraveling V(D)J recombination; insights into gene regulation. Cell 116, 299–311 (2004). [DOI] [PubMed] [Google Scholar]
- 3.Kappler J et al. The major histocompatibility complex-restricted antigen receptor on T cells in mouse and man: identification of constant and variable peptides. Cell 35, 295–302 (1983). [DOI] [PubMed] [Google Scholar]
- 4.Haskins K et al. The major histocompatibility complex-restricted antigen receptor on T cells. I. Isolation with a monoclonal antibody. J. Exp. Med 157, 1149–1169 (1983). [DOI] [PMC free article] [PubMed] [Google Scholar]
- 5.Staveley-O’Carroll K et al. Induction of antigen-specific T cell anergy: An early event in the course of tumor progression. Proc Natl Acad Sci USA 95, 1178–1183 (1998). [DOI] [PMC free article] [PubMed] [Google Scholar]
- 6.Skapenko A, Leipe J, Lipsky PE & Schulze-Koops H The role of the T cell in autoimmune inflammation. Arthritis Res. Ther 7 Suppl 2, S4–14 (2005). [DOI] [PMC free article] [PubMed] [Google Scholar]
- 7.Stubbington MJT et al. T cell fate and clonality inference from single-cell transcriptomes. Nat. Methods 13, 329–332 (2016). [DOI] [PMC free article] [PubMed] [Google Scholar]
- 8.Bolotin DA et al. Antigen receptor repertoire profiling from RNA-seq data. Nat. Biotechnol 35, 908–911 (2017). [DOI] [PMC free article] [PubMed] [Google Scholar]
- 9.Eltahla AA et al. Linking the T cell receptor to the single cell transcriptome in antigen-specific human T cells. Immunol. Cell Biol 94, 604–611 (2016). [DOI] [PubMed] [Google Scholar]
- 10.Glanville J et al. Identifying specificity groups in the T cell receptor repertoire. Nature 547, 94–98 (2017). [DOI] [PMC free article] [PubMed] [Google Scholar]
- 11.Dash P et al. Quantifiable predictive features define epitope-specific T cell receptor repertoires. Nature 547, 89–93 (2017). [DOI] [PMC free article] [PubMed] [Google Scholar]
- 12.Tubo NJ et al. Single naive CD4+ T cells from a diverse repertoire produce different effector cell types during infection. Cell 153, 785–796 (2013). [DOI] [PMC free article] [PubMed] [Google Scholar]
- 13.Buchholz VR et al. Disparate individual fates compose robust CD8+ T cell immunity. Science 340, 630–635 (2013). [DOI] [PubMed] [Google Scholar]
- 14.Picelli S et al. Full-length RNA-seq from single cells using Smart-seq2. Nat. Protoc 9, 171–181 (2014). [DOI] [PubMed] [Google Scholar]
- 15.Sheng K, Cao W, Niu Y, Deng Q & Zong C Effective detection of variation in single-cell transcriptomes using MATQ-seq. Nat. Methods 14, 267–270 (2017). [DOI] [PubMed] [Google Scholar]
- 16.Mimitou EP et al. Multiplexed detection of proteins, transcriptomes, clonotypes and CRISPR perturbations in single cells. Nat. Methods 16, 409–412 (2019). [DOI] [PMC free article] [PubMed] [Google Scholar]
- 17.Atchley WR, Zhao J, Fernandes AD & Drüke T Solving the protein sequence metric problem. Proc Natl Acad Sci USA 102, 6395–6400 (2005). [DOI] [PMC free article] [PubMed] [Google Scholar]
- 18.Modular learning in neural networks ∣ Proceedings of the sixth National conference on Artificial intelligence - Volume 1 at <https://dl.acm.org/doi/10.5555/1863696.1863746> [Google Scholar]
- 19.Ostmeyer J et al. Statistical classifiers for diagnosing disease from immune repertoires: a case study using multiple sclerosis. BMC Bioinformatics 18, 401 (2017). [DOI] [PMC free article] [PubMed] [Google Scholar]
- 20.Ostmeyer J, Christley S, Toby IT & Cowell LG Biophysicochemical Motifs in T-cell Receptor Sequences Distinguish Repertoires from Tumor-Infiltrating Lymphocyte and Adjacent Healthy Tissue. Cancer Res. 79, 1671–1680 (2019). [DOI] [PMC free article] [PubMed] [Google Scholar]
- 21.Thomas N et al. Tracking global changes induced in the CD4 T-cell receptor repertoire by immunization with a complex antigen using short stretches of CDR3 protein sequence. Bioinformatics 30, 3181–3188 (2014). [DOI] [PMC free article] [PubMed] [Google Scholar]
- 22.Zhang AW et al. Interfaces of malignant and immunologic clonal dynamics in ovarian cancer. Cell 173, 1755–1769.e22 (2018). [DOI] [PubMed] [Google Scholar]
- 23.Thorsson V et al. The immune landscape of cancer. Immunity 48, 812–830.e14 (2018). [DOI] [PMC free article] [PubMed] [Google Scholar]
- 24.Wang T et al. An empirical approach leveraging tumorgrafts to dissect the tumor microenvironment in renal cell carcinoma identifies missing link to prognostic inflammatory factors. Cancer Discov. 8, 1142–1155 (2018). [DOI] [PMC free article] [PubMed] [Google Scholar]
- 25.Tickotsky N, Sagiv T, Prilusky J, Shifrut E & Friedman N McPAS-TCR: a manually curated catalogue of pathology-associated T cell receptor sequences. Bioinformatics 33, 2924–2929 (2017). [DOI] [PubMed] [Google Scholar]
- 26.Guo X et al. Global characterization of T cells in non-small-cell lung cancer by single-cell sequencing. Nat. Med 24, 978–985 (2018). [DOI] [PubMed] [Google Scholar]
- 27.Zhang L et al. Lineage tracking reveals dynamic relationships of T cells in colorectal cancer. Nature 564, 268–272 (2018). [DOI] [PubMed] [Google Scholar]
- 28.Zheng C et al. Landscape of Infiltrating T Cells in Liver Cancer Revealed by Single-Cell Sequencing. Cell 169, 1342–1356.e16 (2017). [DOI] [PubMed] [Google Scholar]
- 29.Azizi E et al. Single-Cell Map of Diverse Immune Phenotypes in the Breast Tumor Microenvironment. Cell 174, 1293–1308.e36 (2018). [DOI] [PMC free article] [PubMed] [Google Scholar]
- 30.Li H et al. Dysfunctional CD8 T Cells Form a Proliferative, Dynamically Regulated Compartment within Human Melanoma. Cell 176, 775–789.e18 (2019). [DOI] [PMC free article] [PubMed] [Google Scholar]
- 31.Yost KE et al. Clonal replacement of tumor-specific T cells following PD-1 blockade. Nat. Med 25, 1251–1259 (2019). [DOI] [PMC free article] [PubMed] [Google Scholar]
- 32.Eduati F et al. Prediction of human population responses to toxic compounds by a collaborative competition. Nat. Biotechnol 33, 933–940 (2015). [DOI] [PMC free article] [PubMed] [Google Scholar]
- 33.Bansal M et al. A community computational challenge to predict the activity of pairs of compounds. Nat. Biotechnol 32, 1213–1222 (2014). [DOI] [PMC free article] [PubMed] [Google Scholar]
- 34.Costello JC & Stolovitzky G Seeking the wisdom of crowds through challenge-based competitions in biomedical research. Clin. Pharmacol. Ther 93, 396–398 (2013). [DOI] [PubMed] [Google Scholar]
- 35.Waugh KA et al. Molecular Profile of Tumor-Specific CD8+ T Cell Hypofunction in a Transplantable Murine Cancer Model. J. Immunol 197, 1477–1488 (2016). [DOI] [PMC free article] [PubMed] [Google Scholar]
- 36.Wu AA, Drake V, Huang H-S, Chiu S & Zheng L Reprogramming the tumor microenvironment: tumor-induced immunosuppressive factors paralyze T cells. Oncoimmunology 4, e1016700 (2015). [DOI] [PMC free article] [PubMed] [Google Scholar]
- 37.Burkholder B et al. Tumor-induced perturbations of cytokines and immune cell networks. Biochim. Biophys. Acta 1845, 182–201 (2014). [DOI] [PubMed] [Google Scholar]
- 38.Conley JM, Gallagher MP & Berg LJ T Cells and Gene Regulation: The Switching On and Turning Up of Genes after T Cell Receptor Stimulation in CD8 T Cells. Front. Immunol 7, 76 (2016). [DOI] [PMC free article] [PubMed] [Google Scholar]
- 39.Cho J-H et al. Unique features of naive CD8+ T cell activation by IL-2. J. Immunol 191, 5559–5573 (2013). [DOI] [PubMed] [Google Scholar]
- 40.Iezzi G, Karjalainen K & Lanzavecchia A The duration of antigenic stimulation determines the fate of naive and effector T cells. Immunity 8, 89–95 (1998). [DOI] [PubMed] [Google Scholar]
- 41.Moskophidis D, Lechner F, Pircher H & Zinkernagel RM Virus persistence in acutely infected immunocompetent mice by exhaustion of antiviral cytotoxic effector T cells. Nature 362, 758–761 (1993). [DOI] [PubMed] [Google Scholar]
- 42.Kalergis AM et al. Efficient T cell activation requires an optimal dwell-time of interaction between the TCR and the pMHC complex. Nat. Immunol 2, 229–234 (2001). [DOI] [PubMed] [Google Scholar]
- 43.Corse E, Gottschalk RA, Krogsgaard M & Allison JP Attenuated T cell responses to a high-potency ligand in vivo. PLoS Biol. 8, (2010). [DOI] [PMC free article] [PubMed] [Google Scholar]
- 44.Inc., T. & View, M. Efficient Estimation of Word Representations in Vector Space.
- 45.Zhang Z et al. SCINA: A Semi-Supervised Subtyping Algorithm of Single Cells and Bulk Samples. Genes (Basel) 10, (2019). [DOI] [PMC free article] [PubMed] [Google Scholar]
- 46.Zhang Z jcao89757/TESSA: Mapping the Functional Landscape of T Cell Receptor Repertoire by Single T Cell Transcriptomics. Zenodo (2020). doi: 10.5281/zenodo.4161819 [DOI] [PMC free article] [PubMed] [Google Scholar]
Associated Data
This section collects any data citations, data availability statements, or supplementary materials included in this article.
Supplementary Materials
Supplementary Note 1 Detailed description of tessa, along with simulation and diagnostic analyses
Supplementary Note 2 More bioinformatics analyses and discussion of tessa
Supplementary Table 1 Data cohorts and details.
Supplementary Table 2 The genes in the T cell pathways used in this study.
Data Availability Statement
The bulk RNA-Seq datasets used for deriving TCRs and then for the auto-encoder training are publicly available at https://gdc.cancer.gov/about-data/publications/panimmune (TCGA23), https://www.iedb.org/database_export_v3.php (IEDB), and http://friedmanlab.weizmann.ac.il/McPAS-TCR/ (McPAS25). We made the Kidney-bulkRNA24 dataset available in csv format at https://github.com/jcao89757/TESSA/tree/master/Tessa_released_data. All scRNA-seq/TCR-seq datasets are publicly available. The NSCLC-1 and healthy-PBMC-1 datasets are available on the 10X website https://support.10xgenomics.com/single-cell-vdj/datasets/2.2.0. The healthy-CD8 1-4 datasets are available on https://www.10xgenomics.com/resources/application-notes/a-new-way-of-exploring-immunity-linking-highly-multiplexed-antigen-recognition-to-immune-repertoire-and-phenotype/. The healthy-PBMC-2 dataset is also available on the 10X website https://support.10xgenomics.com/single-cell-vdj/datasets/3.0.0. The NSCLC-226, CRC27, and HCC28 datasets are downloaded from the European Genome-Phenome Archive (EGA) under accession numbers, EGAS00001002430, EGAS00001002791, and EGAS00001002072, respectively. The Breast 1-529 datasets are available on the Gene Expression Omnibus (GEO) under accession numbers, GSE114727 and GSE114724. The Melanoma30, BCC31 and ECCITE-seq16 datasets are also on the GEO database under study numbers, GSE123139, GSE113590 and GSE126310. The Glanville10 dataset is downloaded from https://doi.org/10.1038/nature22976. The Dash11 dataset is available in the NCBI Sequence Read Archive (SRA) under accession number SRP101659. The details of the data used, including sample size, role in the analysis, and references, are shown in Supplementary Table 1. All scRNA-seq data were involved in Fig. 2 (directly or indirectly mentioned), the BCC scRNA-seq data were used in Fig. 3, and all scRNA-seq data were used in Fig. 4.


