

Abstract
Breast cancer susceptibility variants frequently show heterogeneity in associations by tumor subtype1–3. To identify novel loci, we performed a genome-wide association study (GWAS) including 133,384 breast cancer cases and 113,789 controls, plus 18,908 BRCA1 mutation carriers (9,414 with breast cancer) of European ancestry, using both standard and novel methodologies that account for underlying tumor heterogeneity by estrogen receptor (ER), progesterone receptor (PR), and human epidermal growth factor receptor 2 (HER2) status and tumor grade. We identified 32 novel susceptibility loci (P < 5.0 × 10⁻⁸), 15 of which showed evidence for associations with at least one tumor feature (false discovery rate (FDR) <0.05). Five loci showed associations (P<0.05) in opposite directions between luminal- and non-luminal subtypes. In-silico analyses showed these five loci contained cell-specific enhancers that differed between normal luminal and basal mammary cells. The genetic correlations between five intrinsic-like subtypes ranged from 0.35 to 0.80. The proportion of genome-wide chip heritability explained by all known susceptibility loci was 37.6% for triple-negative and 54.2% for luminal A-like disease. The odds ratios of polygenic risk scores (PRSs), which included 330 variants, for the highest 1% quantiles compared to middle quantiles were 5.63 and 3.02 for luminal A-like and triple-negative disease, respectively. These findings provide an improved understanding of genetic predisposition to breast cancer subtypes and will inform the development of subtype-specific polygenic risk scores.
Based on the largest GWAS to date from the Breast Cancer Association Consortium (BCAC), over 170 independent breast cancer susceptibility variants have been identified. Many of these variants show differential associations by tumor subtypes, particularly ER-positive versus ER-negative or triple-negative disease1–3. However, prior GWAS have not simultaneously accounted for the high correlations between multiple, correlated tumor markers, such as ER, PR, HER2 and grade, to identify specific source(s) of etiologic heterogeneity. We performed a breast cancer GWAS using both standard analyses and a novel two-stage polytomous regression method that efficiently characterizes etiologic heterogeneity while accounting for tumor marker correlations and missing data4.
The study populations and genotyping are described elsewhere1,2,5,6 and in the Online Methods. Briefly, we analyzed data from 118,474 cases and 96,201 controls of European ancestry participating in 82 studies from the BCAC and 9,414 affected and 9,494 unaffected BRCA1 mutation carriers from 60 studies from the Consortium of Investigators of Modifiers of BRCA1/2 (CIMBA) with genotyping data from one of two Illumina genome-wide custom arrays. In analyses of overall breast cancer, we also included summary level data from 11 other breast cancer GWAS (14,910 cases and 17,588 controls) without subtype information. Our study expands upon previous BCAC GWAS1 with additional data on 10,407 cases and 7,815 controls, an approximate increase of 10% and 9%, respecitvely. (Supplementary Tables 1–4).
The statistical methods are further described in the Online Methods and in Extended Data Figure 1. To identify variants for overall breast cancer (invasive, in situ or unknown invasiveness) in BCAC, we used standard logistic regression to estimate odds ratios (OR) and 95% confidence-intervals (CI) adjusting for country and principal components (PCs). iCOGS and OncoArray data were evaluated separately and the results were combined with those from the 11 other GWAS using fixed-effects meta-analysis.
To identify breast cancer susceptibility variants displaying evidence of heterogeneity, we used a novel score-test based on a two-stage polytomous model4 that allows flexible, yet parsimonious, modelling of associations in the presence of underlying heterogeneity by ER, PR, HER2 and/or grade (Online Methods, Supplementary Note). The model handles missing tumor characteristic data by implementing an efficient Expectation-Maximization algorithm4,7. These analyses were restricted to BCAC controls and invasive cases (Online Methods). We fit an additional two-stage model to estimate case-control ORs and 95% CI between the variants and intrinsic-like subtypes defined by combinations of ER, PR, HER2 and grade8 (Online Methods): (1) luminal A-like, (2) luminal B/HER2-negative-like, (3) luminal B-like, (4) HER2-enriched-like and (5) triple-negative or basal-like. We analyzed iCOGS and OncoArray data separately, adjusting for PCs and age, and meta-analyzed the results using a fixed-effects model. We evaluated the effect of country using a leave-one-out sensitivity analysis (Online Methods).
Among BRCA1 mutation carriers who are prone to develop triple-negative disease9, we estimated per-allele hazard ratios (HRs) within a retrospective cohort analysis framework. We assumed estimated ORs for BCAC triple-negative cases and estimated HRs from CIMBA BRCA1 carriers approximated the same underlying relative risk9, and we used a fixed-effect meta-analysis to combine these results (Online Methods). Among all novel variants, we used the two-stage polytomous model to test for heterogeneity in associations across subtypes, globally and by tumor-specific markers (Online Methods).
Overall, we identified 32 novel independent susceptibility loci marked by variants with P < 5.0 × 10⁻⁸ (Figure 1, Supplementary Table 5–7, Supplementary Figure 1–5): 22 variants using standard logistic regression, 16 variants using the two-stage polytomous model (eight of which were detected by standard logistic regression) and three variants in the CIMBA/BCAC-triple-negative meta-analysis (rs78378222 was also detected by the two-stage polytomous model in BCAC). Fourteen additional variants (P < 5.0 × 10⁻⁸) were excluded, 13 because they lacked evidence of association independent of known susceptibility variants in conditional analyses (P ≥ 1.0 × 10⁻⁶; Supplementary Table 8–10), and one (chr22:40042814) for showing a high-degree of sensitivity in the leave-one-out country analysis following exclusion of studies from the USA (Supplementary Figure 6). Supplementary Figures 7–8 and Supplementary Table 11 show associations between all 32 variants and the intrinsic-like subtypes.
Figure 1.
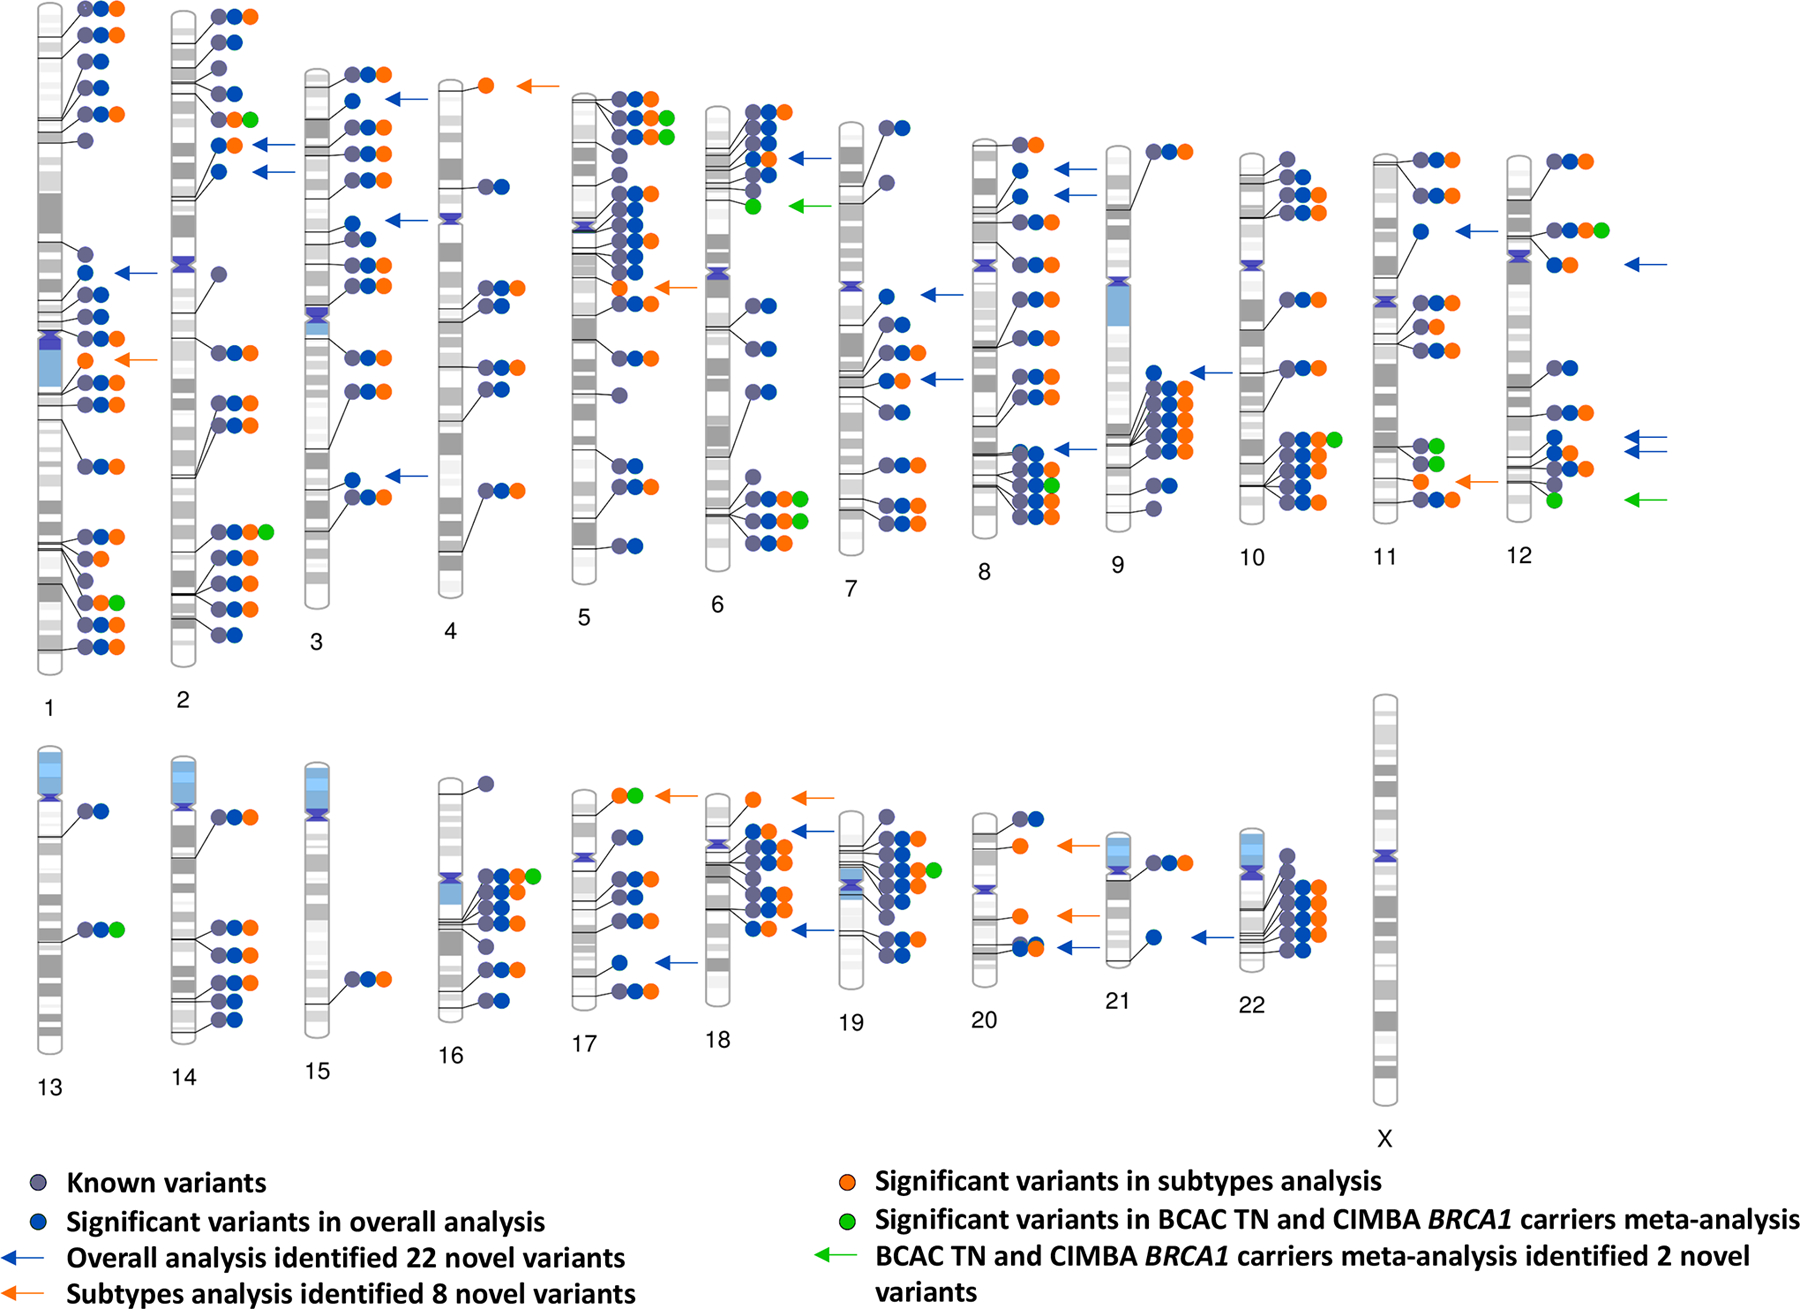
Ideogram of all the independent genome-wide significant breast cancer susceptibility variants in overall, subtypes, BCAC triple-negative (TN) and CIMBA BRCA1 carriers meta-analysis. The 32 novel variants are labeled with arrows. The other significant variants are within +−500 or LD > 0.3 with previously reported variants.
Fifteen of the 32 variants showed heterogeneity evidence (FDR < 0.05) according to the global heterogeneity test (Figure 2, Supplementary Table 12). ER (7 variants) and grade (7 variants) most often contributed to observed heterogeneity (marker-specific P < 0.05), followed by HER2 (4 variants) and PR (2 variants). rs17215231, identified in the CIMBA/BCAC-triple-negative meta-analysis, was the only variant found exclusively associated with triple-negative disease (OR=0.85, 95%CI=0.81–0.89). rs2464195, also identified in the CIMBA/BCAC-triple-negative meta-analysis, was associated with both triple-negative (OR=0.93, 95%CI=0.91–0.96) and luminal B-like subtypes (OR=0.96, 95%CI=0.92–0.99; Supplementary Table 11) and is in linkage disequilibrium (LD; r2=0.62) with rs7953249, which is differentially associated with risk of ovarian cancer subtypes10. Five variants showed associations with luminal and non-luminal subtypes in opposite directions (Figure 3). Four variants were associated in opposite directions with luminal A-like and triple-negative subtypes (respectively, for rs78378222 OR=1.13, 95%CI=1.05–1.20 vs OR=0.67, 95%CI=0.57–0.80; for rs206435 OR=1.03, 95%CI=1.01–1.05 vs OR=0.95, 95%CI=0.92–0.98; for rs141526427 OR=0.96, 95%CI=0.94–0.98 vs OR=1.04, 95%CI=1.01–1.08; and for rs6065254 OR=0.96, 95%CI=0.94–0.97 vs OR=1.04, 95%CI=1.01–1.07). The tumor-marker heterogeneity test showed associations for rs78378222 with ER (PER = 7.0 × 10⁻⁶) and HER2 (PHER2 = 2.07 × 10⁻⁴), rs206435 with ER (PER = 2.8 × 10⁻³) and grade (Pgrade = 2.8 × 10⁻⁴) and rs141526427 (PER = 1.3 × 10⁻³) and rs6065254 (PER = 4.3 × 10⁻³) with ER. rs7924772 showed opposite case-control associations between HER2-negative and HER2-positive subtypes and, consistent with these findings, was exclusively associated with HER2 (PHER2 = 1.4 × 10⁻⁶; Figure 3). rs78378222, located in the 3’ UTR of TP53, also showed opposite associations with high-grade serous cancers (OR=0.75, P = 3.7 × 10⁻⁴) and low-grade serous cancers (OR=1.58, P = 1.5 × 10⁻⁴; -). Prior analyses11 did not find rs78378222 associated with breast cancer risk, likely due to its opposite effects between subtypes.
Figure 2.
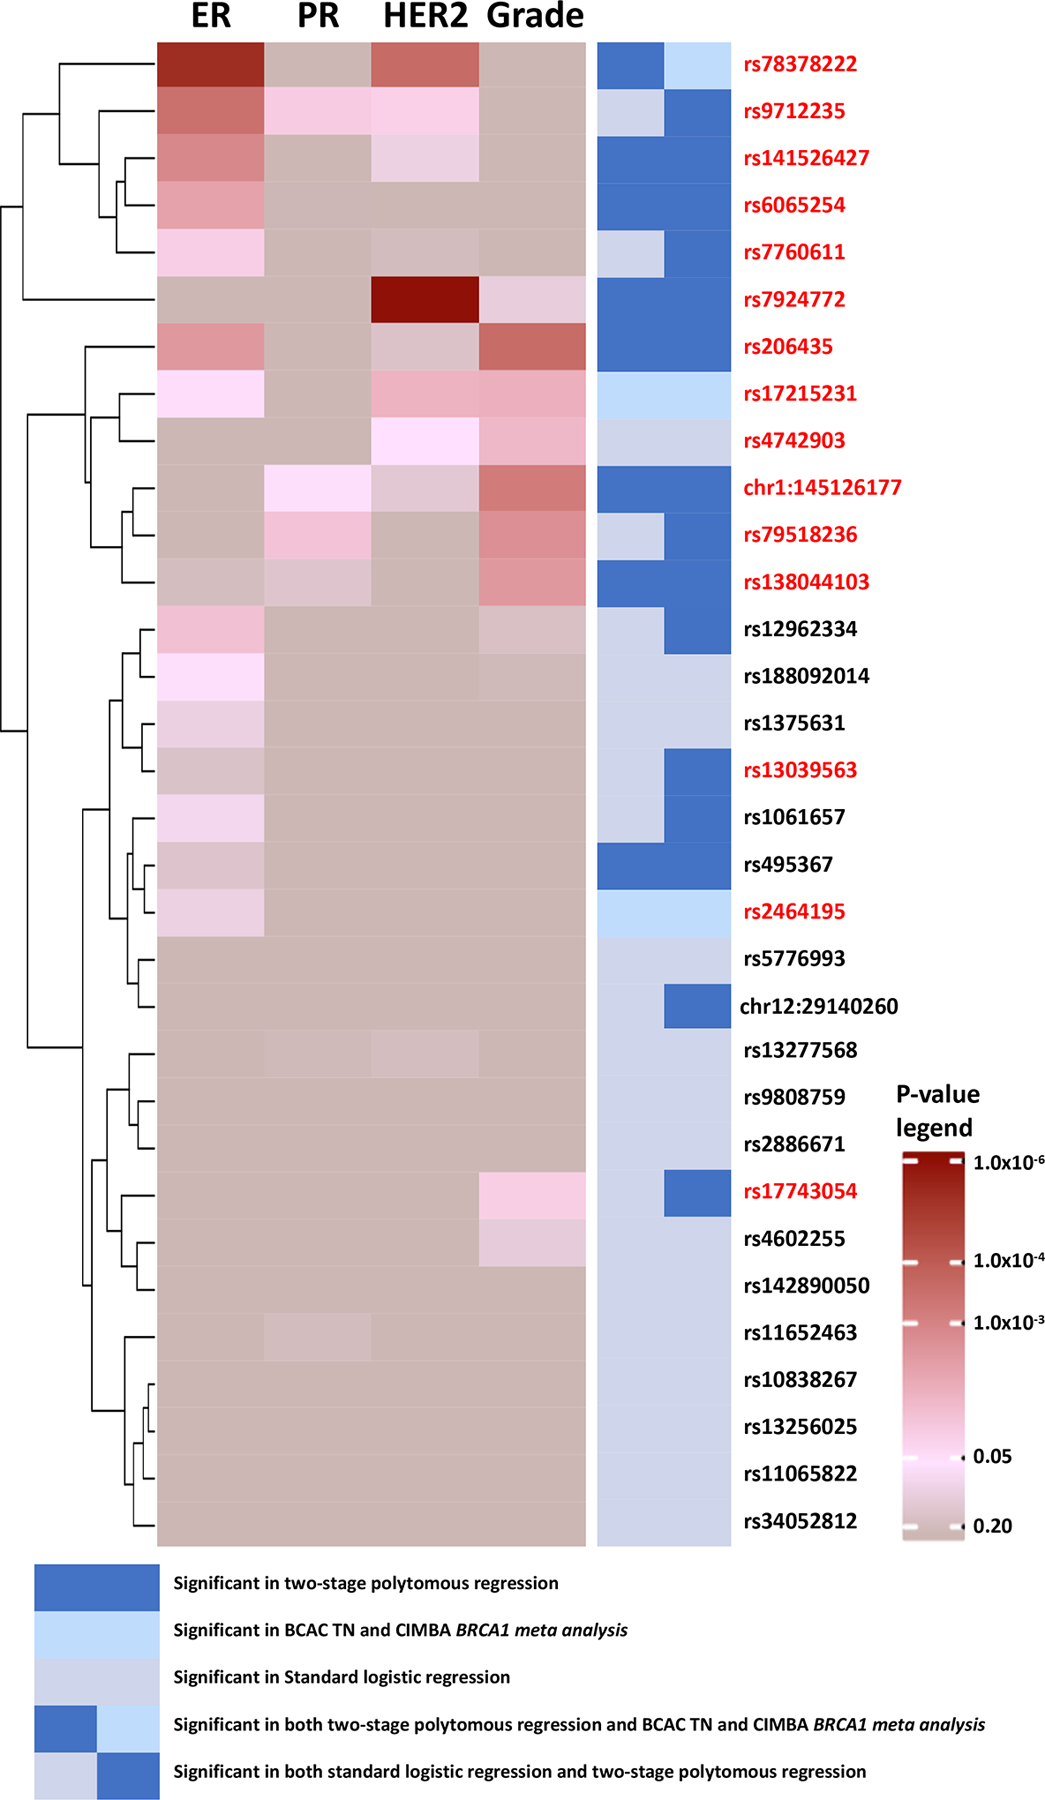
Heatmap and clustering of p-values from marker specific heterogeneity test for 32 breast cancer susceptibility loci (n = 106,278 invasive cases, n = 91,477 controls). P-values are for associations between the most significant variants marking each loci and estrogen receptor (ER), progesterone receptor (PR), human epidermal growth factor receptor 2 (HER2) or grade, adjusting for top ten principal components and age. P-values are raw p-values from two-tailed z-test statistics. Fifteen variants in red color were significant according to the global heterogeneity tests (FDR <0.05), of which 14 were identified by methods accounting for tumor heterogeneity. TN, triple negative.
Figure 3.
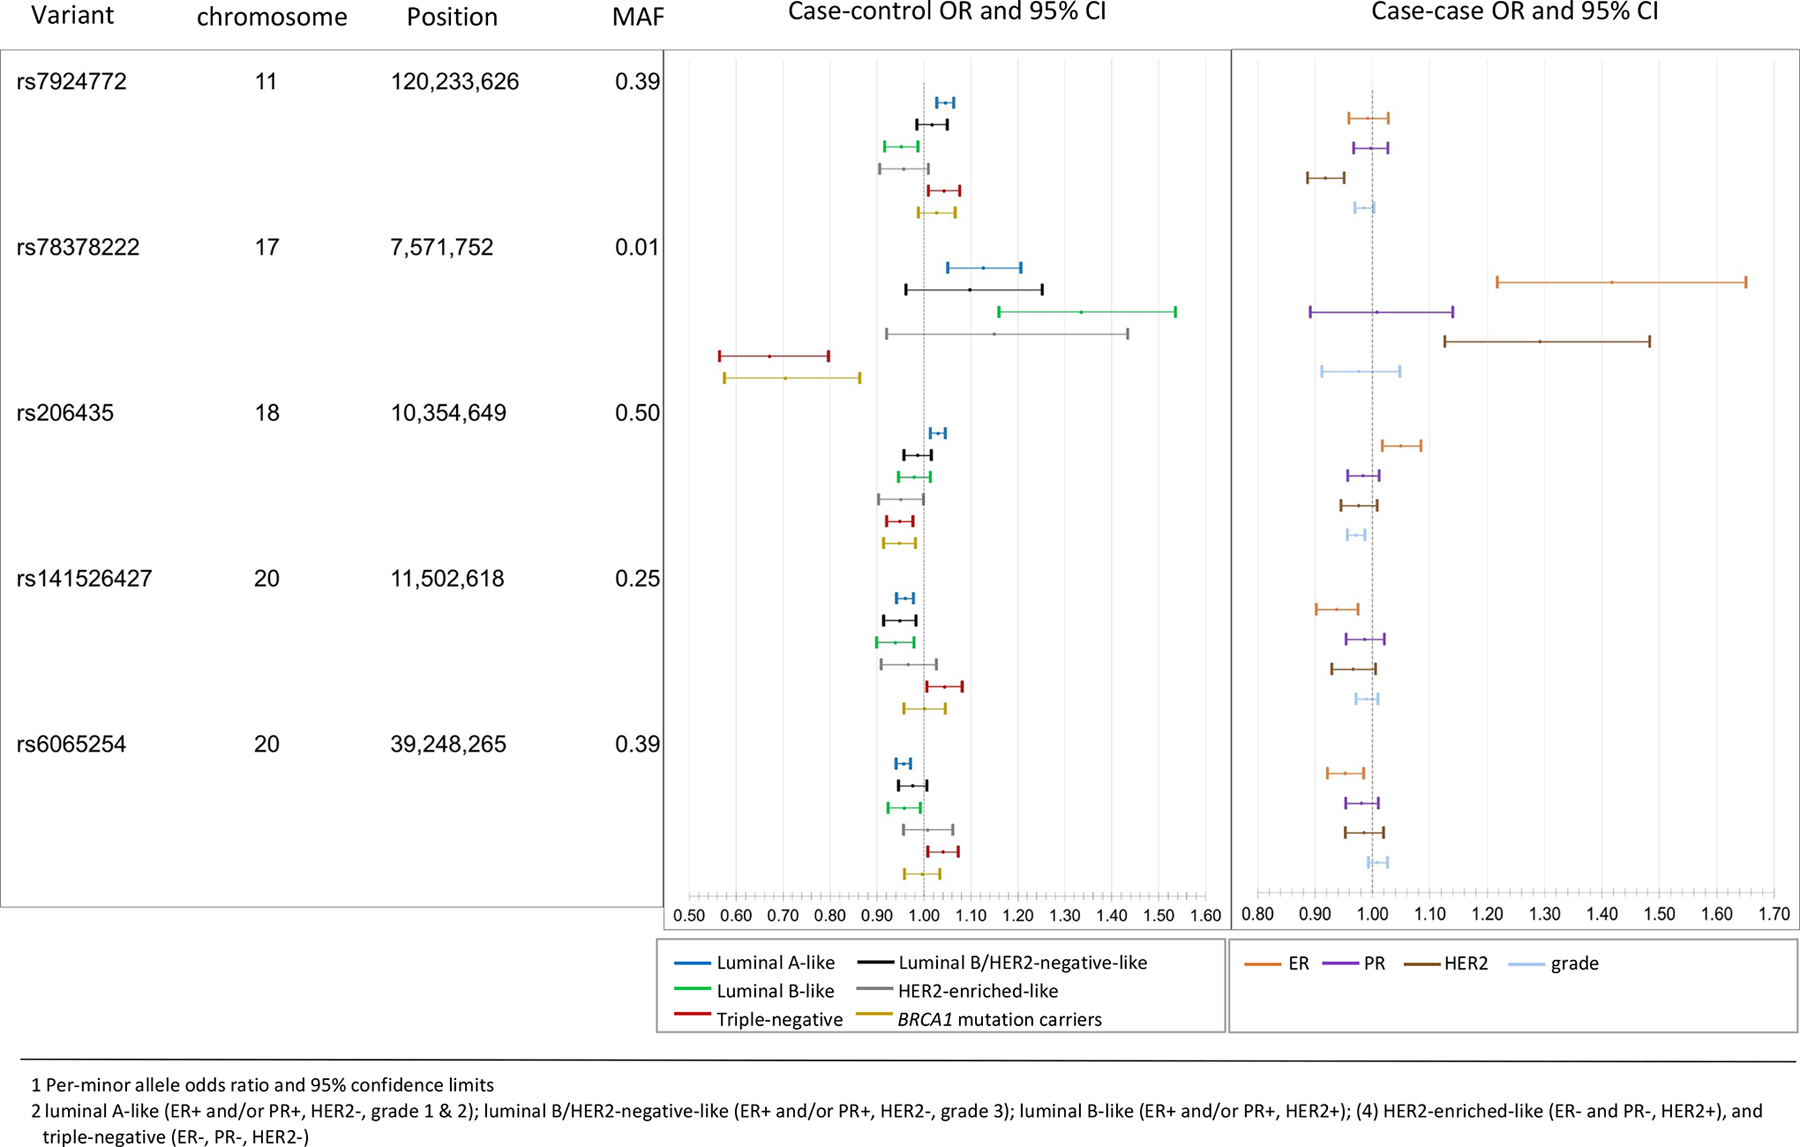
Susceptibility variants with associations in opposite direction across subtypes. The case-control odds ratios (OR) and 95% confidence intervals (95% CI)1 (left panel) are for associations of each of the five variants and risk for breast cancer intrinsic-like subtypes2 estimated from the first-stage of the two-stage polytomous regression fixed-effects model (n = 106,278 invasive cases, n = 91,477 controls). The case-case ORs 95%CI (right panel) are estimated from the second stage parameters of a fixed effect two-stage polytomous models testing for heterogeneity between the five variants and estrogen receptor (ER), progesterone receptor (PR), human epidermal growth factor receptor 2 (HER2) and grade, where ER, PR, HER2, and grade are mutually adjusted for each other. MAF, minor allele frequency.
Candidate causal variants were defined (CCVs; Online Methods) for each novel locus and we investigated the CCVs in relation to previously-annotated enhancers in primary breast cells12. Based on combinations of H3K4me1 and H3K27ac histone modification ChIP-seq signals, putative enhancers in basal cells (BC), luminal progenitor cells (LP) and mature luminal cells (LM) were characterized as “OFF,” “PRIMED”, and “ACTIVE” (Online Methods). We defined “ANYSWITCH” enhancers as those exhibiting different characterizations between cell types. Among the five loci identified with associations in opposite directions between subtypes, at least one CCV per locus overlapped an “ANYSWITCH” enhancer (Figure 4). For example, rs78378222 overlapped an ACTIVE enhancer in basal cells, PRIMED in luminal progenitor cells and OFF in mature luminal cells. In comparison, 63% of the loci with consistent direction of associations across subtypes overlapped with an “ANYSWITCH” enhancer (Supplementary Table 13–14). These results suggest that some variants may modulate enhancer activity in a cell-type specific manner, thus, differentially influencing risk of tumor subtypes.
Figure 4.
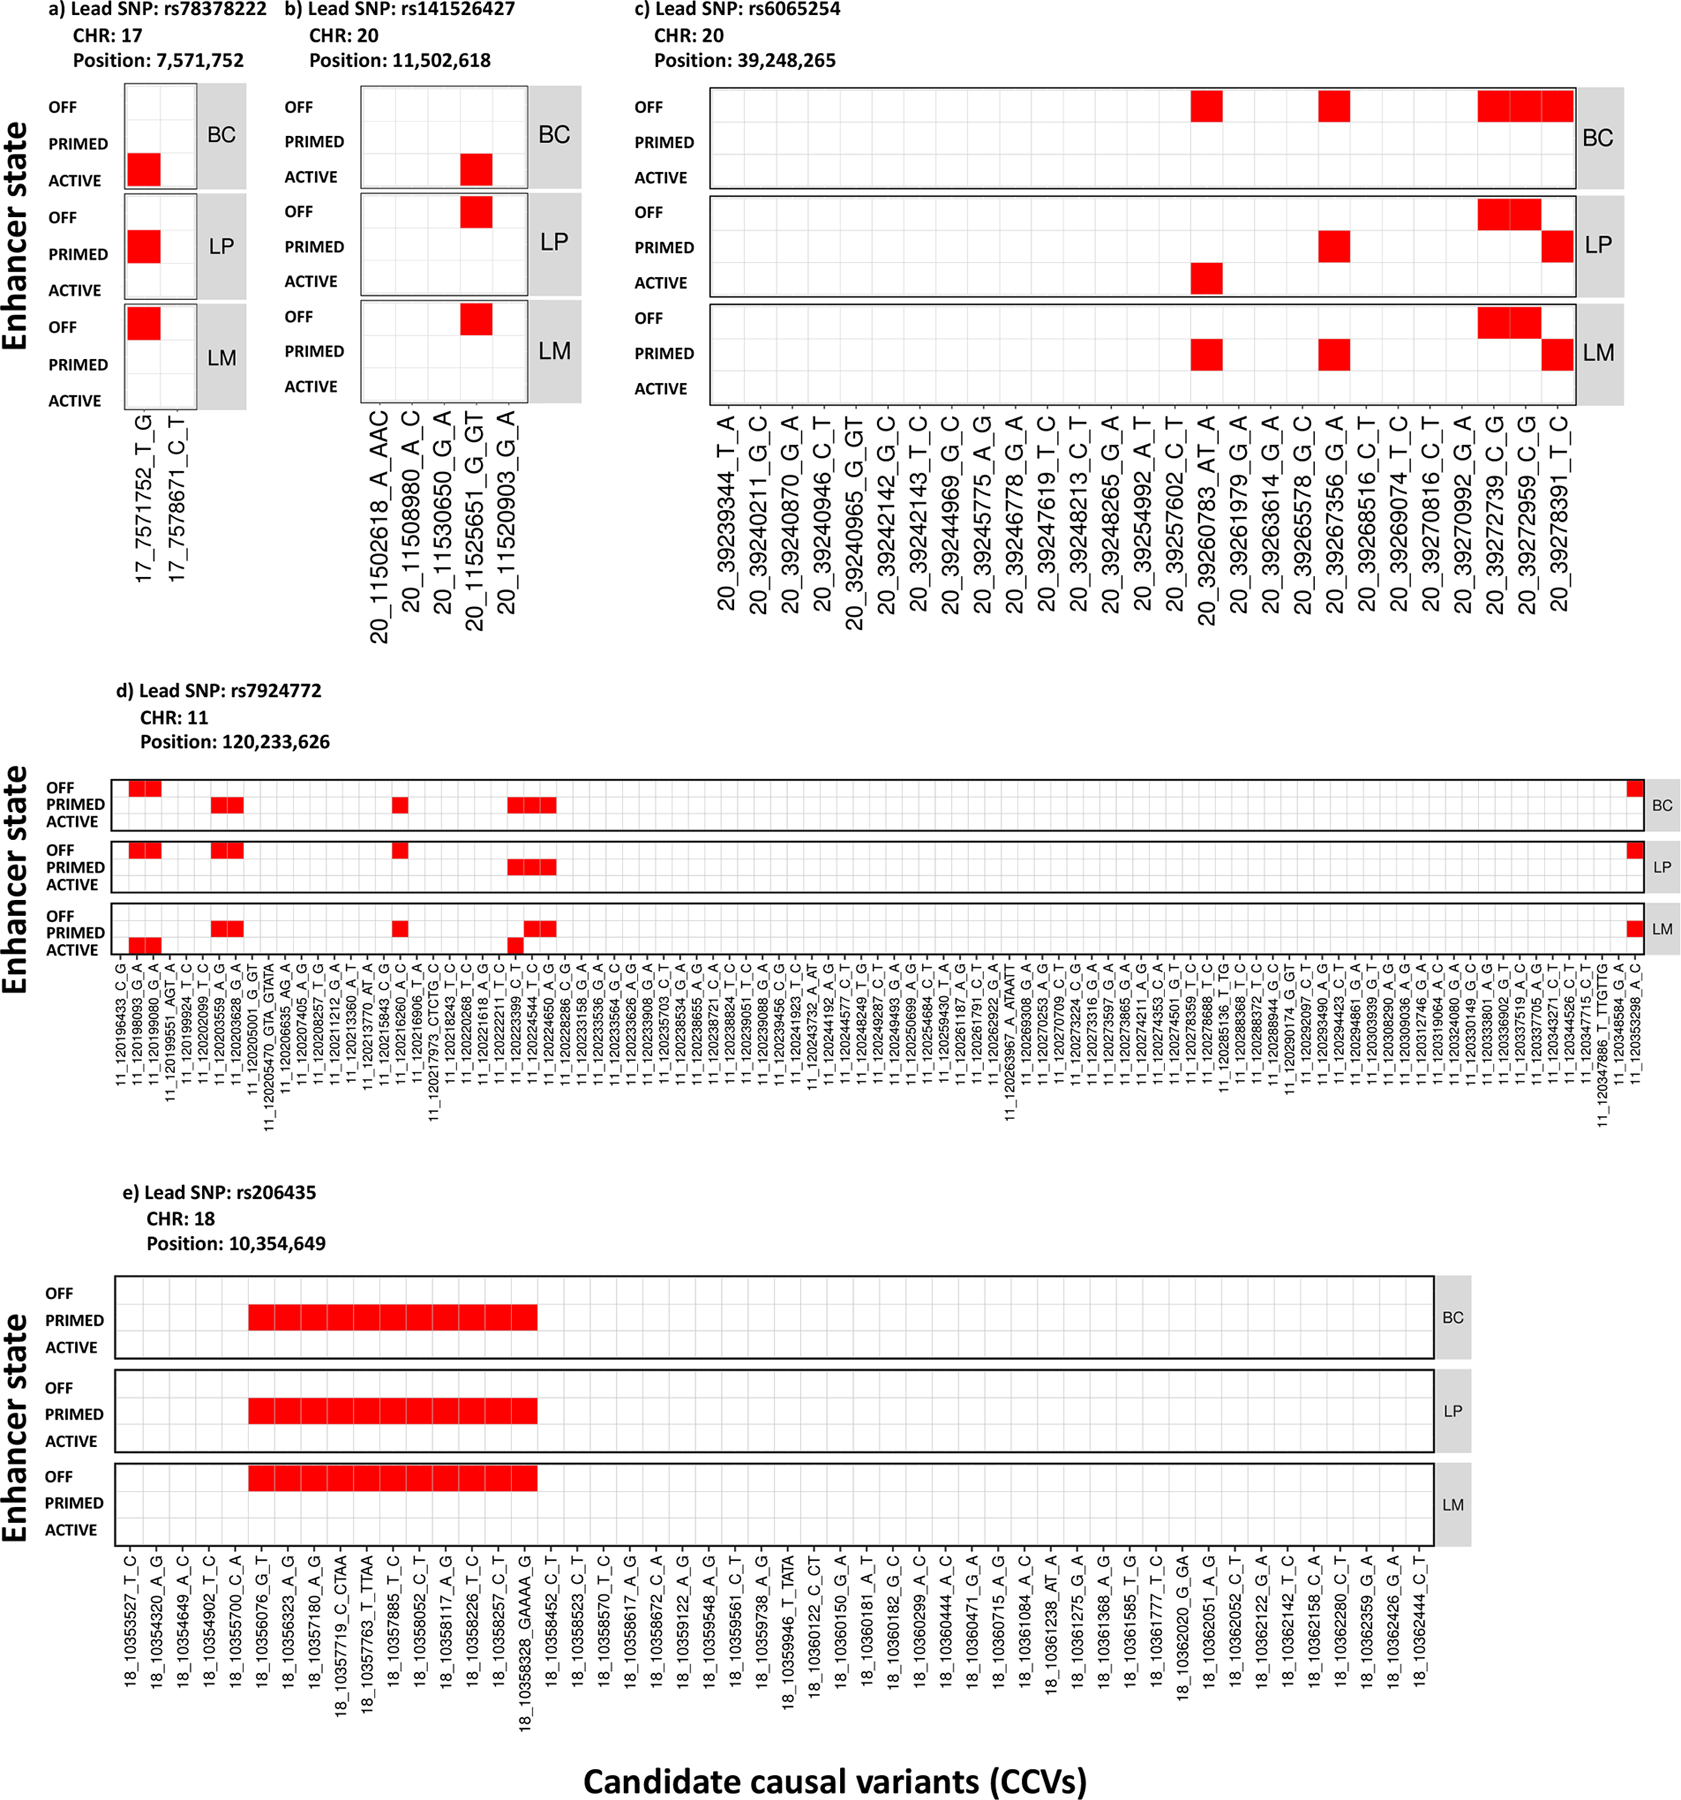
Heatmap of candidate causal variants (CCVs) overlapping with enhancer states in primary breast subpopulations for five variants with associations in opposite direction across subtypes. Three different breast subpopulations were considered: basal cells (BC), luminal progenitor (LP) and luminal cells mature (LM). Based on a combination of H3K4me1 and H3K27ac histone modification ChiP-seq signals, putative enhancers in BC, LP, and LM were characterized as “OFF”, “PRIMED” and “ACTIVE” (Online Methods). The CCVs overlapping with enhancers were colored as red, otherwise were white.
We used INQUIST to intersect CCVs with functional annotation data from public databases to identify potential target genes1 (Supplementary Note, Supplementary Table 15). We predicted 179 unique target genes for 26 of the 32 independent signals. Notably, rs78378222 has been reported associated with TP53 mRNA levels in blood and adipose tissue11, which we did not replicate in breast tissue. However, our findings of rs78378222 overlapping a cell type-specific regulatory element in breast basal epithelial cells, implicates enhancer function as another potential TP53 transcriptional control mechanism. Twenty-three target genes in 14 regions were predicted with high confidence (designated “Level 1”), of which 22 target genes in 13 regions were predicted to be distally regulated. Four target genes were previously predicted by INQUISIT13,14, POLR3C, RNF115, SOX4 and TBX3 – a known somatic breast cancer driver gene15 – and genes implicated by transcriptome-wide association studies (LINC0088616 and YBEY17).
We used LD-regression to investigate genetic correlations18,19 between subtypes and compare enrichment of genomic features20 between luminal A-like and triple-negative subtypes (Online Methods). All subtypes were moderately- to highly correlated, with luminal A-like and triple-negative having a correlation of 0.46 (SE=0.05). The correlation in breast cancer of BRCA1 carriers and triple-negative was 0.83 (SE=0.08), suggesting a high-degree of similarity in the genetic basis between these subtypes (Figure 5; Supplementary Table 16). To compare genomic enrichment, we first evaluated 53 annotations and found triple-negative tumors were most enriched for “super-enhancers, extend500bp” (3.04-fold, P = 3.3 × 10⁻⁶), and “digital genomic footprint, extend500bp” (from DNase hypersensitive sites) (2.2-fold, P = 4.0 × 10⁻⁴); however, no annotations significantly differed between luminal A-like and triple-negative tumors (Supplementary Table 17, Supplementary Figure 9). Investigating cell-specific enrichment of histone markers H3K4me1, H3K3me3, H3K9ac and H3K27ac (Supplementary Note) found both luminal-A and triple-negative subtypes enriched for gastrointestinal cell types and suppression of central nervous system cell types (Supplementary Figure 10).
Figure 5.
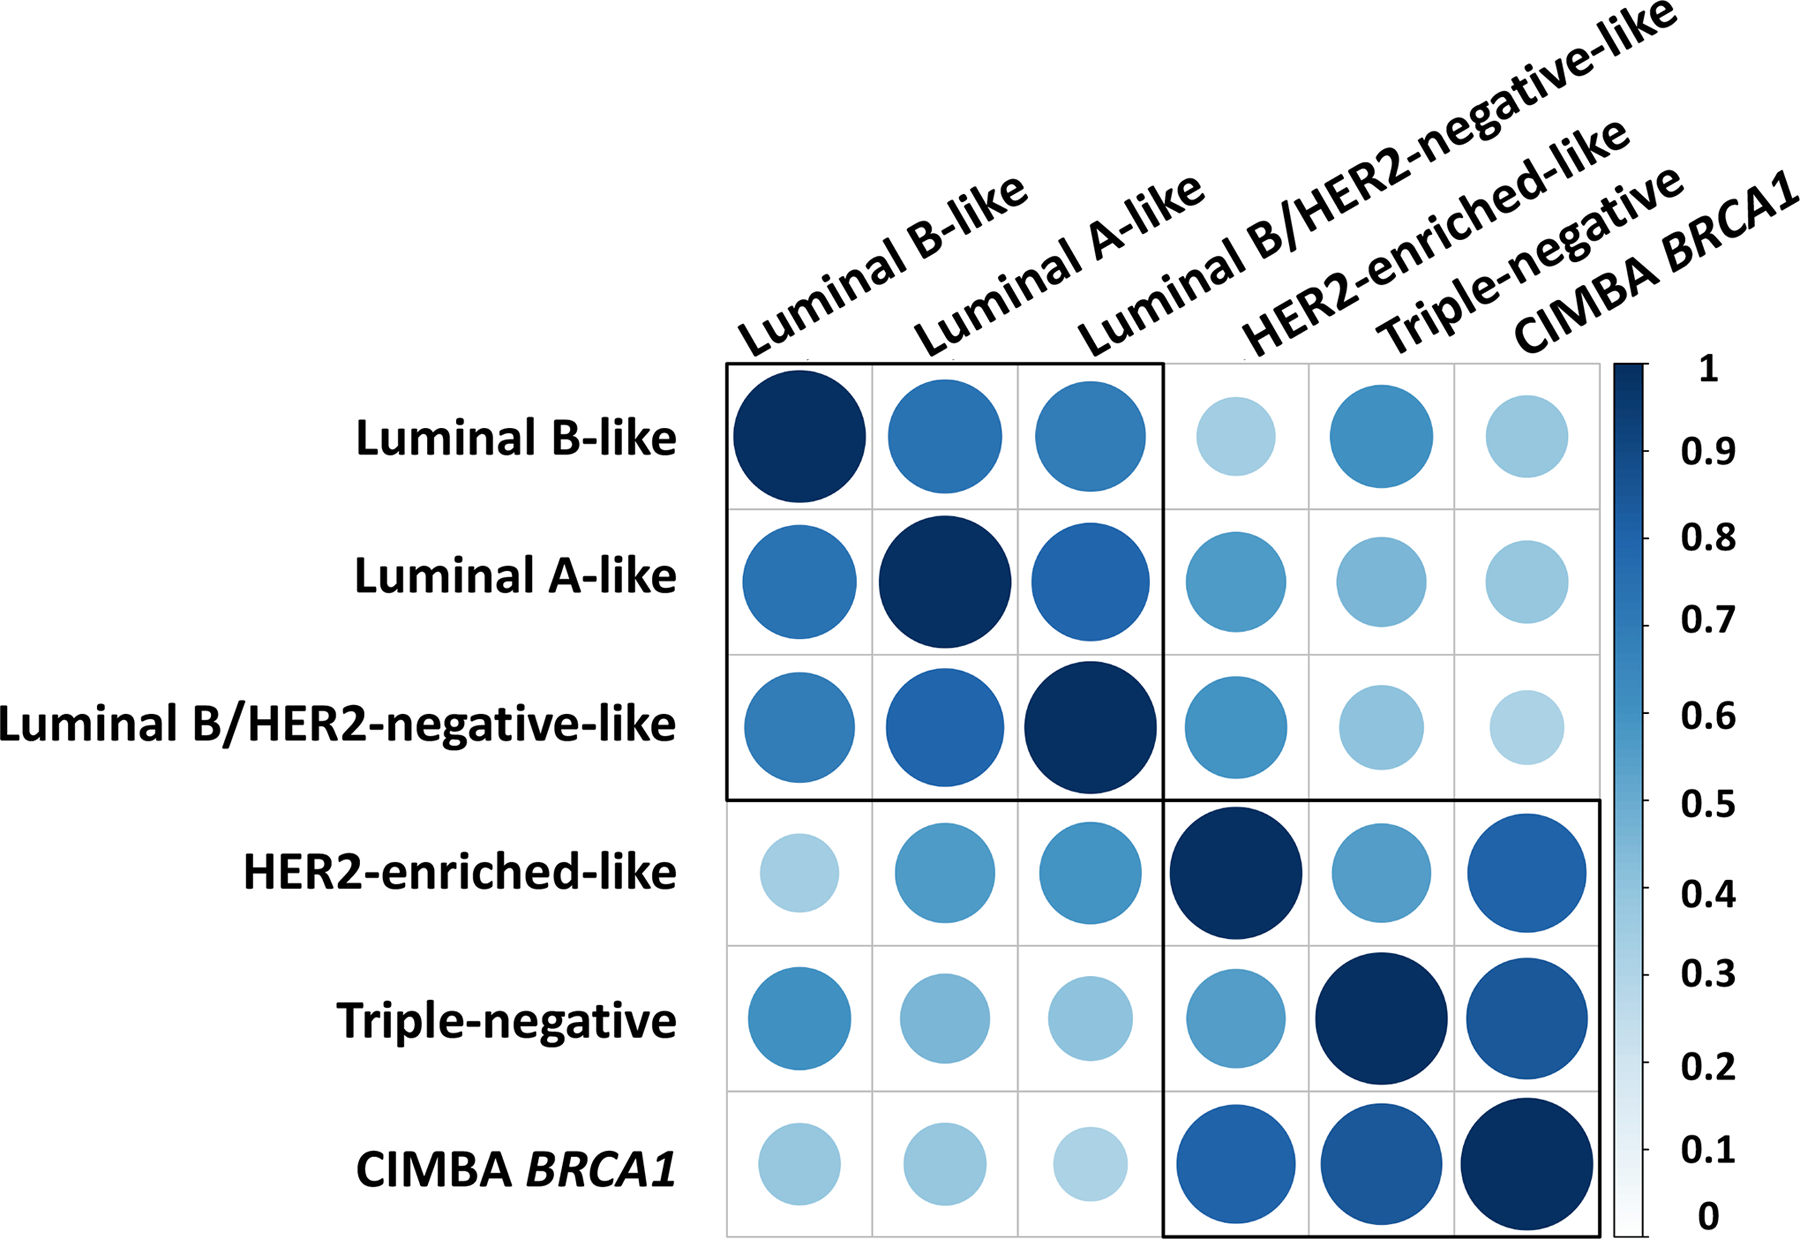
Genetic correlation between the five intrinsic-like breast cancer subtypes and BRCA1 mutation carriers estimated through LD score regression. See Supplementary Table 16 for further details. Both the color and size of the circles reflect the strength of the genetic correlations.
The proportion of genome-wide chip heritability explained by the 32 novel variants, plus 178 previously identified variants1,2,21, was 54.2%, 37.6% and 26.9% for luminal A-like, triple-negative and BRCA1 carriers, respectively (Table 1, Supplementary Table 18). These 210 variants explained approximately 18.3% of the two-fold familial relative risk for invasive breast cancer, while all reliably imputable variants on the OncoArray explained 37.1% (Online Methods). The per-standard deviation ORs between PRSs for luminal-A like and triple-negative subtypes (Online Methods), that included 313 published variants22 and 17 novel variants that were independent of the 313 variants (Supplementary Table 19), was 1.83 (95% CI=1.78–1.88) and 1.65 (1.57–1.73), with corresponding area under receiver-operator curves of 66.09 and 63.58, respectively (Extended Data Figure 2–6).
Table 1.
Genetic variance of invasive breast cancer explained by identified susceptibility variants and all reliably genome-wide imputable variants1
| Phenotype | Genetic variance for 210 identified susceptibility variants2 | Genetic variance for 32 newly identified variants2 | Genetic variance for all GWAS variants3 | Proportion of genetic variance explained by identified susceptibility loci4 |
|---|---|---|---|---|
| Invasive breast cancer5 | 0.253 | 0.016 | 0.515 | 45.51% |
| Luminal A-like | 0.336 | 0.022 | 0.620 | 54.22% |
| Luminal B/HER2-negative-like | 0.233 | 0.018 | 0.597 | 38.95% |
| Luminal B-like | 0.270 | 0.020 | 0.740 | 36.46% |
| HER2-enriched-like | 0.200 | 0.011 | 0.689 | 29.05% |
| Triple negative | 0.185 | 0.025 | 0.492 | 37.63% |
| CIMBA BRCA1 carriers | 0.083 | 0.016 | 0.309 | 26.86% |
Genetic variance corresponds to heritability on the frailty-scale, which assumes the polygenetic log-additive model as the underlying model.
Susceptibility variants included 178 variants previously identified or replicated1,2 and 32 newly identified variants in this paper.
Genetic variance of all reliably genome-wide imputable variants was estimated through LD-score regression described in Nat Genet 47, 291–5 (2015). and Nat Genet 47, 1236–41 (2015). Under the frailty-scale, the genetic variance for all GWAS variants is characterized by population variance of the underlying true polygenic risk score as , where Gm is the standardized genotype for the mth variant, βm is the true log odds ratio for the mth variant and M are the total number of causal variants among the GWAS variants. (Online Methods).
Proportion of genetic variance explained by 210 identified GWAS significant variants over the genetic variance explained by all GWAS variants.
Invasive breast cancer summary level statistics were generated from 106,278 invasive cases and 91,477 controls, which were the same samples used in subtypes analyses (Supplementary Table 2).
These analyses demonstrate the benefit of combining standard GWAS methods with methods accounting for underlying tumor heterogeneity. Moreover, these methods and results may help clarify mechanisms predisposing to specific molecular subtypes, and provide precise risk estimates for subtypes to inform development of subtype-specific PRSs22. However, to expand the generalizability of our findings, these analyses should be replicated and expanded in multi-ancestry populations.
Online Methods
Study populations
The overall breast cancer analyses included women of European ancestry from 82 BCAC studies from over 20 countries, with genotyping data derived from two Illumina genome-wide custom arrays, the iCOGS and OncoArray (Supplementary Table 1). Most of the studies were case-control studies in the general population, or hospital setting, or nested within population-based cohorts, but a subset of studies oversampled cases with a family history of the disease. We included controls and cases of invasive breast cancer, carcinoma in-situ, and cases of unknown invasiveness. Information on clinicopathologic characteristics were collected by the individual studies and combined in a central database after quality control checks. We used BCAC database version ‘freeze’ 10 for these analyses. Among a subset of participants (n=16,766) that were genotyped on both the iCOGS and OncoArray arrays, we kept only the OncoArray data. One study (LMBC) contributing to the iCOGS dataset was excluded due to inflation of the test statistics that was not corrected by adjustment for the first ten PCs. We also excluded OncoArray data from Norway (the Norwegian Breast Cancer Study) because there were no controls available from Norway with OncoArray data. All participating studies were approved by their appropriate ethics or institutional review board and all participants provided informed consent. The total sample size for this analysis, including iCOGS, OncoArray and other GWAS data, comprised 133,384 cases and 113,789 controls.
In the GWAS analyses accounting for underlying heterogeneity according to ER, PR, HER2 and grade, we included genotyping data from 81 BCAC studies. These analyses were restricted to controls and cases of invasive breast cancer. We excluded cases of carcinoma in-situ and cases with missing information on invasiveness, as ~96% of in-situ cases were missing some or all of the tumor markers and in-situ cases potentially have different tumor correlations compared to invasive cases, which could potentially bias the estimates from Expectation-Maximization algorithm (Supplementary Table 2). We also excluded all studies from a specific country if there were no controls for that country, or if the tumor marker data were missing on two or more of the tumor marker subtypes (see footnote of Supplementary Table 2 for further explanation of excluded studies). We did not include the summary results from the 14,910 cases and 17,588 controls from the 11 other GWAS in subtype analyses because these studies did not provide data on tumor characteristics. We also excluded invasive cases (n=293) and controls (n=4,285) with missing data on age at diagnosis or age at enrollment, information required by the Expectation-Maximization algorithm to impute missing tumor characteristics. In total, the final sample for the two-stage polytomous logistic regression comprised 106,278 invasive cases and 91,477 controls.
Participants included from CIMBA were women of European ancestry, aged 18 years or older with a pathogenic BRCA1 variant. Most participants were sampled through cancer genetics clinics. In some instances, multiple members of the same family were enrolled. OncoArray genotype data was available from 58 studies from 24 countries. Following quality control and removal of participants that overlapped with the BCAC OncoArray study, data were available on 15,566 BRCA1 mutation carriers, of whom 7,784 were affected with breast cancer (Supplementary Table 3). We also obtained iCOGS genotype data on 3,342 BRCA1 mutation carriers (1,630 with breast cancer) from 54 studies through CIMBA. All BRCA1 mutation carriers provided written informed consent and participated under ethically approved protocols.
Genotyping, quality control, and imputation
Details on genotype calling, quality control and imputation for the OncoArray, iCOGS, and GWAS are described elsewhere1,2,5,6. Genotyped or imputed variants (including bi-allelic and multi-allelic single nucleotide polymorphisms (SNPs) and small indels) marking each of the loci were determined using the iCOGS and the OncoArray genotyping arrays and imputation to the 1000 Genomes Project (Phase 3) reference panel. We included variants, from each component GWAS with an imputation quality score of >0.3. We restricted analysis to variants with a minor allele frequency >0.005 in the overall breast cancer analysis and >0.01 in the subtype analysis.
Known breast cancer susceptibility variants
Prior studies identified susceptibility variants from genome-wide analyses at a significance level P < 5.0 × 10⁻⁸ for all breast cancer types, ER-negative or ER-positive breast cancer, in BRCA1 or BRCA2 mutation carriers, or in meta-analyses of these1–3. We defined known breast cancer susceptibility variants as those variants that were identified or replicated in prior BCAC analyses1,2. To help ensure that novel, independent susceptibility variants were identified, we excluded from these analyses variants within 500 kb of a previously published variant. These excluded regions have been subject to a separate, fine-mapping conditional analyses that are focused on identifying additional independent susceptibility variants in these regions14.
Standard analysis of BCAC data
Logistic regression analyses were conducted separately for the iCOGS and OncoArray datasets, adjusting for country and the array-specific first 10 PCs for ancestry informative variants. The methods for estimating PCs have been described elsewhere1,2. For the remaining GWAS, adjustment for inflation was done by adjusting for up to three PCs and using genomic control adjustment, as previously described1. We evaluated the associations between approximately 10.8 million variants with imputation quality scores (r2) ⩾0.3 and minor allele frequency (MAF) >0.005. We excluded variants located within ±500 kb of, or in LD (r2⩾0.1) with known susceptibility variants21. The association effect size estimates from these, and the previously derived estimates from the 11 other GWAS, were then combined using a fixed effects meta-analysis. Since individual level genotyping data were not available for some previous GWAS, we conservatively approximated the potential overlap between the GWAS and iCOGS and OncoArray datasets, based on the populations contributing to each GWAS (iCOGS/GWAS: 626 controls and 923 cases; OncoArray/GWAS: 20 controls and 990 cases). We then used these adjusted data to estimate the correlation in the effect size estimates, and incorporated these into the meta-analysis using the method of Lin and Sullivan23.
Subtypes analysis of BCAC data
We described the two-stage polytomous logistic regression in more detail elsewhere4,24 (Supplementary Note). In brief, this method allows for efficient testing of a variant-disease association in the presence of tumor subtype heterogeneity defined by multiple tumor characteristics, while accounting for multiple testing and missing data on tumor characteristics. In the first stage, the model uses a polytomous logistic regression to model case-control ORs between the variants and all possible subtypes that could be of interest, defined by the combination of the tumor markers. For example, in a model fit to evaluate heterogeneity according to ER, PR and HER2 positive/negative status, and grade of differentiation (low, intermediate and high grade), the first stage incorporates case-control ORs for 24 subtypes defined by the cross-classification of these factors. The second stage restructures the first-stage subtype-specific case-control ORs parameters into second-stage parameters through a decomposition procedure resulting in a second-stage baseline parameter that represents a case-control OR of a baseline cancer subtype, and case-case ORs parameters for each individual tumor characteristic. The second-stage case-case parameters can be used to perform heterogeneity tests with respect to each specific tumor marker while adjusting for the other tumor markers in the model. The two-stage model efficiently handles missing data by implementing an Expectation-Maximization algorithm4,7 that essentially performs iterative “imputation” of the missing tumor characteristics conditional on available tumor characteristics and baseline covariates based on an underlying two-stage polytomous model. In the two-stage model, the frequency of different tumor subtypes corresponding to different combinations of the tumor characteristics are allowed to vary freely through the model-free specification of the intercepts of the first-stage polytomous model (αm, see Supplementary Note for details), in other words, the intercepts are kept saturated. As these parameters are estimated from the data itself, the methodology accounts for the correlation among the tumor markers in a robust manner that does not require strong modelling assumptions.
To identify novel susceptibility loci, we used both a fixed-effect two-stage polytomous model and a mixed-effect two-stage polytomous model. The score-test we developed based on the mixed-effect model allows coefficients associated with individual tumor characteristics to enter as either fixed- or random-effect terms. Our previous analyses have shown that incorporation of random effect terms can improve power of the score-test by essentially reducing the effective degrees-of-freedom associated with fixed effects related to exploratory markers (i.e., markers for which there is little prior evidence to suggest that they are a source of heterogeneity)4. On the other hand, incorporation of fixed-effect terms can preserve distinct associations of known important tumor characteristics, such as ER. In the mixed-effect two-stage polytomous model, we therefore kept ER as a fixed effect, but modeled PR, HER2 and grade as random effects. We evaluated variants with MAF >0.01 (~10.0 million) and r2⩾0.3, and excluded variants within ±500 kb of, or in LD (r2⩾0.1) with known susceptibility variants. A MAF >0.01 was chosen to ensure an adequate sample size to generate stable estimates. We reported variants that passed the p-value threshold of P < 5.0 × 10⁻⁸ in either the fixed- or mixed-effect models.
Both fixed/mixed-effect models adjusted for top ten PCs and age. As age is correlated with the tumor characteristics25, we added age as a covariate to improve the statistical power of Expectation-Maximization (EM) algorithm. Country was not adjusted for in the subtype analyses, since doing so required adequate sample size of each subtype in each country to allow for convergence of the two-stage polytomous model. Instead, we assessed the influence of country on signals identified by the two-stage models by performing a ‘leave one out’ sensitivity analyses in which we reevaluated novel signals after excluding data from each individual country. Data from the OncoArray and iCOGS arrays were analyzed separately and then meta-analyzed using fixed-effects meta-analysis.
Statistical analysis of CIMBA data
We tested for associations between variants and breast cancer risk for BRCA1 mutation carriers using a score test statistic based on the retrospective likelihood of observing the variant genotypes conditional on breast cancer phenotypes (breast cancer status and censoring time)26. Analyses were performed separately for iCOGS and OncoArray data. To allow for non-independence among related individuals, a kinship-adjusted test was used that accounted for familial correlations27. We stratified analyses by country of residence and, for countries where the strata were sufficiently large (United States and Canada), by Ashkenazi Jewish ancestry. The results from the iCOGS and OncoArray data were then pooled using fixed-effects meta-analysis.
Meta-analysis of BCAC and CIMBA
As the great majority of BRCA1 related breast cancers are triple-negative28, we performed a meta-analysis with the BCAC triple-negative results to increase the power to detect associations for the triple-negative subtype. We performed a fixed-effects meta-analysis of the results from BCAC triple-negative cases and CIMBA BRCA1 mutation carriers, using an inverse-variance fixed-effects approach implemented in METAL29. The estimates of association used were the logarithm of the per-allele hazard ratio estimate for association with breast cancer risk for BRCA1 mutation carriers from CIMBA and the logarithm of the per-allele odds ratio estimate for association with risk of triple-negative breast cancer based on BCAC data.
Conditional analyses
We performed two sets of conditional analyses. First, we investigated for evidence of multiple independent signals in identified loci by performing forward selection logistic regression, in which we adjusted the lead variant and analyzed association for all remaining variants within ±500 kb of the lead variants, irrespective of LD. Second, we confirmed the independence of 20 variants that were located within ±2 MB of a known susceptibility region by conditioning the identified signals on the nearby known signal. Since these 20 variants are already genome-wide significant in the original GWAS scan and the conditional analyses restricted to local regions, we therefore used a significance threshold of P < 1 × 10⁻⁶ to control for type-one error30.
Heterogeneity analysis of new association signals
We evaluated all novel signals for evidence of heterogeneity using the two-stage polytomous model. We first performed a global test for heterogeneity under the mixed-effect model test to identify variants showing evidence of heterogeneity with respect to any of the underlying tumor markers, ER, PR, HER2 and/or grade. We accounted for multiple testing of the global heterogeneity test using a FDR <0.05 under the Benjamini-Hochberg procedure31. Among the variants with observed heterogeneity, we then further used a fixed-effect two-stage model to evaluate influence of specific tumor characteristic(s) driving observed heterogeneity, adjusted for the other markers in the model. We also fit a separate fixed-effect two-stage models to estimate case-control ORs and 95% confidence intervals (CI) for five surrogate intrinsic-like subtypes defined by combinations of ER, PR, HER2 and grade8: (1) luminal A-like (ER+ and/or PR+, HER2-, grade 1 & 2); (2) luminal B/HER2-negative-like (ER+ and/or PR+, HER2-, grade 3); (3) luminal B-like (ER+ and/or PR+, HER2+); (4) HER2-enriched-like (ER- and PR-, HER2+), and (5) triple-negative (ER-, PR-, HER2-). Further, we conducted sensitivity analysis by fitting a standard polytomous model among cases with complete data on the five-intrinsic-like subtypes for the 32 novel variants and compared these results with the results from two-stage polytomous model accounting for missing tumor data.
Candidate causal variants
We defined credible sets of candidate causal variants (CCVs) as variants located within ±500 kb of the lead variants in each novel region and with P values within 100-fold of magnitude of the lead variants. This is approximately equivalent to selecting variants whose posterior probability of causality is within two orders of magnitude of the most significant variant32,33. This approach was applied for detecting a set of potentially causal variants for all 32 identified variants. For the novel variants located within ±2 Mb of the known signals, we used the conditional P values to adjust for the known signals’ associations.
Enhancer states analysis in breast sub-populations
We obtained enhancer maps for three enriched primary breast sub-populations (basal, luminal progenitor, and mature luminal) from Pellacani et al.12. Enhancer annotations were defined as ACTIVE, PRIMED, or OFF based on a combination of H3K27ac and H3K4me1 histone modification ChIP-seq signals using FPKM thresholds as previously described12. Briefly, genomic regions containing high H3K4me1 signal observed in any cell type were used to define the superset of breast regulatory elements. Sub-population cell type-specific H3K27ac signal (which is characteristic of active elements) within these elements was used as a measure of overall regulatory activity, where “ACTIVE” sites were characterized by H3K4me1-high, H3K27ac-high; “PRIMED” by H3K4me1-high, H3K27ac-low; and “OFF” by H3K4me1-low, H3K27ac-low. This enabled annotation of each enhancer element as either “OFF”, “PRIMED” or “ACTIVE” in all cell types. We then defined enhancers which exhibit differing states between at least one cell type as “ANYSWITCH” enhancers.
Genetic correlation analyses
We used LD score regression18–20 to estimate the genetic correlation between five intrinsic-like breast cancer subtypes. The analysis used the summary statistics based on the meta-analysis of the OncoArray, and iCOGS, and CIMBA meta-analysis. The genetic correlation18 analysis was restricted to the ~1 million variants included in HapMap 3 with MAF > 1% and imputation quality score R2>0.3 in the OncoArray data. Since two-stage polytomous models integrated an imputation algorithm for missing tumor characteristic data, we modified the LD score regression to generate the effective sample size for each variant (Supplementary Note).
Genetic variance explained by identified susceptibility variants and all genome-wide imputable variants
Genetic variance corresponds to heritability on the frailty-scale, which assumes a polygenetic log-additive model as the underlying model. Under the log-additive model, the frailty-scale heritability explained by the identified variants can be estimated by:
where n is the total number of identified variants, pi is the MAF for ith variant, is the log odds ratio estimate for the ith variant, and τi is the is the standard error of To obtain the frailty scale heritability for invasive breast cancer explained by all of the GWAS variants, we used LD score regression to estimate heritability using the full set of summary statistics from either standard logistic regression for overall invasive breast cancer, the two-stage polytomous regression for the intrinsic-like subtypes, or the CIMBA BRCA1 analysis for BRCA1 carriers. is characterized by population variance of the underlying true polygenetic risk scores as , where Gm is the standardized genotype for mth variant, βm is the true log odds ratio mth variant, and M are the total number of causal variants among the GWAS variants. Thus, the proportion of heritability explained by identified variants relative to all imputable variants is:
To estimate the proportion of the familial risk of invasive breast cancer that is explained by susceptibility variants, we defined the familial relative risk, λ, as the familial relative risk assuming a polygenic log-additive model that explains all the familial aggregation of the disease34. Under the frailty scale, we define the broad sense heritability35 as σ2. The relationship between λ and σ2 was shown to be σ2 = 2 * log(λ)34. We assumed λ = 2 as the overall familial relative risk of invasive breast cancer34 thus σ2 = 2log (2) and the proportion of the familial relative risk explained by identified susceptibility variants is , and the proportion of the familial relative risk explained by GWAS variants is . Analysis of heritability and the proportion of explained familial risk were restricted to 106,278 invasive cases and 91,477 controls (Supplementary Table 2). In addition, we compared estimates of GWAS chip hereditability across five-intrinsic subtypes using LD-score regression where the summary statistics were derived using either standard polytomous model applied to complete cases or the novel two-stage method that incorporates cases with missing tumor characteristics.
PRSs for five intrinsic-like subtypes
We constructed PRSs for the intrinsic-like subtypes, incorporating the newly identified variants and 313 variants previously reported in the development of PRSs for overall and ER-specific breast cancer22. The 313 SNPs include SNPs that didn’t reach genome-wide significance. After excluding variants within 500 kb of the 313 SNPs or LD>=0.1, 17 out of the 32 novel variants were independent with the 313 SNPs. The BCAC data were split into the training dataset and test dataset with a proportion of 80% and 20%, respectively. Half of the test dataset were five studies nested within prospective cohorts including KARMA, MMHS, PLCO, SISTER, UKBGS (Supplementary Table 2) and the other half was randomly selected among the subjects in OncoArray, excluding studies of bilateral breast cancer, studies or sub studies with oversampling for family history, cases with ambiguous diagnosis, and cases with missing tumor characteristics. We obtained the overall and ER-specific log odds ratios for 313 SNPs by respectively fitting standard and ER-specific logistic regression on the training dataset. We obtained the log odds ratio for 330 SNPs by fitting the fixed-effect two-stage polytomous model for five intrinsic-like subtypes on the training dataset (Supplementary Table 19).
Reporting Summary
Further information on research design is available in the Nature Research Reporting Summary linked to this article.
Data Availability Statement
Summary level statistics are available from http://bcac.ccge.medschl.cam.ac.uk/bcacdata/ and http://cimba.ccge.medschl.cam.ac.uk/projects/. Requests for data can be made to the corresponding author or the Data Access Coordination Committees (DACCs) of BCAC (see above URL) and CIMBA (see above URL). BCAC DACC approval is required to access data from the ABCFS, ABCS, ABCTB, BBCC, BBCS, BCEES, BCFR-NY, BCFR-PA, BCFR-UT, BCINIS, BSUCH, CBCS, CECILE, CGPS, CTS, DIETCOMPLYF, ESTHER, GC-HBOC, GENICA, GEPARSIXTO, GESBC, HABCS, HCSC, HEBCS, HMBCS, HUBCS, KARBAC, KBCP, LMBC, MABCS, MARIE, MBCSG, MCBCS, MISS, MMHS, MTLGEBCS, NC-BCFR, OFBCR, ORIGO, pKARMA, POSH, PREFACE, RBCS, SKKDKFZS, SUCCESSB, SUCCESSC, SZBCS, TNBCC, UCIBCS, UKBGS and UKOPS studies (Supplementary Table 1). CIMBA DACC approval is required to access data from the BCFR-ON, CONSIT TEAM, DKFZ, EMBRACE, FPGMX, GC-HBOC, GEMO, G-FAST, HEBCS, HEBON, IHCC, INHERIT, IOVHBOCS, IPOBCS, MCGILL, MODSQUAD, NAROD, OCGN, OUH and UKGRFOCR studies (Supplementary Table 3).
Code Availability statement
The data analysis code of this paper is available at https://github.com/andrewhaoyu/breast_cancer_data_analysis. The implementation of this two-stage polytomous regression method is available in a R package called TOP (https://github.com/andrewhaoyu/TOP) with a detailed tutorial available at https://github.com/andrewhaoyu/TOP/blob/master/inst/TOP.pdf.
Extended Data
Extended Data Fig. 1. Overview of the analytic strategy and results from the investigation of breast cancer susceptibility variants in women of European descent.
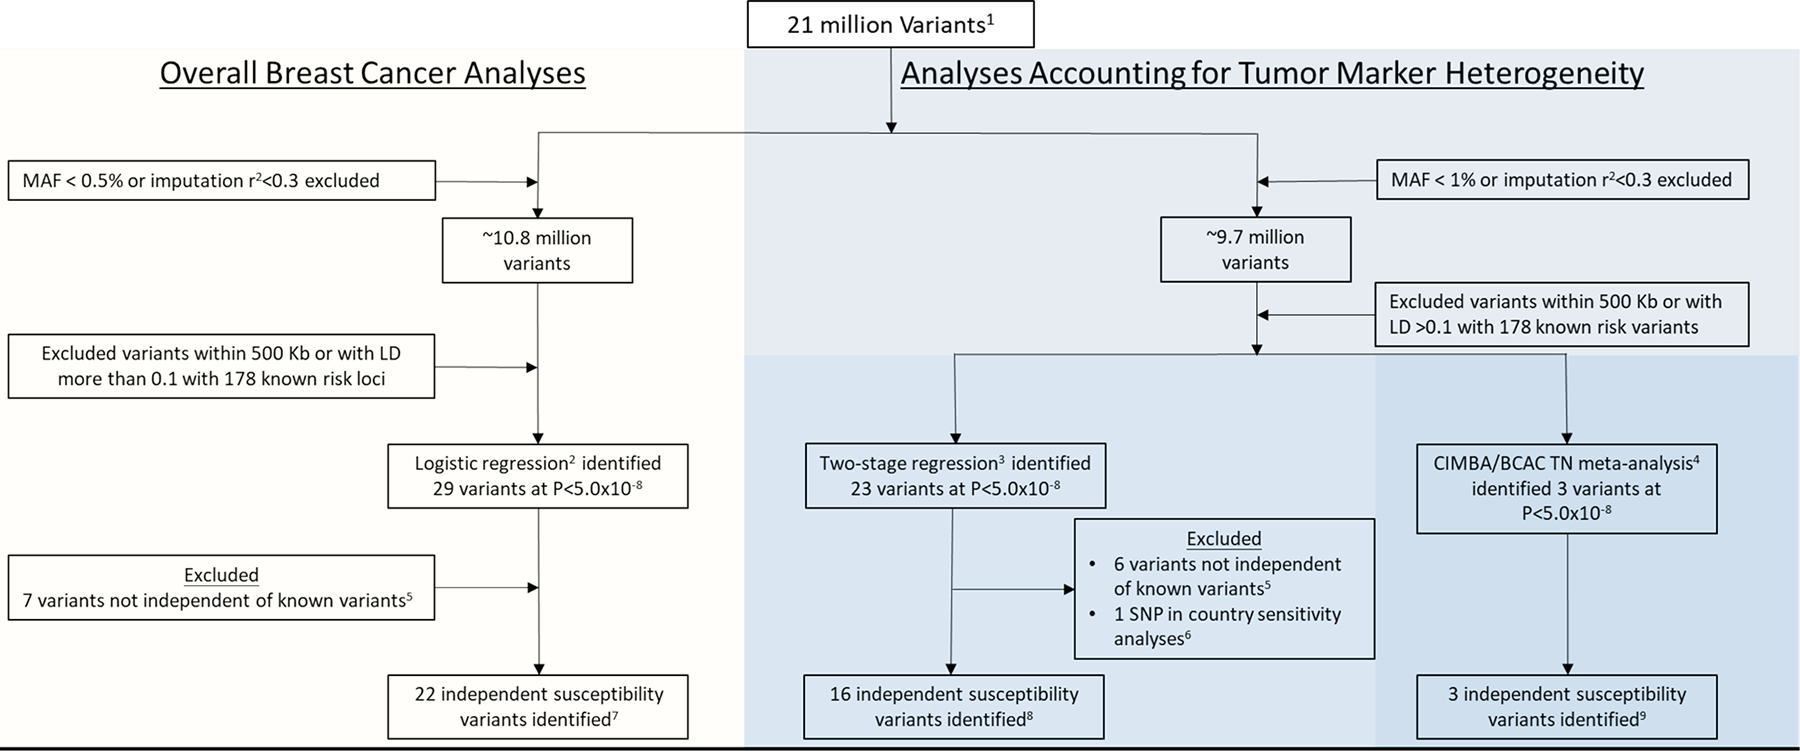
Analyses included investigating for susceptibility variants for overall breast cancer (invasive, in-situ or unknown invasiveness) and for susceptibility variants accounting for tumor heterogeneity according to the estrogen receptor (ER), progesterone receptor (PR), human epidermal growth factor receptor 2 (HER2), and grade, and specifically investigating for variants that predispose for risk of the triple-negative subtype. 1) Genotyping data from two Illumina genome-wide custom arrays, the iCOGS and Oncoarray, and imputed to the 1000 Genomes Project (Phase 3). (2) Overall breast cancer (invasive, in-situ, or unknown invasiveness) analyses included 82 studies from the Breast Cancer Association Consortium (BCAC; 118,474 cases and 96,201 controls) and summary level data from 11 other breast cancer GWAS (14,910 cases and 17,588 controls; Supplementary Table 1). (3) Analyses accounting for tumor marker heterogeneity according to ER, PR, HER2 and grade included 81 studies from BCAC (106,278 invasive cases and 91,477 controls). (4) Analyses investigating triple-negative susceptibility variants included 91,477 controls and 8,602 triple-negative TN (effective sample, see Supplementary Note) cases from BCAC and 9,414 affected and 9,494 unaffected BRCA1/2 carriers from 60 studies from the Consortium of Investigators of Modifiers of BRCA1/2 (CIMBA; Supplementary Table 3). (5) Variants excluded following conditional analyses showing the identified variants to not be independent (P>1×10⁻⁶) of 178 known susceptibility variants (see Online Methods). (6) See Supplementary Figure 6 for results of country-specific sensitivity analyses. (7) See Supplementary Table 5 for the 22 independent susceptibility variants identified in overall breast cancer analyses. (8) See Supplementary Table 6 for the 16 independent susceptibility variants identified using two-stage polytomous regression, accounting for tumor markers heterogeneity according to ER, PR, HER2, and grade. Note that 8 of the 16 variants were also detected in the overall breast cancer analysis (9) See Supplementary Table 7 for the 3 independent susceptibility variants identified in the CIMBA / BCAC- triple-negative TN meta-analysis. Note that rs78378222 was detected in both the analyses using the two-stage polytomous regression and in CIMBA / BCAC- triple-negative TN.
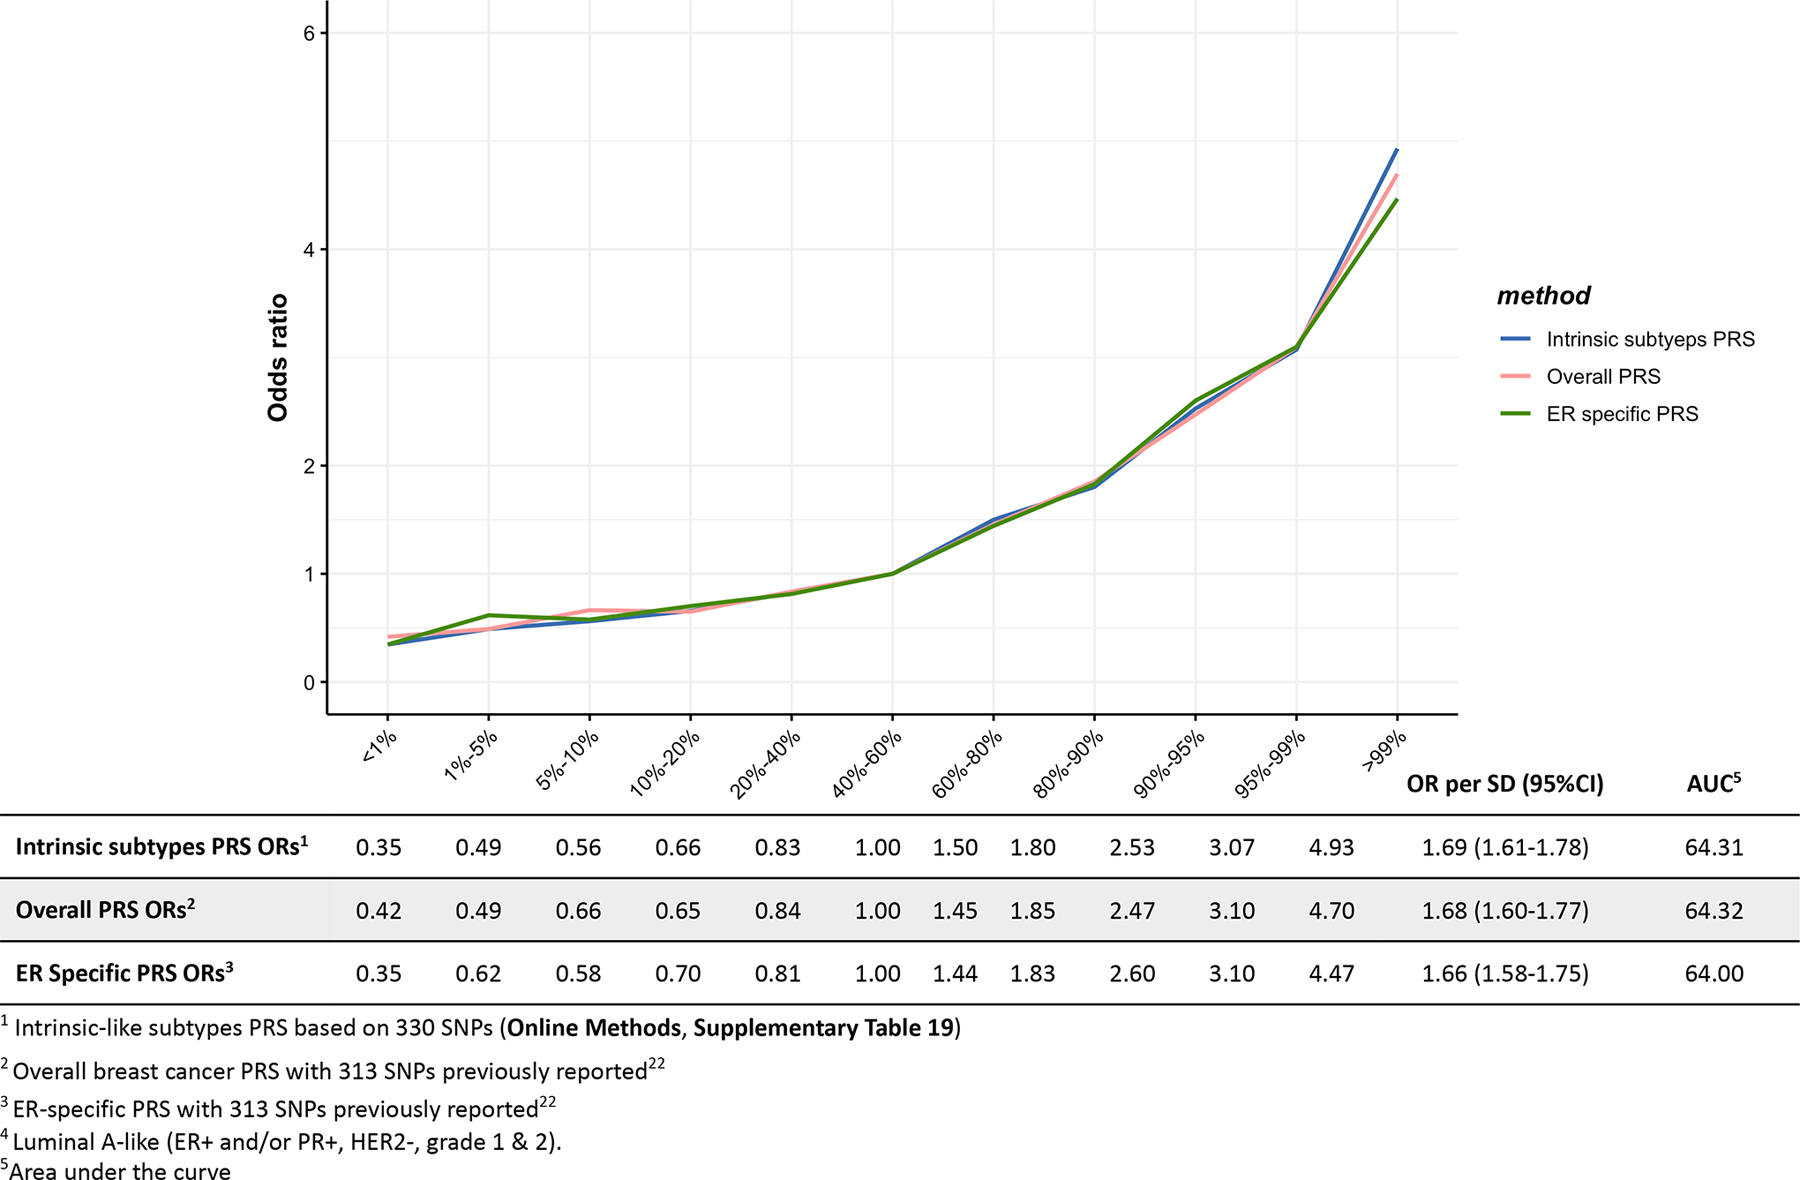
Extended Data Fig. 2. Associations between three different polygenetic risk scores1,2,3 and luminal A-like4 risk in the test dataset.
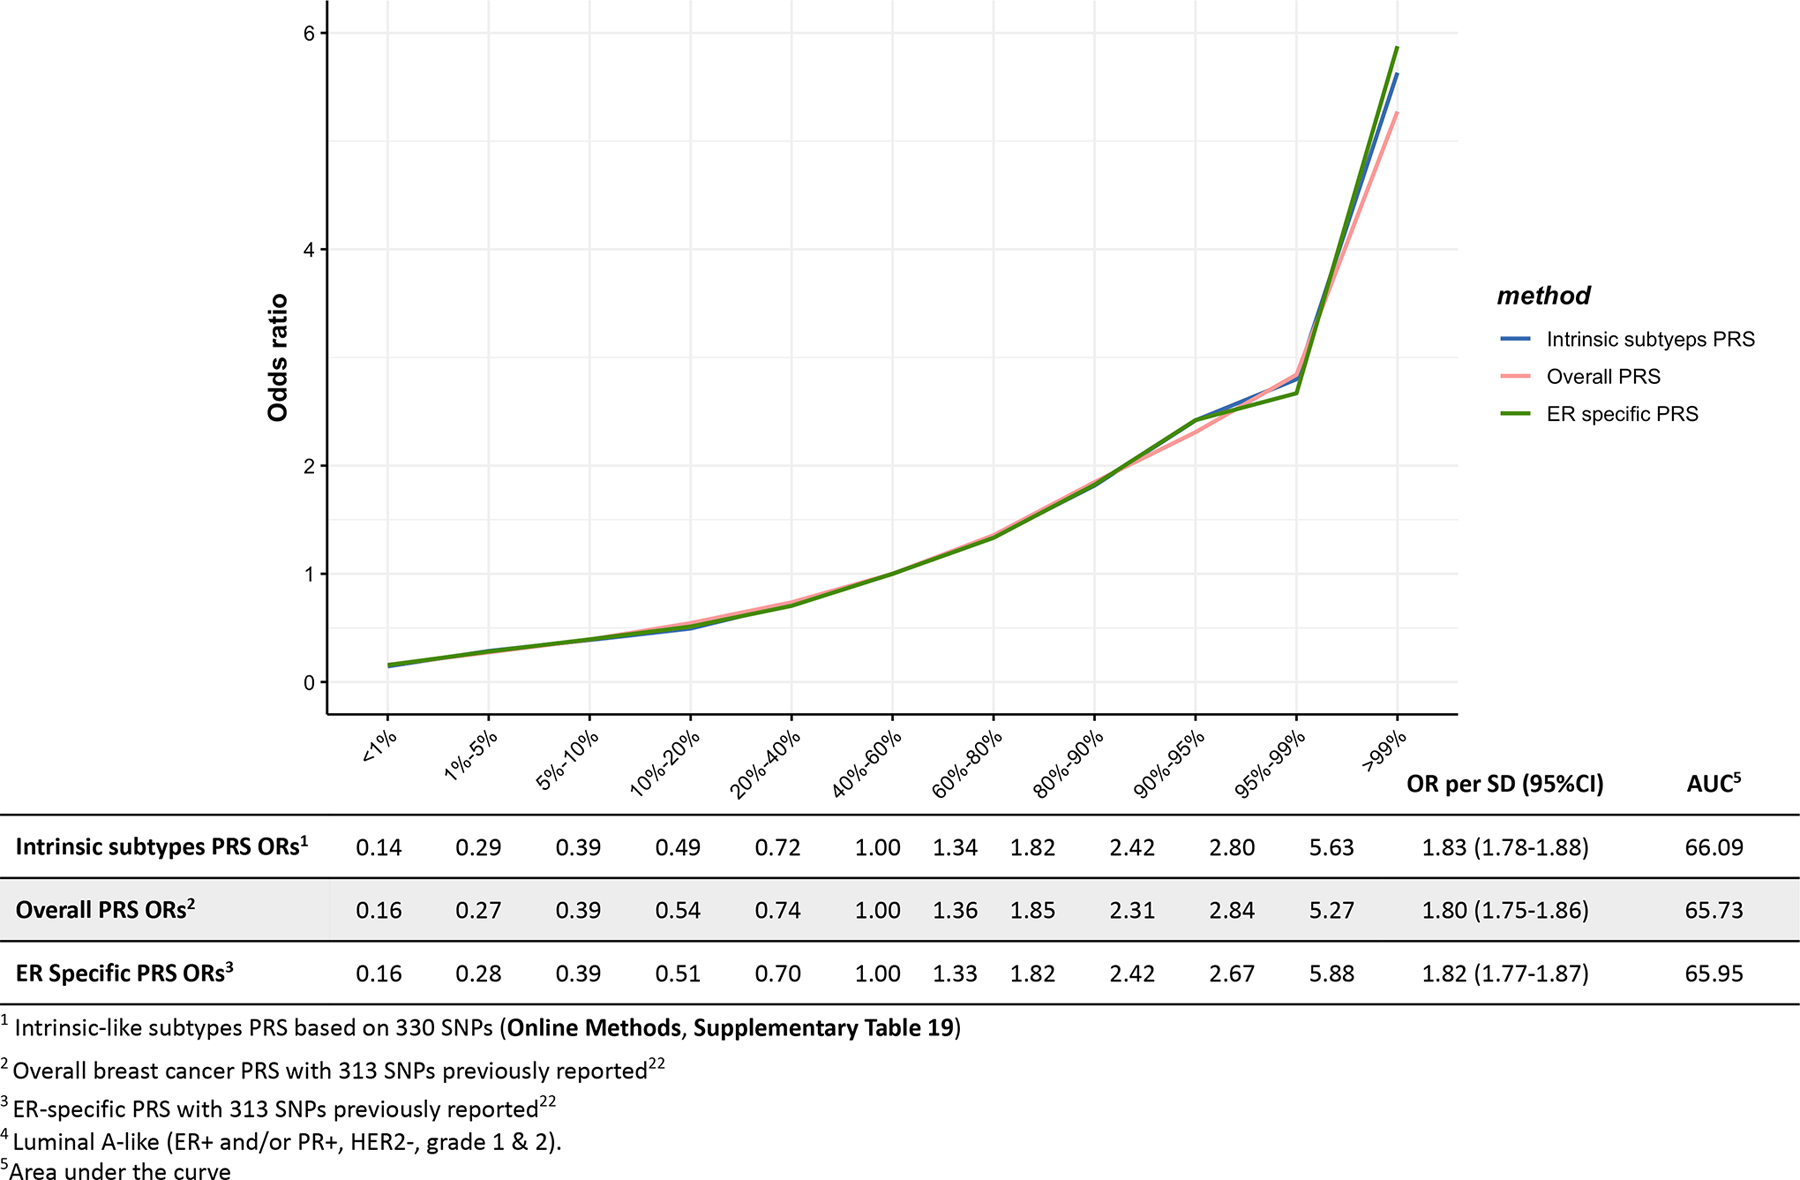
Odds ratios for different quantiles of the PRS against the middle quantile of the PRS. The odds ratios were estimated using the test dataset like (n = 7,325 Luminal-A like cases, n = 20,815 controls).
Extended Data Fig. 3. Associations between three different polygenetic risk scores1,2,3 and luminal B/HER2-negative-like4 risk in the test dataset.
Odds ratios for different quantiles of the PRS against the middle quantile of the PRS. The odds ratios were estimated using the test dataset like (n= 1,779 Luminal B/HER2-negative-like cases, n = 20,815 controls).
Extended Data Fig. 4. Associations between three different polygenetic risk scores1,2,3 and luminal B-like4 risk in the test dataset.
Odds ratios for different quantiles of the PRS against the middle quantile of the PRS. The odds ratios were estimated using the test dataset like (n = 1,682 Luminal B-like cases, n = 20,815 controls).
Extended Data Fig. 5. Associations between three different polygenetic risk scores1,2,3 and HER2-enriched-like4 risk in the test dataset.
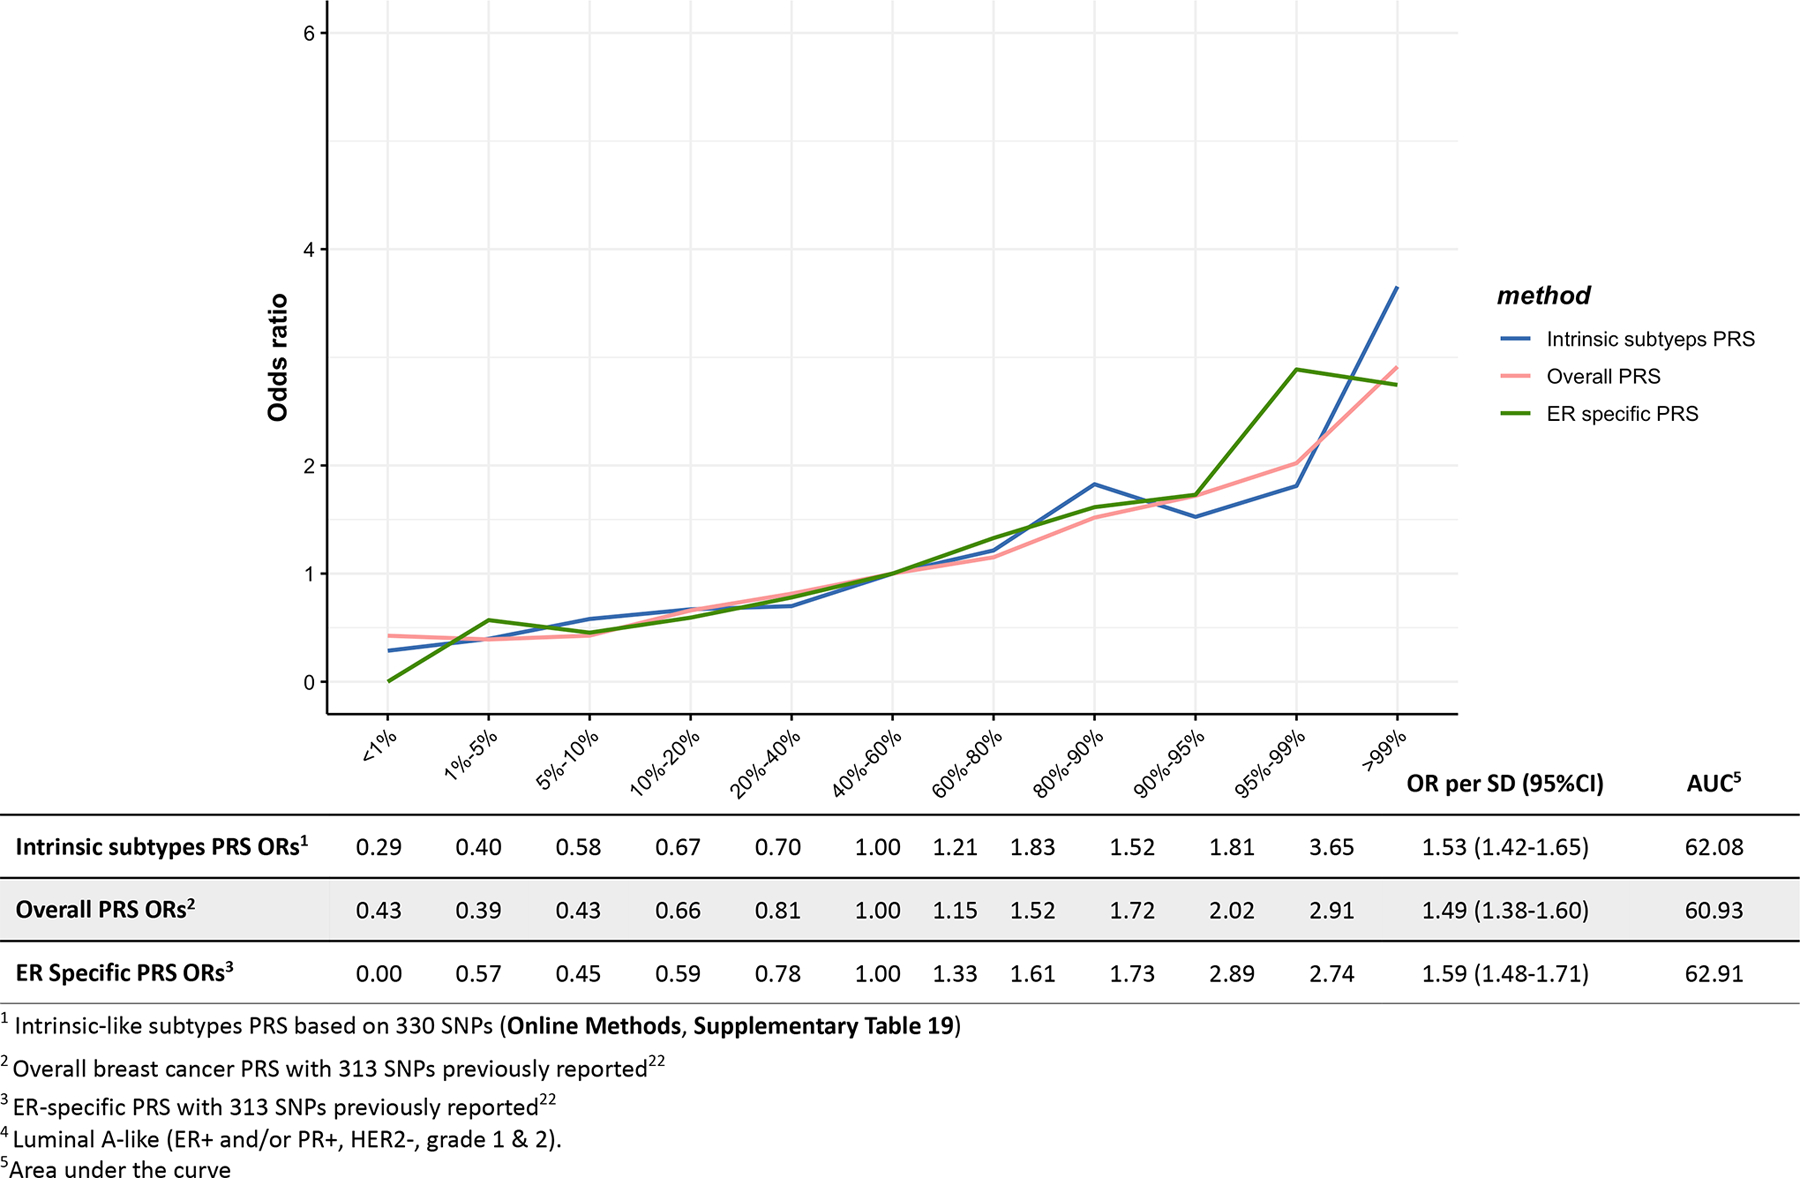
Odds ratios for different quantiles of the PRS against the middle quantile of the PRS. The odds ratios were estimated using the test dataset like (n = 718 HER2-enriched- like, n = 20,815 controls).
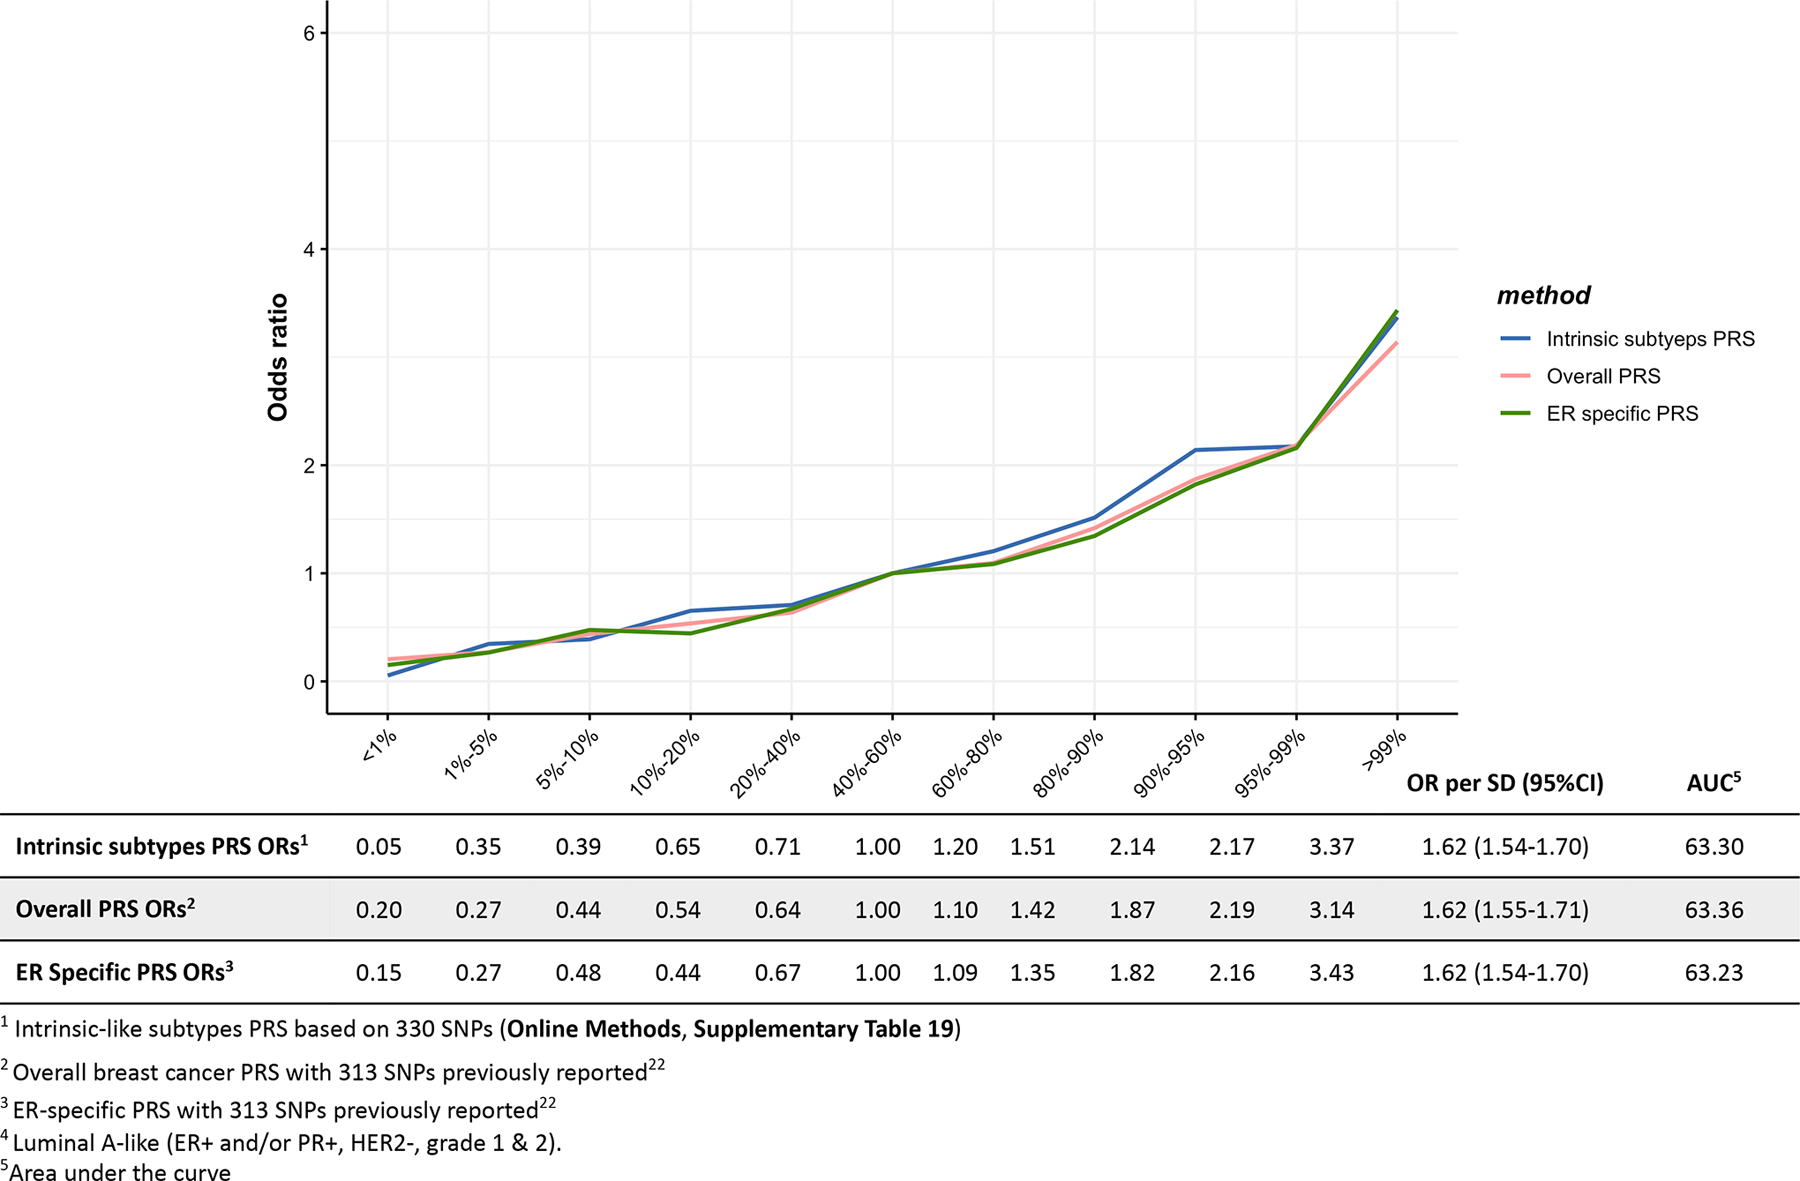
Extended Data Fig. 6. Associations between three different polygenetic risk scores1,2,3 and triple-negative4 risk in the test dataset.
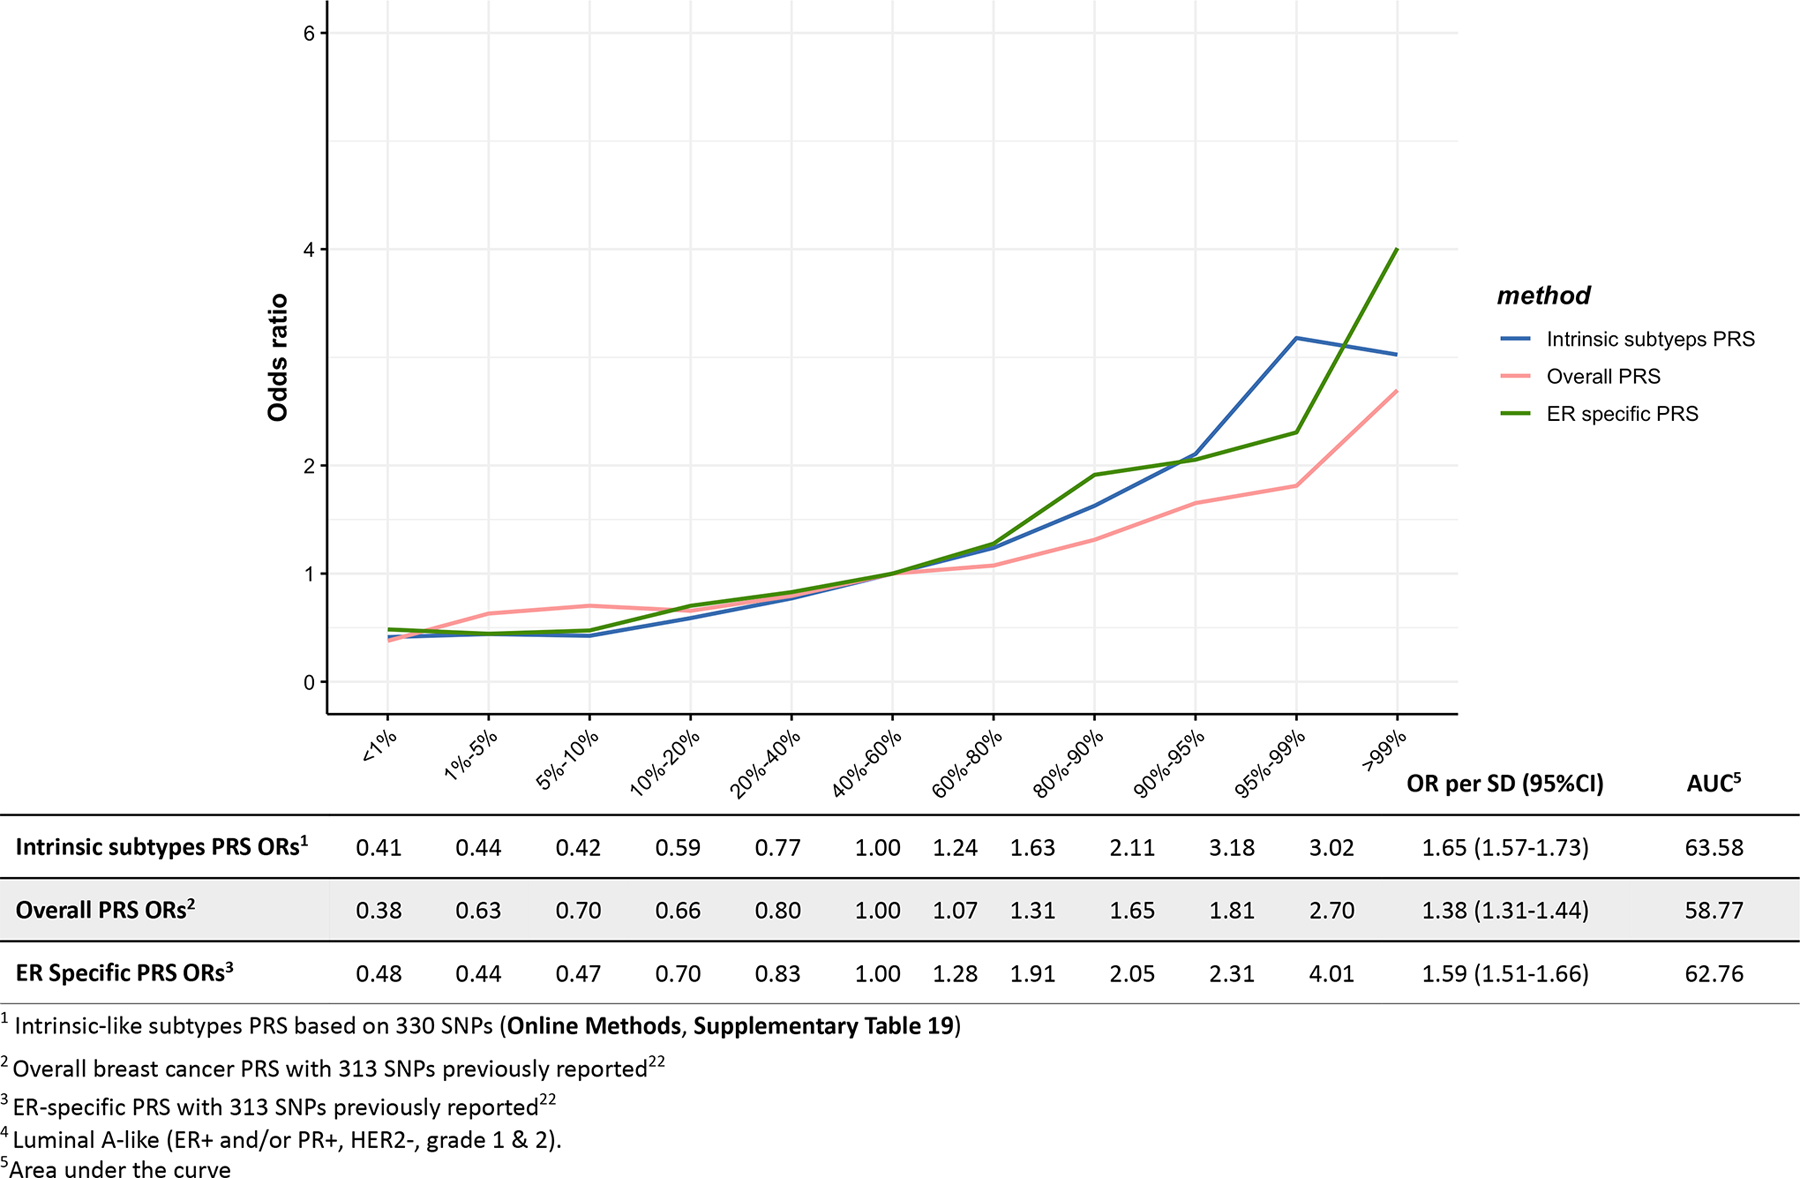
Odds ratios for different quantiles of the PRS against the middle quantile of the PRS. The odds ratios were estimated using the test dataset like (n = 2,006 triple-negative cases, n = 20,815 controls).
Supplementary Material
Acknowledgments and Funding
We thank all the individuals who took part in these studies and all the researchers, clinicians, technicians and administrative staff who have enabled this work to be carried out.
Genotyping for the OncoArray was funded by the government of Canada through Genome Canada and the Canadian Institutes of Health Research (GPH-129344), the Ministère de l’Économie, de la Science et de l’Innovation du Québec through Génome Québec, the Quebec Breast Cancer Foundation for the PERSPECTIVE project, the US National Institutes of Health (NIH) (1 U19 CA 148065 for the Discovery, Biology and Risk of Inherited Variants in Breast Cancer (DRIVE) project and X01HG007492 to the Center for Inherited Disease Research (CIDR) under contract HHSN268201200008I), Cancer Research UK (C1287/A16563), the Odense University Hospital Research Foundation (Denmark), the National R&D Program for Cancer Control–Ministry of Health and Welfare (Republic of Korea) (1420190), the Italian Association for Cancer Research (AIRC; IG16933), the Breast Cancer Research Foundation, the National Health and Medical Research Council (Australia) and German Cancer Aid (110837).
Genotyping for the iCOGS array was funded by the European Union (HEALTH-F2-2009-223175), Cancer Research UK (C1287/A10710, C1287/A10118 and C12292/A11174]), NIH grants (CA128978, CA116167 and CA176785) and the Post-Cancer GWAS initiative (1U19 CA148537, 1U19 CA148065 and 1U19 CA148112 (GAME-ON initiative)), an NCI Specialized Program of Research Excellence (SPORE) in Breast Cancer (CA116201), the Canadian Institutes of Health Research (CIHR) for the CIHR Team in Familial Risks of Breast Cancer, the Ministère de l’Économie, Innovation et Exportation du Québec (PSR-SIIRI-701), the Komen Foundation for the Cure, the Breast Cancer Research Foundation and the Ovarian Cancer Research Fund.
Combination of the GWAS data was supported in part by the NIH Cancer Post-Cancer GWAS initiative (1 U19 CA 148065) (DRIVE, part of the GAME-ON initiative). LD score regression analysis was supported by grant CA194393.
BCAC was funded by Cancer Research UK (C1287/A16563) and by the European Union via its Seventh Framework Programme (HEALTH-F2-2009-223175, COGS) and the Horizon 2020 Research and Innovation Programme (633784, B-CAST; 634935, BRIDGES). CIMBA was funded by Cancer Research UK (C12292/A20861 and C12292/A11174).
Dr. Nilanjan Chatterjee’s was funded by NHGRI (1R01 HG010480-01).
For a full description of funding and acknowledgments, see the Supplementary Note.
Footnotes
Conflicts of interest: None to report
References
- 1.Michailidou K et al. Association analysis identifies 65 new breast cancer risk loci. Nature 551, 92–94 (2017). [DOI] [PMC free article] [PubMed] [Google Scholar]
- 2.Milne RL et al. Identification of ten variants associated with risk of estrogen-receptor-negative breast cancer. Nat Genet 49, 1767–1778 (2017). [DOI] [PMC free article] [PubMed] [Google Scholar]
- 3.Garcia-Closas M et al. Genome-wide association studies identify four ER negative-specific breast cancer risk loci. Nat Genet 45, 392–8, 398e1–2 (2013). [DOI] [PMC free article] [PubMed] [Google Scholar]
- 4.Zhang H et al. A mixed-model approach for powerful testing of genetic associations with cancer risk incorporating tumor characteristics. Biostatistics, Doi: 10.1093/biostatistics/kxz065 (2020). [DOI] [PMC free article] [PubMed] [Google Scholar]
- 5.Michailidou K et al. Large-scale genotyping identifies 41 new loci associated with breast cancer risk. Nat Genet 45, 353–61, 361e1–2 (2013). [DOI] [PMC free article] [PubMed] [Google Scholar]
- 6.Michailidou K et al. Genome-wide association analysis of more than 120,000 individuals identifies 15 new susceptibility loci for breast cancer. Nat Genet 47, 373–80 (2015). [DOI] [PMC free article] [PubMed] [Google Scholar]
- 7.Dempster AP, Laird NM & Rubin DB Maximum Likelihood from Incomplete Data Via Em Algorithm. Journal of the Royal Statistical Society Series B-Methodological 39, 1–38 (1977). [Google Scholar]
- 8.Curigliano G et al. De-escalating and escalating treatments for early-stage breast cancer: the St. Gallen International Expert Consensus Conference on the Primary Therapy of Early Breast Cancer 2017. Ann Oncol 28, 1700–1712 (2017). [DOI] [PMC free article] [PubMed] [Google Scholar]
- 9.Spurdle AB et al. Refined histopathological predictors of BRCA1 and BRCA2 mutation status: a large-scale analysis of breast cancer characteristics from the BCAC, CIMBA, and ENIGMA consortia. Breast Cancer Res 16, 3419 (2014). [DOI] [PMC free article] [PubMed] [Google Scholar]
- 10.Phelan CM et al. Identification of 12 new susceptibility loci for different histotypes of epithelial ovarian cancer. Nat Genet 49, 680–691 (2017). [DOI] [PMC free article] [PubMed] [Google Scholar]
- 11.Stacey SN et al. A germline variant in the TP53 polyadenylation signal confers cancer susceptibility. Nat Genet 43, 1098–103 (2011). [DOI] [PMC free article] [PubMed] [Google Scholar]
- 12.Pellacani D et al. Analysis of Normal Human Mammary Epigenomes Reveals Cell-Specific Active Enhancer States and Associated Transcription Factor Networks. Cell Rep 17, 2060–2074 (2016). [DOI] [PubMed] [Google Scholar]
- 13.Beesley J et al. Chromatin interactome mapping at 139 independent breast cancer risk signals. bioRxiv, 520916 (2019). [DOI] [PMC free article] [PubMed] [Google Scholar]
- 14.Fachal L et al. Fine-mapping of 150 breast cancer risk regions identifies 178 high confidence target genes. Nat Genet 52, 56–73 (2020). [DOI] [PMC free article] [PubMed] [Google Scholar]
- 15.Nik-Zainal S et al. Landscape of somatic mutations in 560 breast cancer whole-genome sequences. Nature 534, 47–54 (2016). [DOI] [PMC free article] [PubMed] [Google Scholar]
- 16.Ferreira MA et al. Genome-wide association and transcriptome studies identify target genes and risk loci for breast cancer. Nat Commun 10, 1741 (2019). [DOI] [PMC free article] [PubMed] [Google Scholar]
- 17.Wu L et al. A transcriptome-wide association study of 229,000 women identifies new candidate susceptibility genes for breast cancer. Nat Genet 50, 968–978 (2018). [DOI] [PMC free article] [PubMed] [Google Scholar]
- 18.Bulik-Sullivan B et al. An atlas of genetic correlations across human diseases and traits. Nat Genet 47, 1236–41 (2015). [DOI] [PMC free article] [PubMed] [Google Scholar]
- 19.Bulik-Sullivan BK et al. LD Score regression distinguishes confounding from polygenicity in genome-wide association studies. Nat Genet 47, 291–5 (2015). [DOI] [PMC free article] [PubMed] [Google Scholar]
- 20.Finucane HK et al. Partitioning heritability by functional annotation using genome-wide association summary statistics. Nat Genet 47, 1228–35 (2015). [DOI] [PMC free article] [PubMed] [Google Scholar]
- 21.Ahearn TU et al. Common breast cancer risk loci predispose to distinct tumor subtypes. bioRxiv, 733402 (2019). [DOI] [PMC free article] [PubMed] [Google Scholar]
- 22.Mavaddat N et al. Polygenic Risk Scores for Prediction of Breast Cancer and Breast Cancer Subtypes. Am J Hum Genet 104, 21–34 (2019). [DOI] [PMC free article] [PubMed] [Google Scholar]
- 23.Lin DY & Sullivan PF Meta-analysis of genome-wide association studies with overlapping subjects. Am J Hum Genet 85, 862–72 (2009). [DOI] [PMC free article] [PubMed] [Google Scholar]
- 24.Chatterjee N A Two-Stage Regression Model for Epidemiological Studies with Multivariate Disease Classification Data. Journal of the American Statistical Association 99, 127–138 (2004). [Google Scholar]
- 25.Anderson WF, Rosenberg PS, Prat A, Perou CM & Sherman ME How many etiological subtypes of breast cancer: two, three, four, or more? J Natl Cancer Inst 106(2014). [DOI] [PMC free article] [PubMed] [Google Scholar]
- 26.Barnes DR et al. Evaluation of association methods for analysing modifiers of disease risk in carriers of high-risk mutations. Genet Epidemiol 36, 274–91 (2012). [DOI] [PubMed] [Google Scholar]
- 27.Antoniou AC et al. A locus on 19p13 modifies risk of breast cancer in BRCA1 mutation carriers and is associated with hormone receptor-negative breast cancer in the general population. Nat Genet 42, 885–92 (2010). [DOI] [PMC free article] [PubMed] [Google Scholar]
- 28.Mavaddat N et al. Pathology of breast and ovarian cancers among BRCA1 and BRCA2 mutation carriers: results from the Consortium of Investigators of Modifiers of BRCA1/2 (CIMBA). Cancer Epidemiol Biomarkers Prev 21, 134–47 (2012). [DOI] [PMC free article] [PubMed] [Google Scholar]
- 29.Willer CJ, Li Y & Abecasis GR METAL: fast and efficient meta-analysis of genomewide association scans. Bioinformatics 26, 2190–1 (2010). [DOI] [PMC free article] [PubMed] [Google Scholar]
- 30.Hendricks AE, Dupuis J, Logue MW, Myers RH & Lunetta KL Correction for multiple testing in a gene region. Eur J Hum Genet 22, 414–8 (2014). [DOI] [PMC free article] [PubMed] [Google Scholar]
- 31.Benjamini Y & Hochberg Y Controlling the False Discovery Rate: A Practical and Powerful Approach to Multiple Testing. Journal of the Royal Statistical Society. Series B (Methodological) 57, 289–300 (1995). [Google Scholar]
- 32.Udler MS, Tyrer J & Easton DF Evaluating the power to discriminate between highly correlated SNPs in genetic association studies. Genet Epidemiol 34, 463–8 (2010). [DOI] [PubMed] [Google Scholar]
- 33.Wellcome Trust Case Control, C. et al. Bayesian refinement of association signals for 14 loci in 3 common diseases. Nat Genet 44, 1294–301 (2012). [DOI] [PMC free article] [PubMed] [Google Scholar]
- 34.Pharoah PD et al. Polygenic susceptibility to breast cancer and implications for prevention. Nat Genet 31, 33–6 (2002). [DOI] [PubMed] [Google Scholar]
- 35.Visscher PM, Hill WG & Wray NR Heritability in the genomics era--concepts and misconceptions. Nat Rev Genet 9, 255–66 (2008). [DOI] [PubMed] [Google Scholar]
Associated Data
This section collects any data citations, data availability statements, or supplementary materials included in this article.
Supplementary Materials
Data Availability Statement
Summary level statistics are available from http://bcac.ccge.medschl.cam.ac.uk/bcacdata/ and http://cimba.ccge.medschl.cam.ac.uk/projects/. Requests for data can be made to the corresponding author or the Data Access Coordination Committees (DACCs) of BCAC (see above URL) and CIMBA (see above URL). BCAC DACC approval is required to access data from the ABCFS, ABCS, ABCTB, BBCC, BBCS, BCEES, BCFR-NY, BCFR-PA, BCFR-UT, BCINIS, BSUCH, CBCS, CECILE, CGPS, CTS, DIETCOMPLYF, ESTHER, GC-HBOC, GENICA, GEPARSIXTO, GESBC, HABCS, HCSC, HEBCS, HMBCS, HUBCS, KARBAC, KBCP, LMBC, MABCS, MARIE, MBCSG, MCBCS, MISS, MMHS, MTLGEBCS, NC-BCFR, OFBCR, ORIGO, pKARMA, POSH, PREFACE, RBCS, SKKDKFZS, SUCCESSB, SUCCESSC, SZBCS, TNBCC, UCIBCS, UKBGS and UKOPS studies (Supplementary Table 1). CIMBA DACC approval is required to access data from the BCFR-ON, CONSIT TEAM, DKFZ, EMBRACE, FPGMX, GC-HBOC, GEMO, G-FAST, HEBCS, HEBON, IHCC, INHERIT, IOVHBOCS, IPOBCS, MCGILL, MODSQUAD, NAROD, OCGN, OUH and UKGRFOCR studies (Supplementary Table 3).