Abstract
DNA barcoding is currently an effective and widely used tool that enables rapid and accurate identification of plant species. The Orchidaceae is the second largest family of flowering plants, with more than 700 genera and 20,000 species distributed nearly worldwide. The accurate identification of Orchids not only contributes to the safe utilization of these plants, but also it is essential to the protection and utilization of germplasm resources. In this study, the DNA barcoding of 4 chloroplast genes (matK, rbcL, ndhF and ycf1) were used to provide theoretical basis for species identification, germplasm conservation and innovative utilization of orchids. By comparing the nucleotide replacement saturation of the single or combined sequences among the 4 genes, we found that these sequences reached a saturation state and were suitable for phylogenetic relationship analysis. The phylogenetic analyses based on genetic distance indicated that ndhF and ycf1 sequences were competent to identification at genus and species level of orchids in a single gene. In the combined sequences, matK + ycf1 and ndhF + ycf1 were qualified for identification at the genera and species levels, suggesting the potential roles of ndhF, ycf1, matK + ycf1 and ndhF + ycf1 as candidate barcodes for orchids. Based on the SNP sites, candidate genes were used to obtain the specific barcode of orchid plant species and generated the corresponding DNA QR code ID card that could be immediately recognized by electronic devices. This study provides innovative research methods for efficient species identification of orchids. The standardized and accurate barcode information of Orchids is provided for researchers. It lays the foundation for the conservation, evaluation, innovative utilization and protection of Orchidaceae germplasm resources.
Subject terms: Computational biology and bioinformatics, Evolution, Genetics
Introduction
Orchidaceae is the second largest family after Composite, and the largest family of monocotyledonous plants1–3. More than 700 genera and more than 20,000 species were identified in the family Orchidaceae, which account for 8 percent of all flowering plants1,2,4–7. Orchids mainly distribute in the tropical and subtropical regions of the world, and a few species grow in the temperate regions2–4,8,9.
The Orchidaceae plants exhibit important ornamental, medicinal, research and ecological value2,10–12. Many Orchidaceae plants with beautiful flowers and rich fragrance are ornamental plants, such as Cymbidium, Phalaenopsis, Cypripedium2,12–14. Numerous species containing active ingredients, like polysaccharides, alkaloids, phenanthrene and dibenzyl also are served as traditional herbal medicines for treatment of the diseases2,7,10,12,15. These traits that is able to bring great economic benefits make Orchidaceae plants on raising market demand. In the past decades, over-exploitation and habitat destruction by humans caused serious extinction threats to a large number of Orchidaceae plants2,10,15. Additionally, more and more counterfeit and shoddy Orchidaceae-related products emerge. This is not only likely to threaten drug safety, but also caused damage to biodiversity2,7,11,12.
Given that, the accurate identification of Orchidaceae plants is of great significance for their safe utilization, biodiversity and the protection of genetic resources2,7,12,16,17. It is known that traditional identification methods are based on morphological features. Some Orchidaceae plants, however, alomst exhibit no morphological differences before flowering, and the orphological features are susceptible to environmental factors2,7, 16,18. In addition, there are fewer and fewer experienced experts in morphological identification2,7,12,16,18–20. Totally, this makes the accurate identification to be a time consuming and labor intensive job. Therefore, we are badly in need of a rapid, accessible and accurate identification method.
The DNA barcode technology is a novel molecular recognition technology that uses short and standard DNA fragments for species identification7,16,17,19,21,22. DNA barcodes were originally utilized to identify microorganisms23, but now it is able to quickly and accurately identify species at the level of species with unlimited reasons for development stage, internal morphological diversity, environmental factors and user's professional level2,7,16,18,22,23. Thus, the DNA barcoding technology has been rapidly applied in species identification, biosystematics, biodiversity, ecological community evolution, species protection, archaeological sample identification and other aspects1,7,18,24–27. Mitochondrial cytochrome oxidase I gene proposed by Hebert et al. in 2003 had been widely used in animal species identification and phylogenetic development28,29. However, due to the low mutation rate of mitochondrial DNA, mitochondrial cytochrome oxidase I can not be used in plants21,23,30,31. In the past decades, many researchers have made great contributions to the search and application of barcode in plants. Subsequently, many scientists performed a great deal of phylogenetic analyses among numerous families or subfamilies of the orchid family based on two plastid genes matK or rbcL24,30,32–34. Many efforts have been made to discover the core barcodes for different land plant taxa, whereas a consensus has not been reached35,36. After that, CBOL Plant Working Group compared the performance of seven leading candidate plasome DNA regions (atpF-atpH interval, matK gene, rbcL gene, rpoB gene, rpoC1 gene, psbK-psbI interval and trnH-psbA interval) and recommended the 2-site combination of rbcL + matK as a plant barcode based on the evaluation of recoverability, sequence quality and species identification level23. The generality of medicinal plants species identification were assessed according to matK and rbcL genes16,27,37–40. The molecular taxonomic identification of the Canarian oceanic hotspot was studied based on matK + rbcL41. Chen et al. found that ycf1 showed high identification ability at the species level of rare and protected medicinal plants. The chloroplast gene ndhF was found to be able to identify 100% solanum species by Zhang et al.42,43. Although DNA barcoding has been widely studied in phylogeny and species identification of Orchids, it has not been reported that DNA barcoding genes can be used to develop specific identification segments of different species2,7,9,16,17,44–48.
Here, we used four chloroplast gene sequences (matK, rbcL, ndhF and ycf1) and three combined sequences including matK + rbcL, matK + ycf1, ndhF + ycf1 of Orchidaceae species to develop unique identification fragments of a certain species of Orchidaceae based on phylogenetic analyses and SNP site analyses. Furthermore, the barcode genes were comprehensively analyzed to obtain standard DNA marker fragments of Orchidaceae. Therefore, this study provided a novel approach, based on the SNP barcode, to accurately and rapidly identify Orchidaceae plants. This technology replenishes traditional methods of identification in Orchidaceae plants. This is the first study to report a strategy for developing specific DNA barcodes of Orchidaceae plants, laying the foundation for the conservation, evaluation, innovative utilization and protection of Orchidaceae germplasm resources.
Results
DNA sequences analysis
In this study, the sequences including 3040 matK sequences (307 genera, 1900 species), 641 rbcL sequences (55 genera, 192 species), 225 ndhF sequences (102 species, 29 genera), and 384 ycf1 sequences (48 genera, 173 species) of Orchids were obtained from the NCBI Nucleotide database (https://www.ncbi.nlm.nih.gov/) for further analyses.
After blasting and editing, the consensus length of matK, rbcL, ndhF and ycf1 were 2169 bp, 1524 bp, 2953 bp, 8145 bp respectively, and that of combined sequence including matK + rbcL, matK + ycf1, ndhF + ycf1 were 3348 bp, 9731 bp, 9701 bp, respectively.
The overall mean nucleotide base frequencies observed for candidate nucleotide sequences and the distribution of the four bases of candidate nucleotide sequences at different coding positions of codons were showed in Table 1. The average number of identical pairs (ii) for candidate nucleotide sequences was showed in Table 2. The account of transitional pairs (si) and transversional pairs (sv) of nucleotide sequences was showed in Table 2. The transitional and transversional of bases in the sequences may be related to the species difference.
Table 1.
The nucleotide base frequencies analysis of candidate nucleotide sequences in Orchidaceae plants.
| Sequences | Base content | ||||||||||
|---|---|---|---|---|---|---|---|---|---|---|---|
| A | T | C | G | GC | AT-1 | GC-1 | AT-2 | GC-2 | AT-3 | GC-3 | |
| matK | 30.8 | 37.8 | 16.4 | 15.0 | 31.4 | 68.5 | 31.5 | 68.9 | 31.2 | 68.3 | 31.7 |
| rbcL | 28.0 | 29.2 | 18.4 | 24.5 | 42.9 | 62.7 | 37.3 | 53.2 | 46.7 | 55.4 | 44.6 |
| ndhF | 27.3 | 39.4 | 16.1 | 17.2 | 33.3 | 66.9 | 33.1 | 64.9 | 35.1 | 68.4 | 31.6 |
| ycf1 | 40.4 | 30.0 | 13.9 | 15.7 | 29.6 | 69.3 | 30.8 | 71.8 | 28.2 | 60.2 | 29.8 |
Table 2.
The analysis of nucleotide pair frequencies of candidate nucleotide sequences of Orchidaceae plants.
| Sequence | ii | si | sv | R | ||||||||||||
|---|---|---|---|---|---|---|---|---|---|---|---|---|---|---|---|---|
| Avg | 1st | 2nd | 3rd | Avg | 1st | 2nd | 3rd | Avg | 1st | 2nd | 3rd | Avg | 1st | 2nd | 3rd | |
| matK | 1268 | 431 | 423 | 414 | 49 | 16 | 15 | 18 | 43 | 13 | 15 | 15 | 1.1 | 1.3 | 1.0 | 1.2 |
| rbcL | 1378 | 462 | 458 | 458 | 29 | 10 | 10 | 9 | 14 | 4 | 5 | 5 | 2.1 | 2.6 | 1.9 | 1.0 |
| ndhF | 1234 | 410 | 419 | 404 | 38 | 14 | 12 | 12 | 34 | 11 | 10 | 12 | 1.1 | 1.3 | 1.1 | 0.9 |
| ycf1 | 4521 | 1514 | 1509 | 1498 | 205 | 61 | 72 | 72 | 200 | 68 | 62 | 70 | 1.0 | 0.9 | 1.2 | 1.0 |
| matK + rbcL | 2835 | 953 | 936 | 946 | 73 | 19 | 32 | 22 | 56 | 15 | 21 | 21 | 1.3 | 1.3 | 1.6 | 1.1 |
| matK + ycf1 | 6015 | 1990 | 2008 | 2017 | 247 | 94 | 76 | 77 | 239 | 82 | 81 | 75 | 1.0 | 1.2 | 0.9 | 1.0 |
| ndhF + ycf1 | 5718 | 1905 | 1914 | 1899 | 189 | 63 | 61 | 65 | 187 | 61 | 61 | 65 | 1.0 | 1.0 | 1.0 | 1.0 |
ii Identical Pairs, si Transitionsal Pairs, sv Transversional Pairs, R si/sv.
Polymorphism site analysis of the candidate nucleotide sequences revealed in Table 3. Among the single sequence and the combination sequence rbcL sequence had the least proportion of mutation sites, accounting for 34.8%, while the conservative sites in the corresponding rbcL sequence accounted for 64.7%. The sequence matK had the highest proportion of mutation sites (70.2%), and the corresponding matK sequence had the lowest proportion of conservative sites (18.9%).
Table 3.
The analysis of variation of candidate barcode sequences in Orchidaceae plants.
| Sequence | Conserved site | Variable site | Parsimony-informative site | Sigon site |
|---|---|---|---|---|
| matK | 411 (18.9%) | 1523 (70.2%) | 1275 | 222 |
| rbcL | 986 (64.7%) | 530 (34.8%) | 504 | 26 |
| ndhF | 1031 (34.9%) | 1790 (60.6%) | 1492 | 297 |
| ycf1 | 3291 (40.4%) | 4732 (58.1%) | 4578 | 154 |
| matK + rbcL | 1856 (55.4%) | 1455 (43.5%) | 1369 | 86 |
| matK + ndhF | 2017 (44.5%) | 2377 (52.4%) | 2027 | 348 |
| matK + ycf1 | 3996 (41.1%) | 5506 (56.6%) | 5247 | 259 |
| ndhF + ycf1 | 4217 (43.5%) | 5299 (54.6%) | 4696 | 592 |
Genetic diversity
There must be some genetic variation based on their species differences since the data used to analyze were obtained from different species. The basic indicators of genetic diversity, displayed in Table 4, worked out in accordance with pairwise nucleotide differences and nucleotide diversity, and the validity of these indexes were verified by two neutrality tests, like Fu’s Fs49 and Tajima’s D50. The matK + ycf1 sequences had revealed maximum genetic diversity cumulatively on the base of Eta value, revealed 2314 mutations within all sequences. While the rbcL sequences only had 322 mutations variations in all sequences. The significance of genetic diversity was verified by both neutrality tests, which confirmed that all sequences had significant difference but no very significant difference based on the probability value (p-value) of Fu’s Fs test and Tajima’s D test (Table 4).
Table 4.
Genetic diversity caculation of Orchidaceae plants based on candidate barcode sequences by the DnaSP v5 software.
| Sequences | n | Nucleotide diversity | π | Neutrality tests | |||||||
|---|---|---|---|---|---|---|---|---|---|---|---|
| S | k | Eta | Hd | θ | Fu’s Fs | p-value | D | p-value | |||
| matK | 3050 | 1288 | 3.12596 | 1523 | 0.9050 | 0.24339 | 0.07270 | − 2.57476 | < 0.05 | − 1.84286 | < 0.05 |
| rbcL | 643 | 259 | 15.997 | 322 | 0.9779 | 0.07155 | 0.02503 | − 0.51015 | > 0.10 | − 1.92689 | < 0.05 |
| ndhF | 234 | 233 | 13.952 | 340 | 0.9660 | 0.18546 | 0.04589 | − 2.96843 | < 0.05 | − 2.37565 | < 0.01 |
| ycf1 | 384 | 906 | 95.110 | 1470 | 0.9921 | 0.17379 | 0.07339 | 0.25100 | > 0.10 | − 1.78584 | < 0.05 |
| matK + rbcL | 372 | 559 | 54.729 | 821 | 0.9924 | 0.12616 | 0.05462 | − 0.11121 | > 0.10 | − 1.75132 | < 0.05 |
| matK + ndhF | 216 | 687 | 59.444 | 943 | 0.9853 | 0.12276 | 0.04604 | − 1.32301 | > 0.10 | − 2.00131 | < 0.05 |
| matK + ycf1 | 378 | 1495 | 150.984 | 2314 | 0.9932 | 0.15463 | 0.06542 | 0.08057 | > 0.10 | − 1.79023 | < 0.05 |
| ndhF + ycf1 | 228 | 494 | 39.916 | 712 | 0.9740 | 0.15585 | 0.05191 | − 1.47948 | > 0.10 | − 2.13392 | < 0.01 |
Eta Total number of mutations, n number of sequences, k Average number of nucleotide difference, S Number of segregating sites, θ nucleotide substitution rate, π nucleotide diversity, Hd haplotype diversity, Fu’s Fs is variation among different haplotypes in the population, D is the Tajima test statistic.
Like the neutrality testes of the Tajima test statistic (D value) in the sequences, the genetic variation for ndhF sequences was negatively little higher (− 2.37565) with respect to rbcL sequence, consisting value up to − 0.51015. And for combined sequences, the genetic variation for ndhF + ycf1 sequences was negatively little higher (− 2.13392) with respect to matK + rbcL sequence, consisting value up to − 1.75132. With respect to Fu’s Fs value for sequences variation, the ndhF sequences was higher sequences variation (− 2.96843), shown in Table 4, in comparison with rbcL sequence (− 0.51015). In order to observe nucleotide mismatch distribution among different sequences of Orchidaceae species, DNA sequences were analyzed for population size changes which was enriched the results of genetic diversity among species. All results showed significant genetic variation in Orchidaceae species for candidate nucleotide sequences (Fig. 1).
Figure 1.
Pairwise mismatch distributions, based on matK, rbcL, ndhF, ycf1 and the combined sequences by DnaSP v5. Note: The X-axis shows the observed distribution of pairwise genetic variation, and the Y-axis shows the frequency. R2 Ramos-Onsins and Rozas statistics, r Raggedness statistic, Tau Date of the Growth or Decline measured of mutational time, C.V. Coefficient of variation.
Phylogenetic analysis
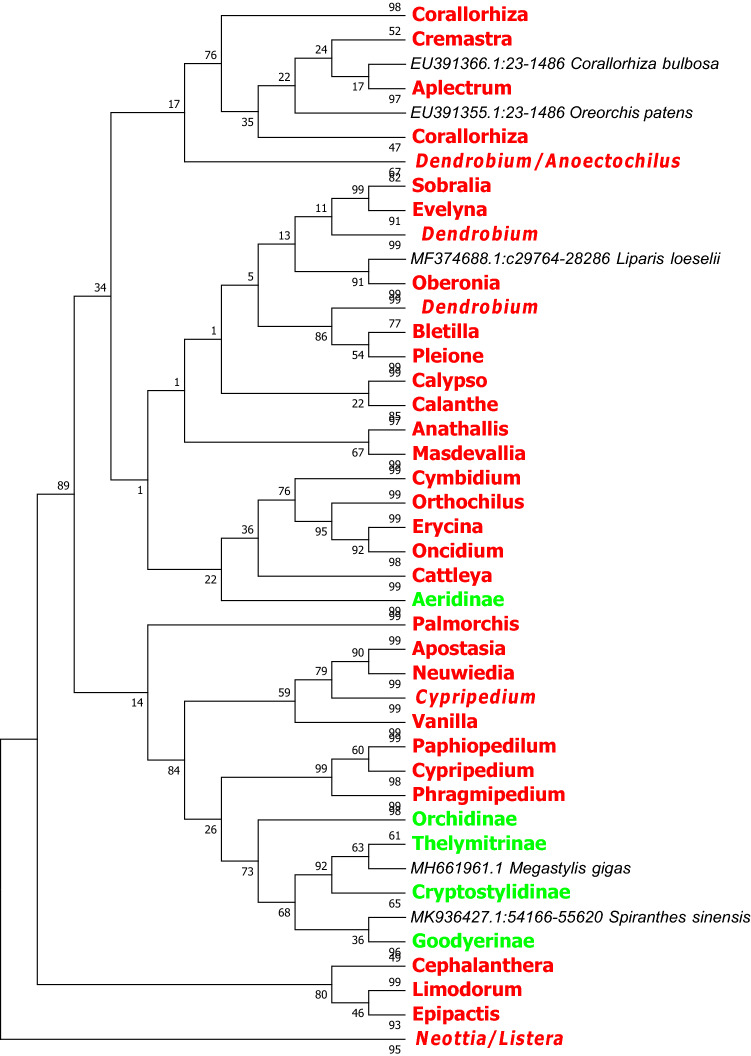
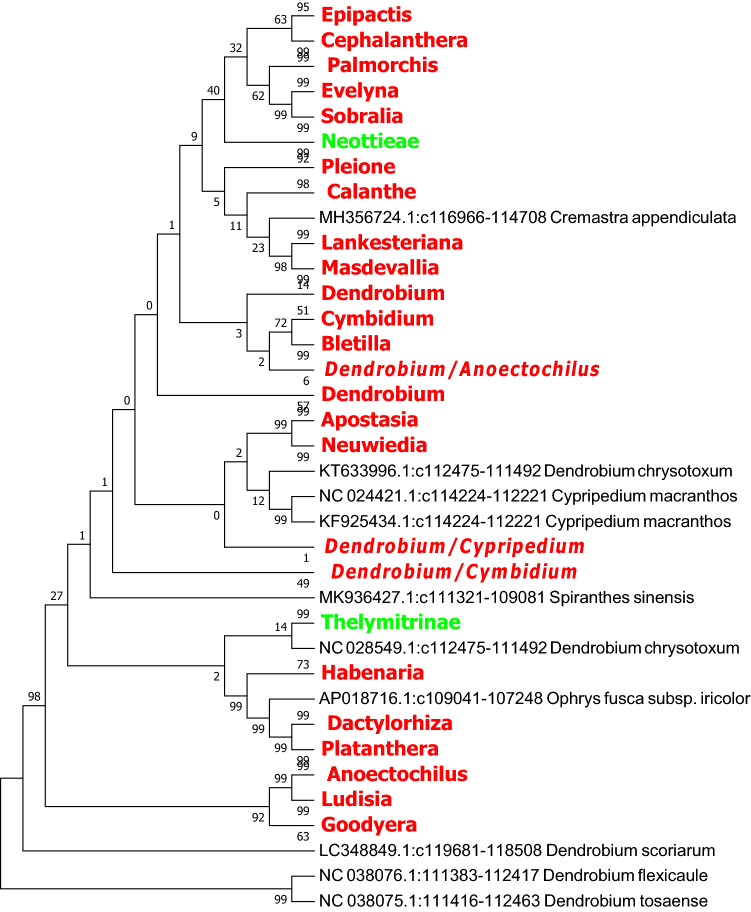
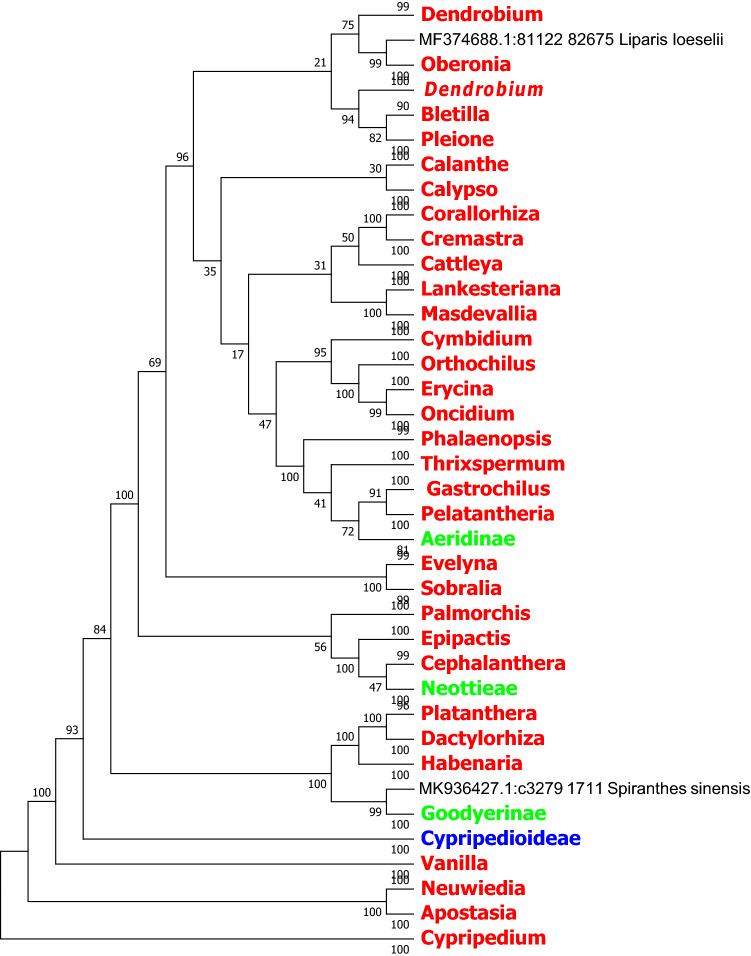
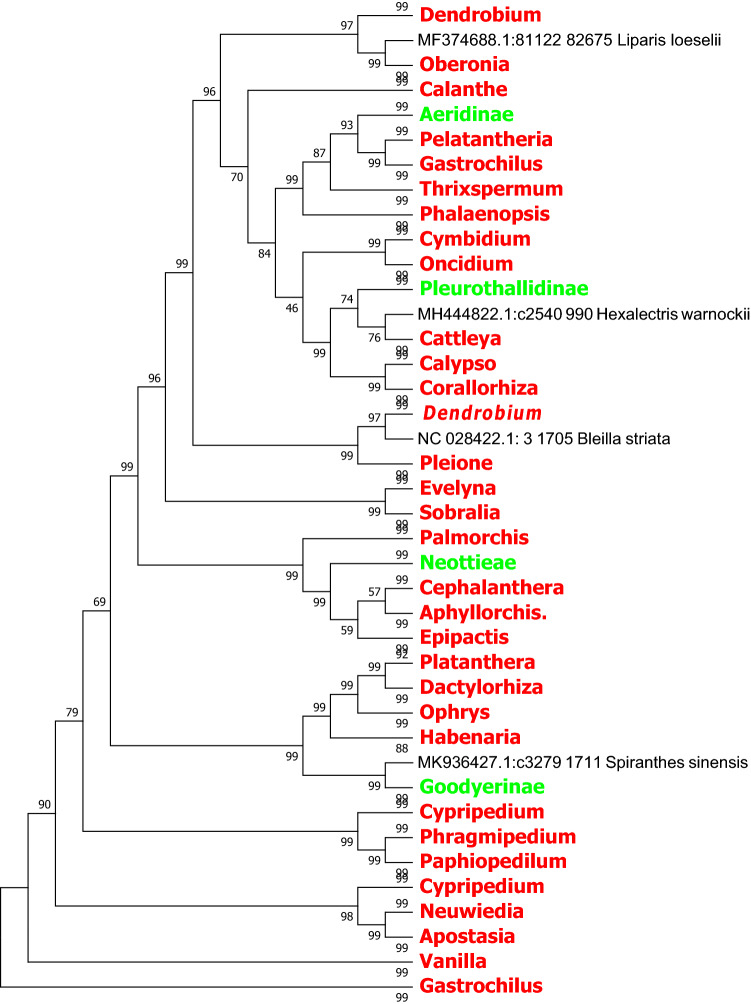
In this study, we used the MEGA7.0 software based on the Neighbor Joining method and Kimura 2-parameter model to identify rbcL, ndhF and ycf1 sequence of the evolutionary tree, and we compressed the same genera or the same subtribes of Orchid with the MEGA 7.0 own Compress Subtree. In the light of the topological structure of the evolutionary tree, species in several subfamilies are not be well identified based on matK, rbcL and the combined sequence matK + rbcL. In contrast, the ndhF, ycf1 sequences and the combined sequences matK + ycf1 and ndhF + ycf1 of chloroplast genes exhibit better identification ability at the generic level (Figs. 2, 3, 4, 5, 6, 7, 8).
Figure 2.
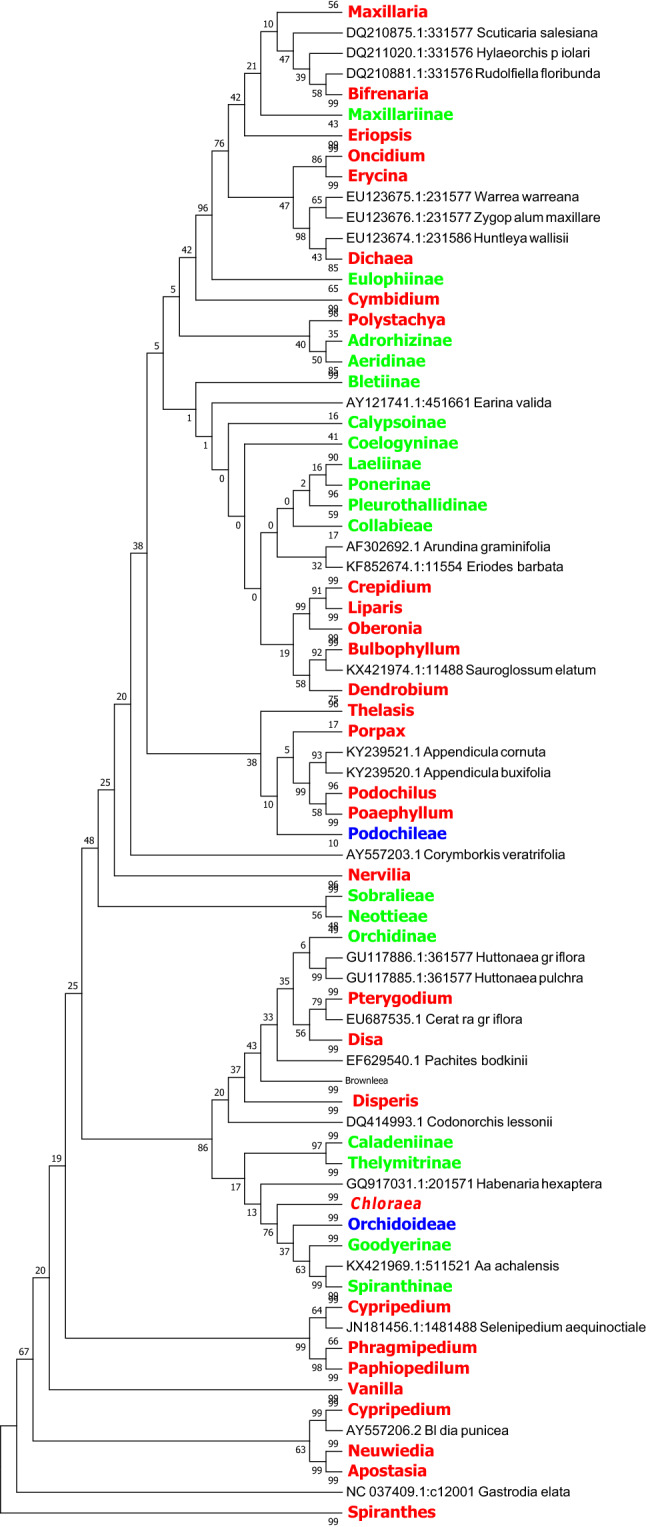
The NJ tree of Orchidaceae coming from analysis of the cp DNA matK sequence based on the K2P model. Names tagged in red indicates the genus, tagged in green showed the subtribe and tagged in blue showed the subfamily; The Numbers on the branches represent more than or equal to 50 percent support after the 1000 bootstrap replications test; Numbers following taxon names showed the number of species.
Figure 3.
The NJ tree of Orchidaceae coming from analysis of the cp DNA rbcL sequence based on the K2P model. Names tagged in red indicates the genus and tagged in green showed the subtribe; The Numbers on the branches represent more than or equal to 50 percent support after the 1000 bootstrap replications test; Numbers following taxon names showed the number of species.
Figure 4.
The NJ tree of Orchidaceae coming from analysis of the cp DNA ndhF sequence based on the K2P model. Names tagged in red indicates the genus and tagged in green showed the subtribe; The Numbers on the branches represent more than or equal to 50 percent support after the 1000 bootstrap replications test; Numbers following taxon names showed the number of species.
Figure 5.
The NJ tree of Orchidaceae coming from analysis of the cp DNA ycf1 sequence based on the K2P model. Names tagged in red indicates the genus and tagged in green showed the subtribe; The Numbers on the branches represent more than or equal to 50 percent support after the 1000 bootstrap replications test; Numbers following taxon names showed the number of species.
Figure 6.
The NJ tree of Orchidaceae coming from analysis of the matK + rbcL sequence based on the K2P model. Names tagged in red indicates the genus and tagged in green showed the subtribe. The Numbers on the branches represent more than or equal to 50 percent support after the 1000 bootstrap replications test. The Numbers following taxon names showed the number of species.
Figure 7.
The NJ tree of Orchidaceae from analysis of the matK + ycf1 sequence based on the K2P model. Names tagged in red indicates the genus and tagged in green showed the subtribe; The Numbers on the branches represent more than or equal to 50 percent support after the 1000 bootstrap replications test; Numbers following taxon names showed the number of species.
Figure 8.
The NJ tree of Orchidaceae from analysis of the ndhF + ycf1 sequence based on the K2P model. Names tagged in red indicates the genus and tagged in green showed the subtribe.
Analysis of barcoding gap
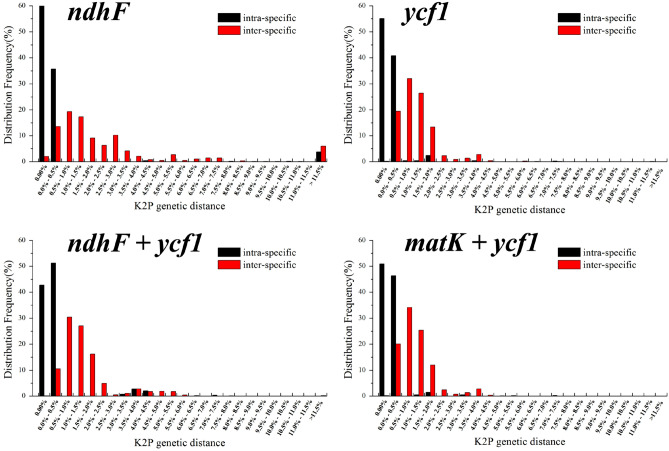
An ideal DNA barcoding sequence for species identification should satisfy that inter-specific genetic variation is significantly greater than intra-specific genetic variation. In order to more accurately assess individual chloroplast genes and combined sequences in the Orchid genus species, and to verify the applicability of candidate sequences, the barcoding gap was analyzed according to frequency distribution showed in Fig. 9. The results revealed that the ndhF gene showed better performance in a single gene, while the combined sequences of ndhF + ycf1 showed the best performance. The results of the Best Close Match of several candidate barcodes based on genetic distance are showed in Table 5. Among the single genes, the accuracy rate of ycf1 gene for orchid plant identification is 89.32%, with 3.38% fuzzy identification rate and 6.25% error identification rate. The ndhF gene exhibits the highest identification rate and lower error rate of matK + ycf1, followed by ndhF + ycf1 sequence. The accuracy of matK + ycf1 sequence was 89.6%, with 2.8% fuzzy identification rate and 1.12% error identification rate. The accuracy rate of ndhF + ycf1 sequence was 88.78%, with 2.33% fuzzy identification rate and 2.8% error identification rate. The data indicated that ndhF and ycf1 were suitable for the identification of Orchids at the level of genus and species, while the combined sequences of matK + ycf1 and ndhF + ycf1 were qualified at the genera and species levels.
Figure 9.
Histogram of frequency of intra-species (black) and inter-species (red) of Orchidaceae based on K2P distance of candidate genes. The X-axis represents the genetic distance, and the Y-axis represents the frequency.
Table 5.
Best Close Match test results based on genetic distance.
| Sequences | Correct | Fuzzy | Error | Did not identify |
|---|---|---|---|---|
| ndhF | 88.65% | 3.45% | 2.50% | 5.48% |
| ycf1 | 89.32% | 3.38% | 6.25% | 1.05% |
| matK + ycf1 | 89.60% | 2.80% | 1.12% | 6.48% |
| ndhF + ycf1 | 88.78% | 2.33% | 2.80% | 6.09% |
Specific barcodes based on SNP sites
Based on SNP sites, species-specific barcodes were developed and the appropriate fragments were blasted into the NCBI database. Based on the ndhF sequence, the specific barcode of species Dendrobium scoriarum was obtained. Knowledge about specific barcodes of species Neuwiedia thelymitra, Spiranthes sinensis and Epiblema cocflorum based on ycf1 sequence was obtained. Based on the combined sequence ndhF + ycf1, the specific barcodes of Liparis loeselii, Cremastraa ppendiculata, Spiranthes siensis and Anathallis obovata were obtained, whereas Liparis loeselii and Cremastra appendiculata had two specific barcodes. Two-Dimensional code can be scanned by electronic equipment from DNA fragments that can be used for species identification. It can provide theoretical support for subsequent researchers. Using the Two-Dimensional code coding method, the species-specific barcode obtained was converted into two-dimensional barcode image, which was conducive to the conversion of barcode information (Figs. 10, 11).
Figure 10.

DNA barcodes and two-dimensional DNA barcodes of Orchidaceae species based on ndhF and ycf1 genes. Base A in green, base T in red, base C in blue, and base G in black.
Figure 11.
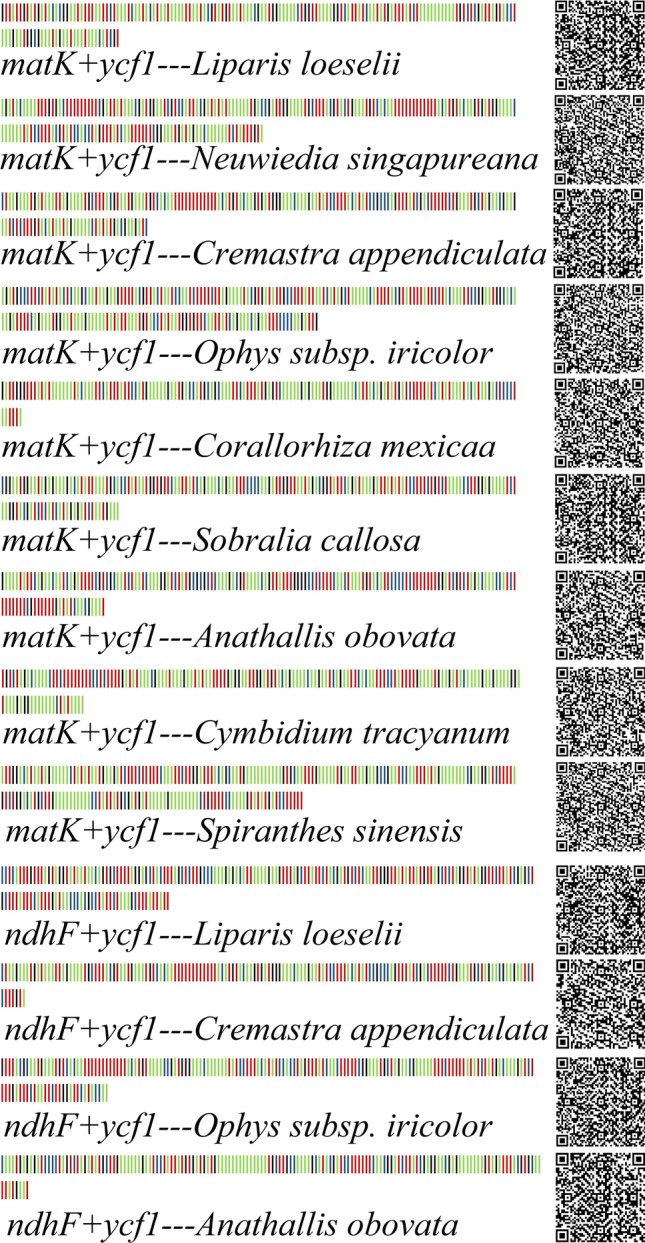
DNA barcodes and two-dimensional DNA barcodes of Orchidaceae species based on matK + ycf1 and ndhF + ycf1 genes. Base A in green, base T in red, base C in blue, and base G in black.
Discussion
DNA barcode is able to be utilized for species identification by means of a DNA fragment that is common to all species. The fragment must simultaneously contain adequate variability to allow for species identification and enough conservative area for the design of universal primers21,23. So far, DNA barcoding have been widely used in many genera of Orchidaceae1,2,7,16. As far as we know, it is the first time that multi-aspect analysis in species identification of Orchidaceae with such a well-rounded species size, based on matK and rbcL regions.
The results of sequences analyses on average GC content showed that the GC content of candidate sequences of Orchids was far less than AT content, while significantly less than the GC content of about 50% in common angiosperms. Of sequence variation situation analysis, the candidate gene mutations exist base insert and missing phenomenon. We performed the analysis of the genetic diversity by the DnasP 5.0 software. The higher haploid type diversity and relatively low haploid type diversity of nucleotide diversity demonstrated that the candidate sequences had certain polymorphisms.
The CBOL recommends matK and rbcL as universal barcodes in plant kingdom23. With the development of science and technology, many subsequent scientists have evaluated the discriminability of different DNA barcoding genes in different families or genera, but the discriminability of a candidate gene in different plants was different.
On the basis of phylogenetic relationship, the Barcoding Gap and the Best Close Match with the genetic distance in evaluating candidate barcode identification capability in Orchid, the phylogenetic analyses showed that the identification ability of matK and rbcL was low on the genus level. The possible reason was that there were more species in this study, which made the species in the related genus unable to form branches alone. The sequences of ndhF and ycf1 were suitable for identification of genus and species of Orchids, and the combined sequences matK + ycf1 and ndhF + ycf1 were qualified at the genera and species levels. The Barcoding Gap test indicated that these candidate genes all contained Barcoding Gap, and the variation between species and within species had clear boundaries. The test results of Best Close Match revealed that the all combined sequences exhibited high genus identification rate, which was suitable for the identification of orchids at the level of genus and species.
Based on the SNP sites, the species level specific DNA barcodes of Orchid were successfully developed. Combinatorial sequences were able to develop more species-specific barcodes than chloroplast genes, which might be the result of combination sequences could provide more mutation sites and SNP sites. There were some differences in the specificities of different combination genes in Orchidaceae plants. Compared with ndhF + ycf1, the combined sequences of matK + ycf1 could be developed more specific barcodes, which might be related to the species identification accuracy of matK + ycf1 in Orchids.
Conclusion
In summary, ndhF, ycf1, matK + ycf1 and ndhF + ycf1 sequences are competent to develop species-specific barcodes to identify Orchidaceae plants at the molecular level. Cluster analysis using the ndhF, ycf1, matK + ycf1 and ndhF + ycf1 sequences in Orchid are nearly consistent with traditional plant morphology. Additionally, this study not only broadens the application of the matK and rbcL sequences in the barcode field, but also provides a novel thought to expand species identification method in a wide range of plant at the species level.
Methods
Nucleotide sequences
For species identification, we retrieved the chloroplast DNA reference sequences including matK, rbcL, ndhF and ycf1 from the NCBI Gene database (https://www.ncbi.nlm.nih.gov/). We obtained the combined sequence including matK + rbcL, matK + ycf1, ndhF + ycf1 by supermat's function in R Phylotools package. After manual screening, the short nucleotide sequences were deleted, and the sequences with different directions were modified manually.
Data analysis
We performed the sequences alignment by the Muscle in the MEGA 7.0 software51 (https://www.megasoftware.net/) with the default alignment parameters for multiple sequences alignment parameters. In the pairwise distances analyses, the positions containing gaps and missing were eliminated from the data set (complete deletion option). Phylogenetic trees constructed with the Neighbor-joining (NJ) method according to Kimura 2-Parameter (K2P) model was assessed by the MEGA 7.09,46,52. The clade reliability in these trees using the NJ methods was tested by bootstrapping, in which 1000 repeated sampling tests were performed to obtain the support values of the clade nodes. Polymorphic site, genetic diversity indices and neutrality tests [Fu’s Fs49 and Tajima’s D50] were performed by the DnaSP v553 (http://www.ub.edu/dnasp/index_v5.html).
Acknowledgements
This research was supported by grants from National Key Research and Development Program (2017YFF0210301), National Natural Science Foundation of China (31872866 and 31540064), Key Research & Development Project of Hunan Provincial Department of Science and Technology (2019NK2081 and 2017SK2182).
Author contributions
G.X. and L.H. designed the research. L.H., X.W. and L.Y. conducted experiments. G.X., L.H., X.W., T.T., L.Y., Z.M., X.L., Z.X., and W.Q. analyzed the data. L.H. and X.W. drafted the manuscript and all authors reviewed and approved the manuscript.
Competing interests
The authors declare no competing interests.
Footnotes
Publisher's note
Springer Nature remains neutral with regard to jurisdictional claims in published maps and institutional affiliations.
These authors contributed equally: Huili Li and Wenjun Xiao.
References
- 1.Chase MW, Cameron KM, Freudenstein JV, Pridgeon AM, André S. An updated classification of Orchidaceae. Bot. J. Linn Soc. 2015;177:151–174. doi: 10.1111/boj.12234. [DOI] [Google Scholar]
- 2.Kim HM, Oh SH, Bhandari GS, Kim CS, Park CW. DNA barcoding of Orchidaceae in Korea. Mol. Ecol. Resour. 2014;14:499–507. doi: 10.1111/1755-0998.12207. [DOI] [PubMed] [Google Scholar]
- 3.Gamarra R, Cela PG, Ortúñez E. Orchidaceae in equatorial guinea (west tropical Africa): Nomenclatural and taxonomic notes, new records and critical taxa. Kew Bull. 2019 doi: 10.1007/s12225-018-9787-9. [DOI] [Google Scholar]
- 4.Atwood JT. The size of the Orchidaceae and the systematic distribution of epiphytic Orchids. Selbyana. 1986;9:171–186. [Google Scholar]
- 5.Arditti J. Fundamentals of Orchid Biology, New York: Wiley; 1992. [Google Scholar]
- 6.Douzery EJP, Pridgeon AM, Kores P, Linder HP, Chase KMW. Molecular phylogenetics of disease (Orchidaceae): A contribution from nuclear ribosomal ITS sequences. Am. J. Bot. 1999;86:887–899. doi: 10.2307/2656709. [DOI] [PubMed] [Google Scholar]
- 7.Feng SG, et al. Molecular identification of Dendrobium species (Orchidaceae) based on the DNA barcode ITS2 region and its application for phylogenetic study. Int. J. Mol. Sci. 2015;16:21975–21988. doi: 10.3390/ijms160921975. [DOI] [PMC free article] [PubMed] [Google Scholar]
- 8.Schuiteman A. Devogelia (Orchidaceae): A new genus from the moluccas and new guinea. Blumea. 2004;49:361–366. doi: 10.3767/000651904X484324. [DOI] [Google Scholar]
- 9.Simo DM, Plunkett GM, Droissart V. New phylogenetic insights toward developing a natural generic classification of African angraecoid Orchids (Vandeae Orchidaceae) Mol. Phylogenet. Evol. 2018;126:241–249. doi: 10.1016/j.ympev.2018.04.021. [DOI] [PubMed] [Google Scholar]
- 10.Pérez G, Rosa M. Orchids: A review of uses in traditional medicine, its phytochemistry and pharmacology. J. Med. Plants Res. 2010;4:592–638. [Google Scholar]
- 11.Jacquemyn H, Merckx V, Brys R. Analysis of network architecture reveals phylogenetic constraints on mycorrhizal specificity in the genus Orchis (Orchidaceae) New Phytol. 2011;192:518–528. doi: 10.1111/j.1469-8137.2011.03796.x. [DOI] [PubMed] [Google Scholar]
- 12.Vij SP, Atwood JT. The size of the Orchidaceae and the systematic distribution of epiphytic Orchids. Selbyana. 1986;9:171–186. [Google Scholar]
- 13.Yoshikawa M, Murakami T, Kishi A. Novel indole S, O-bisdesmoside, calanthoside, the precursor glycoside of tryptanthrin, indirubin, and isatin, with increasing skin blood flow promoting effects, from two Calanthe species (Orchidaceae) Chem. Pharm. Bull. 1998;46:886–888. doi: 10.1248/cpb.46.886. [DOI] [PubMed] [Google Scholar]
- 14.Watanabe K, Tanaka R, Sakurai H. Structure of cymbidine A, a monomeric peptidoglycan-related compound with hypotensive and diuretic activities, isolated from a higher plant, Cymbidium goeringii (Orchidaceae) Chem. Pharm. Bull. 2007;55:780–783. doi: 10.1248/cpb.55.780. [DOI] [PubMed] [Google Scholar]
- 15.Eda K, Budak KB. Detection and quantification of salep with real time PCR utilizing the nr-its2 region. J. Sci. Food Agric. 2019;5:2447–2454. doi: 10.1002/jsfa.9453. [DOI] [PubMed] [Google Scholar]
- 16.Asahina H, Shinozaki J, Masuda K. Identification of medicinal Dendrobium species by phylogenetic analyses using matK and rbcL sequences. J. Nat. Med. 2010;64:133–138. doi: 10.1007/s11418-009-0379-8. [DOI] [PubMed] [Google Scholar]
- 17.De Boer HJ, Ghorbani A, Manzanilla V, Raclariu AC, Kreziou A, Ounjai S. DNA metabarcoding of orchid derived products reveals widespread illegal orchid trade. Proc. R. Soc. Lond. B Biol. Sci. 2017;284:1863. doi: 10.1098/rspb.2017.1182. [DOI] [PMC free article] [PubMed] [Google Scholar]
- 18.Techen N, Parveen I, Pan Z, Khan IA. DNA barcoding of medicinal plant material for identifcation. Curr. Opin. Biotech. 2014;25:103–110. doi: 10.1016/j.copbio.2013.09.010. [DOI] [PubMed] [Google Scholar]
- 19.Devos N, Oh SH, Raspe O, Jacquemart AL, Manos PS. Nuclear ribosomal DNA sequence variation and evolution of spotted marsh Orchids (Dactylorhiza maculata group) Mol. Phylogenet. Evol. 2005;36:568–580. doi: 10.1016/j.ympev.2005.04.014. [DOI] [PubMed] [Google Scholar]
- 20.Zhang GQ, Liu KW, Li Z, Lohaus R, Hsiao YY. The Apostasia genome and the evolution of orchids. Nature. 2017;549:379–383. doi: 10.1038/nature23897. [DOI] [PMC free article] [PubMed] [Google Scholar]
- 21.Hebert P, Gregory TR. The promise of DNA barcoding for taxonomy. Syst. Bot. 2005;54:852–859. doi: 10.1080/10635150500354886. [DOI] [PubMed] [Google Scholar]
- 22.Coissac E, Hollingsworth PM, Lavergne S. From barcodes to genomes: Extending the concept of DNA barcoding. Mol. Ecol. 2016;25:423–1428. doi: 10.1111/mec.13549. [DOI] [PubMed] [Google Scholar]
- 23.CBOL Plant Working Group A DNA barcode for land plants. Proc. Natl. Acad. Sci. U. S. A. 2009;106:12794–12797. doi: 10.1073/pnas.0905845106. [DOI] [PMC free article] [PubMed] [Google Scholar]
- 24.Cameron KM, Chase MW, Whitten WM. A phylogenetic analysis of the Orchidaceae: evidence from rbcL nucleotide sequences. Am. J. Bot. 1999;86:208–224. doi: 10.2307/2656938. [DOI] [PubMed] [Google Scholar]
- 25.Lahaye R, Van der, Bank, M., Bogarin, D., Warner, J., Pupulin, F. DNA barcoding the floras of biodiversity hotspots. Proc. Natl. Acad. Sci. U. S. A. 2008;105:2923–2928. doi: 10.1073/pnas.0709936105. [DOI] [PMC free article] [PubMed] [Google Scholar]
- 26.Ma HL, Zhu ZB, Zhang XM. Species identification of the medicinal plant Tulipa edulis (Liliaceae) by DNA barcode marker. Biochem. Syst. Ecol. 2014;55:362–368. doi: 10.1016/j.bse.2014.03.038. [DOI] [Google Scholar]
- 27.Xu S, et al. Evaluation of the DNA barcodes in Dendrobium (Orchidaceae) from mainland Asia. PLoS ONE. 2015;10:e0115168. doi: 10.1371/journal.pone.0115168. [DOI] [PMC free article] [PubMed] [Google Scholar]
- 28.Hebert PDN, Ratnasingham S, De WJR. Barcoding animal life: Cytochrome c oxidase subunit 1 divergences among closely related species. Proc. R. Soc. Lond. B Biol. Sci. 2003;270:S96–S99. doi: 10.1098/rsbl.2003.0025. [DOI] [PMC free article] [PubMed] [Google Scholar]
- 29.Hebert PDN, Stoeckle MY, Zemlak TS, Francis CM. Identification of birds through DNA barcodes. PLoS Biol. 2004;2:e312. doi: 10.1371/journal.pbio.0020312. [DOI] [PMC free article] [PubMed] [Google Scholar]
- 30.Salazar GA, Chase MW, Ingrouille AM. Phylogenetics of Cranichideae with emphasis on Spiranthinae (Orchidaceae, Orchidoideae): Evidence from plastid and nuclear DNA sequences. Am. J. Bot. 2003;90:777–795. doi: 10.3732/ajb.90.5.777. [DOI] [PubMed] [Google Scholar]
- 31.Kress WJ. Use of DNA barcodes to identify flowering plants. Proc. Natl. Acad. Sci. U. S. A. 2005;102:8369–8374. doi: 10.1073/pnas.0503123102. [DOI] [PMC free article] [PubMed] [Google Scholar]
- 32.Goldman DH, Freudenstein JV, Kores PJ. Phylogenetics of Arethuseae (Orchidaceae) based on plastid matK and rbcL sequences. Syst. Bot. 2001;37:670–695. [Google Scholar]
- 33.Kores PJ, Molvray M, Weston PH, Hopper SD, Brown AP, Chase CMW. A phylogenetic analysis of Diurideae (Orchidaceae) based on plastid DNA sequence data. Am. J. Bot. 2001;88:1903–2191. doi: 10.2307/3558366. [DOI] [PubMed] [Google Scholar]
- 34.Kocyan A, Qiu YL, Endress PK, Conti E. A phylogenetic analysis of Apostasioideae (Orchidaceae) based on ITS, trnL-F and matK sequences. Plant Syst. Evol. 2004;247:203–213. doi: 10.1007/s00606-004-0133-3. [DOI] [Google Scholar]
- 35.Lahaye R, Van der Bank M, Bogarin D, Warner J, Pupulin F. DNA barcoding the floras of biodiversity hotspots. Proc. Natl. Acad. Sci. U. S. A. 2008;105:2923–2928. doi: 10.1073/pnas.0709936105. [DOI] [PMC free article] [PubMed] [Google Scholar]
- 36.Farrington L, MacGillivray P, Faast R, Austin A. Investigating DNA barcoding options for the identification of Caladenia (Orchidaceae) species. Aust. J. Bot. 2009;57:276–286. doi: 10.1071/BT08138. [DOI] [Google Scholar]
- 37.Pang X, Song J, Zhu Y, Xie C, Chen S. Using DNA barcoding to identify species within Euphorbiaceae. Planta Med. 2010;76:1784–1786. doi: 10.1055/s-0030-1249806. [DOI] [PubMed] [Google Scholar]
- 38.Sui XY, Huang Y, Tan Y, Guo Y, Long CL. Molecular authentication of the ethnomedicinal plant Sabia parviflora and its adulterants by DNA barcoding technique. Planta Med. 2011;77:492–496. doi: 10.1055/s-0030-1250468. [DOI] [PubMed] [Google Scholar]
- 39.Guo X, Wang X, Su W, Zhang G, Zhou R. DNA barcodes for discriminating the medicinal plant Scutellaria baicalensis (Lamiaceae) and its adulterants. Biol. Pharm. Bull. 2011;34:1198–1203. doi: 10.1248/bpb.34.1198. [DOI] [PubMed] [Google Scholar]
- 40.Do HDK, et al. The newly developed single nucleotide polymorphism (SNP) markers for a potentially medicinal plant, Crepidiastrum denticulatum (Asteraceae), inferred from complete chloroplast genome data. Mol. Biol. Rep. 2019;46:3287–3297. doi: 10.1007/s11033-019-04789-5. [DOI] [PubMed] [Google Scholar]
- 41.Jaén MR, Marrero RA, Reyes BJA, Santos GA, Naranjo SJ, Caujapé CJ. Molecular taxonomic identification in the absence of a ‘barcoding gap’: A test with the endemic flora of the canarian oceanic hotspot. Mol. Ecol. Resour. 2015;15:42–56. doi: 10.1111/1755-0998.12292. [DOI] [PubMed] [Google Scholar]
- 42.Chen JY, Zhang J, Zhang DC. DNA barcoding of 21 rare and protected medicinal plants in Guangdong Province. Chin. Med. Clin. Pharma. 2019;30:979–984. [Google Scholar]
- 43.Zhang W, Fan XH, Zhu SF. Species-specific identification from incomplete sampling: Applying DNA barcodes to monitoring invasive Solanum plants. PLoS ONE. 2013;8:e55927. doi: 10.1371/journal.pone.0055927. [DOI] [PMC free article] [PubMed] [Google Scholar]
- 44.Batista JAN, Mota ACM, Proite K, Bianchetti LDB, Gustavo A, Romerogonzalez HH. Molecular phylogenetics of neotropical cyanaeorchis (Cymbidieae, Epidendroideae, Orchidaceae): Geographical rather than morphological similarities plus a new species. Phytotaxa. 2014;56:251–272. doi: 10.11646/phytotaxa.156.5.1. [DOI] [Google Scholar]
- 45.Jin WT, et al. Molecular systematics of subtribe Orchidinae and Asian taxa of Habenariinae (Orchideae, Orchidaceae) based on plastid matK, rbcL and nuclear ITS. Mol. Phylogenet. Evol. 2014;77:41–53. doi: 10.1016/j.ympev.2014.04.004. [DOI] [PubMed] [Google Scholar]
- 46.Jin, W. T., Schuiteman, A., Chase, M. W., Li, J. W., Chung, S. W., Hsu, T. C. Phylogenetics of subtribe Orchidinae s.l. (Orchidaceae; Orchidoideae) based on seven markers (plastid matK, psab, rbcL, trnL-F, trnH-psbA, and nuclear nrITS, xdh): Implications for generic delimitation. BMC Plant Biol.17, 222 (2017). [DOI] [PMC free article] [PubMed]
- 47.Verlynde S, et al. Molecular phylogeny of the genus Bolusiella (Orchidaceae, Angraecinae) Plant Syst. Evol. 2018;304:269–279. doi: 10.1007/s00606-017-1474-z. [DOI] [Google Scholar]
- 48.Chen SP, et al. Molecular systematics of Goodyerinae (Cranichideae, Orchidoideae, Orchidaceae) based on multiple nuclear and plastid regions. Mol. Phylogenet. Evol. 2019;20:106542. doi: 10.1016/j.ympev.2019.106542. [DOI] [PubMed] [Google Scholar]
- 49.Fu YX. Statistical tests of neutrality of mutations against population growth, hitchhiking and background selection. Genetics. 1997;147:915–925. doi: 10.1093/genetics/147.2.915. [DOI] [PMC free article] [PubMed] [Google Scholar]
- 50.Tajima F. Statistical method for testing the neutral mutation hypothesis by DNA polymorphism. Genetics. 1989;123:585–595. doi: 10.1093/genetics/123.3.585. [DOI] [PMC free article] [PubMed] [Google Scholar]
- 51.Kumar S, Stecher G, Tamura K. MEGA7: Molecular evolutionary genetics analysis Version 7.0 for bigger datasets. Mol. Biol. Evol. 2016;33:1870–1874. doi: 10.1093/molbev/msw054. [DOI] [PMC free article] [PubMed] [Google Scholar]
- 52.Yang LE, Zhou W, Hu CM. A molecular phylogeny of the bladed Bangiales (Rhodophyta) in China provides insights into biodiversity and biogeography of the genus, Pyropia. Mol. Phylogenet. Evol. 2018;120:94–102. doi: 10.1016/j.ympev.2017.11.009. [DOI] [PubMed] [Google Scholar]
- 53.Librado P, Rozas J. DnaSP v5: A software for comprehensive analysis of DNA polymorphism data. Bioinform. 2009;25:1451–1452. doi: 10.1093/bioinformatics/btp187. [DOI] [PubMed] [Google Scholar]


