

Abstract
Background
Cancer is the second leading cause of death in the United States (US). The goal of this study was to characterize the trends in cancer incidence and mortality in the US from 1975 to 2016.
Methods
In this study, we analyzed 4,711,958 cancer cases and 21,489,462 cancer death cases from the Surveillance, Epidemiology and End Results (SEER) database. Cancer incidence and mortality were assessed according to sex, race, and age group. Cancer survival rates between 2010 and 2016 were also examined.
Results
The continuous decline in the overall cancer mortality rate from the early 1990s has resulted in overall decreases of 33.6% and 23.6% in the cancer mortality rates of males and females, respectively. In males, the top three leading cancers and causes of cancer death from 1975 to 2016 were prostate, lung and bronchial, and colon and rectal cancers, while in females, the top three leading cancers and causes of cancer death from 1979 to 2016 were breast, lung and bronchial, and colon and rectal cancers. The 5-year relative survival rates of males and females for all cancers combined, diagnosed from 2010–2016, were 68.5% and 70.1%, respectively. The overall cancer incidence and mortality were higher in males than females from 1975–2016. Also, black people had higher mortality and shorter survival rates for all cancers combined compared with white people (in both sexes).
Conclusions
This study presents a comprehensive overview of cancer incidence and mortality in the US over the past 42 years. Such information can provide a scientific basis for cancer prevention and control.
Keywords: Cancer incidence, cancer mortality, cancer survival rates, lung cancer, breast cancer, prostate cancer
Introduction
Cancer is the second leading cause of death after heart disease in the United States (US) (1,2). In 2019, it was estimated that there were 1,762,450 new cancer cases and 606,880 cancer deaths in the US (2). Considerable progress in the prevention, detection, diagnosis, and treatment of cancer has been achieved over the past four decades. An understanding of the trends in cancer incidence and mortality rates is critical for continued advancement. However, few studies have systematically documented these changes (1-3). In this article, we analysed age-adjusted cancer incidence and mortality rates between 1975 and 2016 in the US. In addition, we also analysed cancer survival rates between 2010 and 2016. This information will provide valuable insights into cancer prevention and control at the national level.
We present the following article in accordance with the STROBE reporting checklist (available at http://dx.doi.org/10.21037/atm-20-7481).
Methods
Cancer incidence, mortality, and survival data
The Surveillance, Epidemiology and End Results (SEER) database is an open-access resource for cancer-based epidemiology and survival analyses. Cancer incidence and survival data were obtained from the SEER database of Incidence-SEER 9 Regs Research Data, November 2018 Sub [1975–2016] <Katrina/Rita Population Adjustment>. A total of 4,711,958 cancer cases spanning 1975–2016 are registered within the nine oldest SEER areas (Connecticut, Hawaii, Iowa, New Mexico, Utah, and the metropolitan areas of Atlanta, Detroit, San Francisco-Oakland and Seattle-Puget Sound), representing approximately 9% of the US population.
The US mortality data, collected and maintained by the National Centre for Health Statistics (NCHS), can be analysed using the SEER*Stat software. The NCHS granted the SEER program limited permission to provide mortality data to the public. Cancer mortality data were collected from the SEER database of Mortality-All cause of death (COD), Aggregated Total US [1969–2016] <Katrina/Rita Population Adjustment>. The underlying mortality data were provided by the NCHS (www.cdc.gov/nchs). A total of 21,489,462 cancer death cases spanning 1975–2016 are registered in this database.
All cancer cases were classified according to the Site Recode ICD-O-3/World Health Organization (WHO) 2008 (2).
Ethical approval for this study was exempted by the Medical Ethics Committee of the First Affiliated Hospital, College of Medicine, Zhejiang University (Hangzhou, China), as SEER is a publicly available database, and the data extracted from SEER were identified as belonging to a non-human study. All patient data were anonymized.
Statistical analysis
All cancer incidence and mortality rates and 95% confidence intervals (CI) were age-adjusted using the 2000 US standard population and expressed per 100,000 person-years (2,4). Annual rates are shown graphically as trends. Temporal trends in cancer incidence and mortality rates were examined, and separate analyses were conducted for males and females. We also calculated the age-adjusted cancer incidence and mortality rates according to race/ethnicity (white, black, other) and age group (birth–39, 40–49, 50–59, 60–69, and ≥70 years) (5,6). Cancer survival rates between 2010 and 2016 were also examined according to sex and race/ethnic group. All data analyses were performed using SEER*Stat software version 8.3.5 (2,4).
Results
Trends in cancer incidence
The age-adjusted incidence rate and percentage changes from 1975–2016 of the 20 leading cancers by sex in the US in 2016 are shown in Table 1. The overall cancer incidence rate in males decreased by 28.7%, from a maximal peak of 658.4 (per 100,000 population) in 1992 to 469.2 (per 100,000 population) in 2016, and this decline continues to date. In females, this number has been relatively stable since its maximal peak of 434.3 (per 100,000 population) in 1998 to 411.5 (per 100,000 population) in 2016 (Figure 1). From 1975–2016, the overall cancer incidence was higher for males than females (Figure 1). In males, the overall cancer incidence reached a distinct peak in 1992, mainly due to prostate cancer (Figure 1). The top five malignant cancers in males in 2016 were prostate, lung and bronchial, colon and rectal, and urinary bladder cancers, as well as melanoma of the skin (Table 1; Figure 2A). Similarly, the top five malignant cancers in females in 2016 were breast, lung and bronchial, colon and rectal, corpus and uterus, and thyroid cancers (Table 1; Figure 2B).
Table 1. Incidence rate changes from 1975–2016 of the 20 leading cancers by sex in the United States.
| Cancer | Incidence rank | Age-adjusted incidence rate (95% CI) | Incidence count | Relative change in incidence (2016 vs. 1975) | Relative change in incidence (2016 vs. 2000) | ||||||||
|---|---|---|---|---|---|---|---|---|---|---|---|---|---|
| 1975 | 2000 | 2016 | 1975 | 2000 | 2016 | 1975 | 2000 | 2016 | |||||
| Male | |||||||||||||
| All malignant cancers | 466.8 (461.5–472.2) | 581.1 (576.5–585.7) | 469.2 (465.8–472.6) | 33,059 | 64,015 | 75,836 | 0.5% | −19.3% | |||||
| Prostate | 1 | 1 | 1 | 94.0 (91.5–96.6) | 183.3 (180.8–185.9) | 108.4 (106.8–110.0) | 5,802 | 19,945 | 18,713 | 15.3% | −40.9% | ||
| Lung and bronchus | 2 | 2 | 2 | 89.5 (87.3–91.8) | 82.1 (80.4–83.9) | 57.0 (55.8–58.3) | 6,738 | 8,862 | 8,962 | −36.3% | −30.6% | ||
| Colon and rectum | 3 | 3 | 3 | 68.4 (66.4–70.6) | 63.7 (62.2–65.3) | 42.5 (41.4–43.5) | 4,639 | 6,844 | 6,772 | −37.9% | −33.3% | ||
| Urinary bladder | 4 | 4 | 4 | 34.4 (32.9–35.9) | 38.8 (37.6–40.0) | 33.5 (32.6–34.5) | 2,319 | 4,095 | 5,101 | −2.6% | −13.7% | ||
| Melanoma of the skin | 11 | 6 | 5 | 8.5 (7.9–9.2) | 24.0 (23.1–24.9) | 32.0 (31.1–32.9) | 690 | 2,783 | 5,056 | 276.5% | 33.3% | ||
| Lymphoma | 7 | 5 | 6 | 16.8 (15.8–17.7) | 27.6 (26.7–28.6) | 26.4 (25.6–27.2) | 1,363 | 3,191 | 4,121 | 57.1% | −4.3% | ||
| Kidney and renal pelvis | 9 | 8 | 7 | 10.3 (9.6–11.1) | 17.5 (16.8–18.3) | 21.2 (20.5–22.0) | 791 | 1,984 | 3,459 | 105.8% | 21.1% | ||
| Leukaemia | 6 | 7 | 8 | 16.9 (15.9–18.0) | 17.9 (17.2–18.8) | 17.9 (17.2–18.6) | 1,210 | 1,995 | 2,782 | 5.9% | 0.0% | ||
| Pancreas | 8 | 9 | 9 | 15.6 (14.7–16.6) | 13.3 (12.6–14.0) | 14.3 (13.7–14.9) | 1,085 | 1,444 | 2,269 | −8.3% | 7.5% | ||
| Liver | 16 | 14 | 10 | 3.7 (3.2–4.2) | 7.3 (6.8–7.8) | 11.4 (10.9–11.9) | 275 | 840 | 2,003 | 208.1% | 56.2% | ||
| Myeloma | 14 | 13 | 11 | 6.4 (5.8–7.1) | 7.7 (7.1–8.2) | 8.6 (8.2–9.1) | 448 | 832 | 1,369 | 34.4% | 11.7% | ||
| Stomach | 5 | 10 | 12 | 17.1 (16.1–18.2) | 11.7 (11.1–12.4) | 8.5 (8.1–9.0) | 1,156 | 1,253 | 1,334 | −50.3% | −27.4% | ||
| Thyroid | 19 | 17 | 13 | 3.1 (2.7–3.5) | 4.0 (3.7–4.4) | 7.5 (7.1–8.0) | 262 | 505 | 1,200 | 141.9% | 87.5% | ||
| Brain and other nervous system | 12 | 11 | 14 | 6.8 (6.3–7.4) | 8.2 (7.7–8.8) | 7.4 (6.9–7.8) | 603 | 991 | 1,165 | 8.8% | −9.8% | ||
| Oesophagus | 12 | 12 | 14 | 6.8 (6.2–7.4) | 8.0 (7.5–8.5) | 7.4 (7.0–7.8) | 512 | 893 | 1,210 | 8.8% | −7.5% | ||
| Testis | 16 | 16 | 16 | 3.7 (3.3–4.1) | 5.7 (5.4–6.2) | 6.2 (5.8–6.6) | 363 | 794 | 921 | 67.6% | 8.8% | ||
| Tongue | 18 | 18 | 17 | 3.4 (3.0–3.8) | 3.8 (3.4–4.1) | 5.6 (5.2–6.0) | 265 | 451 | 970 | 64.7% | 47.4% | ||
| Larynx | 10 | 14 | 18 | 9.5 (8.8–10.2) | 7.3 (6.8–7.8) | 4.7 (4.3–5.0) | 755 | 826 | 768 | −50.5% | −35.6% | ||
| Soft tissue including heart | 20 | 19 | 19 | 2.7 (2.3–3.1) | 3.6 (3.3–4.0) | 4.2 (3.9–4.6) | 221 | 430 | 649 | 55.6% | 16.7% | ||
| Tonsil | 24 | 20 | 20 | 1.7 (1.4–2.1) | 2.3 (2.0–2.6) | 3.4 (3.1–3.7) | 135 | 280 | 599 | 100.0% | 47.8% | ||
| Female | |||||||||||||
| All malignant cancers | 365.9 (362.0–369.8) | 422.7 (419.3–426.1) | 411.5 (408.4–414.5) | 34,302 | 59,432 | 75,473 | 12.5% | −2.6% | |||||
| Breast | 1 | 1 | 1 | 105.1 (103.0–107.2) | 136.6 (134.7–138.6) | 129.8 (128.1–131.5) | 9,657 | 18,970 | 23,596 | 23.5% | −5.0% | ||
| Lung and bronchus | 4 | 2 | 2 | 24.5 (23.5–25.5) | 51.2 (50.0–52.4) | 45.1 (44.1–46.1) | 2,349 | 7,170 | 8,616 | 84.1% | −11.9% | ||
| Colon and rectum | 2 | 3 | 3 | 53.7 (52.2–55.2) | 46.8 (45.7–47.9) | 33.2 (32.4–34.1) | 4,962 | 6,776 | 6,157 | −38.2% | −29.1% | ||
| Corpus and uterus | 3 | 4 | 4 | 35.5 (34.3–36.7) | 24.8 (24.0–25.7) | 27.9 (27.1–28.7) | 3,493 | 3,436 | 5,372 | −21.4% | 12.5% | ||
| Thyroid | 13 | 8 | 5 | 6.5 (5.9–7.0) | 11.1 (10.6–11.7) | 21.3 (20.6–22.0) | 617 | 1,531 | 3,453 | 227.7% | 91.9% | ||
| Melanoma of the skin | 12 | 6 | 6 | 7.4 (6.9–8.0) | 15.5 (14.9–16.2) | 20.5 (19.8–21.2) | 700 | 2,159 | 3,617 | 177.0% | 32.3% | ||
| Lymphoma | 7 | 5 | 7 | 12.0 (11.3–12.7) | 18.5 (17.8–19.2) | 18.2 (17.6–18.9) | 1,161 | 2,618 | 3,325 | 51.7% | −1.6% | ||
| Pancreas | 9 | 10 | 8 | 9.1 (8.5–9.8) | 9.8 (9.3–10.4) | 11.6 (11.2–12.2) | 849 | 1,423 | 2,247 | 27.5% | 18.4% | ||
| Leukaemia | 8 | 9 | 9 | 10.0 (9.3–10.6) | 10.7 (10.2–11.3) | 10.4 (9.9–10.9) | 940 | 1,527 | 1,871 | 4.0% | −2.8% | ||
| Kidney and renal pelvis | 15 | 12 | 9 | 4.5 (4.1–5.0) | 8.5 (8.1–9.0) | 10.4 (9.9–10.9) | 430 | 1,195 | 1,915 | 131.1% | 22.4% | ||
| Ovary | 5 | 7 | 11 | 16.3 (15.5–17.2) | 14.4 (13.7–15.0) | 10.1 (9.7–10.6) | 1,537 | 2,003 | 1,851 | −38.0% | −29.9% | ||
| Urinary bladder | 10 | 11 | 12 | 8.9 (8.3–9.5) | 9.6 (9.1–10.1) | 8.3 (7.9–8.7) | 824 | 1,383 | 1,587 | −6.7% | −13.5% | ||
| Cervix uteri | 6 | 13 | 13 | 14.8 (14.0–15.6) | 7.7 (7.3–8.2) | 6.4 (6.0–6.8) | 1,364 | 1,073 | 1,029 | −56.8% | −16.9% | ||
| Myeloma | 16 | 16 | 14 | 3.9 (3.5–4.3) | 5.0 (4.7–5.4) | 5.7 (5.3–6.0) | 361 | 719 | 1,080 | 46.2% | 14.0% | ||
| Stomach | 11 | 15 | 15 | 7.8 (7.3–8.4) | 5.4 (5.0–5.8) | 5.0 (4.7–5.4) | 715 | 790 | 933 | −35.9% | −7.4% | ||
| Brain and other nervous system | 14 | 14 | 15 | 5.0 (4.6–5.5) | 5.7 (5.3–6.1) | 5.0 (4.7–5.3) | 499 | 784 | 863 | 0.0% | −12.3% | ||
| Liver | 22 | 18 | 17 | 1.5 (1.3–1.8) | 2.5 (2.2–2.8) | 3.4 (3.1–3.7) | 141 | 355 | 664 | 126.7% | 36.0% | ||
| Soft tissue including heart | 20 | 17 | 18 | 1.8 (1.6–2.1) | 2.6 (2.3–2.8) | 2.9 (2.6–3.1) | 176 | 353 | 491 | 61.1% | 11.5% | ||
| Vulva | 18 | 19 | 19 | 2.1 (1.8–2.4) | 2.3 (2.0–2.5) | 2.5 (2.2–2.7) | 197 | 324 | 464 | 19.0% | 8.7% | ||
| Tongue | 25 | 21 | 20 | 1.2 (1.0–1.4) | 1.5 (1.3–1.7) | 2.2 (2.0–2.4) | 115 | 212 | 414 | 83.3% | 46.7% | ||
| Small intestine | 27 | 24 | 20 | 0.9 (0.8–1.2) | 1.4 (1.2–1.6) | 2.2 (2.0–2.5) | 89 | 192 | 414 | 144.4% | 57.1% | ||
Rank is based on age-adjusted incidence rate. Age-adjusted incidence rates are per 100,000 population and age-adjusted to the 2000 United States standard population. Incidence count is the number of cancer occurrences. CI, confidence interval.
Figure 1.
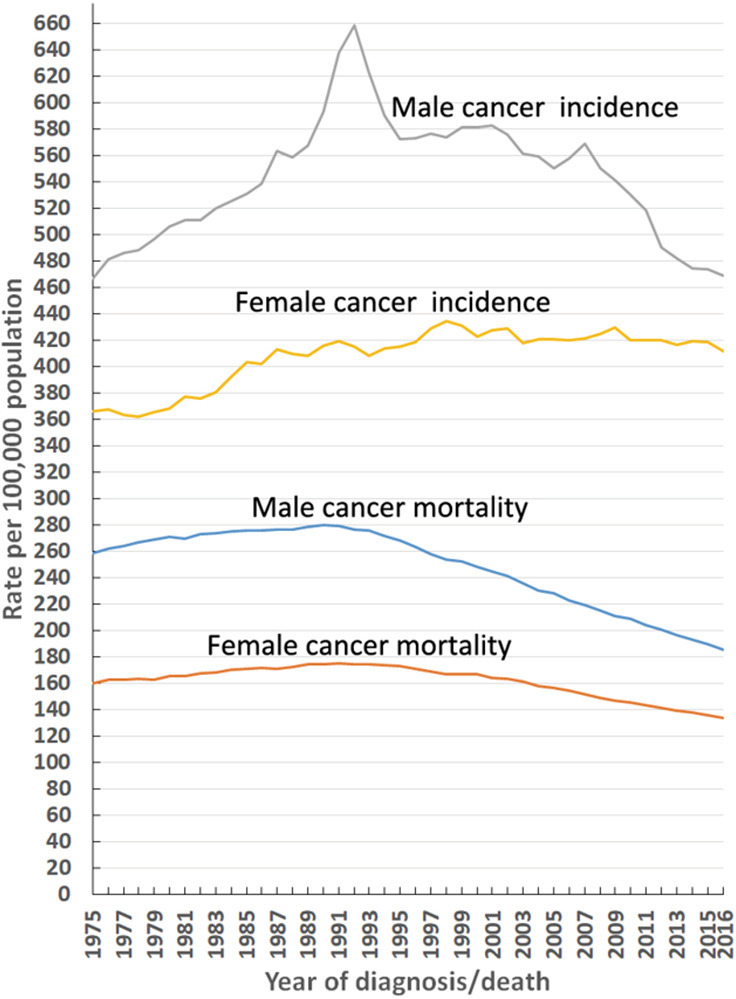
Trends in overall cancer incidence and mortality rates by sex in the United States [1975–2016]. Rates are age-adjusted to the 2000 United States standard population.
Figure 2.
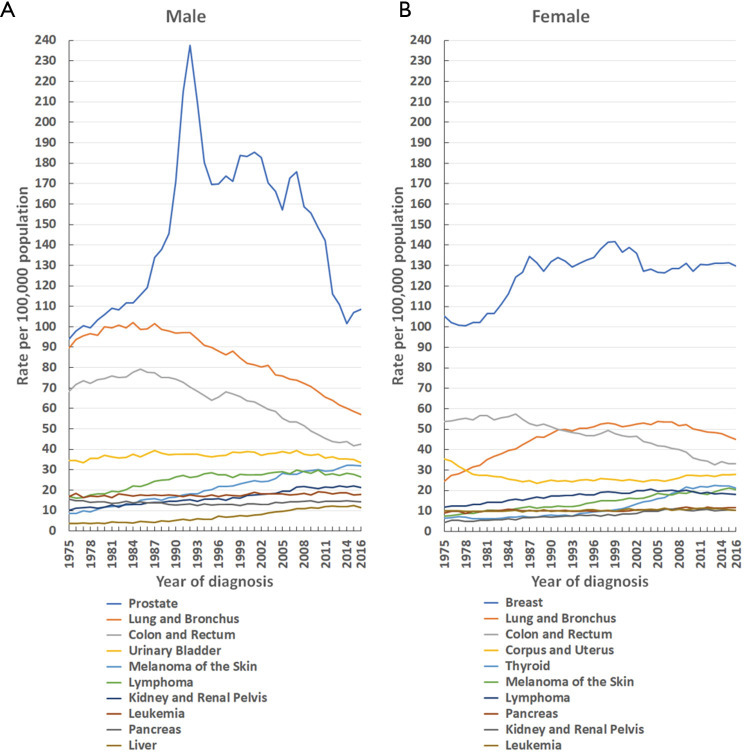
Trends in the incidence rate of the 10 leading cancers by sex in the United States [1975–2016]. Rates are age-adjusted to the 2000 United States standard population. (A) Male; (B) female.
From 1975–2016 (for males) and 1979–2016 (for females), the top three leading malignancies were prostate (men), breast (women), lung and bronchial, and colon and rectal cancers (Figure 2). From 1975–2016, prostate and breast cancers were the main cancers in males and females, respectively (Figure 2). The incidence rate of prostate cancer (per 100,000 population) increased from 94.0 in 1975 to a maximal peak of 237.5 in 1992, and then declined to 108.4 in 2016 (Figure 2A). Similarly, the incidence rate (per 100,000 population) for breast cancer in females increased from 105.1 in 1975 to a maximal peak of 141.6 in 1999, and subsequently decreased to 126.5 in 2016 (Figure 2B).
Lung and bronchial cancers remained the second leading cancer in males from 1975 to 2016, and in females from 1992 to 2016, respectively. The incidence rate (per 100,000 population) of lung and bronchial cancers in males declined by 44.1%, from a maximal peak of 102.0 in 1984 to 57.0 in 2016 (Figure 2A). However, in females, it declined gradually after reaching a maximal peak of 53.8 in 2005, falling to 45.1 in 2016 (Figure 2B).
The incidence rate of the third leading cancer (colon and rectal) decreased in both males and females (Figure 2). In males, the incidence rate (per 100,000 population) for colon and rectal cancer decreased by 46.3%, from a maximal peak of 79.2 in 1985 to 42.5 in 2016, while in females, the incidence rate fell by 42.1%, from a maximal peak of 57.3 in 1985 to 33.2 in 2016 (Figure 2).
The changes in the age-adjusted incidence rate of different races and ethnicities from 1975–2016 were also analysed (Tables S1 and S2; Figures S1-S3). The overall cancer incidence rate was higher in black males compared to white males from 1975 to 2016, but exhibited the opposite trend in females over the same time period (Figure S1). The changes in the age-adjusted incidence rate of different age groups from 1975–2016 were also examined (Tables S3-S7; Figures S4 and S5).
Trends in cancer mortality
Age-adjusted mortality and percentage changes from 1975–2016 of the 20 leading causes of cancer death by sex in the US in 2016 are shown in Table 2. In males, the overall cancer mortality rate fell by 33.6%, from a maximal peak of 279.8 (per 100,000 population) in 1990 to 185.9 (per 100,000 population) in 2016. Similarly, this rate also decreased in females by 23.6%, from a maximal peak of 175.3 (per 100,000 population) in 1991 to 134.0 (per 100,000 population) in 2016 (Figure 1). Moreover, this downward trend continues to date, irrespective of sex. From 1975–2016, the overall cancer mortality rate was higher in males than females (Figure 1). In 2016, malignant cancers of the lung and bronchus, prostate, colon and rectum, and pancreas, as well as leukaemia were the five leading causes of cancer death in males (Figure 3A; Table 2), while in females, the same trend occurred, except that prostate cancer and leukaemia were replaced by breast and ovarian cancers, respectively (Figure 3B; Table 2).
Table 2. Mortality rate changes from 1975–2016 of the 20 leading causes of cancer death by sex in the United States.
| All causes | Mortality rank | Age−adjusted mortality rate (95% CI) | Death count | Relative change in mortality (2016 vs. 1975) |
Relative change in mortality (2016 vs. 2000) |
||||||||
|---|---|---|---|---|---|---|---|---|---|---|---|---|---|
| 1975 | 2000 | 2016 | 1975 | 2000 | 2016 | 1975 | 2000 | 2016 | |||||
| Male | |||||||||||||
| All malignant cancers | 258.4 (257.2–259.6) | 248.5 (247.5–249.4) | 185.9 (185.2–186.6) | 198,586 | 286,072 | 314,568 | −28.1% | −25.2% | |||||
| Lung and bronchus | 1 | 1 | 1 | 76.4 (75.8–77.0) | 76.5 (76.0–77.0) | 46.9 (46.6–47.3) | 63,297 | 90,410 | 80,775 | −38.6% | −38.7% | ||
| Prostate | 3 | 2 | 2 | 31.0 (30.5–31.4) | 30.4 (30.1–30.7) | 19.4 (19.2–19.6) | 19,426 | 31,078 | 30,370 | −37.4% | −36.2% | ||
| Colon and rectum | 2 | 3 | 3 | 32.8 (32.4–33.3) | 25.1 (24.8–25.4) | 16.3 (16.1–16.5) | 23,819 | 28,484 | 27,642 | −50.3% | −35.1% | ||
| Pancreas | 4 | 4 | 4 | 13.8 (13.5–14.1) | 12.1 (11.9–12.3) | 12.7 (12.5–12.8) | 10,606 | 14,237 | 21,899 | −8.0% | 5.0% | ||
| Leukaemia | 6 | 6 | 5 | 11.0 (10.7–11.2) | 10.3 (10.1–10.5) | 8.3 (8.1–8.4) | 8,382 | 11,803 | 13,360 | −24.5% | −19.4% | ||
| Liver | 12 | 11 | 6 | 3.7 (3.6–3.8) | 5.7 (5.5–5.8) | 7.7 (7.6 –7.9) | 2,917 | 6,843 | 14,458 | 108.1% | 35.1% | ||
| Urinary bladder | 7 | 8 | 7 | 9.8 (9.5–10.0) | 7.6 (7.4–7.8) | 7.5 (7.4–7.7) | 6,604 | 8,163 | 11,941 | −23.5% | −1.3% | ||
| Lymphoma | 8 | 5 | 8 | 8.6 (8.4–8.8) | 10.8 (10.6–10.9) | 7.3 (7.1–7.4) | 7,082 | 12,498 | 11,879 | −15.1% | −32.4% | ||
| Oesophagus | 9 | 7 | 9 | 6.4 (6.2–6.5) | 7.7 (7.5–7.9) | 7.0 (6.8–7.1) | 5,196 | 9,279 | 12,317 | 9.4% | −9.1% | ||
| Brain and other nervous system | 11 | 12 | 10 | 5.0 (4.8–5.1) | 5.6 (5.4–5.7) | 5.5 (5.4–5.6) | 4,543 | 7,011 | 9,510 | 10.0% | −1.8% | ||
| Kidney and renal pelvis | 10 | 10 | 11 | 5.2 (5.0–5.3) | 6.1 (6.0–6.3) | 5.2 (5.1–5.4) | 4,199 | 7,249 | 8,996 | 0.0% | −14.8% | ||
| Myeloma | 12 | 13 | 12 | 3.7 (3.6–3.8) | 4.7 (4.5–4.8) | 4.1 (4.0–4.2) | 2,830 | 5,321 | 6,734 | 10.8% | −12.8% | ||
| Stomach | 5 | 9 | 13 | 12.3 (12.0–12.5) | 6.4 (6.2–6.5) | 4.0 (3.9–4.1) | 8,954 | 7,328 | 6,845 | −67.5% | −37.5% | ||
| Melanoma of the skin | 15 | 14 | 14 | 2.6 (2.5–2.8) | 3.8 (3.7–3.9) | 3.2 (3.2–3.3) | 2,193 | 4,592 | 5,425 | 23.1% | −15.8% | ||
| Intrahepatic bile duct | 41 | 18 | 15 | 0.1 (0.1–0.2) | 1.1 (1.1–1.2) | 2.0 (1.9–2.0) | 117 | 1,333 | 3,385 | 1900.0% | 81.8% | ||
| Non-melanoma skin | 17 | 17 | 16 | 1.3 (1.2–1.4) | 1.4 (1.4–1.5) | 1.8 (1.7–1.8) | 868 | 1,597 | 2,871 | 38.5% | 28.6% | ||
| Larynx | 14 | 15 | 17 | 3.3 (3.2–3.5) | 2.5 (2.5–2.6) | 1.7 (1.6–1.8) | 2,739 | 3,041 | 3,048 | −48.5% | −32.0% | ||
| Soft tissue including heart | 20 | 16 | 18 | 1.0 (0.9–1.1) | 1.5 (1.4–1.6) | 1.5 (1.4–1.6) | 855 | 1,842 | 2,518 | 50.0% | 0.0% | ||
| Tongue | 16 | 19 | 19 | 1.6 (1.5–1.7) | 0.9 (0.8–1.0) | 1.0 (1.0–1.1) | 1,321 | 1,115 | 1,858 | −37.5% | 11.1% | ||
| Bones and joints | 20 | 21 | 20 | 1.0 (1.0–1.1) | 0.5 (0.5–0.6) | 0.6 (0.5–0.6) | 908 | 682 | 914 | −40.0% | 20.0% | ||
| Female | |||||||||||||
| All malignant cancers | 160.0 (159.2–160.8) | 166.7 (166.1–167.3) | 134.0 (133.4–134.5) | 165,509 | 267,008 | 283,463 | −16.3% | −19.6% | |||||
| Lung and bronchus | 3 | 1 | 1 | 17.6 (17.3–17.8) | 41.1 (40.8–41.4) | 31.9 (31.7–32.2) | 18,584 | 65,016 | 68,094 | 81.3% | −22.4% | ||
| Breast | 1 | 2 | 2 | 31.4 (31.1–31.8) | 26.6 (26.4–26.9) | 20.0 (19.8–20.2) | 32,158 | 41,872 | 41,487 | −36.3% | −24.8% | ||
| Colon and rectum | 2 | 3 | 3 | 25.0 (24.6–25.3) | 17.5 (17.3–17.7) | 11.5 (11.4–11.7) | 25,553 | 28,950 | 24,644 | −54.0% | −34.3% | ||
| Pancreas | 5 | 4 | 4 | 8.4 (8.2–8.6) | 9.3 (9.1–9.4) | 9.7 (9.6–9.8) | 8,831 | 15,094 | 20,858 | 15.5% | 4.3% | ||
| Ovary | 4 | 5 | 5 | 9.8 (9.6–10.0) | 8.9 (8.7–9.0) | 6.8 (6.6–6.9) | 10,340 | 14,060 | 14,223 | −30.6% | −23.6% | ||
| Corpus and uterus | 10 | 8 | 6 | 5.3 (5.1–5.4) | 4.1 (4.0–4.2) | 5.0 (4.9–5.1) | 5,570 | 6,585 | 10,733 | −5.7% | 22.0% | ||
| Leukaemia | 6 | 7 | 7 | 6.2 (6.0–6.3) | 5.9 (5.8–6.0) | 4.7 (4.7–4.8) | 6,372 | 9,594 | 9,927 | −24.2% | −20.3% | ||
| Lymphoma | 8 | 6 | 8 | 5.6 (5.5–5.8) | 7.1 (7.0–7.2) | 4.4 (4.3–4.5) | 5,907 | 11,518 | 9,389 | −21.4% | −38.0% | ||
| Brain and other nervous system | 11 | 9 | 9 | 3.4 (3.3–3.5) | 3.7 (3.6–3.8) | 3.6 (3.5–3.7) | 3,667 | 5,644 | 7,324 | 5.9% | −2.7% | ||
| Myeloma | 13 | 10 | 10 | 2.4 (2.3–2.5) | 3.3 (3.2–3.4) | 2.6 (2.5–2.6) | 2,552 | 5,318 | 5,532 | 8.3% | −21.2% | ||
| Liver | 15 | 15 | 11 | 2.0 (1.9–2.0) | 2.1 (2.0–2.1) | 2.5 (2.4–2.6) | 2,017 | 3,349 | 5,397 | 25.0% | 19.0% | ||
| Kidney and renal pelvis | 13 | 12 | 12 | 2.4 (2.3–2.5) | 2.8 (2.7–2.9) | 2.3 (2.2–2.3) | 2,547 | 4,487 | 4,846 | −4.2% | −17.9% | ||
| Stomach | 7 | 11 | 13 | 5.9 (5.8–6.1) | 3.2 (3.1–3.3) | 2.2 (2.1–2.3) | 6,025 | 5,317 | 4,588 | −62.7% | −31.3% | ||
| Cervix uteri | 8 | 12 | 13 | 5.6 (5.4–5.7) | 2.8 (2.7–2.9) | 2.2 (2.2–2.3) | 5,550 | 4,200 | 4,188 | −60.7% | −21.4% | ||
| Urinary bladder | 12 | 14 | 15 | 2.8 (2.7–2.9) | 2.3 (2.2–2.3) | 2.1 (2.1–2.2) | 2,765 | 3,839 | 4,705 | −25.0% | −8.7% | ||
| Intrahepatic bile duct | 36 | 19 | 16 | 0.1 (0.1–0.1) | 0.9 (0.8–0.9) | 1.6 (1.5–1.6) | 93 | 1,391 | 3,329 | 1500.0% | 77.8% | ||
| Oesophagus | 16 | 16 | 17 | 1.7 (1.6–1.8) | 1.8 (1.8–1.9) | 1.5 (1.4–1.5) | 1,801 | 2,953 | 3,142 | −11.8% | −16.7% | ||
| Melanoma of the skin | 18 | 16 | 18 | 1.6 (1.5–1.7) | 1.8 (1.7–1.9) | 1.3 (1.3–1.4) | 1,602 | 2,828 | 2,763 | −18.8% | −27.8% | ||
| Soft tissue including heart | 20 | 18 | 19 | 0.8 (0.8–0.9) | 1.2 (1.1–1.3) | 1.2 (1.1–1.2) | 858 | 1,854 | 2,301 | 50.0% | 0.0% | ||
| Gallbladder | 16 | 19 | 20 | 1.7 (1.7–1.8) | 0.9 (0.8–0.9) | 0.7 (0.6–0.7) | 1,798 | 1,385 | 1,463 | −58.8% | −22.2% | ||
Rank is based on the age-adjusted mortality rate. Age-adjusted mortality rates are per 100,000 population and age-adjusted to the 2000 United States standard population. Death count is the number of cancer deaths. CI, confidence interval.
Figure 3.
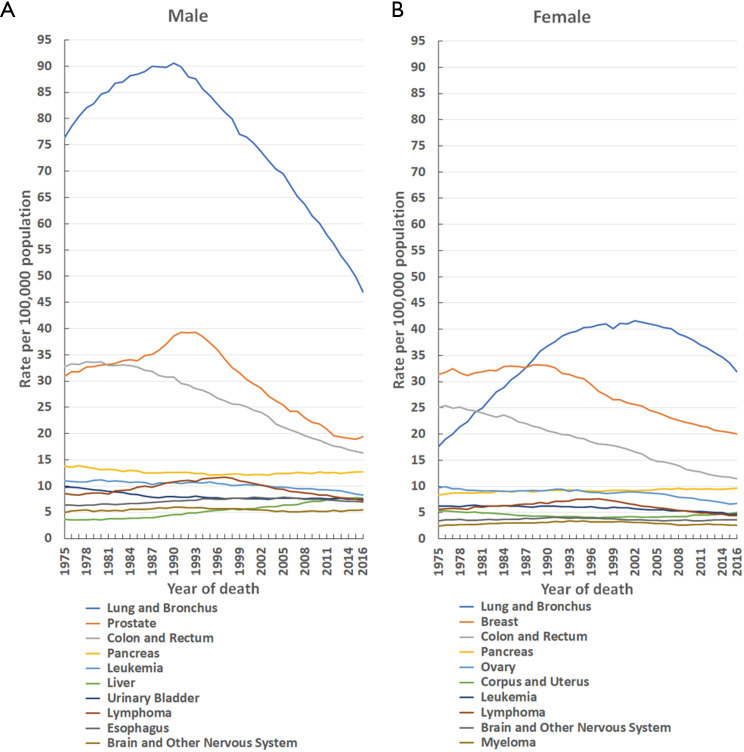
Trends in the mortality rate of the 10 leading causes of cancer death by sex in the United States [1975–2016]. Rates are age-adjusted to the 2000 United States standard population. (A) Male; (B) female.
From 1975–2016, the top three leading causes of cancer death were lung and bronchial, prostate (men), breast (women), and colon and rectal cancers (Figure 3). Although the mortality (per 100,000 population) for lung and bronchial cancer in males dropped by 48.2%, from a maximal peak of 90.6 in 1990 to 46.9 in 2016, and similarly decreased in females by 23.3%, from a maximal peak of 41.6 in 2002 to 31.9 in 2016, it remained the leading cause of cancer death in males from 1975 to 2016 and in females from 1987 to 2016 (Figure 3). Prostate cancer mortality (per 100,000 population) fell by 50.6%, from a maximal peak of 39.3 in 1991 to 19.4 in 2016, yet remained the second leading cause of cancer death in males from 1981 to 2016 (Figure 3A). Breast cancer mortality (per 100,000 population) declined by 39.8%, from a maximal peak of 33.2 in 1988 to 20.0 in 2016, but remained the second leading cause of cancer death in females from 1988 to 2016 (Figure 3B). For colon and rectal cancer, the mortality (per 100,000 population) dropped by 51.6% in males, from a maximal peak of 33.7 in 1978 to 16.3 in 2016, and by 54.7% in females, from a maximal peak of 25.4 in 1976 to 11.5 in 2016. Despite this decline, it remained the third leading cause of cancer death from 1981 to 2016 in both sexes (Figure 3).
Furthermore, the changes in the age-adjusted mortality rate of different races and ethnicities from 1975–2016 were analysed (Figures S1,S6,S7; Tables S8 and S9). From 1975–2016, the overall cancer mortality rate was higher for blacks compared to whites in both sexes (Figure S1). In addition, the changes in the age-adjusted mortality rate of different age groups from 1975–2016 were also analysed (Figures S8 and S9; Tables S10-S14).
Cancer survival
Table 3 shows the 5-year relative survival rates by sex and race/ethnicity for the 20 leading cancers [2016] diagnosed between 2010 and 2016. Among these, cancers of the brain and other nervous system (31.8%), stomach (29.8%), liver (21.2%), oesophagus (20.8%), lung and bronchus (17.4%) and pancreas (10.5%) in males, and cancers of the ovary (48.5%), stomach (35.8%), brain and other nervous system (35.2%), lung and bronchus (24.6%), liver (23.3%) and pancreas (9.5%) in females, displayed 5-year relative survival rates of less than 50%. The 5-year relative survival rate for all cancers combined, diagnosed between 2010 and 2016, was higher in females (70.1%) than males (68.5%) (Table 3). Also, the 5-year relative survival rate for all cancers combined in males and females was 69.3% and 71.2% in whites, 65.6% and 61.3% in blacks, and 58.5% and 69.3% in other, respectively (Table 3). Black people had a lower 5-year survival rate than white people for 17 (in males) and 16 (in females) of the 20 leading cancers (Table 3).
Table 3. Five-year relative survival rates of the 20 leading cancers [2016] by sex in the United States, 2010–2016.
| Incidence rank [2016] | Cancer | Five-year relative survival rate (95% CI) | No. | |||||||
|---|---|---|---|---|---|---|---|---|---|---|
| All races | White | All races | White | All races | White | All races | White | |||
| Male | ||||||||||
| All malignant cancers | 68.5% (68.2–68.7%) | 69.3% (69.1–69.6%) | 65.6% (64.9–66.2%) | 58.5% (57.8–59.2%) | 404,243 | 318,681 | 44,713 | 34,724 | ||
| 1 | Prostate | 98.4%# (98.2#–98.7%#) | 98.8%#(98.5#–99.0%#) | 96.2%# (95.3#–96.9%#) | 94.0% (92.7–95.1%) | 116,247 | 87,951 | 17,745 | 7,776 | |
| 2 | Lung and bronchus | 17.4% (16.9–18.0%) | 17.6% (17.0–18.1%) | 15.7% (14.2–17.2%) | 17.9% (16.2–19.6%) | 44,679 | 34,733 | 5,207 | 4,587 | |
| 3 | Colon and rectum | 66.0% (65.2–66.7%) | 66.8% (65.8%–67.6%) | 58.4% (56.1%–60.7%) | 65.5%# (63.5#–67.5%#) | 35,887 | 26,882 | 4,064 | 4,581 | |
| 4 | Urinary bladder | 79.0% (78.0–80.0%) | 79.5% (78.5–80.6%) | 68.5% (63.9–72.7%) | 73.6%# (69.6#–77.2%#) | 24,674 | 21,781 | 1,200 | 1,401 | |
| 5 | Melanoma of the skin | 92.7% (91.8–93.5%) | 92.5% (91.6–93.3%) | 65.4%# (44.6#–80.0%#) | 67.2%# (56.7#–75.7%#) | 21,934 | 20,853 | 61 | 243 | |
| 6 | Lymphoma | 76.1% (75.3–77.0%) | 76.9% (75.9–77.9%) | 71.5%# (68.8#–74.0%#) | 69.9%# (67.0#–72.5%#) | 22,197 | 17,799 | 2,055 | 2,023 | |
| 7 | Kidney and renal pelvis | 74.6% (73.5–75.6%) | 74.3% (73.1–75.5%) | 77.7% (74.8–80.4%) | 69.7% (66.1–73.1%) | 16,941 | 13,350 | 1,973 | 1,447 | |
| 8 | Leukaemia | 67.6% (66.4–68.7%) | 68.3% (67.0–69.6%) | 62.0% (57.5–66.2%) | 56.9%# (53.0#–60.5%#) | 13,558 | 11,211 | 1,030 | 1,064 | |
| 9 | Pancreas | 10.5% (9.7–11.3%) | 10.6% (9.7–11.5%) | 9.3%# (7.0#–12.0%#) | 9.6%# (7.2#–12.4%#) | 11,392 | 8,915 | 1,287 | 1,145 | |
| 10 | Liver | 21.2% (20.1–22.3%) | 20.6% (19.3–21.9%) | 17.0%# (14.4#–19.8%#) | 26.2% (23.6–28.8%) | 11,439 | 7,423 | 1,785 | 2,163 | |
| 11 | Myeloma | 54.9% (53.0–56.8%) | 54.4% (52.2–56.7%) | 55.0%# (50.4#–59.4%#) | 54.2%# (47.6#–60.4%#) | 6,800 | 4,947 | 1,209 | 581 | |
| 12 | Stomach | 29.8% (28.3–31.3%) | 29.1% (27.4–30.9%) | 25.3% (21.0–29.8%) | 33.7%# (30.1#–37.3%#) | 7,345 | 5,057 | 938 | 1,302 | |
| 13 | Thyroid | 95.9%# (94.8#–96.8%#) | 96.4%# (95.1#–97.3%#) | 92.8%# (84.5#–96.7%#) | 92.7%# (88.8#–95.2%#) | 6,475 | 5,315 | 320 | 736 | |
| 14 | Brain and other nervous system | 31.8% (30.4–33.2%) | 30.6% (29.1%–32.2%) | 36.7% (30.7–42.8%) | 34.5%# (29.1#–40.0%#) | 6,817 | 5,766 | 453 | 531 | |
| 14 | Oesophagus | 20.8% (19.4–22.3%) | 22.2% (20.6–23.9%) | 9.8%# (6.4#–14.1%#) | 13.4%# (9.1#–18.4%#) | 6,119 | 5,221 | 446 | 426 | |
| 16 | Testis | 96.7%# (95.9#–97.4%#) | 97.0%# (96.1#–97.6%#) | 92.0%# (86.0#–95.6%#) | 94.3%# (90.8#–96.5%#) | 5,838 | 5,079 | 190 | 450 | |
| 17 | Tongue | 69.9% (67.8–71.8%) | 71.4% (69.2–73.4%) | 51.0% (42.5–58.8%) | 64.0%# (55.9#–71.1%#) | 4,698 | 4,097 | 275 | 296 | |
| 18 | Larynx | 62.2% (60.0–64.4%) | 63.7% (61.1–66.2%) | 52.7% (46.6–58.6%) | 62.0%# (52.5#–70.2%#) | 4,264 | 3,360 | 618 | 248 | |
| 19 | Soft tissue including heart | 67.3% (64.9–69.6%) | 68.5% (65.7–71.2%) | 62.1%# (54.9#–68.5%#) | 59.8%# (52.6#–66.2%#) | 3,285 | 2,511 | 356 | 373 | |
| 20 | Tonsil | 78.6%# (76.4#–80.6%#) | 80.6%# (78.3#–82.7%#) | 59.4%# (50.8#–67.0%#) | 74.4%# (63.0#–82.8%#) | 3,319 | 2,860 | 288 | 154 | |
| Female | ||||||||||
| All malignant cancers | 70.1% (69.9–70.3%) | 71.2% (70.9–71.4%) | 61.3% (60.7–62.0%) | 69.3% (68.7–69.9%) | 395,331 | 307,195 | 42,621 | 41,572 | ||
| 1 | Breast | 91.2% (90.9–91.6%) | 92.3% (92.0–92.7%) | 83.1% (82.1–84.1%) | 91.4% (90.5–92.1%) | 124,503 | 95,541 | 13,892 | 14,193 | |
| 2 | Lung and bronchus | 24.6% (24.0–25.2%) | 24.4% (23.8–25.1%) | 23.5% (21.8–25.2%) | 26.7% (24.7–28.7%) | 41,772 | 33,182 | 4,766 | 3,705 | |
| 3 | Colon and rectum | 66.2% (65.4–67.0%) | 66.8% (65.8–67.7%) | 59.9% (57.6–62.1%) | 67.1% (64.9–69.2%) | 32,815 | 24,431 | 4,209 | 3,855 | |
| 4 | Corpus and uterus | 82.7% (82.0–83.4%) | 85.5% (84.7–86.2%) | 63.2% (60.7–65.6%) | 81.2%# (79.2#–83.0%#) | 29,573 | 22,801 | 3,160 | 3,353 | |
| 5 | Thyroid | 99.0%# (98.8#–99.2%#) | 99.2%# (99.0#–99.4%#) | 97.4% (95.0–98.6%) | 97.6%# (96.5#–98.4%#) | 20,919 | 16,178 | 1,623 | 2,764 | |
| 6 | Melanoma of the skin | 96.5% (95.8–97.1%) | 96.5% (95.7–97.1%) | 69.2%# (50.1#–82.2%#) | 81.8%# (72.5#–88.2%#) | 17,595 | 16,597 | 84 | 233 | |
| 7 | Lymphoma | 77.6% (76.7–78.5%) | 78.4% (77.3–79.4%) | 76.4% (73.3–79.2%) | 69.4% (66.2–72.3%) | 17,620 | 14,033 | 1,693 | 1,664 | |
| 8 | Pancreas | 9.5% (8.7–10.4%) | 9.4% (8.5–10.4%) | 9.4%# (7.4%#–11.7%#) | 10.0% (7.7–12.7%) | 11,169 | 8,404 | 1,511 | 1,226 | |
| 9 | Leukaemia | 64.4% (63.0–65.7%) | 65.3% (63.8–66.8%) | 58.6% (53.9–62.9%) | 53.3% (48.7–57.7%) | 9,712 | 7,852 | 914 | 788 | |
| 9 | Kidney and renal pelvis | 76.6% (75.3–77.9%) | 76.3% (74.8–77.8%) | 77.7%# (74.1#–80.9%#) | 74.7%# (70.4#–78.5%#) | 9,596 | 7,374 | 1,245 | 861 | |
| 11 | Ovary | 48.9% (47.6–50.1%) | 48.5% (47.1–49.9%) | 42.7% (38.4–46.9%) | 55.8% (51.7–59.6%) | 11,881 | 9,462 | 1,088 | 1,258 | |
| 12 | Urinary bladder | 75.2% (73.6–76.8%) | 76.9%# (75.2#–78.5%#) | 56.2% (50.1–61.8%) | 69.8%# (63.6#–75.2%#) | 7,730 | 6,504 | 623 | 494 | |
| 13 | Cervix uteri | 69.6% (68.0–71.0%) | 71.6% (69.8–73.3%) | 56.7% (52.2–61.1%) | 69.6%# (65.4#–73.4%#) | 6,576 | 4,706 | 909 | 870 | |
| 14 | Myeloma | 53.0% (50.9–55.0%) | 52.3% (49.7–54.8%) | 54.8% (50.3–59.0%) | 49.3%# (42.0#–56.3%#) | 5,511 | 3,697 | 1,269 | 502 | |
| 15 | Stomach | 35.8% (34.0–37.7%) | 35.5% (33.1–37.8%) | 41.1% (36.3–45.9%) | 31.8%# (28.0#–35.7%#) | 4,699 | 2,892 | 756 | 1,006 | |
| 15 | Brain and other nervous system | 35.2% (33.5–36.9%) | 33.7% (32.0–35.5%) | 41.0%# (34.8#–47.0%#) | 40.2%# (33.7#–46.6%#) | 5,252 | 4,399 | 398 | 398 | |
| 17 | Liver | 23.3% (21.4–25.4%) | 22.4% (19.9–25.0%) | 18.0%# (13.6#–22.9%#) | 28.9% (24.5–33.4%) | 3,542 | 2,117 | 559 | 842 | |
| 18 | Soft tissue including heart | 67.0% (64.2–69.6%) | 67.8% (64.5–70.8%) | 66.9%# (59.5#–73.2%#) | 60.8%# (52.4#–68.2%#) | 2,522 | 1,839 | 358 | 294 | |
| 19 | Vulva | 70.9% (67.6–74.0%) | 71.0% (67.4–74.2%) | 67.6%# (54.5%#–77.7%#) | 69.8% (53.7–81.2%) | 2,088 | 1,791 | 163 | 113 | |
| 20 | Tongue | 69.1% (65.7–72.2%) | 70.4% (66.6–73.8%) | 43.1%# (29.7#–55.7%#) | 70.2% (58.4–79.2%) | 1,714 | 1,363 | 106 | 225 | |
| 20 | Small intestine | 69.2% (66.0–72.2%) | 71.5% (67.8–74.9%) | 66.9%# (59.0#–73.6%#) | 47.4% (33.1–60.4%) | 1,956 | 1,432 | 357 | 146 | |
#, the relative cumulative survival increased from a prior interval and has been adjusted. Other denotes other races and ethnicities, including American Indian/AK Native, Asian/Pacific Islander. Rank is based on age-adjusted cancer incidence rate in 2016. CI, confidence interval.
In addition, the analysis of the 1- and 3-year relative survival rates by sex and race/ethnicity for the 20 leading cancers (2016) diagnosed between 2010 and 2016 is shown in Tables S15,S16.
Discussion
A total of 4,711,958 cancer cases spanning 1975–2016 are registered in the nine oldest SEER areas, representing approximately 9% of the US population. From 1975–2016, a total of 21,489,462 cancer death cases were recorded in the US. This vast amount of data provides an accurate reflection of the actual cancer incidence and mortality rates in the US. In males, the overall cancer incidence rate (per 100,000 population) declined by 28.7%, from a maximal peak of 658.4 in 1992 to 469.2 in 2016, and this trend continues to date (Figure 1). However, in females, this rate has been relatively stable since its maximal peak of 434.3 in 1998, only decreasing to 411.5 in 2016 (Figure 1). The overall cancer incidence in males showed a distinct peak in 1992, predominantly caused by prostate cancer (Figure 1).
Prostate cancer remained the leading cancer in males in the US from 1975–2016, and its incidence rate (per 100,000 population) rose from 94.0 in 1975 to a maximal peak of 237.5 in 1992, followed by a decline to 108.4 in 2016 (Figure 2A). The rapid uptake of prostate-specific antigen screening led to a dramatic spike in overall prostate cancer diagnoses during the early 1990s (7). Meanwhile, breast cancer remained the primary cancer in females in the US from 1975–2016, and showed an increased incidence rate (per 100,000 population) from 105.1 in 1975 to a maximal peak of 141.6 in 1999, followed by a subsequent drop to 126.5 in 2016 (Figure 2B). The breast cancer incidence rate in females reduced by 10.7% from 1999–2016, likely due to the decreased use of menopausal hormones (8,9). The decrease in incidence may also reflect (in part) the small declines in mammography screening since 2000 (9).
Lung and bronchial cancer remained the second major malignancy in males from 1975–2016, and in females from 1992–2016 (Figure 2). In males, the incidence of lung and bronchial cancer has exhibited a continuously declining trend since the 1980s (Figure 2), which reflects changes in risk behaviours following the promulgation of information about the dangers of tobacco smoking in the 1950s and 1960s, as well as subsequent governmental tobacco control measures (10). However, in females, the incidence of lung and bronchial cancer showed an increasing trend from 1975–2005, and slightly decreased after 2005 (Figure 2). Varying historical patterns in tobacco uptake and cessation, as well as upturns in the prevalence of female smoking in some birth cohorts account for the different trends between males and females (2,11).
Colon and rectal cancer were the third most common cancer in males from 1975–2016, and similarly, in females from 1992–2016 (Figure 2). The incidence patterns for colon and rectal cancer are generally similar in men and women and have continued to decline from 1985–2016 in both sexes (Figure 2). Some researchers have attributed the long-term decline to changes in risk factors (e.g., decreased smoking and red meat consumption, and increased use of aspirin), as well as the introduction and dissemination of screening tests (12,13). Colonoscopy procedures, which are the predominant screening tests, tripled among adults aged ≥50 years in the US, from 21% in 2000 to 60% in 2015 (2).
The overall cancer mortality rates in both males and females have continuously declined since the 1990s, falling by 33.6% in males from 1990–2016, and by 23.6% in females from 1991–2016 (Figure 1). This declining trend continues to date. The decrease in cancer mortality over the past three decades is primarily attributable to reductions in overall cancer incidence, advances in early detection, and improvements in treatment (1-3). Consistent with cancer incidence, from 1975–2016, the top three leading causes of cancer mortality were still lung and bronchial, prostate (men only), breast (women only), and colon and rectal cancers (Figure 3). The mortality rates for these cancers have continued to decline since approximately 1990, except for female lung cancer, which has declined since 2002. Specifically, the mortality of lung and bronchial cancer decreased by 48.2% in males from 1990–2016, and by 23.3% in females from 2002–2016 (Figure 3).
Furthermore, prostate cancer mortality in males fell by 50.6% from 1991–2016. Breast cancer mortality in females also declined by 39.8% from 1988–2016 (Figure 3). Moreover, colon and rectal cancer mortality decreased by 51.6% in males from 1978–2016, and in females by 54.7% from 1976–2016 (Figure 3). Some researchers have attributed the decline in mortality of these cancers to steady reductions in smoking and advances in early detection and treatment (11,13-16). Thus, it is important that efforts in tobacco control and smoking cessation continue so that further reductions in cancer incidence and mortality can be achieved, especially among women.
In terms of the cancer survival rate, the 5-year relative survival rates for all cancers combined diagnosed from 2010–2016 were 68.5% in males and 70.1% in females (Table 3). Among the 10 leading cancers in 2016, those with a 5-year relative survival rate of less than 50% included lung and bronchial (17.4%), pancreatic (10.5%) and liver (21.2%) cancers in males, and lung and bronchial (24.6%) and pancreatic (9.5%) cancers in females (Table 3). The 5-year relative survival rate of these cancer types is low, partly because more than 50% of cases are diagnosed at a late stage (2). Due to early screening and treatment, the 5-year survival rates of prostate cancer and breast cancer are high (7,17-20), reaching 98.4% and 91.2%, respectively (Table 3). Greater attention should be given to cancers with a low survival rate, and knowledge and experience from the screening and treatment of prostate and breast cancers should be applied in order to strengthen early detection and treatment and prolong the survival time of patients with these types of cancer. Such issues are especially important for lung and bronchial cancer. Despite being the second most common cancer among both males and females in 2016, it was the leading cause of cancer death, primarily because the 5-year relative survival rate is extremely low (17.4% in males and 24.6% in females). There is a potential for earlier lung cancer diagnosis through screening with low-dose computed tomography (CT), which could significantly reduce lung cancer mortality (2,21-23). From 2010–2015, the percentage of eligible smokers who were reported to have undergone low-dose CT screening in the previous 12 months remained low and constant (3.3% in 2010 and 3.9% in 2015) (24). Therefore, the broad implementation of guideline-recommended lung cancer screening needs to be strengthened in the future to benefit more people.
In addition, there are noticeable differences in cancer incidence, mortality, and survival rates among sex and ethnicity categories. From 1975–2016, overall cancer incidence and mortality was higher in males than females (Figure 1). Biological, behavioural, and environmental factors all contribute the higher cancer incidence and mortality rates of men compared to women (25). Dunford et al. reported that biallelic expression of “escape from X-inactivation tumour-suppressor” genes in females explains a portion of the reduced cancer incidence in females as compared with males across a variety of tumour types (26). Also, black males have higher incidence and mortality, and shorter survival rates compared with white males for all cancers combined. However, black females have a lower incidence, higher mortality, and shorter survival rates relative to white females for all cancers combined. In the US, black people are more likely to report not being able to see a doctor because of cost (27). In addition, they have notably lower educational attainment and homeownership, as well as approximately twice the proportion of households living below the poverty line and approximately twice the levels of unemployment compared to the white population (27). These socio-economic factors help to explain ethnic disparities in cancer incidence, mortality, and survival rates via cancer-related behaviours and health care utilisation, which constrain an individual’s ability to engage in cancer prevention, early detection, or treatment (28). Finally, it is unsurprising that there are different high-incidence cancers among the different age groups. Cancer screening and prevention should focus on the high-incidence cancers of these different age groups.
Limitations
A strength of our study is the use of nationwide, high-quality, population-based data on cancer incidence, mortality and survival rates from the SEER database. However, our study has several limitations that should be noted. Firstly, due to the descriptive nature of this study, it is only possible to speculate about potential explanations for cancer incidence and mortality trends. Secondly, the rapid uptake of cancer screening led to a dramatic increase in the incidence of certain cancers, such as prostate cancer, and this increase in incidence does not necessarily reflect the actual change in cancer incidence. However, mortality, which we also analysed, is less affected by screening and can offer an accurate reflection the actual situation. Thirdly, the SEER database only contains data on patients within US regions and does not represent changes in the incidence, mortality, and survival rates of cancer worldwide. We anticipate the establishment of a record similar to the SEER database in China, which will represent a population of 1.4 billion.
Conclusions
The continuous decline in the overall cancer mortality rate in the US since the early 1990s has resulted in an overall decrease of 33.6% among males and 23.6% among females. The top three leading cancers and causes of cancer death in males from 1975–2016 were prostate, lung and bronchial, and colon and rectal cancers, while in females (from 1979–2016), they were breast, lung and bronchial, and colon and rectal cancers. The 5-year relative survival rates for all cancers combined (diagnosed from 2010–2016) were 68.5% in males and 70.1% in females. From 1975–2016, the overall cancer incidence and mortality were higher in males than females. Black males have a higher incidence and mortality, and shorter survival rates compared with white males for all cancers combined. However, black females have a lower incidence, higher mortality, and shorter survival rates compared with white females for all cancers combined. Our work provides a comprehensive overview of cancer incidence and mortality in the US over the past 42 years. More research is needed to elucidate the causes of change in cancer incidence and mortality, and advance early detection and treatment of cancers with a low survival rate.
Supplementary
The article’s supplementary files as
Acknowledgments
Funding: This work was supported by the National Natural Science Foundation of China, China [grant number 31700690] and the Natural Science Foundation of Zhejiang Province, China [grant number LQ18H180002].
Ethical Statement: The authors are accountable for all aspects of the work in ensuring that questions related to the accuracy or integrity of any part of the work are appropriately investigated and resolved.
Reporting Checklist: The authors have completed the STROBE reporting checklist (available at http://dx.doi.org/10.21037/atm-20-7481).
Conflicts of Interest: All authors have completed the ICMJE uniform disclosure form (available at http://dx.doi.org/10.21037/atm-20-7841). The authors have no conflicts of interest to declare.
(English Language Editor: A. Kassem)
References
- 1.Siegel RL, Miller KD, Jemal A. Cancer statistics, 2018. CA Cancer J Clin 2018;68:7-30. 10.3322/caac.21442 [DOI] [PubMed] [Google Scholar]
- 2.Siegel RL, Miller KD, Jemal A. Cancer statistics, 2019. CA Cancer J Clin 2019;69:7-34. 10.3322/caac.21551 [DOI] [PubMed] [Google Scholar]
- 3.Siegel RL, Miller KD, Jemal A. Cancer Statistics, 2017. CA Cancer J Clin 2017;67:7-30. 10.3322/caac.21387 [DOI] [PubMed] [Google Scholar]
- 4.Lu T, Yang X, Huang Y, et al. Trends in the incidence, treatment, and survival of patients with lung cancer in the last four decades. Cancer Manag Res 2019;11:943-53. 10.2147/CMAR.S187317 [DOI] [PMC free article] [PubMed] [Google Scholar]
- 5.Houston KA, Henley SJ, Li J, et al. Patterns in lung cancer incidence rates and trends by histologic type in the United States, 2004-2009. Lung Cancer 2014;86:22-8. 10.1016/j.lungcan.2014.08.001 [DOI] [PMC free article] [PubMed] [Google Scholar]
- 6.Jemal A, Miller KD, Ma J, et al. Higher Lung Cancer Incidence in Young Women Than Young Men in the United States. N Engl J Med 2018;378:1999-2009. 10.1056/NEJMoa1715907 [DOI] [PMC free article] [PubMed] [Google Scholar]
- 7.Welch HG, Gorski DH, Albertsen PC. Trends in Metastatic Breast and Prostate Cancer--Lessons in Cancer Dynamics. N Engl J Med 2015;373:1685-7. 10.1056/NEJMp1510443 [DOI] [PubMed] [Google Scholar]
- 8.Coombs NJ, Cronin KA, Taylor RJ, et al. The impact of changes in hormone therapy on breast cancer incidence in the US population. Cancer Causes Control 2010;21:83-90. 10.1007/s10552-009-9437-5 [DOI] [PubMed] [Google Scholar]
- 9.DeSantis CE, Ma J, Goding Sauer A, et al. Breast cancer statistics, 2017, racial disparity in mortality by state. CA Cancer J Clin 2017;67:439-48. 10.3322/caac.21412 [DOI] [PubMed] [Google Scholar]
- 10.de Groot PM, Wu CC, Carter BW, et al. The epidemiology of lung cancer. Transl Lung Cancer Res 2018;7:220-33. 10.21037/tlcr.2018.05.06 [DOI] [PMC free article] [PubMed] [Google Scholar]
- 11.Boloker G, Wang C, Zhang J. Updated statistics of lung and bronchus cancer in United States (2018). J Thorac Dis 2018;10:1158-61. 10.21037/jtd.2018.03.15 [DOI] [PMC free article] [PubMed] [Google Scholar]
- 12.Edwards BK, Ward E, Kohler BA, et al. Annual report to the nation on the status of cancer, 1975-2006, featuring colorectal cancer trends and impact of interventions (risk factors, screening, and treatment) to reduce future rates. Cancer 2010;116:544-73. 10.1002/cncr.24760 [DOI] [PMC free article] [PubMed] [Google Scholar]
- 13.Siegel RL, Miller KD, Fedewa SA, et al. Colorectal cancer statistics, 2017. CA Cancer J Clin 2017;67:177-93. 10.3322/caac.21395 [DOI] [PubMed] [Google Scholar]
- 14.Gadalla SM, Widemann BC. Editorial: US Cancer Statistics of Survival: Achievements, Challenges, and Future Directions. J Natl Cancer Inst 2017;109:djx070. 10.1093/jnci/djx070 [DOI] [PMC free article] [PubMed] [Google Scholar]
- 15.Holford TR, Meza R, Warner KE, et al. Tobacco control and the reduction in smoking-related premature deaths in the United States, 1964-2012. JAMA 2014;311:164-71. 10.1001/jama.2013.285112 [DOI] [PMC free article] [PubMed] [Google Scholar]
- 16.Thun MJ, Carter BD, Feskanich D, et al. 50-year trends in smoking-related mortality in the United States. N Engl J Med 2013;368:351-64. 10.1056/NEJMsa1211127 [DOI] [PMC free article] [PubMed] [Google Scholar]
- 17.Magnani CJ, Li K, Seto T, et al. PSA Testing Use and Prostate Cancer Diagnostic Stage After the 2012 U.S. Preventive Services Task Force Guideline Changes. J Natl Compr Canc Netw 2019;17:795-803. 10.6004/jnccn.2018.7274 [DOI] [PMC free article] [PubMed] [Google Scholar]
- 18.Holt JD, Gerayli F. Prostate Cancer Screening. Prim Care 2019;46:257-63. 10.1016/j.pop.2019.02.007 [DOI] [PubMed] [Google Scholar]
- 19.DeSantis CE, Ma J, Gaudet MM, et al. Breast cancer statistics, 2019. CA Cancer J Clin 2019;69:438-51. 10.3322/caac.21583 [DOI] [PubMed] [Google Scholar]
- 20.Bitencourt AG, Rossi Saccarelli C, Kuhl C, et al. Breast cancer screening in average-risk women: towards personalized screening. Br J Radiol 2019;92:20190660. 10.1259/bjr.20190660 [DOI] [PMC free article] [PubMed] [Google Scholar]
- 21.Aberle DR, Adams AM, Berg CD, et al. Reduced lung-cancer mortality with low-dose computed tomographic screening. N Engl J Med 2011;365:395-409. 10.1056/NEJMoa1102873 [DOI] [PMC free article] [PubMed] [Google Scholar]
- 22.Aberle DR, DeMello S, Berg CD, et al. Results of the two incidence screenings in the National Lung Screening Trial. N Engl J Med 2013;369:920-31. 10.1056/NEJMoa1208962 [DOI] [PMC free article] [PubMed] [Google Scholar]
- 23.Church TR, Black WC, Aberle DR, et al. Results of initial low-dose computed tomographic screening for lung cancer. N Engl J Med 2013;368:1980-91. 10.1056/NEJMoa1209120 [DOI] [PMC free article] [PubMed] [Google Scholar]
- 24.Jemal A, Fedewa SA. Lung Cancer Screening With Low-Dose Computed Tomography in the United States-2010 to 2015. JAMA Oncol 2017;3:1278-81. 10.1001/jamaoncol.2016.6416 [DOI] [PMC free article] [PubMed] [Google Scholar]
- 25.Crimmins EM, Shim H, Zhang YS, et al. Differences between Men and Women in Mortality and the Health Dimensions of the Morbidity Process. Clin Chem 2019;65:135-45. 10.1373/clinchem.2018.288332 [DOI] [PMC free article] [PubMed] [Google Scholar]
- 26.Dunford A, Weinstock DM, Savova V, et al. Tumor-suppressor genes that escape from X-inactivation contribute to cancer sex bias. Nat Genet 2017;49:10-6. 10.1038/ng.3726 [DOI] [PMC free article] [PubMed] [Google Scholar]
- 27.Cunningham TJ, Croft JB, Liu Y, et al. Vital Signs: Racial Disparities in Age-Specific Mortality Among Blacks or African Americans - United States, 1999-2015. MMWR Morb Mortal Wkly Rep 2017;66:444-56. 10.15585/mmwr.mm6617e1 [DOI] [PMC free article] [PubMed] [Google Scholar]
- 28.Phelan JC, Link BG, Tehranifar P. Social conditions as fundamental causes of health inequalities: theory, evidence, and policy implications. J Health Soc Behav 2010;51 Suppl:S28-40. 10.1177/0022146510383498 [DOI] [PubMed] [Google Scholar]
Associated Data
This section collects any data citations, data availability statements, or supplementary materials included in this article.
Supplementary Materials
The article’s supplementary files as