Abstract
Background
Spinal cord injuries (SCIs), along with subsequent secondary injuries, often result in irreversible damage to both sensory and motor functions. However, a thorough view of the underlying pathological mechanisms of SCIs, especially in a temporal-spatial manner, is still lacking.
Methods
To obtain a comprehensive, real-time view of multiple subsets of the cellular mechanisms involved in SCIs, we applied RNA-sequencing technology to characterize the temporal changes in gene expression around the lesion site of contusion SCI in rats. First, we identified the differentially expressed genes (DEGs) in contrast to sham controls at 1, 4, and 7 days post SCI. Through bioinformatics analysis, including Pathway analysis, Gene-act-net, and Pathway-act-net, we screened and verified potential key pathways and genes associated with either the acute or subacute stages of SCI pathology.
Results
The top three overrepresented pathways were associated with cytokine-cytokine receptor interaction, TNF signaling pathway, and cell cycle at day 1; lysosome, cytokine-cytokine receptor interaction, phagosome at day 4; and phagosome, lysosome, cytokine-cytokine receptor interaction at day 7 post injury. Further, we identified uniquely enriched genes at each time point, such as Ccr1 and Nos2 at day 1; as well as Mgst2, and Pla2g3 at 4 and 7 days post-injury.
Conclusions
Our pathway analysis suggested a transition from inflammatory responses to multiple forms of cell death processes from the acute to subacute stages of SCI. Further, our results revealed a continuous transformation from a more inflammatory to an apoptotic/self-repairing transcriptome following the time-course of SCIs. Our research provides novel insights into the molecular mechanisms of SCI pathophysiology and identifies potential targets for therapeutic intervention after SCI.
Keywords: Spinal cord injuries (SCIs), RNA sequencing, pathway analysis, key pathways, key genes
Introduction
A spinal cord injury (SCI) is a debilitating medical condition that often leads to permanent impairment of both sensory and motor functions. Due to the lack of effective treatment, SCI often causes devastating suffering to affected individuals and significant financial burden to patients, their families, and society (1,2). The pathophysiological processes of SCI comprise multiple phases. Initially, compression forces cause the direct mechanical disruption of spinal cord neural tissues, whereby the descending and ascending supraspinal axons responsible for motor control and sensory transformation are severed. In addition, microvascular hemorrhage disrupts the blood-spinal cord barrier, followed by edema, ischemia, and the release of cytotoxic chemicals from inflammatory pathways (3,4). Following this primary injury, a subsequent phase of pathological changes, often termed as “secondary injury,” occurs, which can be even more devastating (5,6). The infiltrated immune cells, along with activated microglia, evoke severe inflammation, which often results in fluid-filled cysts that prevent any regrowing axons from re-connecting the spinal cord (7-9). In addition, glia scars formed around the lesion site further inhibit axon regeneration by releasing chondroitin sulfate proteoglycans (CSPGs) (10-12). Thus, multiple events orchestrated by the central nervous, immune, and vascular systems contribute to the pathophysiological mechanisms of SCI.
To decipher how different signaling pathways are involved in SCI, research has focused on RNA-Sequencing (RNS-Seq) studies in different species and conditions (13-17). In this study, we performed a comprehensive analysis detailing how genes in different tissues change their expression at multiple key time points (1, 4, and 7 days, respectively) post injury. Previous studies well-established that at 1 day post injury, local microglia, along with peripheral neutrophils and monocytes migrated into the injury site, initiated an innate immune response (3,5). By 3–4 days post injury, gliosis emerges when active astrocytes microglia, oligodendrocyte progenitor cells are massively proliferating (3). At 7 days post injury, accumulating macrophages and fibroblasts start to form fibrotic scar, which is surrounded by previously formed astroglia scar (3,5,7,18). In parallel, angiogenesis and revascularization occur during the first 7 days (19). Thus, choosing 1, 4, and 7 days post injury as 3 key time points made it possible for us to snapshot the repertoire of multiple events post SCI. we thus performed the RNA-Sequencing (RNA-Seq) of tissues around the injury site. With both bioinformatics analysis and quantitative real-time polymerase chain reaction (qRT-PCR) verification, we identified novel key genes and pathways involved in the different stages. Our study thus provides novel insights into the molecular mechanisms of SCI pathophysiology and will promote the exploration of potential targets for therapeutic intervention after SCI.
We present the following article in accordance with the ARRIVE reporting checklist (available at http://dx.doi.org/10.21037/atm-20-6519).
Methods
SCI model
All animal operations in this study were carried out according to the recommendations of Institutional Animal Care and Use Committee of Nantong University, China. Experiments were performed under a project license (No. S20200323-151) granted by ethics board of Nantong University, in compliance with national guidelines for the care and use of animals.
Female rats (12 weeks of age) were anesthetized with a narcotic mixture (85 mg/kg trichloroacetaldehyde monohydrate, 42 mg/kg magnesium sulfate, and 17 mg/kg sodium pentobarbital) via intraperitoneal injection. A laminectomy was then performed to expose the spinal cord at T9. Next, a 25-g rod was dropped onto the exposed spinal cord from a height of 50 mm to induce a severe contusion, using the NYU impactor (W.M. Keck Center for Collaborative Neuroscience, Rutgers the State University of New Jersey). After injury induction, the aponeurotic plane was sutured with polyglycolic acid and the skin with nylon thread. We performed laminectomy without any contusion injury as sham control. Throughout the surgery, body temperature was maintained at 37 °C with a heating blanket. The rats were housed in cages and given free access to food and water following the surgery. Distended bladders were emptied by manual massage on the lower abdomen twice a day until voluntary emptying returned. For experimental groups, we applied the Basso, Beattie and Bresnahan (BBB) locomotor scale at 1, 4, and 7 days post injury and excluded all animals that show hindlimb movement (BBB ≥3 at 1 d post injury). Post hoc analysis included 4, 4, 4, and 4 animals for sham, 1, 4, and 7 d post injury, respectively (see Figure S1 for a schematic drawing).
Tissue harvesting and preparation
Spinal cord tissues (0.25 mm rostral and caudal towards the injured epicenter, with injury site included) were harvested after SCI on days 0, 1, 4 and 7, pooled and frozen in liquid nitrogen, and processed for RNA isolation (Trizol, Invitrogen, Carlsbad, CA) following the manufacturer’s instructions.
RNA-seq
The samples were processed using the Illumina RNA-Seq sample preparation kit (Illumina, San Diego, CA, USA). The RNA-seq library was 100 bp, and the paired ends were sequenced on the Illumina HiSeq 2000 (Illumina, San Diego, CA, USA). After removing the polymer, primer adaptor, and ribosomal RNA (Cutadapt 3.1), we used comparison data to calculate the distribution of reads on the reference gene, performed coverage analysis, and aligned the sequencing reads with the rat genome using Tophat. The expression level of each gene was measured by fragments per kilobase per million bases (FPKM) after a quality control check. If the gene showed at least a two-fold difference in expression and the false discovery rate (FDR) was less than 0.001, the difference was considered significant. The complete list of differentially expressed genes (DEGs) at each time point is showed at https://cdn.amegroups.cn/static/public/10.21037atm-20-6519-1.pdf.
Pathway analysis
According to the “Kyoto Encyclopedia of Genes and Genomics” (KEGG), pathway analysis was used to identify important pathways mediated by differential gene expression (20). For pathway analysis, we applied Fisher’s exact to calculate P value and FDR according to KEGG database (21). Any pathway with an FDR-adjusted P value ≤0.05 was defined as significant enrichment. Cytoscape was used to generate a graphical representation of the path (22).
Path-act-network
Taking Pathway Analysis as the research object and using the upstream and downstream regulatory relationships of signal pathways recorded in the KEGG database, the Path-Act-Network was drawn to obtain the regulatory relationship between macroscopically significant signal pathways upstream and downstream.
Gene-act-network
With the phenotypic genes related to the researcher in the significant Pathway Analysis as the research goal, the KEGG database inter-gene relationship annotation was used to draw the Gene-Act-Network.
qRT-PCR
According to the manufacturer’s instructions, a high-capacity cDNA reverse transcription kit (Applied Biosystems, Foster City, California, USA) was used for reverse transcription. QPCR was performed on an ABI 7500 thermal cycler (Applied Biosystems, Foster City, California, USA) using SYBR Green Real-Time PCR Master Mix (Toyobo, Japan). Glyceraldehyde-3-phosphate dehydrogenase (GAPDH) and 18s RNA were used for standardization. The primer sequences are listed in Table S1.
Statistical analysis
For all figures, error bars figures represent mean ± SEM, the number (n) of samples employed is indicated in legends. Student’s t test, One-way ANOVA with Bonferroni correction for multiple comparisons (all were shown in figure legends) were performed to determine the significance difference between different groups. P<0.05 denoted the statistically significant difference.
Results
Identification of DEGs at multiple time points post contusional SCI
To investigate DEGs in the acute/subacute phases of SCI, tissues around the injury site were obtained for RNA-Seq from rats with sham or SCI at 1, 4, and 7 days post-injury.
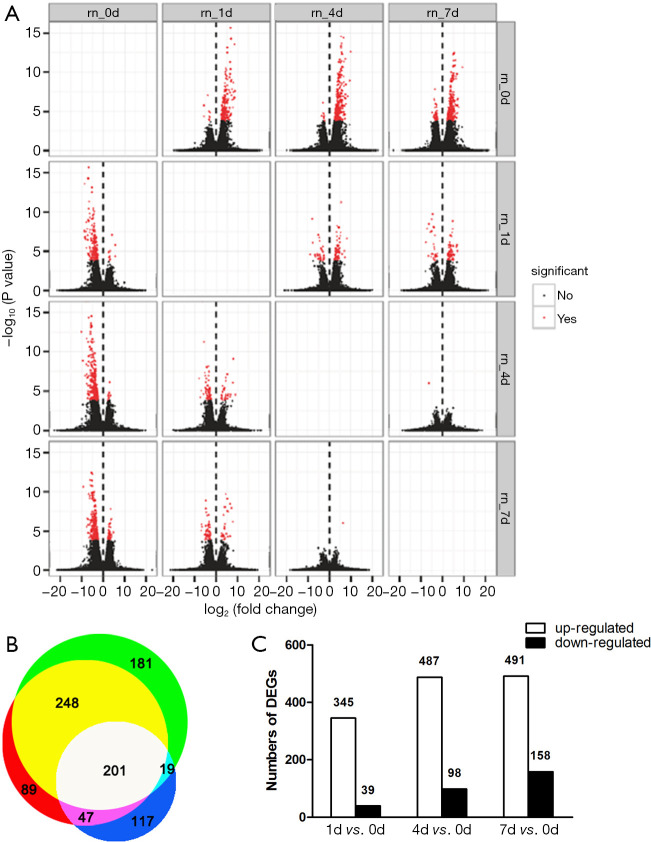
Transcriptomes were reconstructed using our in-house pipeline (see details in Materials and Methods). The base accuracy rate of Q30 is more than 84%, indicating the high quality of the sample processing and sequencing (Table S2). In addition, analysis by Tophat revealed that data between different time points showed a consistency of more than 98%, with reads 1 and reads 2 paired to chromosomes accounting for more than 88.9% (Table 1). These results indicated the success of library construction. We obtained more than 60 million total reads per sample, among which ~95% were mapped to the rat reference genome. Pairwise comparison of days 0, 1, 4 and 7 expressional data allowed for the identification of all genes that were differentially expressed at these stages. Based on the difference screening results and the FPKM of the sample, volcano map analysis was performed to obtain the volcano plot (Figure 1A).
Table 1. An overview of the sequencing results and their comparison with the reference genome.
| Sample name | 0 d (%) | 1 d (%) | 4 d (%) | 7 d (%) |
|---|---|---|---|---|
| Total reads | 69,849,782 | 65,483,181 | 67,567,197 | 61,436,657 |
| Total mapped | 66,244,619 (94.84) | 62,525,227 (95.48) | 64,535,271 (95.51) | 58,640,030 (95.45) |
| Multiple mapped | 942,300 (1.35) | 1,053,361 (1.61) | 990,633 (1.47) | 938,586 (1.53) |
| Uniquely mapped | 65,302,319 (93.49) | 61,471,866 (93.87) | 63,544,638 (94.05) | 57,701,444 (93.92) |
| Read1 mapped | 33,119,020 (47.41) | 31,263,297 (47.74) | 32,265,191 (47.75) | 29,318,677 (47.72) |
| Read2 mapped | 33,125,599 (47.42) | 31,261,930 (47.74) | 32,270,080 (47.76) | 29,321,353 (47.73) |
| Reads map to ‘+’ | 33,159,453 (47.47) | 31,306,957 (47.81) | 32,314,806 (47.83) | 29,360,597 (47.79) |
| Reads map to ‘−’ | 33,085,166 (47.37) | 31,218,270 (47.67) | 32,220,465 (47.69) | 29,279,433 (47.66) |
| Reads mapped in proper pairs | 62,110,832 (88.92) | 58,494,504 (89.33) | 60,404,186 (89.40) | 54,970,454 (89.48) |
Note: “+” refers to sense strands, “−” indicates anti-sense strands.
Figure 1.
Summary of differentially expressed genes at 1, 4, and 7 days post contusional spinal cord injury. An overview of transcriptome changes at multiple time points post contusional SCI. (A) Analysis of differentially expressed genes between samples by volcano mapping. The abscissa represents the fold change of transcript expression in different samples. The ordinate represents the statistical significance of the difference in transcript expression changes. Red dots indicate transcripts with significant differences. (B) Venn diagram, which shows the overlap of differentially expressed genes on day 1 (white + dark blue + purple + light blue), day 4 (white + yellow + purple + red), and day 7 (white + yellow + green + light blue) after spinal cord injury. (C) Bar graph showing the number of up- and down-regulated transcripts at 1, 4, and 7 days after spinal cord injury (FDR ≤0.001, fold change >2).
Next, we discovered 384, 585, and 649 DEGs at days 1, 4, and 7 post SCI, respectively, when compared to sham. Among them, 201 genes were differentially expressed at all three time points (Figure 1B). As shown in Figure 1C, 1004 genes were differentially expressed in total. Interestingly, the number of DEGs up-regulated was comparable at days 1, 4, and 7. In contrast, the number of DEGs down-regulated gradually increased from day 1 to day 7.
KEGG pathway analysis of DEGs post contusional SCI
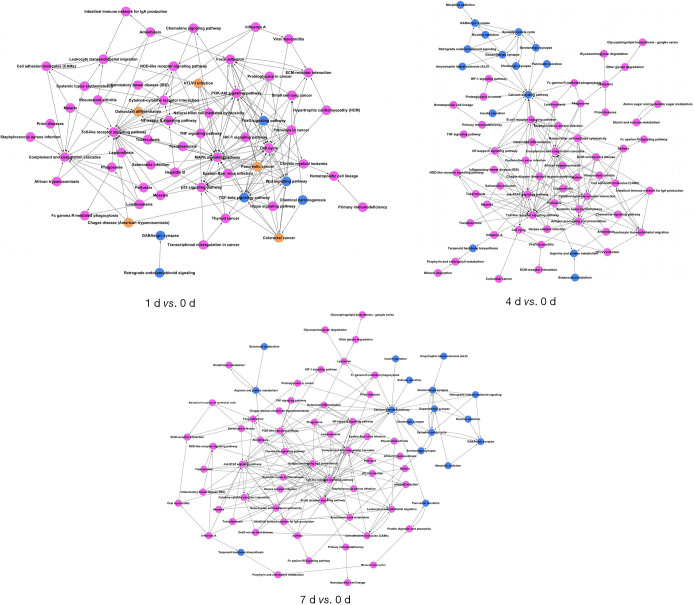
To investigate the major pathways composed of DEGs, we aligned all DEGs to KEGG pathways (Kegg for linking genomes to life and the environment) (Figure 2, https://cdn.amegroups.cn/static/public/10.21037atm-20-6519-2.pdf). The top three over-represented pathways were associated with cytokine-cytokine receptor interaction, tumor necrosis factor (TNF) signaling pathway, and cell cycle at day 1; lysosome, cytokine-cytokine receptor interaction, phagosome at day 4; and phagosome, lysosome, cytokine-cytokine receptor interaction at day 7 post injury (Figure 3). This pathway analysis suggested a transition from inflammatory responses to multiple forms of cell death processes from the acute to subacute stages post SCI.
Figure 2.
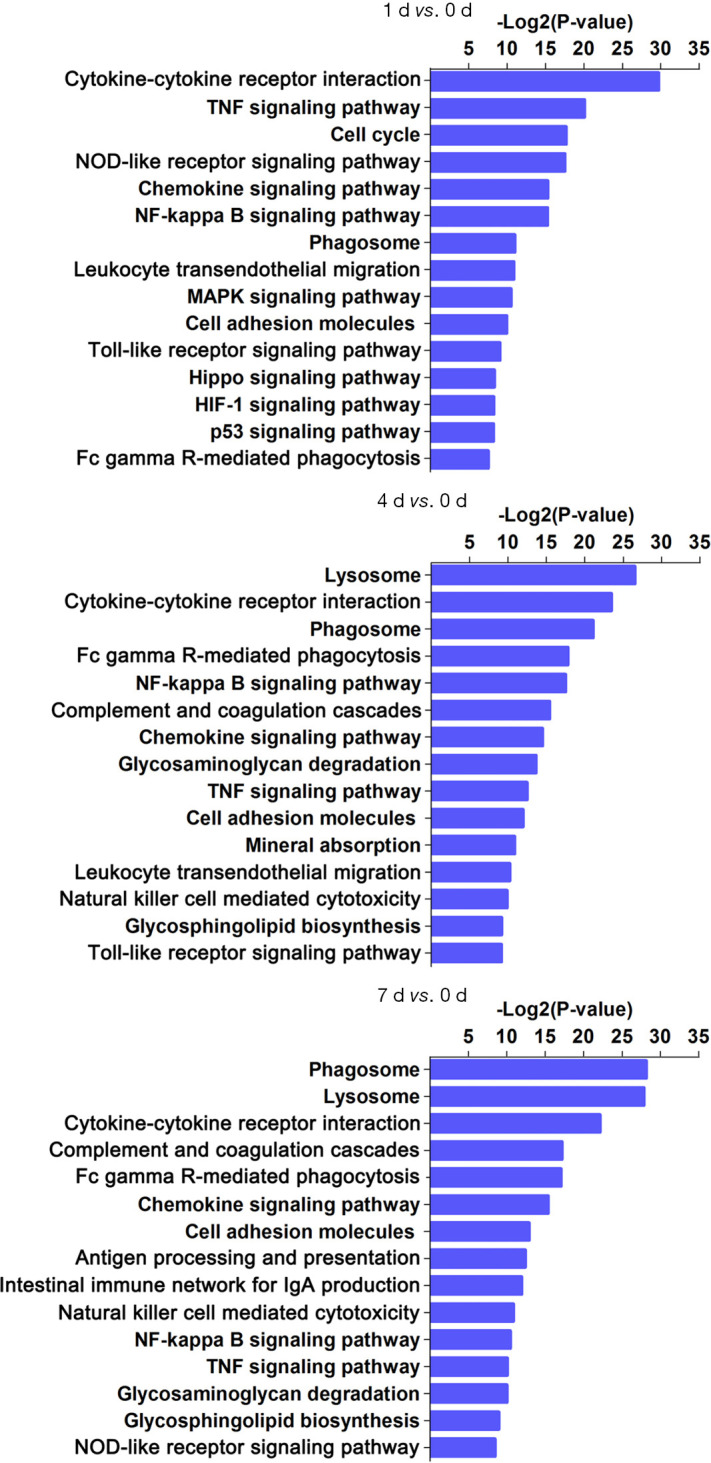
KEGG pathway analysis of differentially expressed genes at 1, 4, and 7 days post contusional spinal cord injury. The first 15 pathways composed of differentially expressed genes are presented for days 1, 4, and 7 post contusional spinal cord injury.
Figure 3.
Comparisons of co-expression network and identification of pathways. The magenta and blue nodes represent consensus up-regulated or down-regulated terms, in particular pathways, respectively. The yellow nodes represent both up-regulated and down-regulated terms identified in the same pathway.
Gene act network of DEGs post contusional SCI
We also sought to explore potential relationships among these DEGs. We established the gene act network of these DEGs based on known relationships, such as activation, inhibition, compound, expression, binding/association, and phosphorylation. In this gene act network, samples from three different time points share a large proportion of hub genes involved in the inflammation response (Figure 4). This result suggests that the inflammation response endures from the acute to subacute phase of SCI. Meanwhile, we identified uniquely enriched genes at each time point, such as Ccr1 and Nos2 at day 1 and Jak3, Mgst2, and Pla2g3 at days 4 and 7 post-injury (Figure 4, https://cdn.amegroups.cn/static/public/10.21037atm-20-6519-3.pdf).
Figure 4.
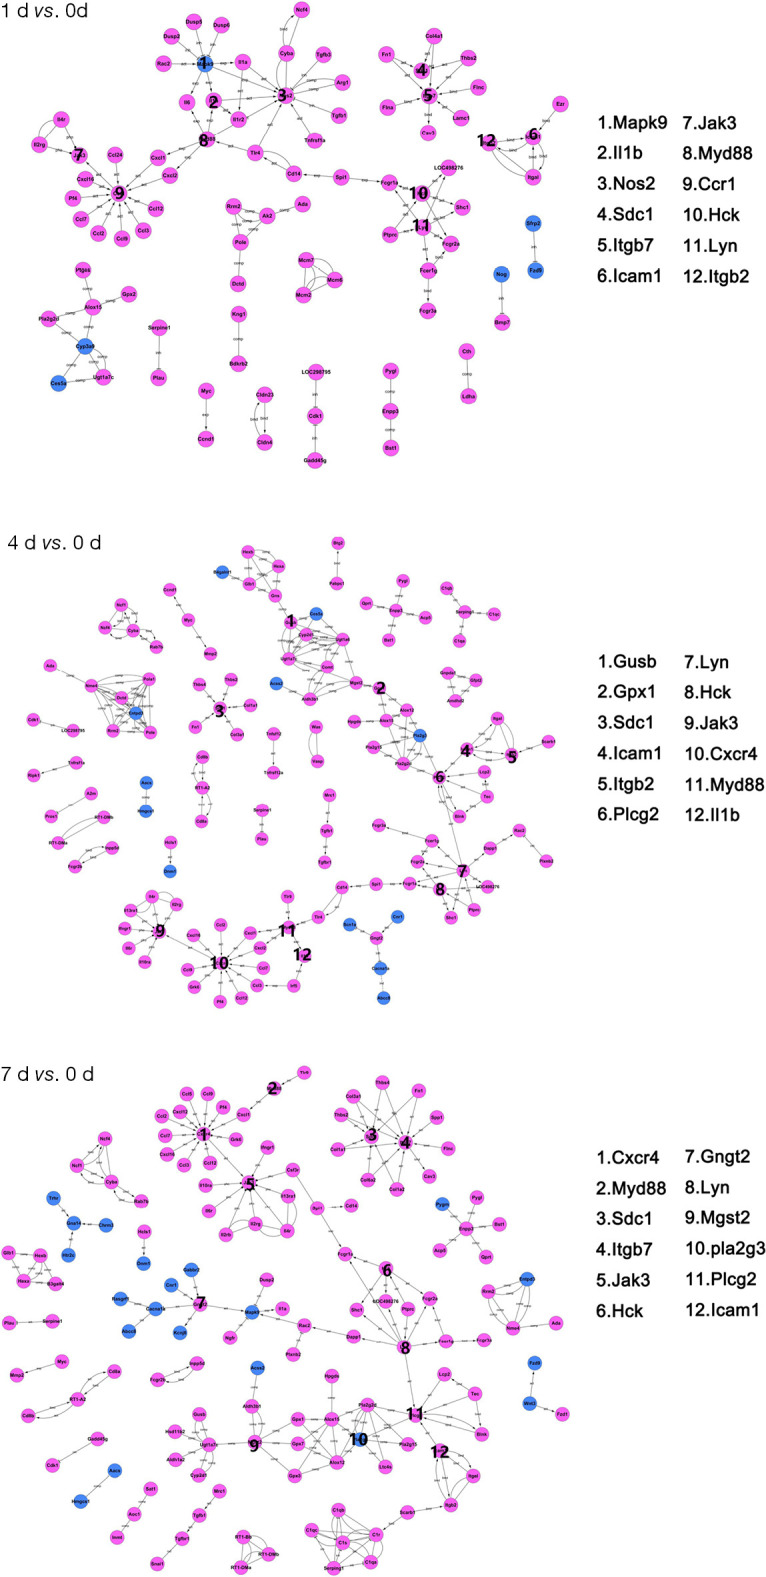
Gene act network analysis at 1, 4, and 7 days post contusional spinal cord injury. Blue nodes represent down-regulated differentially expressed genes; magenta nodes represent up-regulated differentially expressed genes. Activations and repressions are denoted by arrows and bars, respectively. The 12 genes with the most connections for each time point are listed on the right.
Validation of RNA-Seq data by qRT-PCR
In order to validate the RNA-seq data, 12 hub genes out of 20 genes with the highest degree in the DEGs act network were chosen from each group to determine changes during the acute/subacute phase of SCI by qRT-PCR. Our results showed high correlation efficiencies by linear regression analysis (r2=0.8034, 0.9227, and 0.8842 respectively) between the data obtained from qRT-PCR and RNA-Seq (Figure 5 and Figure S2), further supporting the reliability of our RNA-seq data.
Figure 5.
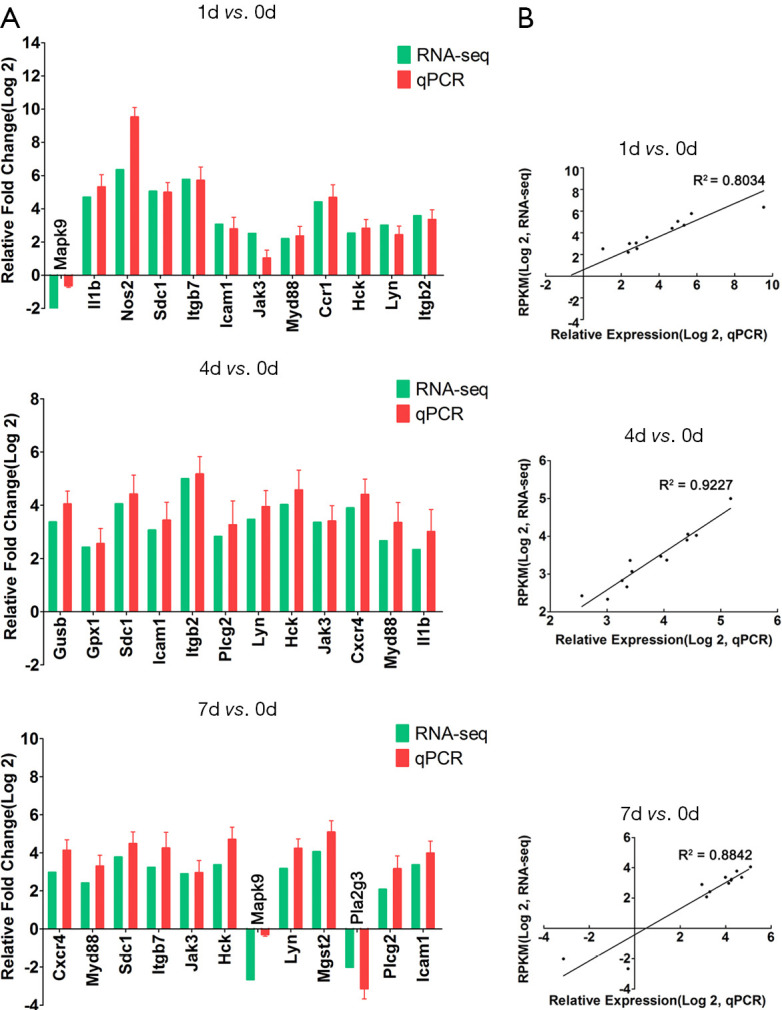
Correlation between qPCR verification and RNA-Seq data. Verification of RNA-Seq data. (A) The relative fold change of qPCR and RNA-Seq at different times, GAPDH is used as standardization; (B) the correlation between qPCR verification and RNA-Seq data at 1, 4, and 7 days after spinal cord injury.
Discussion
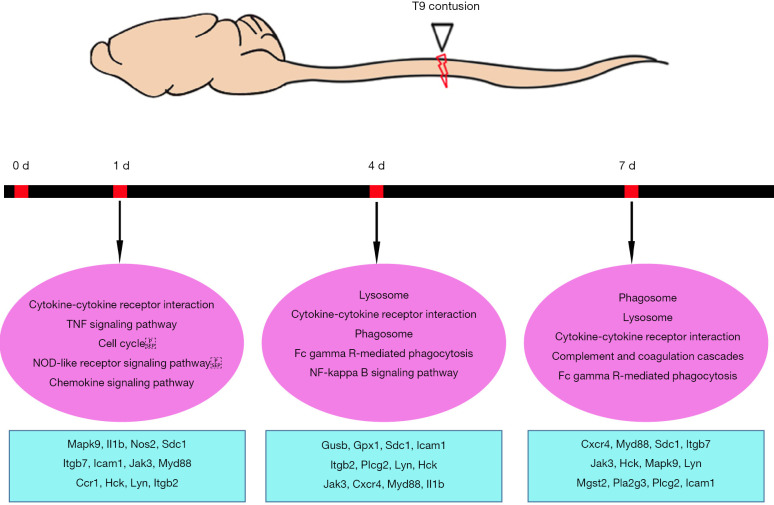
Multiple studies have focused on changes in RNA or protein expression in the injured spinal cord using transcriptomics or proteomics (13-17,23-26). Despite focusing on different injury models, these studies were performed at various time points post injury. Here, by reasoning three key time points according to various cellular events, our study sought to obtain a comprehensive view of the underlying molecular mechanisms at different stages of contusional SCI in rats. The schematic diagram of contusion SCI and the enriched typical differential genes and pathways are shown in Figure 6. By comparing and validating transcriptome changes at multiple time points post SCI, this study focused on large-scale transitions in signaling pathways and gene activation/deactivation at different stages post SCI.
Figure 6.
Summary of enriched pathways and differentially expressed genes post contusional spinal cord injury. Top: Schematic diagram of contusion spinal cord injury. Bottom: Enriched signaling pathways with selected differentially expressed genes at 1, 4, and 7 days post contusion spinal cord injury in rats.
While multiple signaling pathways related to inflammation stood out by KEGG analysis (Figure 2), the TNF signal transduction pathway showed continuous activation at all time points, with stronger activation in the early phase. It is well known that TNF serves as a major hub of reactive inflammation following SCI. TNF is involved in cellular response, metabolic processes, protein and receptor binding, and TNF signaling pathways (27). In addition, previous reports have shown that up-regulation of downstream substrates of the TNF pathway will evoke apoptosis of injured spinal cord neurons (28-30). Our data thus suggested that early intervention of the TNF signaling pathway might be an effective strategy to prevent spinal cord neuronal apoptosis. Additionally, our results showed that, even in the absence of a vascular system, the nuclear factor (NF)-kappaB pathway was immediately activated after SCI and remained active at different stages (Figure 2). The NF-kappaB pathway has long been considered a prototypical proinflammatory pathway, largely due to its role in promoting the expression of proinflammatory genes, including cytokines, chemokines, and adhesion molecules (31). In fact, NF-kappaB is an important regulator of cell survival and proliferation. The downstream gene products of NF-kappaB, including cIAP, BCL2, TRAF1/TRAF2, and superoxide dismutase, are important anti-apoptotic and survival proteins. NF-kappaB activates the expression of cyclin and c-myc and promotes growth, and it is also a factor that promotes cell proliferation. This suggests that neuronal cells play an autonomic repairing role after SCI (32). However, studies have also shown that the activation of the typical NF-kappaB pathway plays an important role in the immune response after SCI, including the production of cytokines, chemokines, and apoptosis-related factors, as well as the activation and infiltration of immune cells (33). Inhibiting the NF-kappaB pathway, by regulating the polarization of microglia, thereby reducing the inflammatory response, may lead to neuroprotection after SCI (34-36). The NF-kappaB pathway needs further research as a potential therapeutic target for clinical SCI.
The gene act network analysis revealed several key hub genes that might significantly contribute to SCI pathophysiology. For example, IL-1β was identified as a hub gene in the earlier stages (1 d and 4 d) post SCI. This is consistent with previous findings that showed that the expression of IL-1β is significantly higher in the lesion site compared with a normal site from 1 hour to at least 72 hours post-injury (37,38). As a major mediator of inflammation and a growth promoter for many cell types, IL-1β might play a deleterious role in SCI, since inhibiting IL-1β has protective effects on SCI (39,40). On the other hand, two key hub genes, Mgst2 and Pla2g3, were highlighted at the subacute phase, especially at 7 days post-injury (Figure 4).
Microsomal glutathione S-transferase 2 (MGST2), serves as a key catalyzer of the synthesis of leukotriene C4 (LTC4) (41), a pro-inflammatory mediator. Previous studies showed that the level of LTC4, along with other proinflammatory cytokines, is significantly increased post SCI and subsequently exacerbates the inflammation (42-44). Thus, a robust up-regulation of Mgst2 might account for excessive production of LTC4. In addition, group III phospholipase A2 (Pla2g3) is a member of secreted phospholipase A2s (sPla2). Post traumatic CNS injuries, increased release and activation of sPLa2 members will enhance the level of free fatty acids and their derivatives and ultimately cause oxidative stress, inflammation and abnormal pain (42,45). Interestingly, we discovered that Pla2g3 was down-regulated at 7 days post contusion injury. Such down-regulation might serve as a spontaneous anti-inflammatory mechanism. In future studies, we will first identify their expression changes in specific cell types and attempt to manipulate these two genes to investigate whether and how they might be involved in regulating SCI pathophysiology.
Conclusions
In conclusion, through a series of gene expression profile analyses, we revealed a continuous transformation from a more inflammatory to an apoptotic/self-repairing transcriptome following the time-course of SCI. Further investigation into the identified potential key pathways and genes will improve our understanding of this complex event and ultimately help establish effective ways to treat traumatic SCIs.
Supplementary
The article’s supplementary files as
Acknowledgments
Funding: This work was supported by the National Natural Science Foundation of China (81971170), the Social Development Fund of Nantong (JC2018063).
Ethical Statement: The authors are accountable for all aspects of the work in ensuring that questions related to the accuracy or integrity of any part of the work are appropriately investigated and resolved. All animal operations in this study was carried out according to the recommendations of Institutional Animal Care and Use Committee of Nantong University, China. Experiments were performed under a project license (No. S20200323-151) granted by ethics board of Nantong University, in compliance with national guidelines for the care and use of animals.
Footnotes
Reporting Checklist: The authors have completed the ARRIVE reporting checklist. Available at http://dx.doi.org/10.21037/atm-20-6519
Data Sharing Statement: Available at http://dx.doi.org/10.21037/atm-20-6519
Peer Review File: Available at http://dx.doi.org/10.21037/atm-20-6519
Conflicts of Interest: All authors have completed the ICMJE uniform disclosure form (available at http://dx.doi.org/10.21037/atm-20-6519). The authors have no conflicts of interest to declare.
References
- 1.Fischer I, Dulin JN, Lane MA. Transplanting neural progenitor cells to restore connectivity after spinal cord injury. Nat Rev Neurosci 2020;21:366-83. 10.1038/s41583-020-0314-2 [DOI] [PMC free article] [PubMed] [Google Scholar]
- 2.Ahuja CS, Nori S, Tetreault L, et al. Traumatic Spinal Cord Injury-Repair and Regeneration. Neurosurgery 2017;80:S9-S22. 10.1093/neuros/nyw080 [DOI] [PubMed] [Google Scholar]
- 3.Fleming JC, Norenberg MD, Ramsay DA, et al. The cellular inflammatory response in human spinal cords after injury. Brain 2006;129:3249-69. 10.1093/brain/awl296 [DOI] [PubMed] [Google Scholar]
- 4.Alizadeh A, Dyck SM, Karimi-Abdolrezaee S. Traumatic Spinal Cord Injury: An Overview of Pathophysiology, Models and Acute Injury Mechanisms. Front Neurol 2019;10:282. 10.3389/fneur.2019.00282 [DOI] [PMC free article] [PubMed] [Google Scholar]
- 5.David G, Mohammadi S, Martin AR, et al. Traumatic and nontraumatic spinal cord injury: pathological insights from neuroimaging. Nat Rev Neurol 2019;15:718-31. 10.1038/s41582-019-0270-5 [DOI] [PubMed] [Google Scholar]
- 6.Song YH, Agrawal NK, Griffin JM, et al. Recent advances in nanotherapeutic strategies for spinal cord injury repair. Adv Drug Deliv Rev 2019;148:38-59. 10.1016/j.addr.2018.12.011 [DOI] [PMC free article] [PubMed] [Google Scholar]
- 7.David S, Kroner A. Repertoire of microglial and macrophage responses after spinal cord injury. Nat Rev Neurosci 2011;12:388-99. 10.1038/nrn3053 [DOI] [PubMed] [Google Scholar]
- 8.Yiu G, He Z. Glial inhibition of CNS axon regeneration. Nat Rev Neurosci 2006;7:617-27. 10.1038/nrn1956 [DOI] [PMC free article] [PubMed] [Google Scholar]
- 9.Devanney NA, Stewart AN, Gensel JC. Microglia and macrophage metabolism in CNS injury and disease: The role of immunometabolism in neurodegeneration and neurotrauma. Exp Neurol 2020;329:113310. 10.1016/j.expneurol.2020.113310 [DOI] [PMC free article] [PubMed] [Google Scholar]
- 10.Schwab JM, Brechtel K, Mueller CA, et al. Experimental strategies to promote spinal cord regeneration--an integrative perspective. Prog Neurobiol 2006;78:91-116. 10.1016/j.pneurobio.2005.12.004 [DOI] [PubMed] [Google Scholar]
- 11.Silver J, Schwab ME, Popovich PG. Central nervous system regenerative failure: role of oligodendrocytes, astrocytes, and microglia. Cold Spring Harb Perspect Biol 2014;7:a020602. 10.1101/cshperspect.a020602 [DOI] [PMC free article] [PubMed] [Google Scholar]
- 12.Schwab ME, Strittmatter SM. Nogo limits neural plasticity and recovery from injury. Curr Opin Neurobiol 2014;27:53-60. 10.1016/j.conb.2014.02.011 [DOI] [PMC free article] [PubMed] [Google Scholar]
- 13.Chen K, Deng S, Lu H, et al. RNA-seq characterization of spinal cord injury transcriptome in acute/subacute phases: a resource for understanding the pathology at the systems level. PLoS One 2013;8:e72567. 10.1371/journal.pone.0072567 [DOI] [PMC free article] [PubMed] [Google Scholar]
- 14.Shi LL, Zhang N, Xie XM, et al. Transcriptome profile of rat genes in injured spinal cord at different stages by RNA-sequencing. BMC Genomics 2017;18:173. 10.1186/s12864-017-3532-x [DOI] [PMC free article] [PubMed] [Google Scholar]
- 15.Yu B, Yao C, Wang Y, et al. The Landscape of Gene Expression and Molecular Regulation Following Spinal Cord Hemisection in Rats. Front Mol Neurosci 2019;12:287. 10.3389/fnmol.2019.00287 [DOI] [PMC free article] [PubMed] [Google Scholar]
- 16.Duan H, Ge W, Zhang A, et al. Transcriptome analyses reveal molecular mechanisms underlying functional recovery after spinal cord injury. Proc Natl Acad Sci U S A 2015;112:13360-5. 10.1073/pnas.1510176112 [DOI] [PMC free article] [PubMed] [Google Scholar]
- 17.Le TT, Savitz J, Suzuki H, et al. Identification and replication of RNA-Seq gene network modules associated with depression severity. Transl Psychiatry 2018;8:180. 10.1038/s41398-018-0234-3 [DOI] [PMC free article] [PubMed] [Google Scholar]
- 18.Zhu Y, Lyapichev K, Lee DH, et al. Macrophage Transcriptional Profile Identifies Lipid Catabolic Pathways That Can Be Therapeutically Targeted after Spinal Cord Injury. J Neurosci 2017;37:2362-76. 10.1523/JNEUROSCI.2751-16.2017 [DOI] [PMC free article] [PubMed] [Google Scholar]
- 19.Whetstone WD, Hsu JY, Eisenberg M, et al. Blood-spinal cord barrier after spinal cord injury: relation to revascularization and wound healing. J Neurosci Res 2003;74:227-39. 10.1002/jnr.10759 [DOI] [PMC free article] [PubMed] [Google Scholar]
- 20.Kanehisa M, Araki M, Goto S, et al. KEGG for linking genomes to life and the environment. Nucleic Acids Res 2008;36:D480-4. 10.1093/nar/gkm882 [DOI] [PMC free article] [PubMed] [Google Scholar]
- 21.Draghici S, Khatri P, Tarca AL, et al. A systems biology approach for pathway level analysis. Genome Res 2007;17:1537-45. 10.1101/gr.6202607 [DOI] [PMC free article] [PubMed] [Google Scholar]
- 22.Shannon P, Markiel A, Ozier O, et al. Cytoscape: a software environment for integrated models of biomolecular interaction networks. Genome Res 2003;13:2498-504. 10.1101/gr.1239303 [DOI] [PMC free article] [PubMed] [Google Scholar]
- 23.Yan X, Liu J, Luo Z, et al. Proteomic profiling of proteins in rat spinal cord induced by contusion injury. Neurochem Int 2010;56:971-83. 10.1016/j.neuint.2010.04.007 [DOI] [PubMed] [Google Scholar]
- 24.Moghieb A, Bramlett HM, Das JH, et al. Differential Neuroproteomic and Systems Biology Analysis of Spinal Cord Injury. Mol Cell Proteomics 2016;15:2379-95. 10.1074/mcp.M116.058115 [DOI] [PMC free article] [PubMed] [Google Scholar]
- 25.E Hirbec H , Noristani HN, Perrin FE. Microglia Responses in Acute and Chronic Neurological Diseases: What Microglia-Specific Transcriptomic Studies Taught (and did Not Teach) Us. Front Aging Neurosci 2017;9:227. 10.3389/fnagi.2017.00227 [DOI] [PMC free article] [PubMed] [Google Scholar]
- 26.Noristani HN, Gerber YN, Sabourin JC, et al. RNA-Seq Analysis of Microglia Reveals Time-Dependent Activation of Specific Genetic Programs following Spinal Cord Injury. Front Mol Neurosci 2017;10:90. 10.3389/fnmol.2017.00090 [DOI] [PMC free article] [PubMed] [Google Scholar]
- 27.Zhu W, Chen X, Ning L, et al. Network Analysis Reveals TNF as a Major Hub of Reactive Inflammation Following Spinal Cord Injury. Sci Rep 2019;9:928. 10.1038/s41598-018-37357-1 [DOI] [PMC free article] [PubMed] [Google Scholar]
- 28.Yoshizaki S, Kijima K, Hara M, et al. Tranexamic acid reduces heme cytotoxicity via the TLR4/TNF axis and ameliorates functional recovery after spinal cord injury. J Neuroinflammation 2019;16:160. 10.1186/s12974-019-1536-y [DOI] [PMC free article] [PubMed] [Google Scholar]
- 29.Sun G, Yang S, Cao G, et al. γδ T cells provide the early source of IFN-γ to aggravate lesions in spinal cord injury. J Exp Med 2018;215:521-35. 10.1084/jem.20170686 [DOI] [PMC free article] [PubMed] [Google Scholar]
- 30.Kroner A, Greenhalgh AD, Zarruk JG, et al. TNF and increased intracellular iron alter macrophage polarization to a detrimental M1 phenotype in the injured spinal cord. Neuron 2014;83:1098-116. 10.1016/j.neuron.2014.07.027 [DOI] [PubMed] [Google Scholar]
- 31.Lawrence T. The nuclear factor NF-kappaB pathway in inflammation. Cold Spring Harb Perspect Biol 2009;1:a001651. 10.1101/cshperspect.a001651 [DOI] [PMC free article] [PubMed] [Google Scholar]
- 32.Shao X. Protective Role of NF-κB in Inflammatory Demyelination. J Neurosci 2018;38:2416-7. 10.1523/JNEUROSCI.3286-17.2018 [DOI] [PMC free article] [PubMed] [Google Scholar]
- 33.Karova K, Wainwright JV, Machova-Urdzikova L, et al. Transplantation of neural precursors generated from spinal progenitor cells reduces inflammation in spinal cord injury via NF-κB pathway inhibition. J Neuroinflammation 2019;16:12. 10.1186/s12974-019-1394-7 [DOI] [PMC free article] [PubMed] [Google Scholar]
- 34.Chen S, Ye J, Chen X, et al. Valproic acid attenuates traumatic spinal cord injury-induced inflammation via STAT1 and NF-κB pathway dependent of HDAC3. J Neuroinflammation 2018;15:150. 10.1186/s12974-018-1193-6 [DOI] [PMC free article] [PubMed] [Google Scholar]
- 35.Li XQ, Yu Q, Chen FS, et al. Inhibiting aberrant p53-PUMA feedback loop activation attenuates ischaemia reperfusion-induced neuroapoptosis and neuroinflammation in rats by downregulating caspase 3 and the NF-κB cytokine pathway. J Neuroinflammation 2018;15:250. 10.1186/s12974-018-1271-9 [DOI] [PMC free article] [PubMed] [Google Scholar]
- 36.Fan H, Tang HB, Shan LQ, et al. Quercetin prevents necroptosis of oligodendrocytes by inhibiting macrophages/microglia polarization to M1 phenotype after spinal cord injury in rats. J Neuroinflammation 2019;16:206. 10.1186/s12974-019-1613-2 [DOI] [PMC free article] [PubMed] [Google Scholar]
- 37.Wang XF, Huang LD, Yu PP, et al. Upregulation of type I interleukin-1 receptor after traumatic spinal cord injury in adult rats. Acta Neuropathol 2006;111:220-8. 10.1007/s00401-005-0016-x [DOI] [PubMed] [Google Scholar]
- 38.Smith PD, Puskas F, Meng X, et al. The evolution of chemokine release supports a bimodal mechanism of spinal cord ischemia and reperfusion injury. Circulation 2012;126:S110-7. 10.1161/CIRCULATIONAHA.111.080275 [DOI] [PubMed] [Google Scholar]
- 39.Chen YQ, Wang SN, Shi YJ, et al. CRID3, a blocker of apoptosis associated speck like protein containing a card, ameliorates murine spinal cord injury by improving local immune microenvironment. J Neuroinflammation 2020;17:255. 10.1186/s12974-020-01937-8 [DOI] [PMC free article] [PubMed] [Google Scholar]
- 40.Rong Y, Liu W, Wang J, et al. Neural stem cell-derived small extracellular vesicles attenuate apoptosis and neuroinflammation after traumatic spinal cord injury by activating autophagy. Cell Death Dis 2019;10:340. 10.1038/s41419-019-1571-8 [DOI] [PMC free article] [PubMed] [Google Scholar]
- 41.Ahmad S, Niegowski D, Wetterholm A, et al. Catalytic characterization of human microsomal glutathione S-transferase 2: identification of rate-limiting steps. Biochemistry 2013;52:1755-64. 10.1021/bi3014104 [DOI] [PubMed] [Google Scholar]
- 42.Titsworth WL, Liu NK, Xu XM. Role of secretory phospholipase a(2) in CNS inflammation: implications in traumatic spinal cord injury. CNS Neurol Disord Drug Targets 2008;7:254-69. 10.2174/187152708784936671 [DOI] [PMC free article] [PubMed] [Google Scholar]
- 43.Mitsuhashi T, Ikata T, Morimoto K, et al. Increased production of eicosanoids, TXA2, PGI2 and LTC4 in experimental spinal cord injuries. Paraplegia 1994;32:524-30. [DOI] [PubMed] [Google Scholar]
- 44.Jacobs TP, Shohami E, Baze W, et al. Thromboxane and 5-HETE increase after experimental spinal cord injury in rabbits. Cent Nerv Syst Trauma 1987;4:95-118. 10.1089/cns.1987.4.95 [DOI] [PubMed] [Google Scholar]
- 45.Lucas KK, Svensson CI, Hua XY, et al. Spinal phospholipase A2 in inflammatory hyperalgesia: role of group IVA cPLA2. Br J Pharmacol 2005;144:940-52. 10.1038/sj.bjp.0706116 [DOI] [PMC free article] [PubMed] [Google Scholar]
Associated Data
This section collects any data citations, data availability statements, or supplementary materials included in this article.
Supplementary Materials
The article’s supplementary files as


