Abstract
In the present study, the effect of different kinds of impellers with different baffles or no baffle was investigated. Up-pumping pitched blade turbine (PBTU) and Rushton turbine (RT) were the two types of impellers tested. The reactor was equipped with different designs of baffles: full, half and surface baffles, or no baffles. Single (PBTU or RT) and dual (PBTU/PBTU or RT/RT) use of impellers with full (FB), half (HB), surface (SB), and no baffle (NB) combinations formed two sets of 16 experiments. The first group of experiments was close to the equilibrium line (P = 26.5 bars and T = 8.5 °C), and the second group was deep in the equilibrium line (P = 24.5 bars and T = 2 °C). There was estimation of rate of hydrate formation, induction time, hydrate productivity, overall power consumption, split fraction, and separation factor. In both single and dual impellers, the results showed that RT experiments are better compared to PBTU in the rate of hydrate formation. The induction time is almost the same because we are deep in the equilibrium line while, hydrate productivity values are higher in PBTU compared to RT experiments. As a general view, RT experiments consume more energy compared to PBTU experiments.
1. Introduction
Clathrate hydrates are crystalline solid compounds composed of hydrogen-bonded water molecules (host molecules) and some other gas species (guest molecules). There are three gas hydrate structures. Structure I (sI) and structure II (sII) are cubic and structure H (sH) is hexagonal and their characterization is because of the magnitude of guest molecule.1 CH4, C2H6, and CO2 create sI hydrate, while C3H8 and iso-C4H10 tend to create sII hydrate like the smaller molecules of N2 and H2. In structures sI and sII, the main building block is the pentagonal dodecahedron (512 cage), while the additional two types of cages are 51262 and 51264. In structure sI hydrates, two 512 cages are divided by bridging water molecules and they create 51262 cages. On the other side, in sII hydrates, 512 cages distribute the faces, and concluded gaps are accomplished by producing 51264 cages. The structure H is formed by 3 small 512 cages, two small 12-hedra 435663 cavities, and one big 18-hedra 51268 cage.1−4,12
Hammerschmidt for the first time in 1934 observed that natural gas pipelines were blocked by hydrate formation instead of ice that was a general belief of that era.5 As methane hydrates are able to comprise between 150 and 180 v/v at standard temperature and pressure conditions, they provide distinct gas storage characteristics. Such research was conducted for the first time by Gudmundsson et al.6,7 in the early 1990s; then, various scholars have published results in this area of research.8−11 Gas hydrates have many considerable applications such as in energy storage,12−16 energy transport,17−19 cold energy storage,20,21 gas separation,22−25 CO2 sequestration26,27 and desalination implementations.28−30
Stirring reactors are widely used from many researchers in studies such as formation and dissociation of gas hydrates.31−34 Among several other factors to make the storage and transportation of gas in hydrate form, hydrate formation rate has crucial importance. The faster formation of hydrates in a hydrate forming reactor can play important role on the economics of operation. Good mixing of hydrate forming components (gas and water) can accelerate the formation process. This can partly be achieved by correct selection of tank interiors. The scope of the experimental process is to investigate the impact of flow conditions on methane-propane hydrate formation by using different types of impellers with different or no baffles.
2. Experimental Process
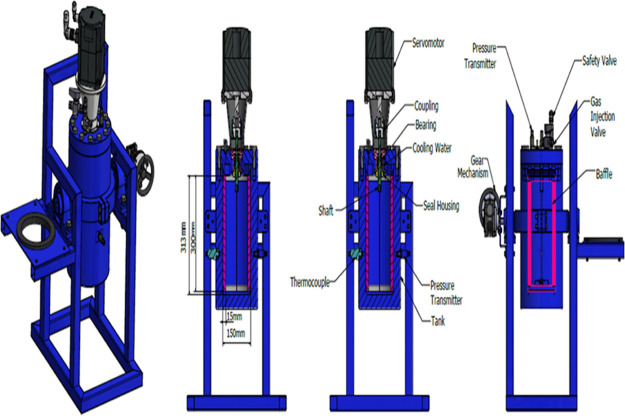
A novel apparatus of internal volume of 5.7 L has been designed and built to carry out studies on the scale up of gas hydrate formation. A schematic diagram of it is shown in Figure 1. The reactor has been designed to maximize interfacial area between reactants, thus minimizing mass transfer barriers and thermal effects that negatively affect conversion of reactants into hydrate. Gas is supplied by gas bottles through a pressure-reducing valve that provides adjustment of the pressure to the gas injection line. Mixing is supplied by a servomotor type of High Inertia (permanent-magnet synchronous motor Siemens model SIMOTICS S-1FL6). The high-pressure cylindrical AISI 316L stainless steel vessel has an internal diameter of 150 mm and an internal length of 312 mm. It has been designed for pressure values up to 150 bars and provided with a safety valve. In order to avoid friction heat because of rotational speed of impellers, cooling water is circulated around the shaft of the motor. The flow rate of the refrigerated cooling bath (WCL-P12) is 12 L/min. The cooling medium is distillated water.
Figure 1.
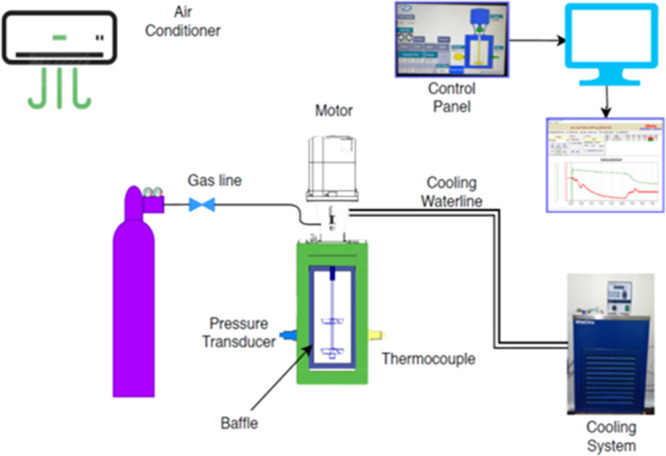
Flow chart of the experimental procedure with a full baffle and dual PBT impeller.
The temperature of the refrigerated cooling bath was measured by a thermocouple inside of the bath. Two AISI 316L stainless steel flange are used to seal the reactor. One flange has appropriate ports for access to the interior. The five ports (3 on flange and two on the body of the reactor) are used for supplying gas and measuring temperature and pressure. The temperature sensors are mineral-insulated type TW/T (Threaded Type Thermowells) with accuracy (±0.2%), and the temperature inside in the middle part of the vessel is measured. The piezoresistive pressure sensors (Keller Series 21 Y) gives digital output with accuracy ±0.25FS %. The gas inlet line is equipped with a gas pressure regulator with an accuracy of 0.6. Gas is supplied by gas bottles through a pressure-reducing valve that provides adjustment of the pressure to the gas injection line. Voltage signals from pressure transducers and temperature sensors are collected by a PLC unit (software) for data acquisition on a personal computer. The shaft and baffle are made by steel AISI 316L and AISI 304 equivalently, while the impellers are made by acrylonitrile butadiene styrene plastic. Figure 2 presents the cross-sectional design of our reactor.
Figure 2.
Cross-sectional design of the reactor.
Gas is supplied by gas bottles through a pressure-reducing valve that provides adjustment of the pressure to the gas injection line. The volume of water is 2.65 L for single impellers. The room temperature is above 10 °C and after feeding with the gas, we put the room temperature to −5 °C until the temperature of our reactor reaches the 8.5 °C (near the equilibrium line) or 2 °C (deep in the equilibrium line). The rotation process starts when the temperature is 8.5 °C and the pressure is 26.5 bar or when the temperature is 2 °C and the pressure is 24.5 bars, while we also increase the temperature of the cold room to from −5 to 0 °C (we increase temperature of the room to stabilize the temperature of tank when rotation starts, because if we do not increase the temperature of room, the tank temperature will decrease and hydrates will be formed without rotation). The rotational period and our measurements are taken for a period of up to 3 h after the induction time (first nuclei of gas hydrates). At the end of each hydrate formation experiment of the gas mixture, the composition of free gas was determined by taking gas samples in sampling tubes aiming to quantify the fractionation of gas components. Gas composition analyses were carried out at Petroleum Research Center Gas Analysis Laboratory by using Agilent 6890 series GC.
3. Interpretation of Raw Data
3.1. Gas Consumption Rate
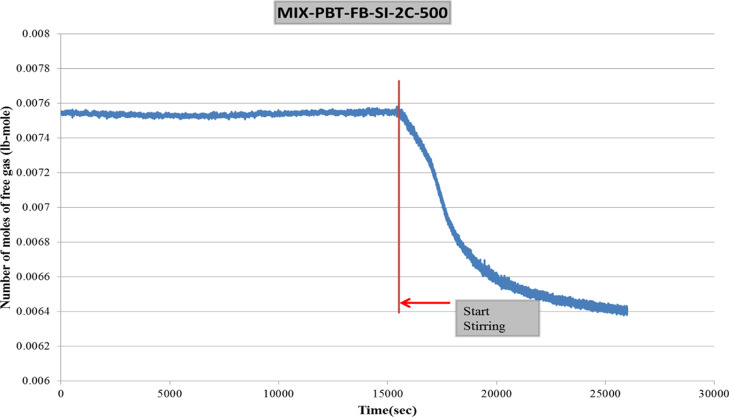
The main objective of this study is to investigate the effect of different impeller—baffle configurations on hydrate formation kinetics. Therefore, a tool must be devised to extract the kinetic data from raw experimental data. Application of real gas law (PV = znRT) for each data point with known pressure, temperature, and free gas volume gives the change in number of moles of free gas with time together with a compressibility factor (Z) by the use of Lee and Kesler’s (1975) compressibility factor expression (FORTRAN program).35 A sample plot of change in free gas number of moles is given in Figure 3 for CH4–C3H8–SI-PBT-FB.
Figure 3.
Change in number of moles of free gas in the CH4–C3H8-PBT-FB-SI-2C experiment.
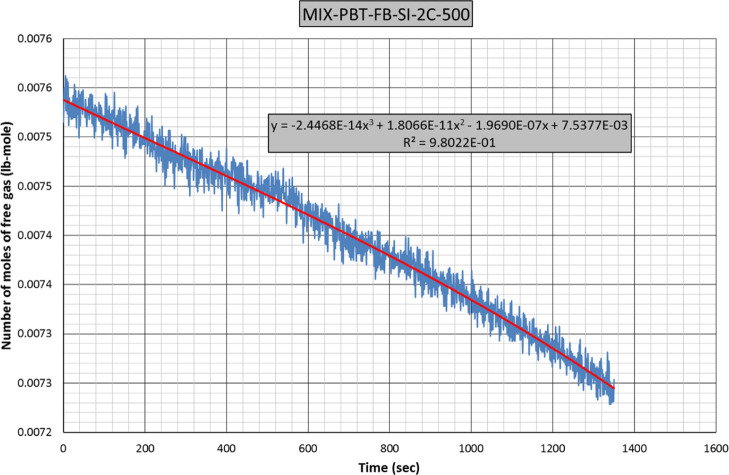
Figure 4 is plotted with the same data of Figure 3 but covering only the hydrate formation period. A third-order polynomial fit of experimental data results with eq 1.
| 1 |
where n = number of moles of free gas, lb mol, and t = time, s.
Figure 4.
Gas consumption rate eq (2C = 2 celsius).
The derivative of eq 1 results with the gas consumption rate (eq 2) which can be considered as the hydrate formation rate.
| 2 |
where −dn/dt = gas consumption rate, lb mol/s, and t = time, s.
Comparison of gas consumption rates of different experiments will be done by utilizing gas consumption rate equations (eq 2 is an example) with four different time values, namely, 1, 600, 1200, and 1800 s. Table 1 presents the gas consumption rates of experiment CH4–C3H8–SI-PBT-FB, as an example.
Table 1. Gas Consumption Rates of Experiment CH4–C3H8–SI-PBT-FB.
| time (s) | 1 | 600 | 1200 | 1800 |
| gas consumption rate (lb mol/s) | –1.78 × 10⁻⁷ | –1.30 × 10⁻⁷ | –7.50 × 10⁻⁸ | –1.35 × 10⁻⁸ |
3.2. Overall Power Consumption
Power consumption was calculated based on the torque measured every second based on the following equation
| 3 |
(Chapple et al.), where Tq is the Torque in N m and N is the rotational speed in rps and power consumption is in watt.
The power consumption at every second over the duration of hydrate formation for each experiment was summed to obtain overall power consumption during the experiment. The duration for the calculation of overall power consumption is the sum of the induction time of a given experiment and the hydrate formation duration of the experiment with the shortest duration.36
3.3. Hydrate Productivity
Hydrate productivity is defined by the formula
| 4 |
(Inkong et al.), where Vwater is the volume of water (L) in the reactor and R30 is the rate of hydrate growth (mol·s–1) calculated by fitting the gas uptake because of hydrate growth versus time for the first 30 min after the induction time.37
3.4. Split Fraction
Split fraction (S.Fr) given in eqs 5 and 6 is used to quantify the partition of hydrate-forming gases in free gas and solid-hydrate phases. The split fraction of methane is calculated as follows
| 5 |
(Linga et al.), where  is the number of moles of methane in feed
gas and
  is the number of moles of methane in hydrate
phase at the end of the experiment.
Similarly, the split fraction (S.Fr.) of propane is calculated as follows
| 6 |
(Linga et al.), where  is the number of moles of propane in feed
gas and
  is the number of moles of propane in hydrate
phase at the end of the experiment.38
3.5. Separation Fraction
Natural gas hydrates are frequently used to separate gas components of given gas mixtures owing to the fact that those separated components either consumed more into the hydrate structure than the other components of the mixture, or they do not go into the hydrate structure at all. In this study, the mixture that is used to form hydrates are both hydrate formers but it is known from literature that propane is consumed more compared to methane. Because the studied gas is rich in methane, it was decided to analyze how propane is separated from the mixture depending on the experimental conditions. Equation 7 is utilized to calculate the separation factor of propane (S.FC3H8).
| 7 |
(Linga
et al.), where  is the number of moles of methane in the
gas phase at the end of hydrate formation,
  is the number of moles of propane in the
gas phase at the end of the hydrate formation, and
  is the number of moles of propane in the
hydrate phase.38
4. Results and Discussion
Table 2 summarizes the results of single impeller, methane–propane mixture experiments. The following findings are drawn from Table 2: except in one experiment [Rushton turbine (RT)—half baffle], hydrate formatin started almost immediately after the start of stirring (very short induction times). Duration of hydrate formation was always shorter than 3 h in experiments with higher experimental temperature (8.5 °C). This is attributed to the lower driving force. Furthermore, experiments with RT last shorter compared to experiments with pumping pitched blade turbine (PBTU). Experiments with low experimental temperature (2 °C) and PBTU-type impeller had hydrate formation durations longer than 3 h, while the change in the impeller type from PBTU to RT resulted with shortening of hydrate formation duration.
Table 2. Summary of the Results of Single Impeller (SI) Experimentsa.
| system | Pexp (bars) | T (°C) | bdriving force (°C) | duration of hydrate formation | induction time (min) | <keep-together>S.FrCH4</keep-together> | <keep-together>S.FrC3H8</keep-together> | <keep-together>S.FC3H8</keep-together> |
|---|---|---|---|---|---|---|---|---|
| SI-PBT-FB | 26.5 | 8.5 | 8.5 | 2 h-30 min | 1 | 0.043 | 0.286 | 8.85 |
| SI-PBT-HB | 26.5 | 8.5 | 8.5 | 1 h-49 min | 1 | 0.040 | 0.250 | 8.02 |
| SI-PBT-SB | 26.5 | 8.5 | 8.5 | 1 h-59 min | 1 | 0.061 | 0.549 | 18.73 |
| SI-PBT-NB | 26.5 | 8.5 | 8.5 | 2 h-7 min | 1 | 0.053 | 0.397 | 11.83 |
| SI-RT-FB | 26.5 | 8.5 | 8.5 | 1 h-32 min | 1 | 0.094 | 0.606 | 14.75 |
| SI-RT-HB | 26.5 | 8.5 | 8.5 | 1 h-23 min | 1 | 0.100 | 0.630 | 15.28 |
| SI-RT-SB | 26.5 | 8.5 | 8.5 | 1 h-22 min | 1 | 0.041 | 0.518 | 25.16 |
| SI-RT-NB | 26.5 | 8.5 | 8.5 | 1 h-47 min | 1 | 0.054 | 0.451 | 14.52 |
| SI-PBT-FB | 24.5 | 2 | 16 | 3 h | 1 | 0.114 | 0.870 | 52.41 |
| SI-PBT-HB | 24.5 | 2 | 16 | 3 h | 2 | 0.114 | 0.884 | 59.23 |
| SI-PBT-SB | 24.5 | 2 | 16 | 3 h | 3 | 0.110 | 0.889 | 64.77 |
| SI-PBT-NB | 24.5 | 2 | 16 | 3 h | 2 | 0.120 | 0.887 | 57.40 |
| SI-RT-FB | 24.5 | 2 | 16 | 1 h-20 min | 1 | 0.129 | 0.848 | 37.67 |
| SI-RT-HB | 24.5 | 2 | 16 | 1 h-31 min | 27 | 0.099 | 0.860 | 56.23 |
| SI-RT-SB | 24.5 | 2 | 16 | 54 min | 1 | 0.133 | 0.886 | 50.74 |
| SI-RT-NB | 24.5 | 2 | 16 | 1 h-7 min | 1 | 0.131 | 0.854 | 38.71 |
Stirring is started at different pressure and temperature conditions with two different driving forces.
Driving force = Texp – Teq.
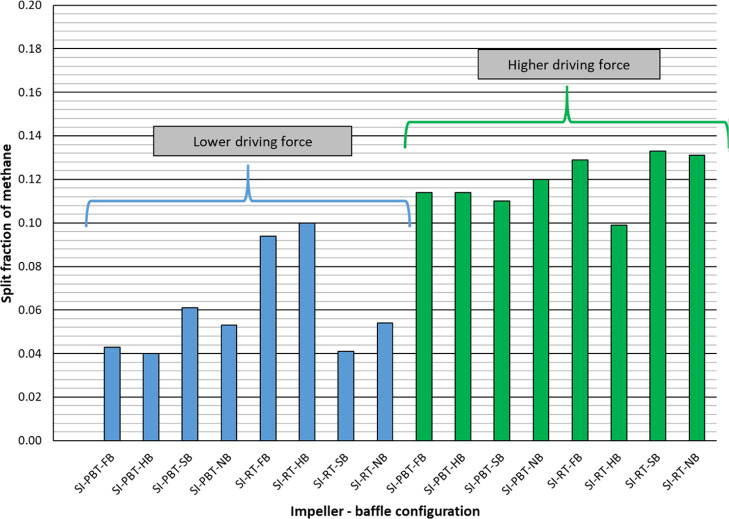
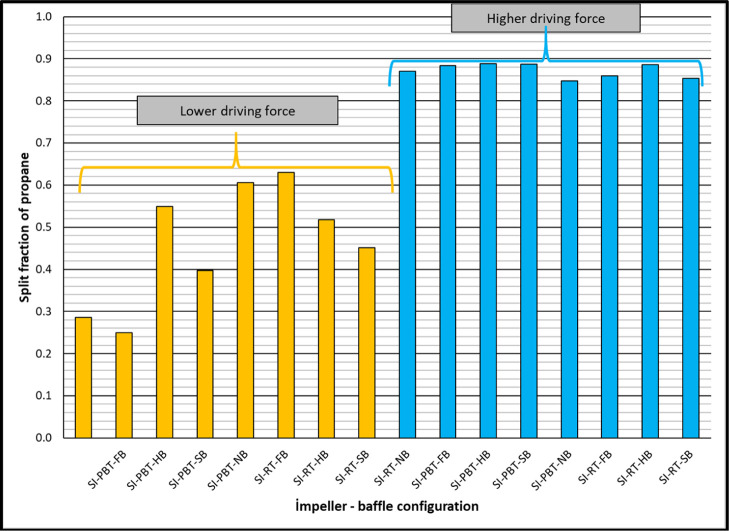
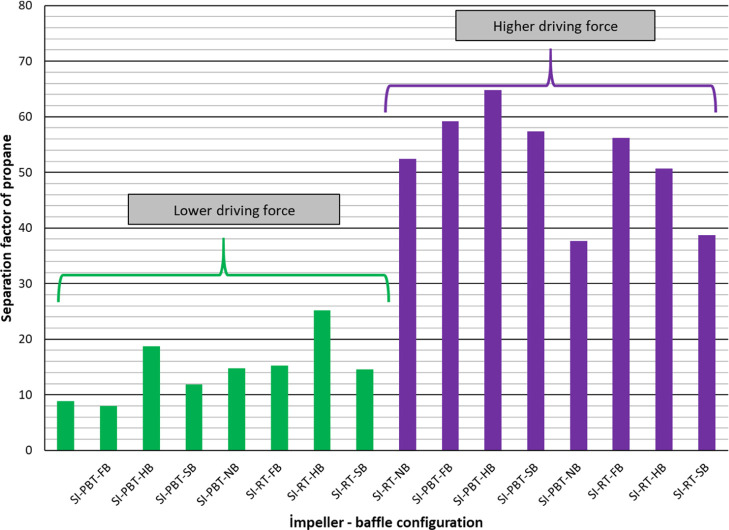
Split fraction values of methane are relatively low (between 0.040 and 0.133) indicating that a higher percentage of methane in the original gas still remains in free gas phase. On the other hand, the split fraction of methane values are high in the case of higher driving force (Figure 5). Split fraction values of propane are much higher compared to the split fraction values of methane, as expected. Again, higher driving force resulted with higher split fraction for propane (Figure 6) as high as 0.889 (almost 90% of propane consumed for hydrate production). Final parameter to be discussed in Table 2 is the separation factor of propane. Depending on experimental conditions, propane separated from the mixture with a factor between 8 and 64 compared to methane. The higher the driving force, the better the separation of propane from the mixture (Figure 7).
Figure 5.
Split fraction of methane of single impeller mixture hydrate experiments.
Figure 6.
Split fraction of propane of single impeller mixture hydrate experiments.
Figure 7.
Separation factor of propane of single impeller mixture hydrate experiments.
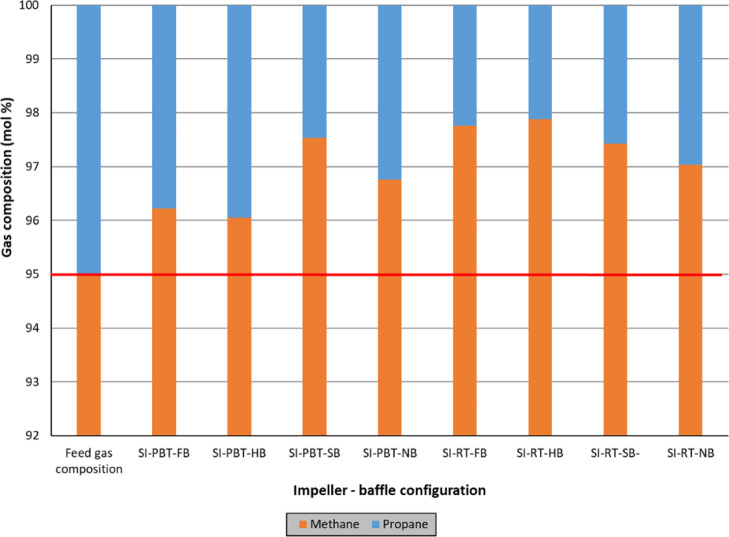
Discussion on split fractions and separation factor of propane clearly indicates the change in the composition of hydrate-forming gas as hydrate formation progresses. In order to quantify this phenomenon, chromatographic analysis of gas samples after hydrate formation are plotted on Figures 8 and 9. Arithmetic average of free gas compositions at the end of single impeller experiments with lower driving force is 97.08% methane and 2.92% propane (Figure 8), indicating an increase in methane mole percentage compared to feed gas composition.
Figure 8.
Composition of feed gas and free gas at the end of single impeller experiments (lower driving force).
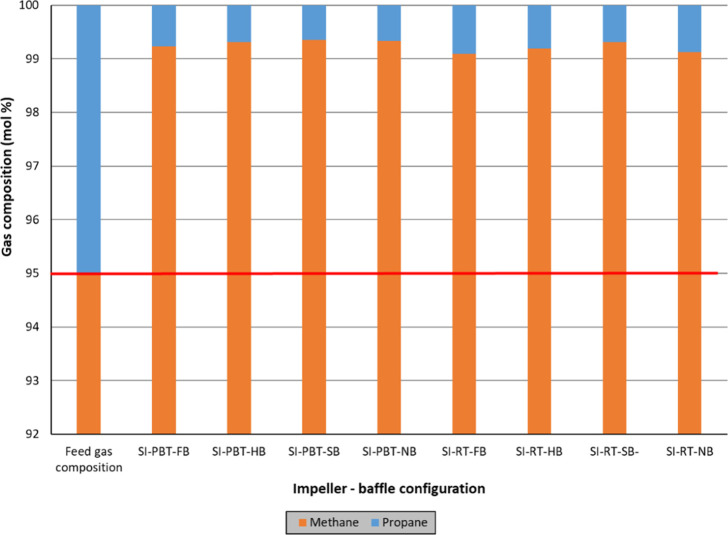
Figure 9.
Composition of feed gas and free gas at the end of single impeller experiments (higher driving force).
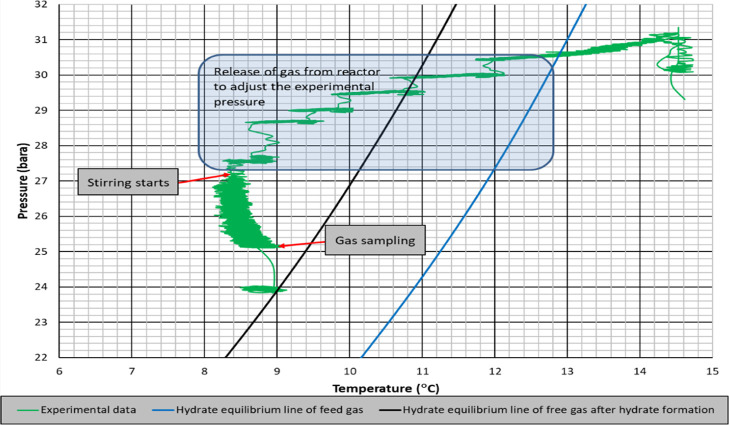
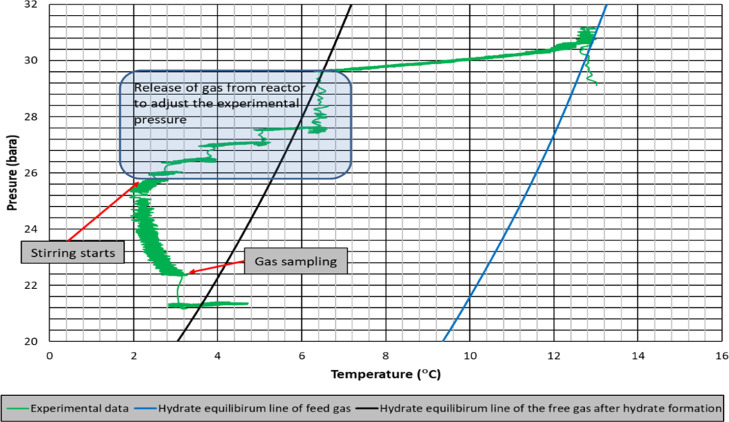
Figure 10 shows the experimental pressure–temperature data with hydrate equilibrium lines of feed gas and free gas after hydrate formation. As seen, hydrate formation line is shifting closer to experimental conditions. The consequence is a reduced driving force for hydrate formation. Same observation is valid for experiments with higher driving forces but higher consumption of propane, ending up with an average free gas composition of 99.24% of methane and 0.76% of propane (Figure 9). Again, the experimental condition after hydrate formation is very close to the hydrate equilibrium line of free gas sampled at this condition (Figure 11).
Figure 10.
Pressure–temperature diagram of mixture gas of SI-RT-FB (lower driving force).
Figure 11.
Pressure–temperature diagram of mixture gas of SI-RT-FB (higher driving force).
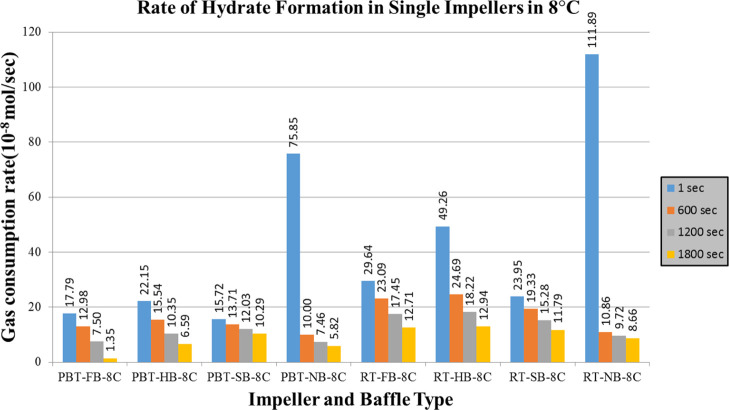
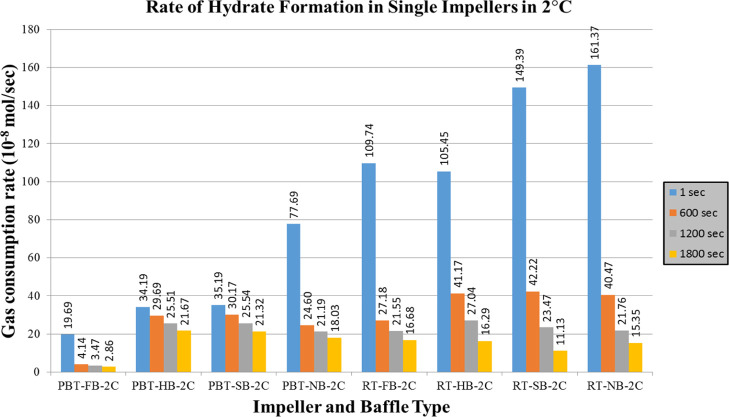
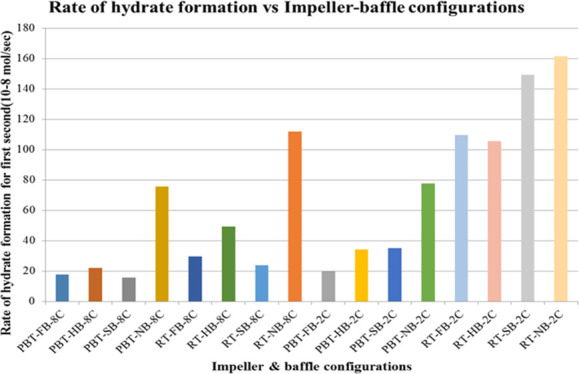
Rate of hydrate formation charts of mixture gas with single impeller for lower and higher driving forces are presented in Figures 12 and 13, respectively. The change in the number of moles of free gas after the initiation of hydrate formation was used to calculate the rate of hydrate formation at four different times (1 s, 10, 20, and 30 min). The produced gas consumption data, from the reactor systems used in this study, fit well to a third-order quadratic equation as a function of time. The common characteristic of hydrate formation rate changes is the continuous decline of rate by time for a given experiment. Initial hydrate formation rates for RT experiments are generally higher than PBTU experiments for the same type of baffle. These outcomes show that in radial flow experiments that there is better interaction between gas and liquid compared to mixed flow experiments. Better pumping capacity, uniform shear field, and good contact ability can be suspected to be the reasons of this outcome. On the other hand, the decline rate of hydrate formation is higher for RT compared to PBTU. This fact takes place due to the fact that in RT experiments, there is initially high rate of hydrate formation which leads to increase the temperature of the system (exothermic reaction); hence, our system cannot form any other gas hydrates.
Figure 12.
Rate of hydrate formation of mixture gas with single impeller and lower driving force (experimental temperature 8 °C).
Figure 13.
Rate of hydrate formation of mixture gas with single impeller and higher driving force (experimental temperature 2 °C).
As we notice from Figures 12 and 13, the highest values take place in experiments with no baffles. The baffles provide axial flow and eliminate the central vortex in a stirred tank. When full baffles are used, it is expected to observe the axial motion of the reactor contents beginning from the bottom of the tank. When shortened baffles such as half and surface baffles are used, however, the tangential flow would be dominant at the bottom of the tank. The axial motion would begin where or whereabouts of the start of the baffles. When there are no baffles in the system, the tangential flow is dominant everywhere, and a central vortex would form. The central vortex could be useful in incorporating gas if the vortex reaches the impeller; however, excessive entrance of the gas would have a significant effect on the hydrodynamics in the tank and the gas entrance through the vortex can become an undesired situation. Based on these, it is seen here that when there are no baffles, the central vortex that is created can play a positive role in gas liquid contact. This result it is obvious that is depended on tank and impeller geometry together with the rotational speed.39
The last two parameters that are examined are hydrate productivity and power consumption. The results of hydrate productivity are presented in Figures 14 and.15 In both experiments with high and low driving forces, hydrate productivity has an opposite analogy with the rate of hydrate formation; hence, PBTU experiments have higher values compared to RT experiments. The quick and high rate of hydrate formation increases the temperature of the system. This is caused because hydrate is initially started to form at the gas–water interface and tried to be removed from the interface by mixing; some of the hydrate may stay at the interface. This may result with the restriction of mass transfer between phases. Furthermore, after some period, if the heat of hydrate formation is not removed efficiently from the reactor, an increase in reactor temperature may occur. An increase in reactor temperature result with reduction in driving force. This is more obvious in radial flow experiments.
Figure 14.
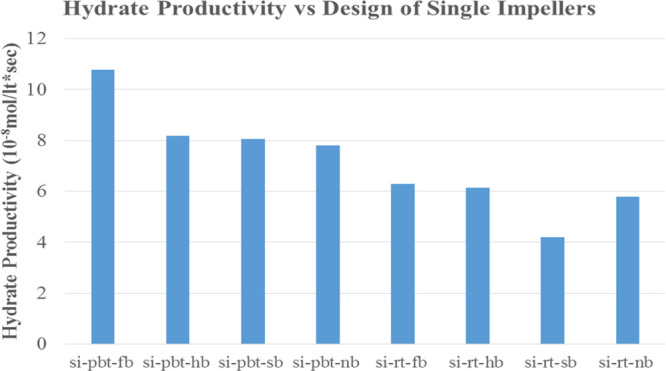
Hydrate productivity of single impeller experiments with lower driving force (experimental temperature 8 °C).
Figures 16 and 17 present the power consumption for lower and higher driving force, respectively. RT experiments consume more energy with the exception of no baffle experiment, where PBT has a higher value of power consumption compared to the RT experiment something that is confirmed from the literature.40,41 It should be mentioned that PBTU is the same with PBT because all mixed flow experiments occur in upward trending.
Figure 16.
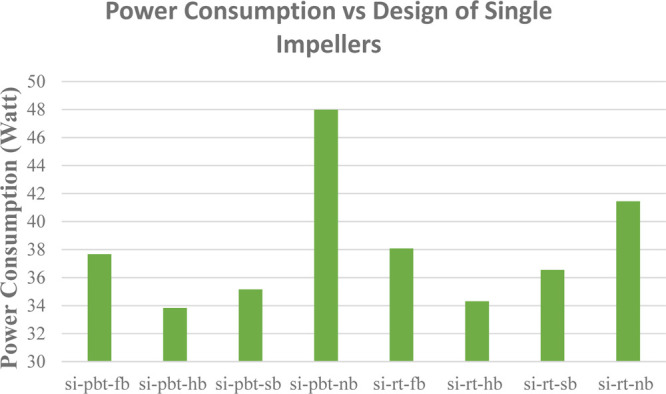
Power consumption of single impeller experiments with lower driving force (experimental temperature 8 °C).
Figure 17.
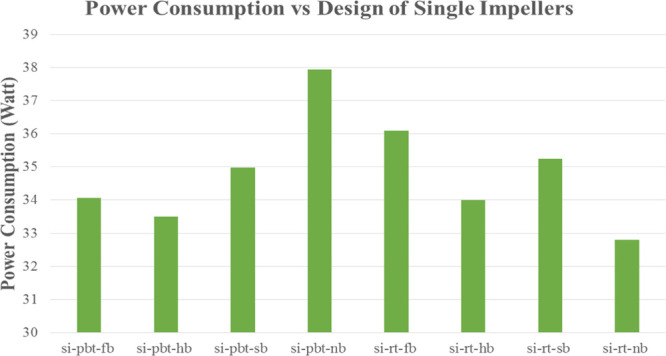
Power consumption of single impeller experiments with higher driving force (experimental temperature 2 °C).
Figure 15.
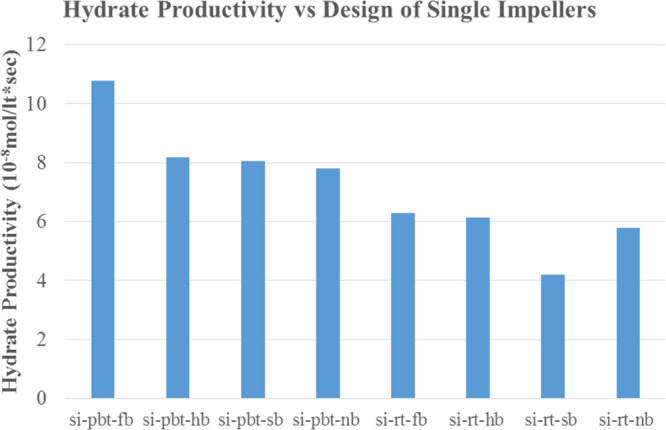
Hydrate productivity of single impeller experiments with higher driving force (experimental temperature 2 °C).
5. Conclusions
This study mainly aimed to promote hydrate formation by investigating the effects of impeller–baffle configurations. In order to achieve this goal of study, two sets of 16 single experiments with different pressures and temperatures took place. After the sixteen experiments, the outcomes are presented below:
Single impeller experiments with methane showed that RT impeller has better performance than up-PBTU impeller for all kinds of baffles showing that radial flow creates better contact between gas and liquid for hydrate formation.
The produced gas consumption data, from the reactor systems used in this study, fit well to a third-order quadratic equation as function of time.
The initial hydrate formation rate is generally higher with the use of RT as impeller, but the decline rate of hydrate formation is also high compared to up-PBTU.
The higher decline rate of hydrate formation with higher initial hydrate formation is attributed to the restricted mass transfer between gas and water phases when higher amount of higher is formed at the gas–water interface initially. This actually shows the importance of the necessity of the immediate and better removal of the solid hydrate particles from the gas–water interface.
Another important item for the higher decline in hydrate formation is the exothermic nature of hydrate formation. The generated heat by hydrate formation must be removed as efficiently as possible to keep the driving force for hydrate formation at higher values.
Propane is consumed more if hydrate is formed from a gas mixture of methane–propane. This fact brings another complexity of the varying hydrate equilibrium curve during hydrate formation. As propane is consumed, hydrate equilibrium pressure gets higher for the given process temperature..
Acknowledgments
We are grateful to PAL for its assistance for GC measurements.
Supporting Information Available
The Supporting Information is available free of charge at https://pubs.acs.org/doi/10.1021/acsomega.0c05615.
Graphs of PBTU and RT experiments of gas consumption versus time (PDF)
The authors declare no competing financial interest.
Supplementary Material
References
- Englezos P. Clathrate hydrates. Ind. Eng. Chem. Res. 1993, 32, 1251–1274. 10.1021/ie00019a001. [DOI] [Google Scholar]
- Sloan E. D. Jr.; Koh C.. Clathrate Hydrates of Natural Gases; CRC Press: Florida, 2007. [Google Scholar]
- Sloan E. D., Koh C. A.. Clathrate Hydrates of Natural Gases, 3rd ed.; CRC Press: Taylor & Francis Group: Boca Raton, 2008. [Google Scholar]
- Sun C.; Li W.; Yang X.; Li F.; Yuan Q.; Mu L.; Chen J.; Liu B.; Chen G. Progress in research of gas hydrate. Chin. J. Chem. Eng. 2011, 19, 151–162. 10.1016/s1004-9541(09)60192-0. [DOI] [Google Scholar]
- Hammerschmidt E. G. Formation of gas hydrates in natural gas transmission lines. Ind. Eng. Chem. 1934, 26, 851–855. 10.1021/ie50296a010. [DOI] [Google Scholar]
- Gudmundsson J. S.; Khodakar A. A.; Parlaktuna M.. Storage of natural gas as frozen hydrate. Proceedings of the 67th Annual Technical Conference and Exhibition of SPE, 1990; pp 699–707.
- Gudmundsson J. S.; Brrehaug A.. Frozen hydrate for transport of natural gas. Proceedings of the 2nd International Conference on Natural Gas Hydrates: Toulouse, 1996; pp 415–422.
- Sloan E. D. Fundamental principles and applications of natural gas hydrates. Nature 2003, 426, 353–359. 10.1038/nature02135. [DOI] [PubMed] [Google Scholar]
- Shirota H.; Aya I.; Namie J.. Measurement of methane hydrate dissociation for application to natural gas storage and transportation. Proceedings of the Fourth International Conference on Natural Gas Hydrates: Yokohama, 2002; pp 972–977.
- Takaoki T.; Iwasaki T.; Katoh Y.; Arai T.; Horiguchi K.. Use of hydrate pellets for transportation of natural gas. Proceedings of the Fourth International Conference on Natural Gas Hydrates: Yokohama, 2002; pp 982–986.
- Kanda H.Economic study on natural gas transportation with natural gas hydrate (NGH) pellets. Proceeding of the 23rd World Gas Conference: Amsterdam, 2006.
- Strobel T. A.; Hester K. C.; Koh C. A.; Sum A. K.; Sloan E. D. Properties of the clathrates of hydrogen and developments in their applicability for hydrogen storage. Chem. Phys. Lett. 2009, 478, 97–109. 10.1016/j.cplett.2009.07.030. [DOI] [Google Scholar]
- Gudmundsson J.-S.; Parlaktuna M.; Khokhar A. A. Storage of natural gas as frozen hydrate. SPE Prod. Facil. 1994, 9, 69–73. 10.2118/24924-pa. [DOI] [Google Scholar]
- Khokhar A. A.; Gudmundsson J. S.; Sloan E. D. Gas storage in structure H hydrates. Fluid Phase Equilib. 1998, 150–151, 383–392. 10.1016/s0378-3812(98)00338-0. [DOI] [Google Scholar]
- Ganji H.; Manteghian M.; Sadaghiani zadeh K.; Omidkhah M. R.; Rahimi Mofrad H. Effect of different surfactants on methane hydrate formation rate, stability and storage capacity. Fuel 2007, 86, 434–441. 10.1016/j.fuel.2006.07.032. [DOI] [Google Scholar]
- Chong Z. R.; Yang S. H. B.; Babu P.; Linga P.; Li X.-S. Review of natural gas hydrates as an energy resource: Prospects and challenges. Appl. Energy 2016, 162, 1633–1652. 10.1016/j.apenergy.2014.12.061. [DOI] [Google Scholar]
- Gudmundsson J. S.Method for Production of Gas Hydrates for Transportation and Storage. U.S. Patent 5,536,893 A, 1996.
- Rehder G.; Eckl R.; Elfgen M.; Falenty A.; Hamann R.; Kahler N.; Kuhs W. F.; Osterkamp H.; Windmeier C. Methane hydrate pellet transport using the self-preservation effect: a technoeconomic analysis. Energies 2012, 5, 2499–2523. 10.3390/en5072499. [DOI] [Google Scholar]
- Rossi F.; Filipponi M.; Castellani B. Investigation on a novel reactor for gas hydrate production. Appl. Energy 2012, 99, 167–172. 10.1016/j.apenergy.2012.05.005. [DOI] [Google Scholar]
- Bi Y.; Guo T.; Zhu T.; Zhang L.; Chen L. Influences of additives on the gas hydrate cool storage process in a new gas hydrate cool storage system. Energy Convers. Manage. 2006, 47, 2974–2982. 10.1016/j.enconman.2006.03.027. [DOI] [Google Scholar]
- Xie Y.; Li G.; Liu D.; Liu N.; Qi Y.; Liang D.; Guo K.; Fan S. Experimental study on a small scale of gas hydrate cold storage apparatus. Appl. Energy 2010, 87, 3340–3346. 10.1016/j.apenergy.2010.05.028. [DOI] [Google Scholar]
- Linga P.; Kumar R.; Englezos P. The clathrate hydrate process for post and pre-combustion capture of carbon dioxide. J. Hazard. Mater. 2007, 149, 625–629. 10.1016/j.jhazmat.2007.06.086. [DOI] [PubMed] [Google Scholar]
- Kang S.-P.; Lee H. Recovery of CO2 from flue gas using gas hydrate: thermodynamic verification through phase equilibrium measurements. Environ. Sci. Technol. 2000, 34, 4397–4400. 10.1021/es001148l. [DOI] [Google Scholar]
- Babu P.; Linga P.; Kumar R.; Englezos P. A review of the hydrate based gas separation (HBGS) process for carbon dioxide precombustion capture. Energy 2015, 85, 261–279. 10.1016/j.energy.2015.03.103. [DOI] [Google Scholar]
- Park S.; Lee S.; Lee Y.; Lee Y.; Seo Y. Hydrate-based precombustion capture of carbon dioxide in the presence of a thermodynamic promoter and porous silica gels. Int. J. Greenhouse Gas Control 2013, 14, 193–199. 10.1016/j.ijggc.2013.01.026. [DOI] [Google Scholar]
- Kvamme B.; Graue A.; Buanes T.; Kuznetsova T.; Ersland G. Storage of CO2 in natural gas hydrate reservoirs and the effect of hydrate as an extra sealing in cold aquifers. Int. J. Greenhouse Gas Control 2007, 1, 236–246. 10.1016/s1750-5836(06)00002-8. [DOI] [Google Scholar]
- Hirai S.; Tabe Y.; Kuwano K.; Ogawa K.; Okazaki K. MRI measurement of hydrate growth and an application to advanced CO2 sequestration technology. Ann. N.Y. Acad. Sci. 2000, 912, 246–253. 10.1111/j.1749-6632.2000.tb06778.x. [DOI] [Google Scholar]
- Kang K. C.; Linga P.; Park K.-n.; Choi S.-J.; Lee J. D. Seawater desalination by gas hydrate process and removal characteristics of dissolved ions (Na+, K+, Mg2+, Ca2+, B3+, Cl–, SO42−). Desalination 2014, 353, 84–90. 10.1016/j.desal.2014.09.007. [DOI] [Google Scholar]
- Babu P.; Kumar R.; Linga P. Unusual behavior of propane as a co-guest during hydrate formation in silica sand: Potential application to seawater desalination and carbon dioxide capture. Chem. Eng. Sci. 2014, 117, 342–351. 10.1016/j.ces.2014.06.044. [DOI] [Google Scholar]
- Javanmardi J.; Moshfeghian M. Energy consumption and economic evaluation of water desalination by hydrate phenomenon. Appl. Therm. Eng. 2003, 23, 845–857. 10.1016/s1359-4311(03)00023-1. [DOI] [Google Scholar]
- Hao W.; Wang J.; Fan S.; Hao W. Study on methane hydration process in a semi-continuous stirred tank reactor. Energy Convers. Manage. 2007, 48, 954–960. 10.1016/j.enconman.2006.08.007. [DOI] [Google Scholar]
- Mohammadi A.; Manteghian M. The Induction Time of Hydrate Formation From a Carbon Dioxide-Methane Gas Mixture. Petrol. Sci. Technol. J. 2014, 32, 3029–3035. 10.1080/10916466.2011.615367. [DOI] [Google Scholar]
- Douïeb S.; Fradette L.; Bertrand F.; Haut B.; Haut B. Impact of fluid flow conditions on the formation rate of carbon dioxide hydrates in a semi batched stirred tank reactor. AIChE J. 2015, 61, 4387–4401. 10.1002/aic.14952. [DOI] [Google Scholar]
- Douïeb S.; Archambault S.; Fradette L.; Bertrand F.; Haut B. Effect of the Fluid Shear Rate on the Induction Time of CO2-THF Hydrate Formation. Can. J. Chem. Eng. 2016, 95, 187–198. 10.1002/cjce.22650. [DOI] [Google Scholar]
- Lee B. I.; Kesler M. G. A Generalized Thermodynamic Correlation Based on Three Parameter Corresponding States. AIChE J. 1975, 21, 510–527. 10.1002/aic.690210313. [DOI] [Google Scholar]
- Chapple D.; Kresta S. M.; Wall A.; Afacan A. The effect of impeller and tank geometry on power number for a pitched blade turbine. Trans. IchemE, Part A 2002, 80, 364–372. 10.1205/026387602317446407. [DOI] [Google Scholar]
- Inkong K.; Veluswamy H. P.; Rangsunvigit P.; Kulprathipanja S.; Linga P. Innovative Approach To Enhance the Methane Hydrate Formation at Near-Ambient Temperature and Moderate Pressure for Gas Storage Applications. Eng. Chem. Res. 2019, 58, 22178–22192. 10.1021/acs.iecr.9b04498. [DOI] [Google Scholar]
- Linga P.; Kumar R.; Lee J. D.; Ripmeester J.; Englezos P. A new apparatus to enhance the rate of gas hydrate formation: Application to capture of carbon dioxide. Int. J. Greenhouse Gas Control 2010, 4, 630–637. 10.1016/j.ijggc.2009.12.014. [DOI] [Google Scholar]
- Ducoste J. J.; Clark M. M. The Influence of Tank Size and Impeller Geometry on Turbulent Flocculation: II. Model. Environ. Eng. Sci. 1998, 15, 225–235. 10.1089/ees.1998.15.225. [DOI] [Google Scholar]
- Cudak M.; Kiełbus-Rąpała A.; Major-Godlewska M.; Karcz J. Influence of different factors on momentum transfer in mechanically agitated multiphase systems. Chem. Process Eng. 2016, 37, 41–53. 10.1515/cpe-2016-0005. [DOI] [Google Scholar]
- Foukrach M.; Bouzit M.; Ameur H.; Kamla Y. Effect of Agitator’s Types on the Hydrodynamic Flow in an Agitated Tank. Chin. J. Mech. Eng. 2020, 33, 37. 10.1186/s10033-020-00454-2. [DOI] [Google Scholar]
Associated Data
This section collects any data citations, data availability statements, or supplementary materials included in this article.


