

Abstract
Aims
To assess the safety of ertugliflozin in patients with type 2 diabetes mellitus (T2DM) inadequately controlled with conventional therapy at different periods.
Methods
We searched PubMed, Embase, and The Cochrane Library from inception to September 23, 2020. A total of six studies involving 4120 patients were included.
Results
Compared with the control group, 15 mg and 5 mg of ertugliflozin were associated with higher risks of genital mycotic infections (GMIs) at 26 weeks (p < 0.0001 and p < 0.0001, respectively), 52 weeks (p < 0.00001 and p < 0.0001, respectively), and 104 weeks (p < 0.00001 and p < 0.0001, respectively). Moreover, females had a higher risk of GMIs than males in the 15 mg group at 26 weeks (p = 0.0008), 52 weeks (p < 0.0001), and 104 weeks (p = 0.02). At 104 weeks, 15 mg and 5 mg of ertugliflozin showed beneficial effects on symptomatic hypoglycemia (p < 0.00001 and p = 0.004, respectively) compared with the effects observed in the control group. Compared with the control group, 15 mg and 5 mg of ertugliflozin were associated with higher risks of drug-related adverse events at 26 weeks (p = 0.002 and p = 0.002, respectively); 15 mg of ertugliflozin was associated with a higher risk of discontinuation related to adverse events at 104 weeks (p = 0.03). No significant differences were found in the remaining safety outcomes.
Conclusion
This meta-analysis of randomized controlled trials indicates that ertugliflozin is tolerated by T2DM, but the risk of GMIs is noteworthy, especially among females in the high-dose group.
1. Introduction
In diabetes mellitus, the global estimates of its prevalence are increasing each year, with T2DM accounting for approximately 90% of cases [1]. Although many antihyperglycemic agents have already been available for the treatment of T2DM, their glucose-lowering effects in the context of long-term glycemic control are not satisfactory [2]. There is an urgent need for more effective agents with fewer adverse effects to lower blood glucose.
Sodium glucose cotransporter 2 (SGLT2) inhibitors are a novel kind of antihyperglycemic agent, approved by the US Food and Drug Administration (FDA) to use with diet and exercise to lower blood glucose in adults with type 2 diabetes. Medicines in the SGLT2 inhibitor category were first approved in 2013, including canagliflozin, dapagliflozin, empagliflozin, and ertugliflozin [3]. Ertugliflozin is the fourth SGLT2 inhibitor approved in the United States [4]. By decreasing the renal glucose threshold, therefore increasing urinary glucose excretion, the pharmacological inhibition of SGLT2 cotransporters reduces hyperglycemia, offering an effective way to treat T2DM patients [5]. Ertugliflozin as monotherapy [6] or in combination [7] with other antihyperglycemic agents has been associated with improvements in glycemic control, body weight, and blood pressure.
However, in 2018, the FDA issued a warning that SGLT2 inhibitors reported cases of severe genital infections [3]. Although ertugliflozin has a good hypoglycemic effect, genital infection is an adverse event that deserves attention. In recent years, several studies have evaluated the efficacy and safety of ertugliflozin in T2DM. Ertugliflozin exhibited advantages for T2DM but at the same time increased risks for adverse events, such as GMIs [8, 9]. However, there is currently a lack of meta-analysis only for the safety of ertugliflozin, and the safety of ertugliflozin as a monotherapy at different periods with different doses was unclear and needs to be investigated.
Thus, we performed a meta-analysis of randomized controlled trials to assess the safety of ertugliflozin monotherapy at doses of 15 mg and 5 mg on GMIs, urinary tract infections (UTIs), drug-related adverse events, drug-related serious adverse events, discontinuation related to adverse events, deaths, symptomatic hypoglycemia, and hypovolemia at 26, 52, and 104 weeks. We also compared the effects of 15 mg ertugliflozin with a 5 mg dose on safety outcomes in each period. The registration number is CRD42020211388.
2. Materials and Methods
This study was conducted according to the Cochrane Collaboration and the PRISMA (Preferred Reporting Items for Systematic Reviews and Meta-Analyses) statement [10, 11].
2.1. Eligibility Criteria
Studies satisfying the following criteria were included:
Population: patients were diagnosed as T2DM according to American Diabetes Association guidelines and were ≥18 years old and had glycated hemoglobin that was inadequately controlled with conventional therapy (metformin or diet and exercise).
Intervention: monotherapy ertugliflozin at doses of 15 mg and 5 mg with or without a background of metformin; the treatment period was 26, 52, or 104 weeks.
Comparison: other hypoglycemic agents or placebo.
Outcome: GMIs, UTIs, drug-related adverse events, drug-related serious adverse events, discontinuation-related adverse events, deaths, symptomatic hypoglycemia, and hypovolemia.
Study design: only randomized controlled trials (RCTs) were included.
Language restrictions: only studies published in English.
The exclusion criteria were as follows: patients with type 1 diabetes mellitus, a history of ketoacidosis, an estimated glomerular filtration rate (eGFR) < 60 ml/min/1.73 m2, or a history of cardiovascular events within 3 months of screening.
2.2. Search Strategy
A systematic literature search about RCTs of ertugliflozin was conducted by two investigators (HJ and XSY) to identify relevant studies on PubMed, Embase, and The Cochrane Library from inception to September 23, 2020. The language was restricted to English. We also searched ClinicalTrials.gov and reviewed the references of the included articles to identify additional studies. The search terms included “diabet∗” and “ertugliflozin.” After eliminating the duplicates, the two investigators screened the titles and abstracts independently. Then, they performed a full-text evaluation. Meanwhile, discrepancies were referred to a third investigator and resolved through discussion (DSL).
2.3. Data Extraction
Data was extracted using a tailored form, including the following: the first author, publication year, NCT number, HbA1c% (baseline), the number of patients, intervention, and safety outcomes (primary: GMIs and UTIs; secondary: drug-related adverse events, drug-related serious adverse events, discontinuation related to adverse events, deaths, symptomatic hypoglycemia, and hypovolemia). The data selection procedure was performed independently by two investigators (HJ and XSY), and discrepancies were resolved through discussion among the three investigators (HJ, XSY, and DSL).
2.4. Risk of Bias and Strength of Evidence
The Cochrane Risk of Bias Tool was used to assess the risk of bias for included studies [12]. Each included study was assessed as “high,” “low,” or “unclear” risk of bias based on the following seven domains: random sequence generation, allocation concealment, blinding of participants and personnel, blinding of outcome assessment, incomplete outcome data, selective reporting, and other bias. Furthermore, the strength of evidence for each outcome (ertugliflozin group vs. control group) was judged as high, moderate, low, or very low according to the Grading of Recommendations, Assessment, Development and Evaluations (GRADE) system [13], and each study's quality was decreased based on risk of bias, inconsistency, indirectness, imprecision, and publication bias (GRADEpro GDT, https://gdt.gradepro.org/). Two investigators (HJ and XSY) reviewed and classified the RCTs independently. Differing opinions were resolved through discussions with a third investigator (DSL).
2.5. Statistical Analysis
Review Manager 5.3 was used for meta-analysis. Since all of the extracted data were dichotomous, risk ratio (RR) and 95% confidence interval (CI) were calculated to estimate effect size for dichotomous variables. p values <0.05 were deemed statistically significant. The backgrounds of the patients and control groups of included studies were not homogeneous. Taking into account the heterogeneity between studies, a random effects model was used to aggregate data to promote the generality of the results. A sensitivity analysis was performed by excluding studies one by one. Due to the small number of included studies, subgroup analysis and publication bias test were not performed [10].
3. Results
3.1. Trial Selection
381 articles were identified in the database retrieval. Among them, 82 articles were excluded after removing duplicates. In addition, 14 records were identified through other sources. After screening by title and abstract, 11 of the remaining 313 articles were selected for full-text assessment. Ultimately, 9 articles [6, 14–21] (6 NCT numbers) were included in the study (NCT numbers: 02630706 [14], 01999218 [15, 18], 02033889 [6, 16], 01958671 [20, 21], 02099110 [17], and 02036515 [19]). A flow chart reflecting the literature search process is shown in Figure 1.
Figure 1.

Flow chart of the literature search process.
3.2. Study Characteristics
This meta-analysis included six studies that were published from 2017 to 2019, enrolling 4120 participants. Three studies [17, 19–21] were conducted over 52 weeks with two 26-week periods (phase A and phase B). One study [15, 18] was conducted over 104 weeks with two 52-week periods (phase A and phase B). One study [6, 16] was conducted over 104 weeks with a 26-week period (phase A) and a 78-week period (phase B), and another study [14] was conducted over 26 weeks. Participants in one study [20, 21] were T2DM patients whose diabetes was inadequately controlled by diet and exercise. Other participants were T2DM patients whose diabetes was inadequately controlled by metformin monotherapy or combination metformin and sitagliptin. Among the six included studies, four [6, 14, 16, 19–21] compared 15 mg and 5 mg ertugliflozin monotherapy with placebo, one [15, 18] compared 15 mg and 5 mg ertugliflozin monotherapy with glimepiride, and the remaining one [17] compared 15 mg and 5 mg ertugliflozin monotherapy with sitagliptin and coadministrations. Detailed characteristics of included trials are shown in Table 1.
Table 1.
Characteristics of studies included in the meta-analysis.
| First author (year) | NCT number | Number of patients (E5/E15/C) | Baseline HbA1c | Intervention | Control | Periods |
|---|---|---|---|---|---|---|
| Ji (2019) [14] | NCT: 02630706 | 170/169/167 | 7.0-10.5% | 1. Ertugliflozin 5 mg; 2. ertugliflozin 15 mg GRT: glimepiride |
Placebo | 26 weeks |
| Rosenstock (2018) [6], Gallo (2019) [16] | NCT: 02033889 | 207/205/209 | 7.0-10.5% | 1. Ertugliflozin 5 mg; 2. ertugliflozin 15 mg GRT: glimepiride (1-26 weeks), basal insulin (27-104 weeks) |
Placebo | 26 weeks, 104 weeks |
| Hollander (2018) [18], Hollander (2019) [15] | NCT: 01999218 | 488/440/437 | 7.0-9.0% | 1. Ertugliflozin 5 mg; 2. ertugliflozin 15 mg GRT: sitagliptin (1-52 weeks), not permitted (53-104 weeks) |
Glimepiride up to 6 or 8 mg/d | 52 weeks, 104 weeks |
| Pratley (2018) [17] | NCT: 02099110 | 250/248/247 | 7.5-11% | 1. Ertugliflozin 5 mg; 2. ertugliflozin 15 mg GRT: glimepiride or glargine |
Sitagliptin 100 mg | 26 weeks, 52 weeks |
| Terra (2017) [21], Aronson (2018) [20] | NCT: 01958671 | 156/152/153 | 7.0-10.5% | 1. Ertugliflozin 5 mg; 2. ertugliflozin 15 mg GRT: metformin (1-26 weeks), glimepiride (27-52 weeks) |
Placebo (1-26 weeks), metformin (27-52 weeks) | 26 weeks, 52 weeks |
| Dagogo-Jack (2018) [19] | NCT: 02036515 | 156/153/153 | 7.0-10.5% | 1. Ertugliflozin 5 mg; 2. ertugliflozin 15 mg GRT: glimepiride or glargine |
Placebo | 26 weeks, 52 weeks |
E5: ertugliflozin 5 mg; E15: ertugliflozin 15 mg; C: control; GRT: glycemic rescue therapy.
3.3. Risk of Bias Assessment
According to the Cochrane Risk of Bias Tool [12], three studies were assessed as low risk [15, 17, 18, 20, 21]. The randomization methods were explained in the included studies. Of these, a central electronic randomization system, an interactive automated system, and an interactive voice response system were used in the three studies, while allocation concealment of the remaining three studies was unclear. The data on ClinicalTrials.gov were also reviewed to confirm that blindness was applied during each study. The results are shown in Figures 2 and 3. Green represents a low risk of bias, yellow represents an unclear risk of bias, and red represents a high risk of bias.
Figure 2.

Risk of bias summary.
Figure 3.

Risk of bias graph.
3.4. Meta-Analysis Results
3.4.1. Ertugliflozin vs. Control
(1) Primary Outcomes. At 26, 52, and 104 weeks, the risk of GMIs was higher in the 15 mg and 5 mg ertugliflozin groups than that in the control group (Figure 4). For GMIs, the leave-one-out sensitivity analysis showed that the results of our meta-analysis were not significantly unstable (Table 2). Considering that the control groups of Hollander et al. [18] and Pratley et al. [17] used glimepiride and sitagliptin, while other studies used placebo, we deleted both studies at 52 weeks and found that after deleting these two studies, the p value changed from <0.05 to >0.05 in the ertugliflozin 5 mg group.
Figure 4.

Forest plot of the risk of GMIs in the 15 mg and 5 mg dose groups compared with that in the control group at 26, 52, and 104 weeks. CI: confidence interval; M-H: Mantel-Haenszel.
Table 2.
a: Leave-one-out sensitivity analysis for GMIs (ertugliflozin vs. control). b: Sensitivity analysis by excluding two studies that were not placebo-controlled.
| Study excluded | RR (95% CI) | Z-test p value | Heterogeneity (I2) |
|---|---|---|---|
| a | |||
| 15 mg vs. control 26 weeks | |||
| Dagogo-Jack (2018) [19] | 4.42 (1.96, 10.00) | p = 0.0004 | p = 0.33; I2 = 12% |
| Ji (2019) [14] | 5.98 (2.84, 12.56) | p < 0.00001 | p = 0.53; I2 = 0% |
| Pratley (2018) [17] | 4.34 (1.99, 9.47) | p = 0.0002 | p = 0.36; I2 = 8% |
| Rosenstock (2018) [6] | 4.62 (1.93, 11.03) | p = 0.0006 | p = 0.29; I2 = 20% |
| Terra (2017) [21] | 6.39 (2.12, 19.27) | p = 0.0010 | p = 0.28; I2 = 21% |
| 5 mg vs. control 26 weeks | |||
| Dagogo-Jack (2018) [19] | 3.67 (1.73, 7.77) | p = 0.0007 | p = 0.38; I2 = 2% |
| Ji (2019) [14] | 4.74 (2.21, 10.15) | p < 0.0001 | p = 0.40; I2 = 0% |
| Pratley (2018) [17] | 3.55 (1.70, 7.42) | p = 0.0008 | p = 0.46; I2 = 0% |
| Rosenstock (2018) [6] | 3.77 (1.73, 8.26) | p = 0.0009 | p = 0.36; I2 = 7% |
| Terra (2017) [21] | 5.93 (2.25, 15.58) | p = 0.0003 | p = 0.46; I2 = 0% |
| 15 mg vs. control 52 weeks | |||
| Aronson (2018) [20] | 9.32 (4.03, 21.52) | p < 0.00001 | p = 0.91; I2 = 0% |
| Dagogo-Jack (2018) [19] | 5.24 (2.44, 11.27) | p < 0.0001 | p = 0.23; I2 = 33% |
| Hollander (2018) [18] | 4.73 (2.14, 10.44) | p = 0.0001 | p = 0.29; I2 = 19% |
| Pratley (2018) [17] | 5.82 (2.27, 14.93) | p = 0.0002 | p = 0.16; I2 = 45% |
| 5 mg vs. control 52 weeks | |||
| Aronson (2018) [20] | 8.66 (3.74, 20.06) | p < 0.00001 | p = 0.89; I2 = 0% |
| Dagogo-Jack (2018) [19] | 4.73 (2.00, 11.16) | p = 0.0004 | p = 0.17; I2 = 44% |
| Hollander (2018) [18] | 4.51 (1.74, 11.70) | p = 0.002 | p = 0.21; I2 = 37% |
| Pratley (2018) [17] | 5.35 (1.85, 15.42) | p = 0.002 | p = 0.11; I2 = 55% |
| 15 mg vs. control 104 weeks | |||
| Gallo (2019) [16] | 11.67 (3.62, 37.65) | p < 0.0001 | NA |
| Hollander (2019) [15] | 5.44 (1.61, 18.38) | p = 0.006 | NA |
| 5 mg vs. control 104 weeks | |||
| Gallo (2019) [16] | 10.43 (3.22, 33.80) | p < 0.0001 | NA |
| Hollander (2019) [15] | 4.38 (1.27, 15.13) | p = 0.02 | NA |
|
| |||
| b | |||
| 15 mg vs. control 52 weeks | |||
| Hollander (2018) [18]; Pratley (2018) [17] | 4.73 (1.29, 17.39) | p = 0.02 | p = 0.18; I2 = 43% |
| 5 mg vs. control 52 weeks | |||
| Hollander (2018) [18]; Pratley (2018) [17] | 4.41 (0.94, 20.64) | p = 0.06 | p = 0.13; I2 = 56% |
RR: risk ratio; CI: confidence interval; NA: not available.
No significant differences were found in the risk of UTIs at 26, 52, or 104 weeks (Figure 5). For UTIs, the leave-one-out sensitivity analysis showed that the results of our meta-analysis were not significantly unstable (Supplementary Table 1). After removing two studies that were not placebo-controlled at 52 weeks, the sensitivity analysis showed that the results of our meta-analysis were not significantly unstable.
Figure 5.
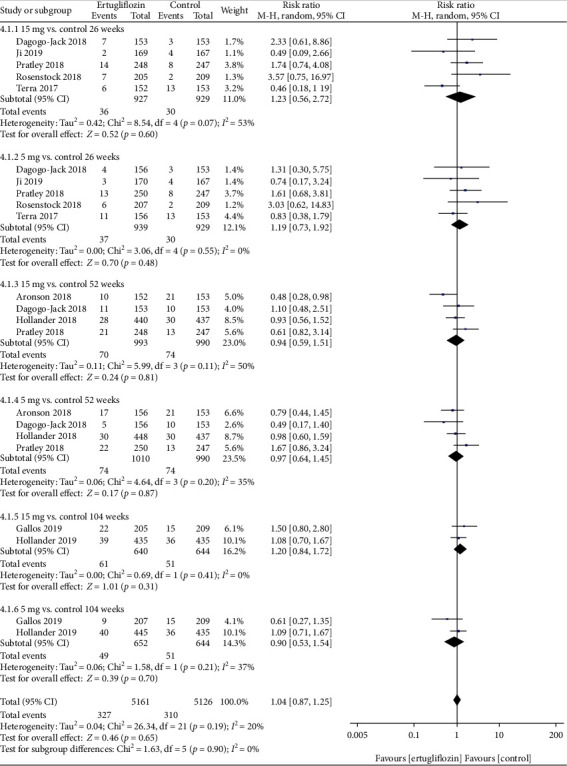
Forest plot of the risk of UTIs in the 15 mg and 5 mg dose groups compared with that in the control group at 26, 52, and 104 weeks. CI: confidence interval; M-H: Mantel-Haenszel.
(2) Secondary Outcomes. At 26 weeks, the 15 mg and 5 mg ertugliflozin groups had a higher risk of drug-related adverse events compared with the control group [(RR =1.61; 95% CI, 1.19-2.15; p = 0.002) and (RR =1.74; 95% CI, 1.22-2.49; p = 0.002), respectively] (Supplementary Figure 1). For drug-related adverse events, the leave-one-out sensitivity analysis showed that after removing Aronson et al. [20], the p value changed from >0.05 to <0.05 in the 15 mg ertugliflozin group at 52 weeks (Supplementary Table 2).
Compared with the control group, at 104 weeks, the risk of discontinuation related to adverse events in the 15 mg ertugliflozin group was higher (RR =1.62; 95% CI, 1.05-2.50; p = 0.03) (Supplementary Figure 2; sensitivity analysis was shown in Supplementary Table 3), while the risk of symptomatic hypoglycemia in the 15 mg and 5 mg ertugliflozin groups was lower [(RR =0.33; 95% CI, 0.23-0.47; p < 0.00001) and (RR =0.27; 95% CI, 0.11-0.66; p = 0.004), respectively] (Supplementary Figure 3; sensitivity analysis was shown in Supplementary Table 4). For discontinuation related to adverse events, the leave-one-out sensitivity analysis showed that after removing Gallo et al. [16] or Hollander et al. [15], the p value changed from <0.05 to >0.05 in the 15 mg ertugliflozin group at 104 weeks.
No significant differences were found in the risk of drug-related serious adverse events, deaths, and hypovolemia at any week (Supplementary Figures 4-6; sensitivity analysis was shown in Supplementary Tables 5 and 6).
3.5. GMI (Female) vs. GMI (Male)
When comparing the risk of GMIs between females and males, we found that females had a higher risk of GMIs than males in the 15 mg group at 26 weeks (RR =2.58; 95% CI, 1.49-4.49; p = 0.0008), 52 weeks (RR =3.07; 95% CI, 1.75-5.37; p < 0.0001), and 104 weeks (RR =3.00; 95% CI, 1.18-7.64; p = 0.02) (Figure 6). However, in the 5 mg group at 26 weeks and 52 weeks, the p value changed from >0.05 to <0.05 after excluding Pratley et al. [17] (sensitivity analysis was shown in Supplementary Table 7).
Figure 6.

Forest plot of the risk of GMIs when comparing females with males at 26, 52, and 104 weeks. CI: confidence interval; M-H: Mantel-Haenszel.
3.5.1. Dose of 15 mg vs. That of 5 mg
When the 15 mg group compared with the 5 mg group, no significant differences were found in the risk of GMIs (Figure 7), UTIs, drug-related adverse events, drug-related serious adverse events, discontinuation related to adverse events, deaths, symptomatic hypoglycemia, and hypovolemia in this study at either 26, 52, or 104 weeks (Supplementary Figures 7-13). We also compared the risk of GMIs between 15 mg and 5 mg groups by gender and found that there was no significant difference (Supplementary Figure 14). The leave-one-out sensitivity analysis showed that the results of our meta-analysis were not significantly unstable (sensitivity analysis was shown in Supplementary Tables 8-14).
Figure 7.

Forest plot of the risk of GMIs when comparing ertugliflozin 15 mg with 5 mg at 26, 52, and 104 weeks. CI: confidence interval; M-H: Mantel-Haenszel.
3.6. Assessment of Quality of Evidence
Compared with the control group, the quality of evidence for the risk of GMIs in the 15 mg ertugliflozin group at 26, 52, and 104 weeks was all low, and the quality of evidence for the risk of GMIs in the 5 mg ertugliflozin group at 26, 52, and 104 weeks was also all low due to the small sample size, small number of included studies, and publication bias. The GRADE evidence profiles (ertugliflozin vs. control) are provided in Supplementary Tables 15 and 16.
4. Discussion
In this meta-analysis, we systematically reviewed current studies and found that ertugliflozin treatment had a higher risk for GMIs at every period compared with the control group. In particular, females showed a high risk for GMIs compared with males in the 15 mg ertugliflozin group. We also found that ertugliflozin decreased the risk for symptomatic hypoglycemia in a long course of treatment. There were no significant differences in the risk for UTIs, drug-related serious adverse events, deaths, or hypovolemia between the ertugliflozin group and control group, and there were also no significant differences between the two doses. In summary, a high risk for GMIs is the most prominent problem of ertugliflozin, especially among females in the high-dose group.
Diabetes patients are more susceptible to infections than nondiabetic patients. Possible causes include immune deficiency, increased adhesion of microorganisms to epithelial cells, the presence of complications, and extensive medical interventions [22]. Of the included studies, all six RCTs reported that ertugliflozin can effectively control blood glucose, reduce body weight, and improve systolic blood pressure, so the efficacy of ertugliflozin for T2DM that is otherwise inadequately controlled by conventional therapy is worthy of recognition. However, we noticed that the incidence of GMIs in the ertugliflozin group was significantly higher than that in the control group. The mechanism of SGLT2 inhibitors is considered to be the possible cause. SGLT2 inhibitors reduce blood glucose by reducing the reabsorption of glucose, so the glucose in the urine rises [23]. The increase of glucose in urine may increase the colonization rate of vaginal Candida [24] and the growth rate of urinary tract pathogens [25, 26], thereby increasing the risk of genital infections. In this study, we did not find that ertugliflozin increased the risk of UTIs compared with the control group. Among a variety of SGLT2 inhibitors, dapagliflozin produced a higher risk of UTIs than placebo and other active treatments, and it appeared to have a dose-response relationship for risk of UTIs and genital infections [27, 28]. However, patients with familial renal glucosuria rarely have UTIs [29]. It seems that urine glucose will increase the risk of GMIs, and UTIs in diabetic patients remain to be further studied [27].
A previous meta-analysis evaluated the efficacy and safety of SGLT2 inhibitors (ipragliflozin, dapagliflozin, canagliflozin, and empagliflozin), and this study showed that SGLT2 inhibitors could effectively control blood glucose, reduce body weight, and improve systolic blood pressure, but it also increased the risk of GMIs [30]. Three other meta-analyses also showed that SGLT2 inhibitors increased the risk of genital infections [27, 31, 32], and one of them showed that SGLT2 inhibitors had a net protective effect on cardiovascular outcomes and death [32]. It is widely accepted that SGLT2 inhibitors can increase the risk for GMIs, which is consistent with our findings. However, a study in China showed that empagliflozin did not increase the risk for GMIs and UTIs [33]. The safety of different SGLT2 inhibitors may be different, and the difference is worthy of further exploration. A pooled analysis from three phase III clinical trials showed that ertugliflozin had a higher rate of GMIs and drug-related adverse events, but it had no significant effect on other safety outcomes [9]. We included these studies in our analysis. Another pooled analysis of canagliflozin, dapagliflozin, and empagliflozin showed that SGLT2 inhibitors had similar relative risks in females and males, and all of them increased the risk for GMIs, but there were no sex differences [34]. This may be because there is no grouping based on the dose and follow-up time of the agent. However, a cohort study showed that female and people with prior genital infection were at higher risk of genital infections with SGLT2 inhibitor therapy [35], which is consistent with our results. Although the intensity of genital infections caused by SGLT2 inhibitors was generally mild or moderate, they tended to recur and eventually lead to treatment discontinuation and may even cause the risk of a rapid decline of renal function in some patients [26]. Therefore, genital infections should be paid attention to. In the long run, we found that ertugliflozin was not prone to cause symptomatic hypoglycemia, which may be because SGLT2 inhibitors lower blood glycemic levels independent of pancreatic β cell function and insulin resistance [36]. However, there were only two [15, 16] studies that reported symptomatic hypoglycemia at 104 weeks, and Gallo et al.'s [16] control group was placebo while Hollander et al.'s [15] control group was glimepiride. Glimepiride is a sulfonylurea hypoglycemic agent, and the common adverse reaction is hypoglycemia [37]. Some studies have found that the risk for hypoglycemia of glimepiride is higher than that of SGLT2 inhibitors [38]. Thus, the difference in efficacy between glimepiride and placebo may be the source of heterogeneity.
The quality of evidence in this study is from very low to low. The reason for the low level of evidence is mainly due to insufficient sample size in each period, and the interventions of the control group included in the study are not homogeneous. This is also the limitation of this research. In the future, more large-scale clinical studies need to be focused.
Based on the results of our research, in future clinical practice using ertugliflozin, we should pay special attention to high risk for GMIs, especially females on high dosages of ertugliflozin. For patients on ertugliflozin, we should advocate for early prevention of GMIs. For example, patients with a history of genital infections should closely observe the occurrence of GMIs after weighing the advantages and disadvantages, and all patients should be more vigilant with their management of genital hygiene.
5. Conclusion
In general, ertugliflozin is effective and tolerated for T2DM inadequately controlled by conventional therapy, but the risk for GMIs is noteworthy, especially among females in the high-dose group. However, further research is necessary to clarify the long-term safety and the potential benefits and risks of this agent.
Acknowledgments
The author would like to thank Mr. Xiao (a librarian of Chongqing Medical University) for professional technical support.
Contributor Information
Qingfeng Cheng, Email: cqf19760516@163.com.
Zhiping Liu, Email: nfmlzp@163.com.
Data Availability
Data can be obtained from the original research articles included in this study. In addition, the data used to support the findings of this study are available from the corresponding author upon request.
Conflicts of Interest
The authors declare that they have no conflicts of interest.
Supplementary Materials
Supplementary Figure 1: forest plot of the risk of drug-related adverse events (ertugliflozin vs. control). CI: confidence interval; M-H: Mantel-Haenszel.
Supplementary Figure 2: forest plot of the risk of discontinuation-related adverse events (ertugliflozin vs. control). CI: confidence interval; M-H: Mantel-Haenszel.
Supplementary Figure 3: Forest plot of the risk of symptomatic hypoglycemia (ertugliflozin vs. control). CI: confidence interval; M-H: Mantel-Haenszel.
Supplementary Figure 4: forest plot of the risk of drug-related serious adverse events (ertugliflozin vs. control). CI: confidence interval; M-H: Mantel-Haenszel.
Supplementary Figure 5: forest plot of the risk of deaths (ertugliflozin vs. control). CI: confidence interval; M-H: Mantel-Haenszel.
Supplementary Figure 6: forest plot of the risk of hypovolemia (ertugliflozin vs. control). CI: confidence interval; M-H: Mantel-Haenszel.
Supplementary Figure 7: forest plot the risk of UTIs (15 mg vs. 5 mg). CI: confidence interval; M-H: Mantel-Haenszel.
Supplementary Figure 8: forest plot the risk of drug-related adverse events (15 mg vs. 5 mg). CI: confidence interval; M-H: Mantel-Haenszel.
Supplementary Figure 9: forest plot the risk of drug-related serious adverse events (15 mg vs. 5 mg). CI: confidence interval; M-H: Mantel-Haenszel.
Supplementary Figure 10: forest plot the risk of discontinuation-related adverse events (15 mg vs. 5 mg). CI: confidence interval; M-H: Mantel-Haenszel.
Supplementary Figure 11: forest plot the risk of deaths (15 mg vs. 5 mg). CI: confidence interval; M-H: Mantel-Haenszel.
Supplementary Figure 12: forest plot the risk of symptomatic hypoglycemia (15 mg vs. 5 mg). CI: confidence interval; M-H: Mantel-Haenszel.
Supplementary Figure 13: forest plot the risk of hypovolemia (15 mg vs. 5 mg). CI: confidence interval; M-H: Mantel-Haenszel.
Supplementary Figure 14: forest plot of the risk of GMIs between 15 mg and 5 mg groups by gender. CI: confidence interval; M-H: Mantel-Haenszel.
Supplementary Table 1: a: leave-one-out sensitivity analysis for UTIs (ertugliflozin vs. control). b: sensitivity analysis by excluding two studies that were not placebo-controlled. RR: risk ratio; CI: confidence interval; NA: not available.
Supplementary Table 2: a: leave-one-out sensitivity analysis for drug-related adverse events (ertugliflozin vs. control). b: sensitivity analysis by excluding two studies that were not placebo-controlled. RR: risk ratio; CI: confidence interval; NA: not available.
Supplementary Table 3: a: leave-one-out sensitivity analysis for discontinuation related to adverse events (ertugliflozin vs. control). b: sensitivity analysis by excluding two studies that were not placebo-controlled. RR: risk ratio; CI: confidence interval; NA: not available.
Supplementary Table 4: a: leave-one-out sensitivity analysis for symptomatic hypoglycemia (ertugliflozin vs. control). b: sensitivity analysis by excluding two studies that were not placebo-controlled. RR: risk ratio; CI: confidence interval; NA: not available.
Supplementary Table 5: leave-one-out sensitivity analysis for deaths (ertugliflozin vs. control). RR: risk ratio; CI: confidence interval; NA: not available.
Supplementary Table 6: a: leave-one-out sensitivity analysis for hypovolemia (ertugliflozin vs. control). b: sensitivity analysis by excluding two studies that were not placebo-controlled. RR: risk ratio; CI: confidence interval; NA: not available.
Supplementary Table 7: a: leave-one-out sensitivity analysis for GMI (female vs. male). b: sensitivity analysis by excluding two studies that were not placebo-controlled. RR: risk ratio; CI: confidence interval; NA: not available.
Supplementary Table 8: leave-one-out sensitivity analysis for GMI (15 mg vs. 5 mg). RR: risk ratio; CI: confidence interval; NA: not available.
Supplementary Table 9: leave-one-out sensitivity analysis for UTI (15 mg vs. 5 mg). RR: risk ratio; CI: confidence interval; NA: not available.
Supplementary Table 10: leave-one-out sensitivity analysis for drug-related adverse events (15 mg vs. 5 mg). RR: risk ratio; CI: confidence interval; NA: not available.
Supplementary Table 11: leave-one-out sensitivity analysis for discontinuation related to adverse events (15 mg vs. 5 mg). RR: risk ratio; CI: confidence interval; NA: not available.
Supplementary Table 12: leave-one-out sensitivity analysis for deaths (15 mg vs. 5 mg). RR: risk ratio; CI: confidence interval; NA: not available.
Supplementary Table 13: leave-one-out sensitivity analysis for symptomatic hypoglycemia (15 mg vs. 5 mg). RR: risk ratio; CI: confidence interval; NA: not available.
Supplementary Table 14: leave-one-out sensitivity analysis for hypovolemia (15 mg vs. 5 mg). RR: risk ratio; CI: confidence interval; NA: not available.
Supplementary Table 15: quality of evidence for the risk of GMIs and UTIs (ertugliflozin 5 mg vs. control). High quality: we are very confident that the true effect lies close to that of the estimate of the effect. Moderate quality: we are moderately confident in the effect estimate: the true effect is likely to be close to the estimate of the effect, but there is a possibility that it is substantially different. Low quality: our confidence in the effect estimate is limited: the true effect may be substantially different from the estimate of the effect. Very low quality: we have very little confidence in the effect estimate: the true effect is likely to be substantially different from the estimate of effect. CI: confidence interval; RR: risk ratio. aThe sample size is small. bThe number of included studies is too small. cAll trials are funded by the pharmaceutical industry, which leads to a high risk of other biases. dPoint estimates vary widely from study to study. eThe 95% confidence interval includes no effect (i.e., confidence interval includes RR of 1.0).
Supplementary Table 16: quality of evidence for the risk of GMIs and UTIs (ertugliflozin 15 mg vs. control). High quality: we are very confident that the true effect lies close to that of the estimate of the effect. Moderate quality: we are moderately confident in the effect estimate: the true effect is likely to be close to the estimate of the effect, but there is a possibility that it is substantially different. Low quality: our confidence in the effect estimate is limited: the true effect may be substantially different from the estimate of the effect. Very low quality: we have very little confidence in the effect estimate: the true effect is likely to be substantially different from the estimate of effect. CI: confidence interval; RR: risk ratio. aThe sample size is small. bThe number of included studies is too small. cAll trials are funded by the pharmaceutical industry, which leads to a high risk of other biases. dPoint estimates vary widely from study to study. eThe 95% confidence interval includes no effect (i.e., confidence interval includes RR of 1.0).
References
- 1.Saeedi P., Petersohn I., Salpea P., et al. Global and regional diabetes prevalence estimates for 2019 and projections for 2030 and 2045: Results from the International Diabetes Federation Diabetes Atlas, 9th edition. Diabetes Research and Clinical Practice. 2019;157, article 107843 doi: 10.1016/j.diabres.2019.107843. [DOI] [PubMed] [Google Scholar]
- 2.Inzucchi S. E., Bergenstal R. M., Buse J. B., et al. Management of hyperglycaemia in type 2 diabetes: a patient-centered approach. Position statement of the American Diabetes Association (ADA) and the European Association for the Study of Diabetes (EASD) Diabetologia. 2012;55(6):1577–1596. doi: 10.1007/s00125-012-2534-0. [DOI] [PubMed] [Google Scholar]
- 3.FDA. FDA warns about rare occurrences of a serious infection of the genital area with SGLT2 inhibitors for diabetes. 2018. https://www.fda.gov/drugs/drug-safety-and-availability/fda-warns-about-rare-occurrences-serious-infection-genital-area-sglt2-inhibitors-diabetes.
- 4.Medical Letter on Drugs and Therapeutics. Ertugliflozin for type 2 diabetes. JAMA. 2018;319(23):2434–2435. doi: 10.1001/jama.2018.5840. [DOI] [PubMed] [Google Scholar]
- 5.Scheen A. J. Pharmacodynamics, efficacy and safety of sodium-glucose co-transporter type 2 (SGLT2) inhibitors for the treatment of type 2 diabetes mellitus. Drugs. 2015;75(1):33–59. doi: 10.1007/s40265-014-0337-y. [DOI] [PubMed] [Google Scholar]
- 6.Rosenstock J., Frias J., Páll D., et al. Effect of ertugliflozin on glucose control, body weight, blood pressure and bone density in type 2 diabetes mellitus inadequately controlled on metformin monotherapy (VERTIS MET) Diabetes Obesity & Metabolism. 2018;20(3):520–529. doi: 10.1111/dom.13103. [DOI] [PubMed] [Google Scholar]
- 7.Miller S., Krumins T., Zhou H., et al. Ertugliflozin and sitagliptin co-initiation in patients with type 2 diabetes: the VERTIS SITA randomized study. Diabetes Therapy. 2018;9(1):253–268. doi: 10.1007/s13300-017-0358-0. [DOI] [PMC free article] [PubMed] [Google Scholar]
- 8.McNeill A. M., Davies G., Kruger E., et al. Ertugliflozin compared to other anti-hyperglycemic agents as monotherapy and add-on therapy in type 2 diabetes: a systematic literature review and network meta-analysis. Diabetes Therapy. 2019;10(2):473–491. doi: 10.1007/s13300-019-0566-x. [DOI] [PMC free article] [PubMed] [Google Scholar]
- 9.Liu J., Tarasenko L., Terra S. G., et al. Efficacy of ertugliflozin in monotherapy or combination therapy in patients with type 2 diabetes: a pooled analysis of placebo-controlled studies. Diabetes & Vascular Disease Research. 2019;16(5):415–423. doi: 10.1177/1479164119842513. [DOI] [PubMed] [Google Scholar]
- 10.Higgins J. P. T., Green S. Cochrane Handbook for Systematic Reviews of Interventions Version 5.1.0. The Cochrane Collaboration; 2011. [Google Scholar]
- 11.Moher D., Liberati A., Tetzlaff J., Altman D. G., for the PRISMA Group Preferred reporting items for systematic reviews and meta-analyses: the PRISMA statement. BMJ. 2009;339(1, article b2535) doi: 10.1136/bmj.b2535. [DOI] [PMC free article] [PubMed] [Google Scholar]
- 12.Higgins J. P. T., Altman D. G., Gotzsche P. C., et al. The Cochrane Collaboration’s tool for assessing risk of bias in randomised trials. BMJ. 2011;343:p. 5928. doi: 10.1136/bmj.d5928. [DOI] [PMC free article] [PubMed] [Google Scholar]
- 13.Guyatt G. H., Oxman A. D., Vist G. E., et al. GRADE: an emerging consensus on rating quality of evidence and strength of recommendations. BMJ. 2008;336(7650):924–926. doi: 10.1136/bmj.39489.470347.AD. [DOI] [PMC free article] [PubMed] [Google Scholar]
- 14.Ji L., Liu Y., Miao H., et al. Safety and efficacy of ertugliflozin in Asian patients with type 2 diabetes mellitus inadequately controlled with metformin monotherapy: VERTIS Asia. Diabetes, Obesity and Metabolism. 2019;21(6):1474–1482. doi: 10.1111/dom.13681. [DOI] [PMC free article] [PubMed] [Google Scholar]
- 15.Hollander P., Hill J., Johnson J., et al. Results of VERTIS SU extension study: safety and efficacy of ertugliflozin treatment over 104 weeks compared to glimepiride in patients with type 2 diabetes mellitus inadequately controlled on metformin. Current Medical Research and Opinion. 2019;35(8):1335–1343. doi: 10.1080/03007995.2019.1583450. [DOI] [PubMed] [Google Scholar]
- 16.Gallo S., Charbonnel B., Goldman A., et al. Long-term efficacy and safety of ertugliflozin in patients with type 2 diabetes mellitus inadequately controlled with metformin monotherapy: 104-week VERTIS MET trial. Diabetes Obesity & Metabolism. 2019;21(4):1027–1036. doi: 10.1111/dom.13631. [DOI] [PMC free article] [PubMed] [Google Scholar]
- 17.Pratley R. E., Eldor R., Raji A., et al. Ertugliflozin plus sitagliptin versus either individual agent over 52 weeks in patients with type 2 diabetes mellitus inadequately controlled with metformin: the VERTIS FACTORIAL randomized trial. Diabetes, Obesity & Metabolism. 2018;20(5):1111–1120. doi: 10.1111/dom.13194. [DOI] [PMC free article] [PubMed] [Google Scholar]
- 18.Hollander P., Liu J., Hill J., et al. Ertugliflozin compared with glimepiride in patients with type 2 diabetes mellitus inadequately controlled on metformin: the VERTIS SU randomized study. Diabetes Therapy. 2018;9(1):193–207. doi: 10.1007/s13300-017-0354-4. [DOI] [PMC free article] [PubMed] [Google Scholar]
- 19.Dagogo-Jack S., Liu J., Eldor R., et al. Efficacy and safety of the addition of ertugliflozin in patients with type 2 diabetes mellitus inadequately controlled with metformin and sitagliptin: the VERTIS SITA2 placebo-controlled randomized study. Diabetes Obesity & Metabolism. 2018;20(3):530–540. doi: 10.1111/dom.13116. [DOI] [PMC free article] [PubMed] [Google Scholar]
- 20.Aronson R., Frias J., Goldman A., Darekar A., Lauring B., Terra S. G. Long-term efficacy and safety of ertugliflozin monotherapy in patients with inadequately controlled T2DM despite diet and exercise: VERTIS MONO extension study. Diabetes Obesity & Metabolism. 2018;20(6):1453–1460. doi: 10.1111/dom.13251. [DOI] [PMC free article] [PubMed] [Google Scholar]
- 21.Terra S. G., Focht K., Davies M., et al. Phase III, efficacy and safety study of ertugliflozin monotherapy in people with type 2 diabetes mellitus inadequately controlled with diet and exercise alone. Diabetes, Obesity & Metabolism. 2017;19(5):721–728. doi: 10.1111/dom.12888. [DOI] [PubMed] [Google Scholar]
- 22.Geerlings S. E., Hoepelman A. I. Immune dysfunction in patients with diabetes mellitus (DM) FEMS Immunology and Medical Microbiology. 1999;26(3-4):259–265. doi: 10.1111/j.1574-695X.1999.tb01397.x. [DOI] [PubMed] [Google Scholar]
- 23.Ferrannini E., Solini A. SGLT2 inhibition in diabetes mellitus: rationale and clinical prospects. Nature Reviews Endocrinology. 2012;8(8):495–502. doi: 10.1038/nrendo.2011.243. [DOI] [PubMed] [Google Scholar]
- 24.Yokoyama H., Nagao A., Watanabe S., Honjo J. Incidence and risk of vaginal candidiasis associated with sodium-glucose cotransporter 2 inhibitors in real-world practice for women with type 2 diabetes. Journal of Diabetes Investigation. 2019;10(2):439–445. doi: 10.1111/jdi.12912. [DOI] [PMC free article] [PubMed] [Google Scholar]
- 25.Geerlings S. E., Brouwer E. C., Gaastra W., Verhoef J., Hoepelman A. I. M. Effect of glucose and pH on uropathogenic and non-uropathogenic Escherichia coli studies with urine from diabetic and non-diabetic individuals. Journal of Medical Microbiology. 1999;48(6):535–539. doi: 10.1099/00222615-48-6-535. [DOI] [PubMed] [Google Scholar]
- 26.Mirabelli M., Chiefari E., Caroleo P., et al. Long-term effectiveness and safety of SGLT-2 inhibitors in an Italian cohort of patients with type 2 diabetes mellitus. Journal Diabetes Research. 2019;2019, article 3971060:8. doi: 10.1155/2019/3971060. [DOI] [PMC free article] [PubMed] [Google Scholar]
- 27.Li D., Wang T., Shen S., Fang Z., Dong Y., Tang H. Urinary tract and genital infections in patients with type 2 diabetes treated with sodium-glucose co-transporter 2 inhibitors: a meta-analysis of randomized controlled trials. Diabetes, Obesity & Metabolism. 2017;19(3):348–355. doi: 10.1111/dom.12825. [DOI] [PubMed] [Google Scholar]
- 28.Donnan J. R., Grandy C. A., Chibrikov E., et al. Dose response of sodium glucose cotransporter-2 inhibitors in relation to urinary tract infections: a systematic review and network meta-analysis of randomized controlled trials. CMAJ Open. 2018;6(4):594–602. doi: 10.9778/cmajo.20180111. [DOI] [PMC free article] [PubMed] [Google Scholar]
- 29.Santer R., Calado J. Familial renal glucosuria and SGLT2: from a mendelian trait to a therapeutic target. Clinical Journal of the American Society of Nephrology. 2010;5(1):133–141. doi: 10.2215/CJN.04010609. [DOI] [PubMed] [Google Scholar]
- 30.Jingfan Z., Ling L., Cong L., Ping L., Yu C. Efficacy and safety of sodium-glucose cotransporter-2 inhibitors in type 2 diabetes mellitus with inadequate glycemic control on metformin: a meta-analysis. Archives of Endocrinology and Metabolism. 2019;63(5):478–486. doi: 10.20945/2359-3997000000146. [DOI] [PMC free article] [PubMed] [Google Scholar]
- 31.Liu J., Li L., Li S., et al. Effects of SGLT2 inhibitors on UTIs and genital infections in type 2 diabetes mellitus: a systematic review and meta-analysis. Scientific Reports. 2017;7(1):p. 2824. doi: 10.1038/s41598-017-02733-w. [DOI] [PMC free article] [PubMed] [Google Scholar]
- 32.Wu J. H. Y., Foote C., Blomster J., et al. Effects of sodium-glucose cotransporter-2 inhibitors on cardiovascular events, death, and major safety outcomes in adults with type 2 diabetes: a systematic review and meta-analysis. The Lancet Diabetes and Endocrinology. 2016;4(5):411–419. doi: 10.1016/S2213-8587(16)00052-8. [DOI] [PubMed] [Google Scholar]
- 33.Zhao X., Cui Y., Zhao S., et al. Pharmacokinetic and pharmacodynamic properties and tolerability of single- and multiple-dose once-daily empagliflozin, a sodium glucose cotransporter 2 inhibitor, in Chinese patients with type 2 diabetes mellitus. Clinical Therapeutics. 2015;37(7):1493–1502. doi: 10.1016/j.clinthera.2015.05.001. [DOI] [PubMed] [Google Scholar]
- 34.Rådholm K., Zhou Z., Clemens K., Neal B., Woodward M. Effects of sodium-glucose co-transporter-2 inhibitors in type 2 diabetes in women versus men. Diabetes, Obesity & Metabolism. 2019;22(2):263–266. doi: 10.1111/dom.13876. [DOI] [PubMed] [Google Scholar]
- 35.McGovern A. P., Hogg M., Shields B. M., et al. Risk factors for genital infections in people initiating SGLT2 inhibitors and their impact on discontinuation. BMJ Open Diabetes Research & Care. 2020;8(1, article e001238) doi: 10.1136/bmjdrc-2020-001238. [DOI] [PMC free article] [PubMed] [Google Scholar]
- 36.Katsiki N., Papanas N., Mikhailidis D. P. Dapagliflozin more than just another oral glucose-lowering agent. Expert Opinion on Investigational Drugs. 2010;19(12):1581–1589. doi: 10.1517/13543784.2011.539558. [DOI] [PubMed] [Google Scholar]
- 37.Bennett W. L., Maruthur N. M., Singh S., et al. Comparative effectiveness and safety of medications for type 2 diabetes: an update including new drugs and 2-drug combinations. Annals of Internal Medicine. 2011;154(9):602–613. doi: 10.7326/0003-4819-154-9-201105030-00336. [DOI] [PMC free article] [PubMed] [Google Scholar]
- 38.Cefalu W. T., Leiter L. A., Yoon K. H., et al. Efficacy and safety of canagliflozin versus glimepiride in patients with type 2 diabetes inadequately controlled with metformin (CANTATA-SU): 52 week results from a randomised, double-blind, phase 3 non-inferiority trial. The Lancet. 2013;382(9896):941–950. doi: 10.1016/S0140-6736(13)60683-2. [DOI] [PubMed] [Google Scholar]
Associated Data
This section collects any data citations, data availability statements, or supplementary materials included in this article.
Supplementary Materials
Supplementary Figure 1: forest plot of the risk of drug-related adverse events (ertugliflozin vs. control). CI: confidence interval; M-H: Mantel-Haenszel.
Supplementary Figure 2: forest plot of the risk of discontinuation-related adverse events (ertugliflozin vs. control). CI: confidence interval; M-H: Mantel-Haenszel.
Supplementary Figure 3: Forest plot of the risk of symptomatic hypoglycemia (ertugliflozin vs. control). CI: confidence interval; M-H: Mantel-Haenszel.
Supplementary Figure 4: forest plot of the risk of drug-related serious adverse events (ertugliflozin vs. control). CI: confidence interval; M-H: Mantel-Haenszel.
Supplementary Figure 5: forest plot of the risk of deaths (ertugliflozin vs. control). CI: confidence interval; M-H: Mantel-Haenszel.
Supplementary Figure 6: forest plot of the risk of hypovolemia (ertugliflozin vs. control). CI: confidence interval; M-H: Mantel-Haenszel.
Supplementary Figure 7: forest plot the risk of UTIs (15 mg vs. 5 mg). CI: confidence interval; M-H: Mantel-Haenszel.
Supplementary Figure 8: forest plot the risk of drug-related adverse events (15 mg vs. 5 mg). CI: confidence interval; M-H: Mantel-Haenszel.
Supplementary Figure 9: forest plot the risk of drug-related serious adverse events (15 mg vs. 5 mg). CI: confidence interval; M-H: Mantel-Haenszel.
Supplementary Figure 10: forest plot the risk of discontinuation-related adverse events (15 mg vs. 5 mg). CI: confidence interval; M-H: Mantel-Haenszel.
Supplementary Figure 11: forest plot the risk of deaths (15 mg vs. 5 mg). CI: confidence interval; M-H: Mantel-Haenszel.
Supplementary Figure 12: forest plot the risk of symptomatic hypoglycemia (15 mg vs. 5 mg). CI: confidence interval; M-H: Mantel-Haenszel.
Supplementary Figure 13: forest plot the risk of hypovolemia (15 mg vs. 5 mg). CI: confidence interval; M-H: Mantel-Haenszel.
Supplementary Figure 14: forest plot of the risk of GMIs between 15 mg and 5 mg groups by gender. CI: confidence interval; M-H: Mantel-Haenszel.
Supplementary Table 1: a: leave-one-out sensitivity analysis for UTIs (ertugliflozin vs. control). b: sensitivity analysis by excluding two studies that were not placebo-controlled. RR: risk ratio; CI: confidence interval; NA: not available.
Supplementary Table 2: a: leave-one-out sensitivity analysis for drug-related adverse events (ertugliflozin vs. control). b: sensitivity analysis by excluding two studies that were not placebo-controlled. RR: risk ratio; CI: confidence interval; NA: not available.
Supplementary Table 3: a: leave-one-out sensitivity analysis for discontinuation related to adverse events (ertugliflozin vs. control). b: sensitivity analysis by excluding two studies that were not placebo-controlled. RR: risk ratio; CI: confidence interval; NA: not available.
Supplementary Table 4: a: leave-one-out sensitivity analysis for symptomatic hypoglycemia (ertugliflozin vs. control). b: sensitivity analysis by excluding two studies that were not placebo-controlled. RR: risk ratio; CI: confidence interval; NA: not available.
Supplementary Table 5: leave-one-out sensitivity analysis for deaths (ertugliflozin vs. control). RR: risk ratio; CI: confidence interval; NA: not available.
Supplementary Table 6: a: leave-one-out sensitivity analysis for hypovolemia (ertugliflozin vs. control). b: sensitivity analysis by excluding two studies that were not placebo-controlled. RR: risk ratio; CI: confidence interval; NA: not available.
Supplementary Table 7: a: leave-one-out sensitivity analysis for GMI (female vs. male). b: sensitivity analysis by excluding two studies that were not placebo-controlled. RR: risk ratio; CI: confidence interval; NA: not available.
Supplementary Table 8: leave-one-out sensitivity analysis for GMI (15 mg vs. 5 mg). RR: risk ratio; CI: confidence interval; NA: not available.
Supplementary Table 9: leave-one-out sensitivity analysis for UTI (15 mg vs. 5 mg). RR: risk ratio; CI: confidence interval; NA: not available.
Supplementary Table 10: leave-one-out sensitivity analysis for drug-related adverse events (15 mg vs. 5 mg). RR: risk ratio; CI: confidence interval; NA: not available.
Supplementary Table 11: leave-one-out sensitivity analysis for discontinuation related to adverse events (15 mg vs. 5 mg). RR: risk ratio; CI: confidence interval; NA: not available.
Supplementary Table 12: leave-one-out sensitivity analysis for deaths (15 mg vs. 5 mg). RR: risk ratio; CI: confidence interval; NA: not available.
Supplementary Table 13: leave-one-out sensitivity analysis for symptomatic hypoglycemia (15 mg vs. 5 mg). RR: risk ratio; CI: confidence interval; NA: not available.
Supplementary Table 14: leave-one-out sensitivity analysis for hypovolemia (15 mg vs. 5 mg). RR: risk ratio; CI: confidence interval; NA: not available.
Supplementary Table 15: quality of evidence for the risk of GMIs and UTIs (ertugliflozin 5 mg vs. control). High quality: we are very confident that the true effect lies close to that of the estimate of the effect. Moderate quality: we are moderately confident in the effect estimate: the true effect is likely to be close to the estimate of the effect, but there is a possibility that it is substantially different. Low quality: our confidence in the effect estimate is limited: the true effect may be substantially different from the estimate of the effect. Very low quality: we have very little confidence in the effect estimate: the true effect is likely to be substantially different from the estimate of effect. CI: confidence interval; RR: risk ratio. aThe sample size is small. bThe number of included studies is too small. cAll trials are funded by the pharmaceutical industry, which leads to a high risk of other biases. dPoint estimates vary widely from study to study. eThe 95% confidence interval includes no effect (i.e., confidence interval includes RR of 1.0).
Supplementary Table 16: quality of evidence for the risk of GMIs and UTIs (ertugliflozin 15 mg vs. control). High quality: we are very confident that the true effect lies close to that of the estimate of the effect. Moderate quality: we are moderately confident in the effect estimate: the true effect is likely to be close to the estimate of the effect, but there is a possibility that it is substantially different. Low quality: our confidence in the effect estimate is limited: the true effect may be substantially different from the estimate of the effect. Very low quality: we have very little confidence in the effect estimate: the true effect is likely to be substantially different from the estimate of effect. CI: confidence interval; RR: risk ratio. aThe sample size is small. bThe number of included studies is too small. cAll trials are funded by the pharmaceutical industry, which leads to a high risk of other biases. dPoint estimates vary widely from study to study. eThe 95% confidence interval includes no effect (i.e., confidence interval includes RR of 1.0).
Data Availability Statement
Data can be obtained from the original research articles included in this study. In addition, the data used to support the findings of this study are available from the corresponding author upon request.