

Abstract
Aims:
To compare cardiovascular risk factor control in adults with diabetes participating in a national diabetes registry to those in the general population and to ascertain regional differences in diabetes care.
Methods:
Adults with diagnosed diabetes in the Diabetes Collaborative Registry (DCR) were compared with those in the National Health and Nutrition Examination Survey (NHANES) from 2015–2016; standardized mean difference (SMD)>0.2 defined significance. Regional differences were assessed in the DCR cohort; p<.05 defined significance.
Results:
The DCR cohort was older (61 vs. 57 years, SMD=0.38), more insured (99.7% vs. 91.0%, SMD=0.42), and less ethnically diverse (83% non-Hispanic white vs. 76%, SMD=0.30) compared with NHANES. The proportion of overweight/obesity, A1c<7% (<53 mmol/mol), and BP<140/90 were similar, but DCR participants had higher proportion with LDL<2.59 mmol/L (61% vs. 41%, SMD=0.39) and fewer tobacco users (17% vs. 32%, SMD=0.35). Regionally, obesity, lack of glycaemic control, and tobacco use were highest in the Midwest, BP control was the lowest in the South, and LDL control was lowest in the Northeast.
Conclusions:
Significant regional differences in diabetes care delivery and outcomes were identified using a national diabetes registry. Serial analyses of the DCR may supplement national evaluations to deepen our understanding of diabetes care in the US.
Keywords: Diabetes Mellitus, Cardiovascular Disease, Risk Factors, Pharmacoepidemiology, Population Health, Health Services Research
1. Introduction
Diabetes mellitus remains a major cause of morbidity and premature mortality in the United States (US).1 Failure to adequately manage cardiovascular risk factors contributes significantly to negative outcomes, including heart disease and stroke.2–4 National registries and surveys have been developed to identify opportunities for improving cardiovascular disease risk factor management in persons with diabetes.
The National Health and Nutrition Examination Survey (NHANES) has evaluated nationally-representative US cohorts for 20 years, informing national trends in the management and outcomes of persons living with diabetes.5, 6 However, the biennial assessments were not designed to inform geographic differences in diabetes care which could inform health policy at regional levels.2, 7 Analyses of health system data, insurance claims information, and state and local registries have evaluated diabetes care in specific catchments, but variable study designs prevent evaluation of broader regional differences in the US population.6–11
The Diabetes Collaborative Registry (DCR) is the largest, multi-site diabetes registry in the US, collecting electronic health data of persons with diabetes from outpatient visits to primary care, endocrinology, and cardiology practices.12 This registry may inform regional differences in the management of cardiovascular disease risk in adults with diabetes to supplement broader, national evaluations conducted on a biennial basis. However, the extent to which DCR participants are representative of the general population of persons with diabetes in the US is not known.
We compared persons with diagnosed diabetes participating in the DCR to the general population as assessed by NHANES using 2015–2016 data. Then, we evaluated geographic differences in demographic and clinical characteristics of the DCR cohort according to US Census region.
2. Methods
2.1. Data Sources
Diabetes Collaborative Registry (DCR)
The DCR is a prospective, outpatient, quality improvement registry of persons with diabetes and prediabetes, seen in ambulatory care settings across the US. With administrative oversight by the American College of Cardiology’s National Cardiovascular Data Registries, DCR was launched in 2014 as a collaborative effort by several partner professional societies and includes primary care, endocrinology, and cardiology practices.
Individuals in the DCR have physician-diagnosed diabetes based on standardized criteria used in clinical care. Longitudinal patient data are collected at the point of care through an automated system integration solution that periodically extracts relevant data elements from electronic health records (EHRs), including demographics, comorbidities, clinical factors, laboratory values, and medications. Data collection is standardized using established definitions, uniform data entry and transmission, and quality checks. As a specialty registry recognized by the Center for Medicare and Medicaid Services (CMS), the DCR is periodically audited to ensure the accuracy of data for participation in federal incentive programs. For persons with multiple clinic visits between 2015–2106, data from the most recent visit were analysed. DCR participation requires no data collection beyond that of routine clinical care, and a waiver of written informed consent was granted by Chesapeake Research Review.
NHANES
NHANES is a program of studies designed to assess the health and nutrition of adults and children in the US. NHANES uses stratified, multistage, probability-cluster techniques to ensure a representative sample of the nation’s non-institutionalized civilian population. NHANES data include interview data for demographic, socioeconomic, and health-related questions in addition to examination data for physiological and laboratory measurements conducted by trained medical personnel. All participants provided written informed consent and the research ethics board of the National Center for Health Statistics approved all NHANES protocols.
2.2. Study Population
Adults in both cohorts aged 18–75 years with a diabetes diagnosis were included; those with a diagnosis of gestational or prediabetes were excluded. Only participants with a measure of glycated haemoglobin (A1c) were included in the analysis.
For DCR, participants with a diagnosis code from the International Classification of Diseases, 9th Revision (ICD-9) or 10th Revision (ICD-10) indicating type 2 diabetes or type 1 diabetes were included. Similarly, relevant ICD codes from each participant’s problem list were used to identify physician-diagnosed hypertension and dyslipidaemia. To better represent the general population with diabetes, DCR practices were restricted to primary care settings based on CMS’s Healthcare Provider Taxonomy Codes for internal medicine, family practice, and general practice, resulting in inclusion of 212 sites. The DCR cohort was divided according to US Census Region (Northeast, Midwest, South, and West) based on location of the clinical practice.
For NHANES, a ‘yes’ response to the question ‘Other than during pregnancy, {have you/has Sample Person}/{Have you/Has Sample Person}} ever been told by a doctor or health professional that {you have/{he/she/Sample Person} has} diabetes or sugar diabetes?’ identified participants with a diabetes diagnosis. NHANES participants who had laboratory evidence of diabetes but did not report a diabetes diagnosis were classified as “undiagnosed diabetes” and excluded from the analysis. Similarly, respondents were asked if they had ever been told by a doctor or other health professional that they had hypertension or dyslipidaemia. A ‘yes’ response defined NHANES participants as being diagnosed with hypertension and/or dyslipidaemia, respectively.
2.3. Data Collection
Clinical data were collected by automated extraction from EHRs of clinical sites participating in DCR and through interview and laboratory testing in NHANES. Body mass index (BMI) categories were defined as underweight (BMI <18.5 kg/m2), normal weight (BMI 18.5–24.9 kg/m2), overweight (BMI 25.0–29.9 kg/m2) and obese (BMI ≥30 kg/m2). Blood pressure (BP) control was defined as systolic BP (SBP)<140 mmHg and diastolic BP (DBP) <90 mmHg, while lipid control was defined as LDL cholesterol (LDL) <2.59 mmol/L. Control of A1c, BP, and cholesterol (“ABC control”) was defined as composite attainment of A1c<7.0% (<53 mmol/mol), BP<140/90 mmHg and LDL <2.59 mmol/L.
Use of glucose-lowering, antihypertensive, and lipid-lowering medications was analysed in relation to control of the respective CVD risk factor. Medication data were extracted directly from EHRs for DCR participants using the most recent observation. NHANES respondents were asked about medication use in the past 30 days from the time of the interview.
2.4. Statistical Analysis
Comparisons between DCR and NHANES are followed by regional analyses of the DCR cohort. NHANES analyses were weighted to account for the NHANES complex design. The weights were provided by NCHS as they are designed to account for unequal probabilities of selection and non-response. Demographics, clinical characteristics, and medication use were reported as percentages (categorical variables) or means±SD (continuous variables). P values were generated via Chi-square or t tests, as appropriate.
Due to the large difference in sample size between the DCR and NHANES cohorts, standardized mean difference (SMD) was calculated for each comparison by dividing the difference in means by the pooled standard deviation; these values are presented alongside or in lieu of p values. SMD was calculated for categorical variables using the multivariate Mahalanobis distance method as described by Yang and Dalton.13 We characterized effect sizes based on SMD as large (SMD >0.8), moderate (SMD >0.5–0.8), and small (SMD >0.2–0.5).14 For regional analyses of the DCR cohort, p values <.05 defined significance. Statistical analyses were performed using SAS version 9.4 (SAS Institute, Cary, NC).
3. Results
3.1. Participant characteristics
Figure 1 presents sample derivation for the DCR and NHANES cohorts. The DCR cohort included 67,433 adults with diabetes (98% type 2 diabetes) seen in a primary care setting between 2015–2016 with an available A1c value. In the DCR cohort, 18% of adults received diabetes care in the Northeast, 17% in the Midwest, 62% in the South, and 3% in the West. The weighted NHANES 2015–2016 sample represented 21,479,573 people in the US population with an available A1c value. Table 1 presents demographic and clinical characteristics of the DCR and NHANES cohorts. The DCR cohort was older (61±10 years vs. 57±12 years, SMD=0.38) and comprised of a larger percentage of non-Hispanic white (83% vs. 76%, SMD=0.30). Nearly all DCR participants had insurance compared with NHANES participants (99.7% vs. 91.0%, SMD=0.42).
Figure 1.
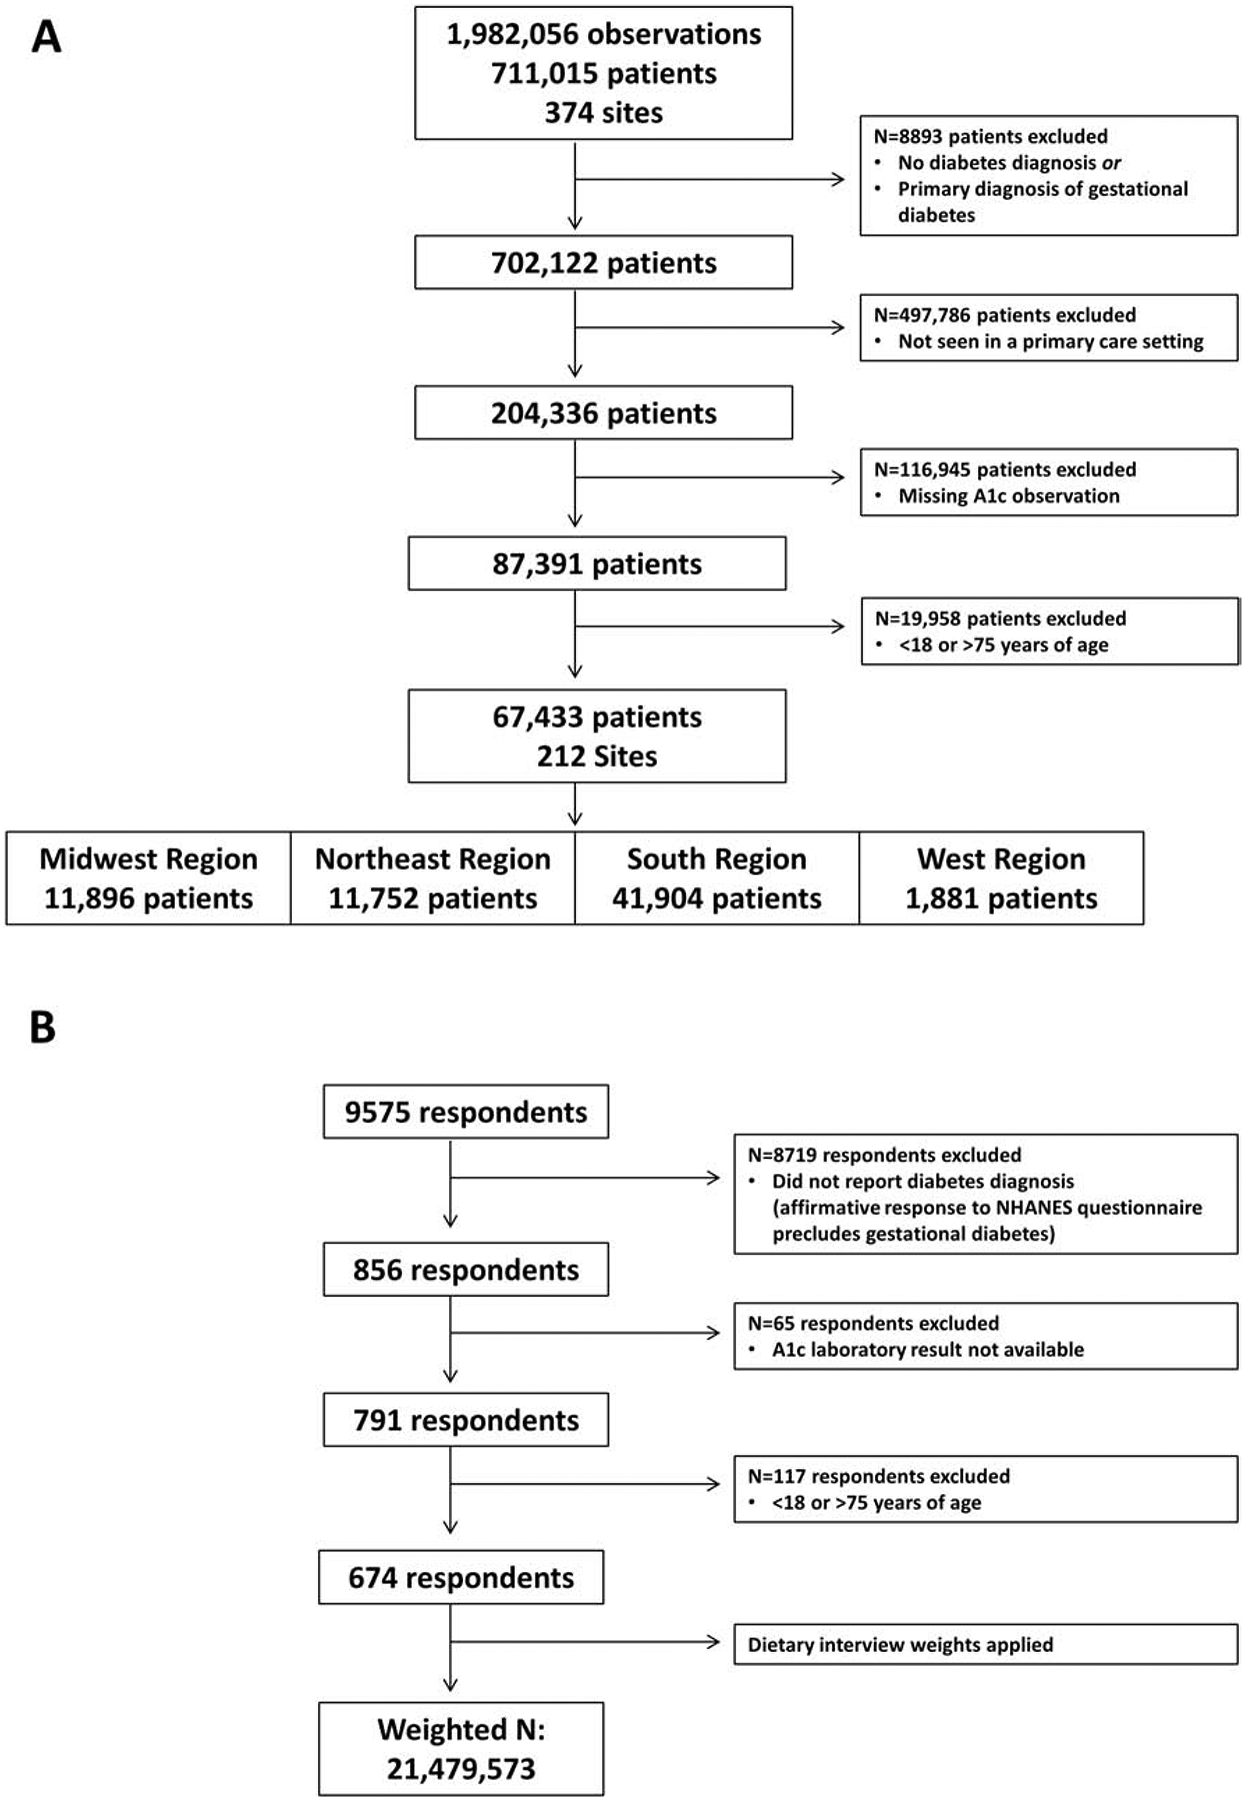
Sample derivation for the (A) DCR and (B) NHANES cohorts.
Table 1.
Demographic and clinical characteristics of the DCR and NHANES cohorts.
| DCR | NHANES | |||
|---|---|---|---|---|
| N=67433 | N=21479573* | |||
| Mean ± SD / % | Mean ± SD / % | p value | SMD† | |
| Age (years) | 61 ± 10 | 57 ± 12 | <0.001 | 0.38 |
| Sex (male) | 52 | 56 | <0.001 | 0.08 |
| Race | ||||
| White non-Hispanic | 83 | 76 | <0.001 | 0.30 |
| Black non-Hispanic | 14 | 15 | ||
| Other | 3 | 9 | ||
| Insurance coverage | 100 | 91 | <0.001 | 0.42 |
| Height (cm) | 170 ± 11 | 168 ± 10 | 0.08 | 0.18 |
| Weight (kg) | 97 ± 24 | 94 ± 23 | 0.22 | 0.12 |
| Body mass index (kg/m2) | 33.3 ± 7.3 | 33.2 ± 7.6 | 0.96 | 0.05 |
| Body mass index category | ||||
| Underweight (<18.5 kg/m2) | 0.5 | 0.5 | <0.001 | 0.03 |
| Normal (18.5–24.9 kg/m2) | 9 | 10 | ||
| Overweight (25–29.9 kg/m2) | 26 | 26 | ||
| Obese (≥30 kg/m2) | 65 | 64 | ||
| HbA1c (%) | 7.5 ± 2.2 | 7.4 ± 1.8 | 0.60 | 0.03 |
| HbA1c (mmol/mol) | 58.1 ± 24.4 | 57.3 ± 20.0 | 0.60 | 0.03 |
| HbA1c category | <0.001 | 0.16 | ||
| <7% (<53 mmol/mol) | 56 | 51 | ||
| 7–9% (53–75 mmol/mol) | 27 | 35 | ||
| >9% (>75 mmol/mol) | 16 | 15 | ||
| Systolic blood pressure (mmHg) | 130 ± 17 | 129 ± 19 | 0.29 | 0.08 |
| Diastolic blood pressure (mmHg) | 76 ± 10 | 70 ± 13 | <0.001 | 0.58 |
| Blood pressure< 140/90 mmHG | 70 | 74 | <0.001 | 0.09 |
| Total cholesterol (mmol/L) | 4.45 ± 1.09 | 4.66 ± 1.17 | 0.050 | 0.18 |
| High density lipoprotein (mmol/L) | 1.22 ± 0.39 | 1.24 ± 0.39 | 0.73 | 0.03 |
| Low density lipoprotein (mmol/L) | 2.43 ± 0.91 | 3.34 ± 2.38 | <0.001 | 0.50 |
| Triglycerides (mmol/L) | 1.81 ± 1.07 | 2.21 ± 1.63 | 0.007 | 0.29 |
| Low density lipoprotein<2.59 mmol/L | 61 | 41 | <0.001 | 0.39 |
| ‘ABC’ control†† | 18.8 | 6.0 | <0.001 | 0.40 |
| Tobacco use | 17 | 32 | <0.001 | 0.35 |
| Hypertension | 81 | 66 | <0.001 | 0.37 |
| Dyslipidaemia | 83 | 63 | <0.001 | 0.48 |
| Medication Use | ||||
| Insulin | 18 | 27 | <0.001 | 0.22 |
| Oral hypoglycaemic agent | 56 | 71 | <0.001 | 0.33 |
| Cholesterol-lowering | 71 | 67 | <0.001 | 0.08 |
| Anti-hypertensive | 79 | 95 | <0.001 | 0.50 |
Weighted sample size
Standardized mean difference
HbA1c<7% (<53 mmol/mol), blood pressure <140/90 mmHg and low density lipoprotein <2.59 mmol/L
Regional differences within the DCR cohort are presented in Table 2. The West region comprised the oldest cohort and the Northeast comprised the youngest (p<.0001). The percentage of men differed by region with the smallest percentage in the South region. A majority of DCR participants were non-Hispanic white across all regions; the largest percentage of non-Hispanic blacks were in the South (p<.0001). Insurance coverage rates were high across all regions (99–100%).
Table 2.
Demographic and clinical characteristics of the DCR cohort by geographical region.
| Midwest | Northeast | South | West | ||
|---|---|---|---|---|---|
| N=11896 | N=11753 | N=41904 | N=1881 | ||
| Mean ± SD / % | Mean ± SD / % | Mean ± SD / % | Mean ± SD / % | p value | |
| Age (years) | 62 ± 10 | 61 ± 10 | 61 ± 11 | 64 ± 9 | <0.001 |
| Sex (male) | 53 | 56 | 50 | 59 | <0.001 |
| Race | <0.001 | ||||
| White non-Hispanic | 85 | 89 | 81 | 88 | |
| Black non-Hispanic | 13 | 8 | 17 | 6 | |
| Other | 2 | 3 | 2 | 7 | |
| Insurance coverage | 99 | 100 | 100 | 99 | <0.001 |
| Height (cm) | 170 ± 11 | 170 ± 11 | 170 ± 11 | 171 ± 11 | <0.001 |
| Weight (kg) | 100 ± 25 | 94 ± 22 | 97 ± 23 | 98 ± 24 | <0.001 |
| Body mass index (kg/m2) | 34.4 ± 7.9 | 32.3 ± 6.8 | 33.3 ± 7.3 | 33.2 ± 7.2 | <0.001 |
| Body mass index category | <0.001 | ||||
| Underweight (<18.5 kg/m2) | 0.5 | 0.5 | 0.5 | 0.5 | |
| Normal (18.5–24.9 kg/m2) | 8 | 11 | 9 | 9 | |
| Overweight (25–29.9 kg/m2) | 22 | 29 | 26 | 24 | |
| Obese (≥30 kg/m2) | 70 | 60 | 65 | 66 | |
| HbA1c (%) | 8.5 ± 3.0 | 7.0 ± 1.7 | 7.3 ± 2.1 | 7.5 ± 1.9 | <0.001 |
| HbA1c (mmol/mol) | 68.9 ± 32.5 | 52.5 ± 18.1 | 56.5 ± 22.5 | 58.2 ± 20.9 | <0.001 |
| HbA1c category | <0.001 | ||||
| <7% (<53 mmol/mol) | 43 | 66 | 58 | 51 | |
| 7–9% (53–75 mmol/mol) | 28 | 25 | 27 | 34 | |
| >9% (>75 mmol/mol) | 29 | 10 | 15 | 16 | |
| Systolic blood pressure (mmHg) | 129 ± 18 | 128 ± 15 | 131 ± 17 | 128 ± 17 | <0.001 |
| Diastolic blood pressure (mmHg) | 73 ± 12 | 77 ± 9 | 77 ± 10 | 74 ± 11 | <0.001 |
| Blood pressure< 140/90 mmHG | 72 | 74 | 68 | 73 | <0.001 |
| Total cholesterol (mmol/L) | 4.22 ± 1.09 | 4.55 ± 1.03 | 4.50 ± 1.09 | 4.11 ± 1.11 | <0.001 |
| High density lipoprotein (mmol/L) | 1.22 ± 0.39 | 1.29 ± 0.41 | 1.22 ± 0.39 | 1.16 ± 0.36 | <0.001 |
| Low density lipoprotein (mmol/L) | 2.20± 0.91 | 2.51 ± 0.88 | 2.51 ± 0.91 | 2.12 ± 0.88 | <0.001 |
| Triglycerides (mmol/L) | 1.84 ± 1.04 | 1.75 ± 1.02 | 1.81 ± 1.10 | 1.85 ± 1.10 | <0.001 |
| Low density lipoprotein<2.59 mmol/L | 72 | 58 | 58 | 74 | <0.001 |
| ‘ABC’ control† | 14.3 | 20.9 | 19.5 | 18.7 | <0.001 |
| Tobacco use | 27 | 13 | 16 | 19 | <0.001 |
| Hypertension | 77 | 79 | 83 | 88 | <0.001 |
| Dyslipidaemia | 76 | 85 | 85 | 89 | <0.001 |
| Medication Use | |||||
| Insulin | 27 | 15 | 16 | 33 | <0.001 |
| Oral hypoglycaemic agent | 59 | 50 | 55 | 69 | <0.001 |
| Cholesterol-lowering | 77 | 67 | 69 | 88 | <0.001 |
| Anti-hypertensive | 89 | 72 | 78 | 96 | <0.001 |
HbA1c<7% (<53 mmol/mol), blood pressure <140/90 mmHg and low density lipoprotein <2.59 mmol/L
3.2. Cardiovascular risk factor control
The average BMI was similar and in the obese range for both DCR and NHANES participants with diabetes (33.3±7.3 kg/m2 vs. 32.2±7.6 kg/m2, SMD=0.05). The prevalence of overweight and obesity was 90.6% in the DCR cohort and 90.2% in the NHANES sample (SMD=0.03). There were significant regional differences in weight status in the DCR cohort with the highest percentage of obesity in the Midwest (69.6%, p<.0001).
Mean A1c was similar between DCR participants and NHANES participants (7.5±2.2% [58.1±24.4 mmol/mol] vs. 7.4±1.8% [57.3±20.0 mmol/mol], SMD=0.03). The distributions of A1c <7% (<53 mmol/mol), A1c 7–9% (53–75 mmol/mol), and A1c>9% (>75 mmol/mol) were similar between both cohorts (SMD=0.16). In the DCR cohort, the mean A1c was higher in the Midwest compared with all other regions (p<.0001).
DCR participants had a higher percentage of diagnosed hypertension compared with NHANES participants (SMD=0.37). The percentage with BP<140/90 was similar between cohorts (SMD=0.09). Regional differences in blood pressure control were present in the DCR cohort. Overall, the South region had the lowest percentage attaining BP<140/90 compared with all other regions (p<.0001). DCR participants in the West had the highest percentage of diagnosed hypertension.
DCR participant were also more likely to have a diagnosis of dyslipidaemia compared with NHANES participants (83% vs. 63%, SMD=0.48). There were significant differences in lipid parameters between the cohorts. Sixty-one percent of DCR participants compared with 41% of NHANES participants had LDL<2.59 mmol/L (SMD=0.39). Significant regional differences in lipid control were present in the DCR cohort. Overall, the South and Northeast regions had the lowest percentage attaining LDL<2.59 mmol/L compared with all other regions, while DCR participants in the West were most likely to have a diagnosis of dyslipidaemia and attain LDL<2.59 mmol/L (p<.0001 for all comparisons).
The DCR had a significantly higher percentage of adults with diabetes attaining the composite measure of A1c<7% (<53 mmol/mol), BP<140/90, and LDL<2.59 mmol/L (“ABC control”) compared with NHANES participants (18.8% vs. 6.0 %, SMD=0.40). Tobacco use was lower in the DCR compared with NHANES (18% vs. 32%, SMD=0.35). Within the DCR, ABC control differed across regions: 14% in the Midwest, 19% in the West, 20% in the South, and 21% in the Northeast (p<.0001). Tobacco use was highest in the Midwest and lowest in the Northeast.
3.3. Treatment characteristics
Tables 1 and 2 describe medication use in the DCR and NHANES cohorts and by Census region for the DCR cohort, respectively. The use of insulin (18% in DCR vs. 27% in NHANES) and oral hypoglycaemic agents (56% in DCR vs. 71% in NHANES) differed between the cohorts (SMD=0.22–0.33). There were significant differences in diabetes management when stratified by A1c level (Figure 2). The use of diabetes medications was similar between DCR and NHANES for those with A1c>9% (>75 mmol/mol) (SMD=0.16). Within the DCR cohort, there were significant regional differences in the use of diabetes medications, with greatest use of insulin and oral hypoglycaemic agents in the West (p<.0001). Regional differences in medication use according to metabolic control are available in the Supplemental Appendix (Supplemental Figure 1).
Figure 2.
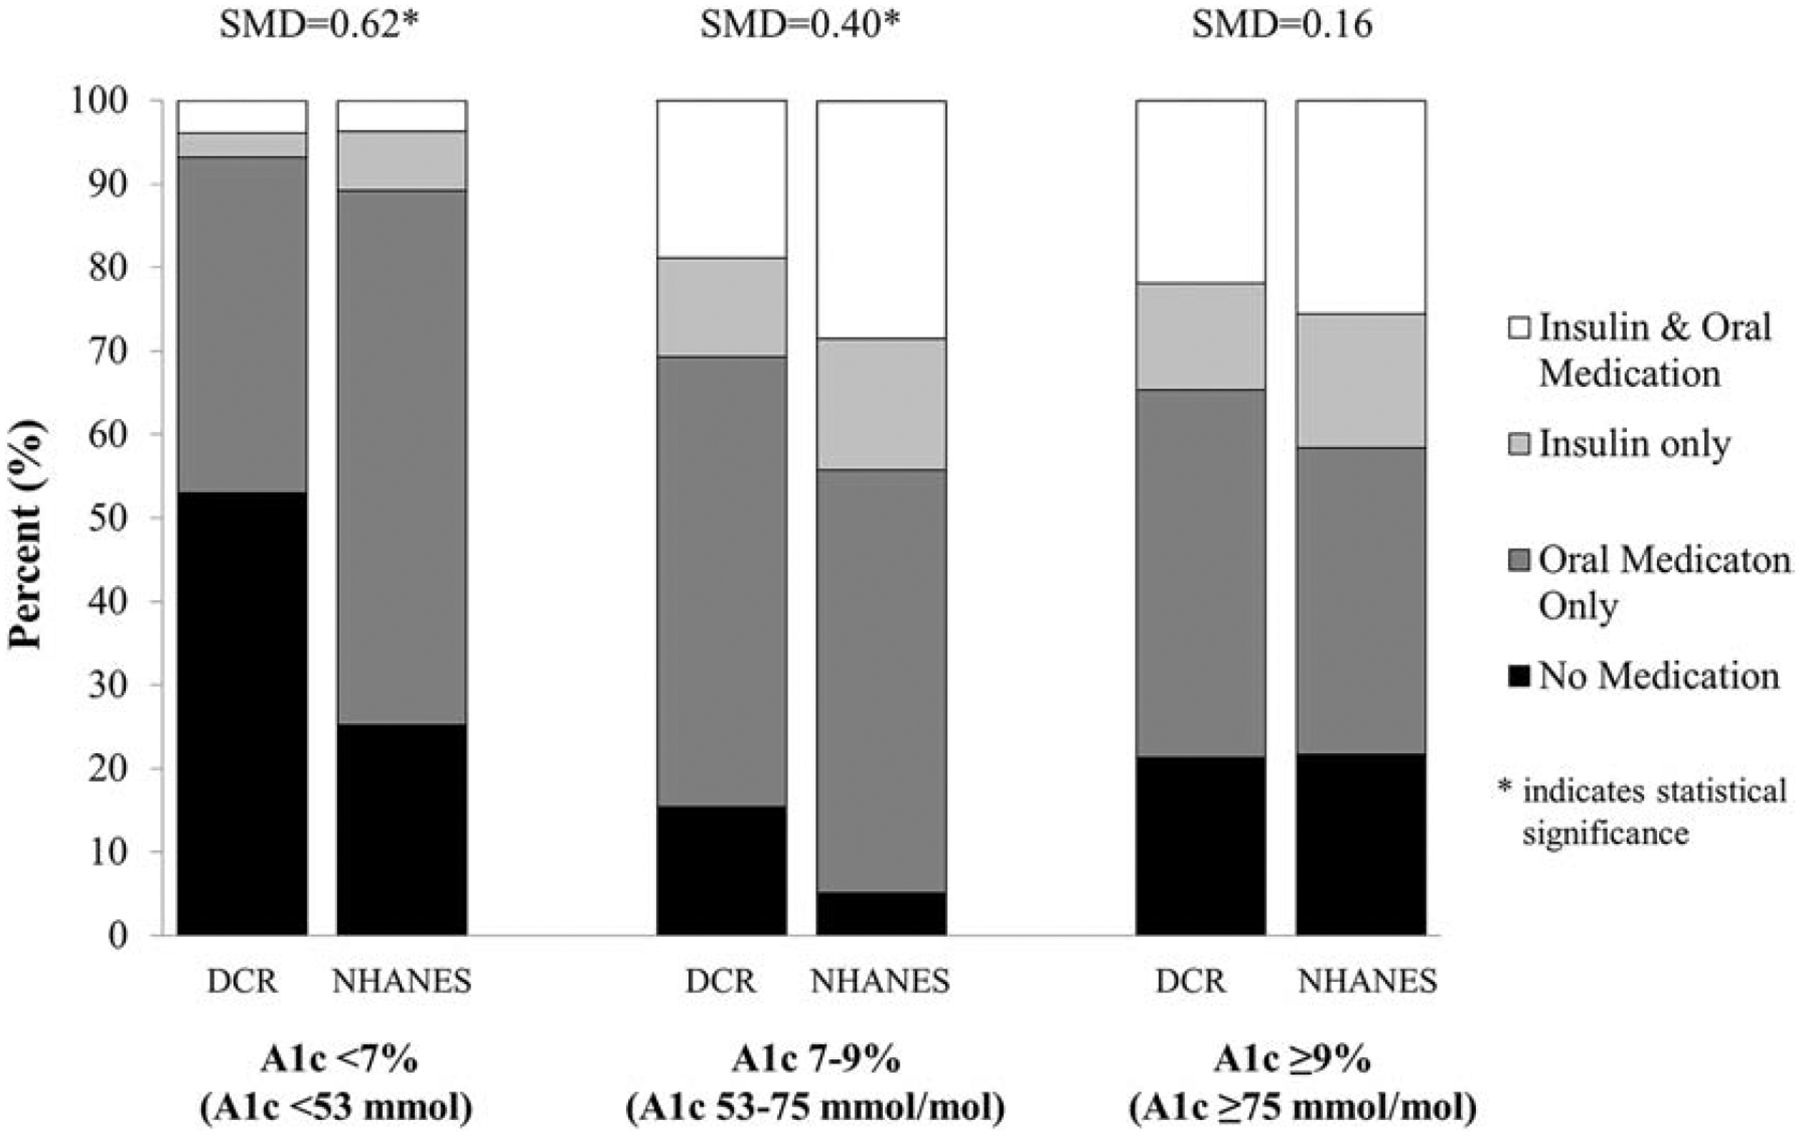
Diabetes management—no medications (N), oral agents only (O), insulin only (I) or insulin and oral agents (I+) —in DCR and NHANES by A1c level. For A1c<7%/<53 mmol/mol: DCR (N=53%, O=40%, I=3%, I+ =4%) vs. NHANES (N=25%, O=64%, I=7%, I+ =4%). For A1c 7–9%/53–75 mmol/mol: DCR (N=15%, O=54%, I=12%, I+ =19%) vs. NHANES (N=5%, O=51%, I=16%, I+ =28%). For A1c>9%/>75 mmol/mol: DCR (N=21%, O=44%, I=13%, I+ =22%) vs. NHANES (N=22%, O=37%, I=16%, I+ =26%).
The use of anti-hypertensive medications was greater in NHANES participants compared with DCR participants (95% vs. 79%, SMD=0.50). DCR participants were less likely to be prescribed anti-hypertensive therapy compared to NHANES participants in the setting of either diagnosed hypertension (88% vs. 95%, SMD=0.27) or BP≥140/90 (85% vs. 92%, SMD=0.24) (Supplemental Figure 2a). DCR participants in the West had the highest use of anti-hypertensive medications across all regions (p<.0001). Similar regional patterns were found among those with BP≥140/90 mmHg: West 98%, Midwest 93%, South 83%, and Northeast 80% (p<.0001) (Supplemental Figure 2b).
The use of cholesterol-lowering medications was similar in the DCR and NHANES cohorts (SMD=0.08). DCR participants were less likely to be prescribed lipid lowering therapy compared with NHANES participants in the setting of either diagnosed dyslipidaemia (78% vs. 90%, SMD=0.33) or LDL≥2.59 mmol/L (60% vs. 77%, SMD=0.38) (Supplemental Figure 3a). In the DCR cohort, adults with diabetes in the West had the highest use of cholesterol-lowering medications followed by adults in the Midwest, South and Northeast. Similar regional patterns were found among those with LDL≥2.59 mmol/L: West 75%, Midwest 68%, South 60%, and Northeast 57% (p<.0001) (Supplemental Figure 3b).
4. Discussion
We report significant regional differences in the prevalence, diagnosis, and management of cardiovascular risk factors among adults with diabetes participating in the largest outpatient diabetes registry in the US. While metabolic control was better in the DCR with 1 in 5 attaining composite “ABC control” compared with 1 in 16 in the general US population with diabetes, these data confirm the high prevalence of CVD risk factors in adults with diabetes. One in 5 adults with diagnosed diabetes and A1c>9% were not prescribed any glucose-lowering medication, and one in 4 adults with comorbid dyslipidaemia were not on a cholesterol-lowering medication. DCR participants were similar in terms of many demographic parameters to the general population with diabetes as assessed by NHANES. DCR participants were older and less ethnically diverse, and future analyses may consider weighting the DCR cohort to account for these differences.
Lack of health insurance is associated with undiagnosed health conditions, inadequate management, and poorer health outcomes.15 The DCR cohort had nearly complete insurance coverage compared with the general population with diabetes whose rate of insurance coverage (~91%) was consistent with Census estimates. Cohorts like DCR, drawn from EHR data from ambulatory clinical care settings, are more likely to be insured as they represent those with greater access to medical care services.16, 17 While the higher percentage of diagnosed hypertension and dyslipidaemia in the DCR cohort may suggest greater patient engagement with the healthcare system, medication use was equal, if not higher, in the general population with diabetes. There exists significant heterogeneity in insurance coverage for diabetes medications and medical devices amongst the myriad of commercial and public insurance plans complicated further by the use of various forms of supplemental or secondary insurance. The specific impact of insurance coverage on the receipt of recommended diabetes care and attainment of CVD risk factor control warrants further investigation in the DCR and NHANES cohorts.
Previous studies of the general population have demonstrated lower CVD risk for those living in the West and Northeast regions of the US compared to the South and Midwest regions and regional analyses of the DCR cohort confirm similar findings among those with diabetes.2, 4, 8, 18 Adults with diabetes in the West were more likely to be diagnosed with hypertension and dyslipidaemia as well as be prescribed insulin, antihypertensive and lipid-lowering medications. While this may relate to the older age of the West cohort, it may also reflect greater attention to personal health or engagement with their primary care providers. Adults from the West were most likely to attain LDL<2.59 mmol/L, but adults from the Northeast were more likely to attain A1c<7% (<53 mmol/mol), BP<140/90, and composite ABC control. The Northeast region had relatively low levels of diagnosed dyslipidaemia with the lowest percentage attaining LDL<2.59 mmol/L, suggesting under-recognition of this important CVD risk factor in the Northeast. Future analyses are needed to confirm this finding, which has not been reported in the general population.
By contrast, adults with diabetes from the Midwest were noted to have the highest rates of obesity, A1c >9% (>75 mmol/mol), and tobacco use in addition to the lowest attainment of composite ABC control. These findings are particularly concerning given the high rates of medication use in the Midwest. Clinical inertia and medication non-adherence are commonly reported causes for discrepancies between medication prescriptions and poor metabolic control and warrant further investigation.19, 20 Average A1c in the South was among the lowest in the US which mirrors findings by Egede et al, who reported that veterans with diabetes residing in the South had the lowest A1c values.11 BP control was worst in the South which may relate to low rates of antihypertensive medication use, access to health care, clinical inertia, or genetic factors, noting the higher percentage of women and non-Hispanic blacks in this region. While future analyses may adjust for sex and race to account for possible genetic differences, efforts to improve antihypertensive use in the South are likely to be impactful. Lower rates of exercise, less healthful dietary behaviours, and persistently higher levels of tobacco use in the Midwest and South are well-described and likely contribute to the higher prevalence of CVD risk factors in these regions.21
The study has limitations that merit further discussion. First, diagnosed medical conditions were defined differently in the DCR and NHANES. Problem lists from EHRs, as used by DCR, have unique advantages and weaknesses compared with patient self-report, as used by NHANES, which may have influenced the findings.6, 7, 22–24 Our analysis aimed to maximize the likelihood of a known diagnosis of diabetes, hypertension, or dyslipidemia by requiring specific ICD-10 codes for these conditions. We chose not to include medication use without an associated ICD diagnosis code as indicative of a diagnosis, as these medications may be used for prevention of disease (e.g. prediabetes) or treatment of other conditions (e.g. microalbuminuria). Conversely, the use of a single ICD-10 diagnosis code may overestimate the cohort with the diagnosis of interest; future longitudinal analyses using two ICD diagnoses (2 outpatient or 1 inpatient and 1 outpatient) may improve our ability to discern amongst diabetes types. Additional studies of the DCR may assess the sensitivity and specificity of variable approaches to identifying diagnoses of interest. Data extracted from EHRs are subject to inaccuracy due to errors or missing data, including bias introduced by individuals who are not actively seeking care and are subject to poorer health outcomes.7, 16, 25, 26 To reduce errors, the DCR uses proprietary data collection software to ensure systematic data collection from participating practices, and data are subject to audits by CMS-approved third-party entities. NHANES is also subject to selection bias from lower participation rates, but the impact of this remains uncertain.27 Data completeness for key variables in the DCR and NHANES cohorts is presented in Supplemental Table 1.
Treatment guidelines for both adults with type 1 and type 2 diabetes emphasize the importance of attaining metabolic control to reduce the risk of complication. It is likely that some differences (e.g. insulin use) are present between adults with different forms of diabetes. We chose to include adults with either type 1 or type 2 diabetes given the inherent challenges in accurately discriminating between the two diagnoses using either EHR (for the DCR) or NHANES data. While ICD codes for diabetes are generally accurate, they may not be reliable for type 1 or type 2 diabetes. Similarly, adjunctive use of medications, such as metformin or GLP-1 agonists, in the management of type 1 diabetes prevents reliable discrimination between these diagnoses based on medication use. The percentage of type 1 diabetes is comparably low in these large cohorts and the analyses best represent the care of adults with type 2 diabetes. There is an effort to define additional data for the DCR which may improve our ability to discern type 1 and type 2 diabetes, and we would recommend a similar approach to the NHANES dataset. Future analyses, using either longitudinal data or a broader dataset, may permit separate analyses of adults with type 1 or type 2 diabetes.
5. Conclusion
The DCR is the largest outpatient diabetes registry in the US collecting structured data from over 2900 ambulatory practices. Registry analyses may inform longitudinal trends in diabetes care and health outcomes at both the national and regional level. Further expansion of the registry cohort, especially in the West, and application of advanced sample weights may permit serial, nationally-representative, regional analyses of diabetes care delivery and related outcomes in the primary and specialty care settings to supplement national evaluations, such as NHANES. These analyses can support health policy initiatives and efforts to cost-effectively manage the diabetes epidemic confronting the US.2, 4, 5, 10, 11, 28–31
Supplementary Material
Highlights.
In the US, the diagnosis and effective management of diabetes and cardiovascular disease (CVD) risk factors in persons with diabetes remains suboptimal at the national level.
There is significant regional variation in the diagnosis and management of diabetes and CVD risk factors which relate to regional differences in CVD risk factor control.
Regional evaluations of diabetes care delivery are needed to inform more local, cost-effective disease management strategies for persons with diabetes.
Acknowledgements
The authors thank the CDC and all individuals who contributed to NHANES data collection, especially survey participants, as well as all participating members of DCR.
Financial support
This research was supported by grants P30DK036836 and K12DK094721 from the National Institutes of Health. The content is solely the responsibility of the authors and does not necessarily represent the official views of the National Institutes of Health.
Footnotes
Publisher's Disclaimer: This is a PDF file of an unedited manuscript that has been accepted for publication. As a service to our customers we are providing this early version of the manuscript. The manuscript will undergo copyediting, typesetting, and review of the resulting proof before it is published in its final form. Please note that during the production process errors may be discovered which could affect the content, and all legal disclaimers that apply to the journal pertain.
References
- 1.Murphy SL, Xu J, Kochanek KD, Arias E. Mortality in the United States, 2017. NCHS Data Brief. 2018. 328:1–8. [PubMed] [Google Scholar]
- 2.Voeks JH, McClure LA, Go RC, Prineas RJ, Cushman M, Kissela BM, et al. Regional differences in diabetes as a possible contributor to the geographic disparity in stroke mortality: the REasons for Geographic And Racial Differences in Stroke Study. Stroke. 2008;396:1675–80. [DOI] [PMC free article] [PubMed] [Google Scholar]
- 3.Howard G, Cushman M, Prineas RJ, Howard VJ, Moy CS, Sullivan LM, et al. Advancing the hypothesis that geographic variations in risk factors contribute relatively little to observed geographic variations in heart disease and stroke mortality. Prev Med. 2009;492–3:129–32. [DOI] [PMC free article] [PubMed] [Google Scholar]
- 4.Shuaib FM, Durant RW, Parmar G, Brown TM, Roth DL, Hovater M, et al. Awareness, treatment and control of hypertension, diabetes and hyperlipidemia and area-level mortality regions in the Reasons for Geographic and Racial Differences in Stroke (REGARDS) study. J Health Care Poor Underserved. 2012;232:903–21. [DOI] [PMC free article] [PubMed] [Google Scholar]
- 5.Menke A, Casagrande S, Geiss L, Cowie CC. Prevalence of and Trends in Diabetes Among Adults in the United States, 1988–2012. JAMA. 2015;31410:1021–9. [DOI] [PubMed] [Google Scholar]
- 6.Ali MK, Siegel KR, Laxy M, Gregg EW. Advancing Measurement of Diabetes at the Population Level. Curr Diab Rep. 2018;1811:108. [DOI] [PMC free article] [PubMed] [Google Scholar]
- 7.Klompas M, Cocoros NM, Menchaca JT, Erani D, Hafer E, Herrick B, et al. State and Local Chronic Disease Surveillance Using Electronic Health Record Systems. Am J Public Health. 2017;1079:1406–12. [DOI] [PMC free article] [PubMed] [Google Scholar]
- 8.Hipp JA, Chalise N. Spatial analysis and correlates of county-level diabetes prevalence, 2009–2010. Prev Chronic Dis. 2015;12:E08. [DOI] [PMC free article] [PubMed] [Google Scholar]
- 9.Birkhead GS. Successes and Continued Challenges of Electronic Health Records for Chronic Disease Surveillance. Am J Public Health. 2017;1079:1365–7. [DOI] [PMC free article] [PubMed] [Google Scholar]
- 10.Weng W, Tian Y, Kimball ES, Kong SX, Bouchard J, Hobbs TM, et al. Treatment patterns and clinical characteristics of patients with type 2 diabetes mellitus according to body mass index: findings from an electronic medical records database. BMJ Open Diabetes Res Care. 2017;51:e000382. [DOI] [PMC free article] [PubMed] [Google Scholar]
- 11.Egede LE, Gebregziabher M, Hunt KJ, Axon RN, Echols C, Gilbert GE, et al. Regional, geographic, and racial/ethnic variation in glycemic control in a national sample of veterans with diabetes. Diabetes Care. 2011;344:938–43. [DOI] [PMC free article] [PubMed] [Google Scholar]
- 12.Arnold SV, Inzucchi SE, McGuire DK, Mehta SN, Goyal A, Sperling LS, et al. Evaluating the Quality of Comprehensive Cardiometabolic Care for Patients With Type 2 Diabetes in the U.S.: The Diabetes Collaborative Registry. Diabetes Care. 2016;397:e99–e101. [DOI] [PubMed] [Google Scholar]
- 13.Yang D, Dalton J. A unified approach to measuring the effect size between two groups using SAS. Proceedings of the SAS Global Forum 2012 Conference; Cary, NC: SAS Institute Inc.; 2012. [Google Scholar]
- 14.Cohen J Statistical Power Analysis for the Behavioral Sciences (2nd ed.). Hillsdale, NJ: Lawrence Erlbaum Associates; 1988. [Google Scholar]
- 15.Promotion OoDPaH. Access to Health Services: Healthy People 2020. [Available from: https://www.healthypeople.gov/2020/topics-objectives/topic/Access-to-Health-Services.
- 16.Romo ML, Chan PY, Lurie-Moroni E, Perlman SE, Newton-Dame R, Thorpe LE, et al. Characterizing Adults Receiving Primary Medical Care in New York City: Implications for Using Electronic Health Records for Chronic Disease Surveillance. Prev Chronic Dis. 2016;13:E56. [DOI] [PMC free article] [PubMed] [Google Scholar]
- 17.Prevention CfDCa. Vital Signs: Health Insurance Coverage and Health Care Utilization --- United States, 2006−-2009 and January-March 2010 2010 [updated Nov 12. 2010/11/11:[1448–54]. Available from: https://www.ncbi.nlm.nih.gov/pubmed/21063276. [PubMed]
- 18.Casper M, Kramer MR, Quick H, Schieb LJ, Vaughan AS, Greer S. Changes in the Geographic Patterns of Heart Disease Mortality in the United States: 1973 to 2010. Circulation. 2016;13312:1171–80. [DOI] [PMC free article] [PubMed] [Google Scholar]
- 19.Okemah J, Peng J, Quinones M. Addressing Clinical Inertia in Type 2 Diabetes Mellitus: A Review. Adv Ther. 2018;3511:1735–45. [DOI] [PMC free article] [PubMed] [Google Scholar]
- 20.Polonsky WH, Henry RR. Poor medication adherence in type 2 diabetes: recognizing the scope of the problem and its key contributors. Patient Prefer Adherence. 2016;10:1299–307. [DOI] [PMC free article] [PubMed] [Google Scholar]
- 21.Pickens CM, Pierannunzi C, Garvin W, Town M. Surveillance for Certain Health Behaviors and Conditions Among States and Selected Local Areas - Behavioral Risk Factor Surveillance System, United States, 2015. MMWR Surveill Summ. 2018;679:1–90. [DOI] [PMC free article] [PubMed] [Google Scholar]
- 22.Holt TA, Gunnarsson CL, Cload PA, Ross SD. Identification of undiagnosed diabetes and quality of diabetes care in the United States: cross-sectional study of 11.5 million primary care electronic records. CMAJ Open. 2014;24:E248–55. [DOI] [PMC free article] [PubMed] [Google Scholar]
- 23.Leong A, Dasgupta K, Chiasson JL, Rahme E. Estimating the population prevalence of diagnosed and undiagnosed diabetes. Diabetes Care. 2013;3610:3002–8. [DOI] [PMC free article] [PubMed] [Google Scholar]
- 24.Violan C, Foguet-Boreu Q, Hermosilla-Perez E, Valderas JM, Bolibar B, Fabregas-Escurriola M, et al. Comparison of the information provided by electronic health records data and a population health survey to estimate prevalence of selected health conditions and multimorbidity. BMC Public Health. 2013;13:251. [DOI] [PMC free article] [PubMed] [Google Scholar]
- 25.Paul MM, Greene CM, Newton-Dame R, Thorpe LE, Perlman SE, McVeigh KH, et al. The state of population health surveillance using electronic health records: a narrative review. Popul Health Manag. 2015;183:209–16. [DOI] [PubMed] [Google Scholar]
- 26.Hygiene NYCDoHaM. Developing an Electronic Health Record-Based Population Health Surveillance System 2013. [updated March 12, 2019. Available from: https://www1.nyc.gov/assets/doh/downloads/pdf/data/nyc-macro-report.pdf.
- 27.Statistics NCfH. National Health and Nutrition Examination Survey: Impact of Declining Response Rates on Nonresponse Bias, 2013–2016, Executive Summary [8]. Available from: https://wwwn.cdc.gov/nchs/data/nhanes/2011-2012/analyticguidelines/nonresponse_executive_summary_13_16.pdf.
- 28.Ceriello A, Rossi MC, De Cosmo S, Lucisano G, Pontremoli R, Fioretto P, et al. Overall Quality of Care Predicts the Variability of Key Risk Factors for Complications in Type 2 Diabetes: An Observational, Longitudinal Retrospective Study. Diabetes Care. 2019;42:514–9. [DOI] [PubMed] [Google Scholar]
- 29.Gregg EW, Li Y, Wang J, Burrows NR, Ali MK, Rolka D, et al. Changes in diabetes-related complications in the United States, 1990–2010. N Engl J Med. 2014;37016:1514–23. [DOI] [PubMed] [Google Scholar]
- 30.Squires E, Duber H, Campbell M, Cao J, Chapin A, Horst C, et al. Health Care Spending on Diabetes in the U.S., 1996–2013. Diabetes Care. 2018;417:1423–31. [DOI] [PMC free article] [PubMed] [Google Scholar]
- 31.Loop MS, Howard G, de Los Campos G, Al-Hamdan MZ, Safford MM, Levitan EB, et al. Heat Maps of Hypertension, Diabetes Mellitus, and Smoking in the Continental United States. Circ Cardiovasc Qual Outcomes. 2017;101. [DOI] [PMC free article] [PubMed] [Google Scholar]
Associated Data
This section collects any data citations, data availability statements, or supplementary materials included in this article.