

Abstract
Biofluid biomarkers of age-related macular degeneration (AMD) are still lacking, and their identification is challenging. Metabolomics is well-suited to address this need, and urine is a valuable accessible biofluid. This study aimed to characterize the urinary metabolomic signatures of patients with different stages of AMD and a control group (>50 years). It was a prospective, cross-sectional study, where subjects from two cohorts were included: 305 from Coimbra, Portugal (AMD patients n = 252; controls n = 53) and 194 from Boston, United States (AMD patients n = 147; controls n = 47). For all participants, we obtained color fundus photographs (for AMD staging) and fasting urine samples, which were analyzed using 1H nuclear magnetic resonance (NMR) spectroscopy. Our results revealed that in both cohorts, urinary metabolomic profiles differed mostly between controls and late AMD patients, but important differences were also found between controls and subjects with early AMD. Analysis of the metabolites responsible for these separations revealed that, even though distinct features were observed for each cohort, AMD was in general associated with depletion of excreted citrate and selected amino acids at some stage of the disease, suggesting enhanced energy requirements. In conclusion, NMR metabolomics enabled the identification of urinary signals of AMD and its severity stages, which might represent potential metabolomic biomarkers of the disease.
Keywords: age-related macular degeneration, urine, metabolomics, nuclear magnetic resonance spectroscopy
Graphical Abstract
INTRODUCTION
Age-related macular degeneration (AMD) is an aging disease of the eye, which is currently the leading cause of adult blindness in developed countries and ranks third worldwide. In 2040, AMD is expected to affect 288 million people.1 AMD natural history typically comprises “dry” early and intermediate forms, which in some people can progress to late forms, namely atrophic (geographic atrophy, GA) and/or neovascular form (choroidal neovascularization or “wet” AMD).2,3 It is well-established that the pathogenesis of AMD is multifactorial, involving an interplay between genetic and environmental risk factors;4 however, the reasons for the occurrence of disease and its progression remain only partially understood.2 Furthermore, reliable biofluid biomarkers of the disease are still lacking in AMD.
Our group hypothesized that metabolomics could be an appropriate approach to address the current lack of biomarkers in AMD.5,6 Metabolomics is the global profiling of small molecules (<1 kDa), or metabolites, comprised in a biological system.7 Importantly, metabolites are the downstream product of the cumulative effects of the genome and environmental exposures, so that the metabolome is expected to closely represent the health state of a human subject organism and its phenotype. This approach has been useful in many diseases,8 including other multifactorial conditions such as Alzheimer’s disease, cancer, and recently, AMD. Metabolomics platforms are highly cost-effective,9 with two main techniques currently available: mass spectrometry (MS) and nuclear magnetic resonance spectroscopy (NMR).10–12 Both approaches have strengths and weaknesses, and they can together provide a global overview of the human metabolome. NMR spectroscopy has important advantages,13 namely, the ability to reuse samples, high reproducibility, and minimal sample preparation requirements.
While most metabolomics research to identify biofluid biomarkers of disease has been carried out on blood samples,14–18 urine has been also used because of its easy accessibility and noninvasiveness.19–23 Compared to blood, urine composition is not regulated by homeostatic mechanisms and greater variation of endogenous metabolites can occur.24 Although this adds an additional challenge, it also means that urine may better reflect changes in human metabolism, and thus better mirror disease states. This has been widely shown in cancer,19,22,25–29 cardiovascular,30,31 brain32 and prenatal diseases,23,33 among others.34,35
In ophthalmology, there has been limited research on the role of metabolomics and existing reports have mostly addressed blood or ocular fluids.36 Osborn et al.37 pioneered the application of metabolomics to AMD using MS to compare plasma samples of patients with a subtype of advanced AMD (choroidal neovascularization) to controls. Our group was, to our knowledge, the first to study the metabolomic profile of the different stages of AMD (early, intermediate, and late) using NMR5 and MS6. With both techniques, we observed some separation between different AMD stages and controls, based on the subjects’ plasma metabolomic profiles. The emerging and promising subject of metabolomics to characterize AMD has been reviewed very recently, covering applications not only to biofluids but also to tears, vitreous, and aqueous humor.38
To the best of our knowledge, no metabolomic urinary signatures of AMD patients have been described. Therefore, this study aims to characterize the urine metabolomic signatures of patients with AMD and controls, considering different stages of the disease (early, intermediate, and late), in two distinct cohorts (United States and Portugal), to search for potential urine metabolic biomarkers of AMD for use in diagnosis and staging.
MATERIALS AND METHODS
Study Design and Protocol
As described by our group,5 this study is part of a cross-sectional, observational study performed at Massachusetts Eye and Ear (MEE), Harvard Medical School, Boston, United States, and the Faculty of Medicine of the University of Coimbra (FMUC), Coimbra, Portugal, in collaboration with the Association for Innovation and Biomedical Research on Light and Image (AIBILI) and the “Centro Hospitalar e Universitário de Coimbra”, Coimbra, Portugal. The clinical protocol was conducted in accordance with HIPAA (Health Insurance Portability and Accountability Act) requirements and the tenets of the Declaration of Helsinki and was approved by the Institutional Review Boards of MEE, FMUC and AIBILI, and by the Portuguese National Data Protection Committee (CNPD). All subjects enrolled in the study provided signed informed consent forms.
From January 2015 to July 2016, in both study sites (Boston and Coimbra), subjects diagnosed with AMD and a control group aged ≥50 years, without any macular pathology, were recruited. The Portuguese (FMUC/AIBILI) study population was derived from a population-based cohort study,39 where all subjects with an established diagnosis of any stage of AMD were invited to participate. Subjects without signs of AMD in a prior evaluation39 were also invited and included as controls if they remained without the disease in a subsequent evaluation (see criteria below). At MEE (Boston), participants were recruited at the Retina Service and the Comprehensive Ophthalmology and Optometry Services, at their regular appointments. For both cohorts, the following exclusion criteria were applied: diagnosis of any other vitreoretinal disease, active uveitis or ocular infection, significant media opacities that precluded the observation of the ocular fundus, refractive error equal or greater than 6 diopters of spherical equivalent, past history of retinal surgery, history of any ocular surgery or intraocular procedure (such as laser and intraocular injections) within the 90 days prior to enrolment, and diagnosis of diabetes mellitus, with or without concomitant diabetic retinopathy.
All participants underwent a comprehensive eye exam, including best-corrected visual acuity (BCVA), current refraction, intraocular pressure, slit lamp biomicroscopy, and dilated fundus exam. A standardized medical history questionnaire was designed specifically for this study,40 including self-reported data on smoking habits, weight and height (used to calculate body mass index). Recruited subjects were imaged with 7-field, nonstereoscopic color fundus photographs (CFP) either with a Topcon TRC-50DX (Topcon Corporation, Tokyo, Japan) or a Zeiss FF-450Plus (Carl Zeiss Meditec, Dublin, CA) camera.
AMD Diagnosis and Grading
For AMD diagnosis and staging, two of three independent experienced graders analyzed all-field 2 CFP, according to the AREDS classification system.41,42 In case of disagreement, a senior author (RS or DH) established the final categorization. Images taken with Topcon cameras were evaluated with IMAGEnet 2000 software (version 2.56; Topcon Medical Systems) and those obtained with a Zeiss camera were observed using VISUPAC (version 4.5.1; Carl Zeiss Meditec). Images were standardized using software developed by our group.43 The most recent AREDS2 definitions42 were applied, namely, that the standard disc diameter equals 1800 μm (rather than 1500 μm), which affects the size of the ETDRS grid and of the standard drusen circles; and that geographic atrophy (GA) is present if the lesion has a diameter equal or larger than 433 μm (AREDS circle I-2) and at least two of the following features are present: absence of RPE pigment, circular shape, or sharp margins (thus meaning that the involvement of the central fovea is not a requirement). Therefore, the following groups were established and used for further assessments:41,42 controls—presence of drusen maximum size < circle C0 and total area < C1; early AMD—drusen maximum size ≥ C0 but < C1 or presence of AMD characteristic pigment abnormalities in the inner or central subfields; intermediate AMD—presence drusen maximum size ≥ C1 or of drusen maximum size ≥ C0 if the total area occupied is > I2 for soft indistinct drusen and > O2 for soft distinct drusen; late AMD—presence of GA according to the criteria described above (GA or “dry” late AMD) or evidence of neovascular AMD (choroidal neovascularization, CNV or “wet” AMD). For participants with different stages in the two eyes, the worst of the two was considered as the subjects’ classification.
Sample Collection and NMR Analysis
The present study is cross-sectional, and it relied on a single urine collection per individual, following exactly the same protocols in the two cohorts under study. In the abovementioned study visits, fasting urine samples were collected in the morning for all participants into sterile cups. Within a maximum of 20 min, urine aliquots of 1.5 mL (MEE) and 5 mL (FMUC/AIBILI) were transferred into sterile cryovials and stored at −80 °C. Urine samples from MEE were shipped to Portugal for metabolomic profiling in dry ice (through TNT Express, USA, Inc). Samples arrived frozen in less than 48 h and were immediately stored at −80 °C until NMR analysis. Prior to analysis, samples were thawed at room temperature, and 800 μL was centrifuged (4500g, 5 min). Then, 60 μL of 1.5 M KH2PO4/D2O phosphate buffer pH 7.00, 0.1%Na+/3-trimethylsilylpropionic acid (TSP) was added to 540 μL of supernatant, followed by buffering and pH adjustment to 7.00 ± 0.02 with KOD (4 M) or DCl (4 M). The mixture was again centrifuged (4500g, 5 min), and 550 μL was transferred to a 5 mm NMR tube.
NMR spectra were acquired at 300 K, on a Bruker Avance III spectrometer operating at 500.13 MHz for proton and equipped with a 5 mm TXI probe. For each sample, a standard 1D 1H NMR spectrum was acquired, using a “noesypr1d” (Bruker library) pulse sequence with water suppression during the relaxation delay (4 s) and mixing time (100 ms). Other acquisition parameters were as follows: spectral width 10081 Hz, 64 k data points and 128 transients. All free induction decays were multiplied by a 0.3 Hz line-broadening factor prior to Fourier Transformation. Spectra were manually phased, baseline corrected, and internally referenced to TSP at δ 0.00 ppm. All peak assignments were carried out with basis on 1D and 2D NMR experiments and consultation of the Bruker Biorefcode spectral database (BBIORFCODE-2–0–0 data-base, Bruker Biospin, Rheinstetten, Germany), as well as other existing databases44 and literature reports.20,45 Statistical Total Correlation Spectroscopy (STOCSY) was also used to aid peak assignment.46
Statistical Analysis
Statistical descriptive and inference methods (t test, Fisher-exact test, Chi-square test, and density distribution) were used to describe the clinical and demographic characteristics of the study populations.
For NMR data analysis, the spectral region between 9.50–0.30 ppm was considered, after exclusion of water and urea spectral regions (4.54–5.08 and 5.53–6.10 ppm, respectively) (Amix 3.9.14, Bruker BioSpin, Rheinstetten, Germany). Spectra were aligned using recursive segment-wise peak alignment47 (Matlab 7.12.0, The MathWorks, Inc.), normalized to total area and scaled to unit variance (SIMCA-P 11.5, Umetrics, Umea, Sweden).
Multivariate analysis included both principal component analysis (PCA) and partial least-squares discriminant analysis (PLS-DA). PLS-DA model robustness was assessed by Monte Carlo Cross Validation (MCCV) using 500 iterations, enabling Q2 values (predictive power), number of Latent Variables (LV), and confusion matrices of original and randomly permuted classes to be retrieved.48,49 Sensitivity (% sens.), specificity (% spec.), and classification rates (% CR) were computed, and the predictive power of each model was further assessed using Receiver Operating Characteristic (ROC) curve analysis, a function of the true positive rate (TPR or sensitivity) and false positive rate (FPR or 1-specificity).50 Additionally, variable selection was performed as previously described;20 namely, spectral variables were selected through the intersection of three conditions: VIP > 1 and VIP/VIPcvSE > 1 and |b/bcvSE| > 1. After variable selection, PLS-DA was reapplied and resubmitted to MCCV. For all models, the peaks/metabolites and unassigned spectral regions contributing to class discrimination were integrated in the original spectra (Amix 3.9.14, Bruker BioSpin, Rheinstetten, Germany) and normalized to total spectral area. Integrals were compared through the Wilcoxon test (p < 0.05, confidence level 95%)51 and effect size values calculated.52 P-values were corrected for multiple comparisons using the Bonferroni correction, which defines a significance cutoff dependent on the number of resonances simultaneously tested.
RESULTS
Study Population Demographics
We have included a total of 499 subjects, 305 (61.1%) from Coimbra and 194 (38.9%) from Boston. Table 1 presents the clinical and demographic characteristics of both study cohorts. As expected, age significantly differed between patients with AMD (particularly at intermediate and late stages) and the control group, for both cohorts (p-values for Coimbra: 0.048 for controls/early AMD; 5.6 × 10⁻⁶ for early/intermediate AMD; 1.7 × 10⁻⁵ for intermediate/late AMD; p-values for Boston: 0.80 for controls/early AMD; 0.020 for early/intermediate AMD; 0.010 for intermediate/late AMD). No significant differences (p-value >0.05) were observed for gender, BMI, and smoking habits. Figure S1 presents the histograms of these covariates, as a function of AMD stage. As shown, the larger intermediate AMD groups comprised a wider ranges of variance for age; hence, this group was used to evaluate the effects of age on disease metabolomic signatures, as described below. In terms of other comorbidities (Table S1), our study groups were mostly well-balanced, except for the percentage of subjects with thyroid disease in the Coimbra cohort, which differed significantly between intermediate and late AMD groups; and with thyroid and cardiovascular disease in the Boston cohort, which differed between early and intermediate AMD stages. These differences might introduce confounding effects on our assessments, as discussed later.
Table 1.
Demographics of Study Populations (Coimbra and Boston Cohorts), with Number of Subjects (n), Age (Years), Gender Ratio, BMI, and Smoking History
| Coimbra cohort (ntotal = 305) | Boston cohort (ntotal = 194) | |||||||
|---|---|---|---|---|---|---|---|---|
| controls | AMD early | AMD intermediate | AMD late | controls | AMD early | AMD intermediate | AMD late | |
| n (%) | 53 (17.4) | 57 (18.7) | 141 (46.2) | 54 (17.7)a | 47 (24.2) | 33 (17.0) | 66 (34.0) | 48 (24.8)b |
| age (range in yrs) | 68 (58–77) | 70 (64–75) | 75 (60–91) | 82 (72–92) | 69 (51–95) | 68 (54–91) | 71 (61–96) | 76 (56–89) |
| gender (F/M)c | 35/18 | 34/23 | 98/43 | 32/22 | 28/18 | 22/11 | 45/21 | 27/20 |
| BMId | 26 (18–40) | 27 (18–36) | 27 (19–42) | 27 (17–37) | 26 (19–40) | 26 (18–39) | 27 (19–54) | 26 (20–37) |
| smoking historye | ||||||||
| smokers | 0 | 0 | 0 | 1 | 2 | 0 | 3 | 0 |
| ex-smokers | 10 | 8 | 16 | 14 | 19 | 14 | 35 | 29 |
| nonsmokers | 43 | 49 | 125 | 39 | 24 | 19 | 28 | 17 |
Further classified as “wet” (n = 49) and “dry” AMD (n = 5).
Further classified as “wet” (n = 38) and “dry” AMD (n = 9); information unavailable for 1 subject.
Information unavailable for 2 Boston subjects.
BMI: body mass index (kg·m−2).
Ex-smokers: subjects not currently smoking but with a smoking history.
Multivariate Analysis of NMR Data
Figure 1 shows the average urine 1H NMR spectra of control and late AMD subjects in each cohort. These spectra reflect the expected complex composition of urine (a complete list of metabolites is shown in Table S2), and some visual changes between control and late AMD groups (arrows in Figure 1b,d), for each cohort. The spectra also indicate that the spectral profile of equivalent groups seems to differ slightly between cohorts. In order to investigate this and decide if subsequent analysis should address the two cohorts jointly or separately, control groups alone and late AMD groups alone were compared between cohorts (Figure S2). Indeed, PCA and PLS-DA of control groups alone (Figure S2a) revealed significant a priori differences in urinary metabolic profile between Coimbra and Boston (Q2 of PLS-DA model = 0.599) and a similar observation was noted for late AMD groups (Figure S2b, Q2 of PLS-DA model = 0.619). PLS-DA loadings analysis confirmed important differences in Coimbra controls, compared to Boston controls, namely, significantly higher levels of formate (p-value 1.1 × 10⁻⁹), creatine (p-value 9.2 × 10⁻³), taurine (p-value 3.4 × 10⁻⁷), dimethylamine (DMA) (p-value 8.2 × 10⁻³), and additional changes in several unassigned signals. Furthermore, late AMD patients in Coimbra, compared to Boston, exhibited many of the above changes, with the addition of lower ascorbate levels (p-value 1.8 × 10⁻⁵) and other changes in unassigned resonances. These results indicated that local characteristics (e.g., genetic, environmental) play an important role on urinary metabolic profile, potentially masking AMD effects if joint cohorts are considered. Such becomes clearer in the comparison of all controls (both cohorts) and all AMD patients (both cohorts) (Figure S3), where no meaningful group separation is observed, even after data reduction through variable selection and repeated subsequent PLS-DA (Q2 = 0.19). Similar comparisons carried out for each cohort separately provided some improvement in group separation (Table 2, right; Q2 = 0.38 and 0.22 for variable-selected spectra for Coimbra and Boston, respectively), indicating that separate analysis of cohorts will more probably unveil clearer AMD metabolic markers, than joint cohort analysis. As shown below, our analysis also took into account the different AMD stages and the impact of age differences on metabolic profile.
Figure 1.
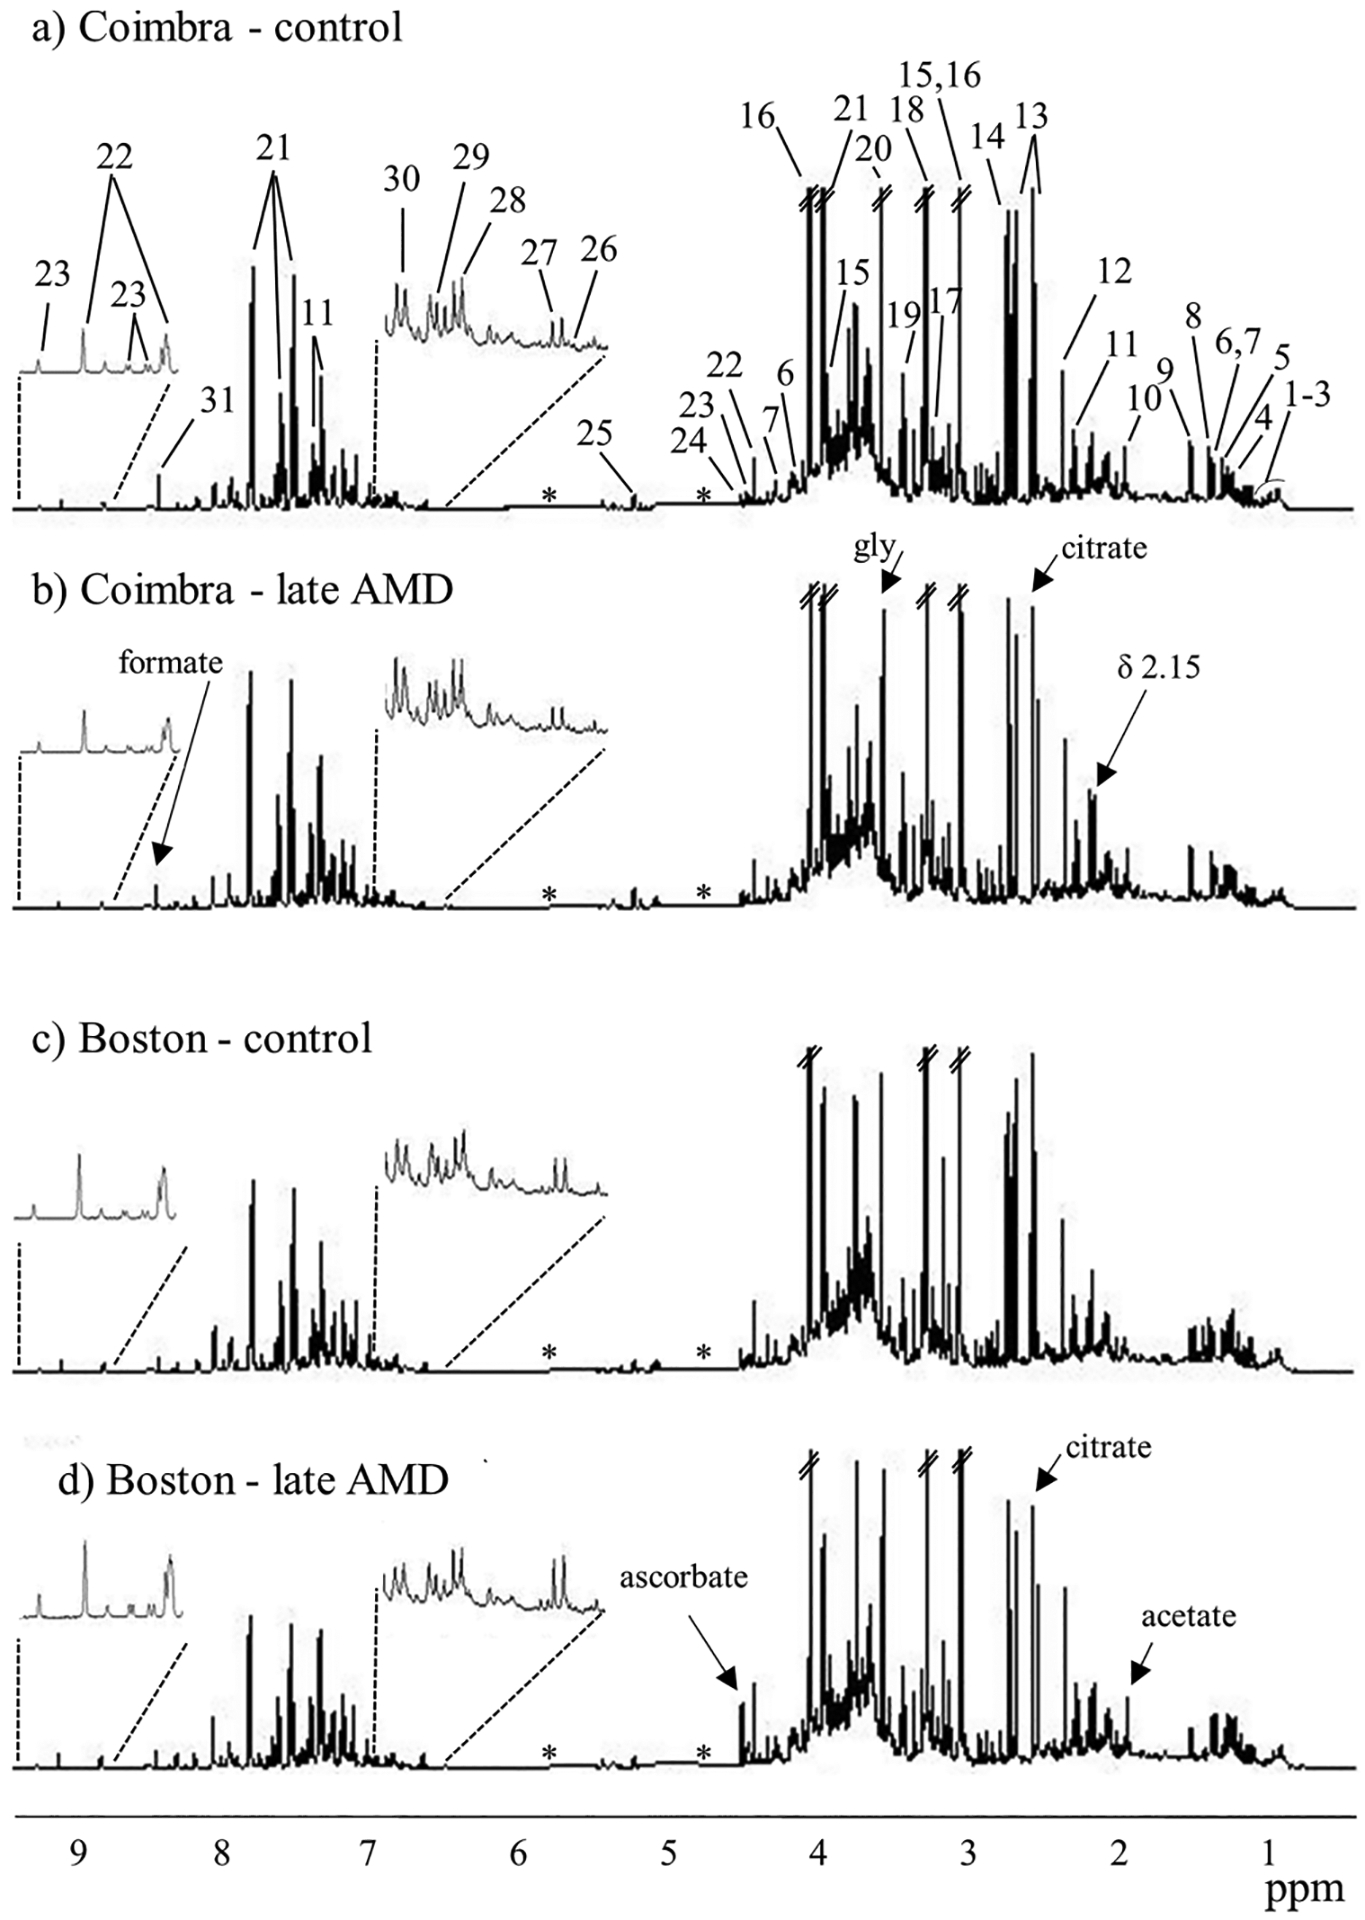
Average 1H NMR spectra of urine of controls (a,c) and late AMD groups (b,d) for Coimbra (a,b) and Boston (c,d) cohorts. Peak numbering identifies the main assignments: 1, ile; 2, leu; 3,val; 4, β-HBA (β-hydroxybutyrate); 5, 3-HIVA (3-hydroxyisovalerate); 6, lactate; 7, thr; 8, 2-HIBA (2-hydroxyisobutyrate); 9, ala; 10, acetate; 11, PAG (phenylacetylglutamine); 12, p-CS (p-cresol sulfate); 13, citrate; 14, DMA (dimethylamine); 15, creatine; 16, creatinine; 17, carnitine; 18, TMAO (trimethylamine-N-oxide); 19, tau; 20, gly; 21, hippurate; 22, trigonelline; 23, NMND (N-methyl nicotinamide), 24, ascorbate; 25, glucose; 26, furoylglycine; 27, 2-Py (N-methyl-2-pyridone-5-carboxamide); 28, 4-HPA (4-hydroxyphenylacetate); 29, tyr; 30, 4-OH-hippurate (4-hydroxyhippurate); 31, formate. Remaining assignments are shown in Table S2. The three-letter code is used for amino acids. Arrows indicate some visual changes. *: removed water and urea spectral regions.
Table 2.
Pairwise PLS-DA Quality Parameters, Q2 (Predictive Power of Pairwise Model), Classification Rate (CR), % Sensitivity (sens), and % Specificity (spec), for PLS-DA Models Obtained with Original (Full) Spectra and Variable-Selected Spectra of Urine, For Coimbra and Boston Cohortsa
| full-resolution spectra | variable-selected spectra | ||||||||||
|---|---|---|---|---|---|---|---|---|---|---|---|
| Q2 | % CR | % sens | % spec | % data | Q2 | % CR | % sens | % spec | Q2 plasma modelsb | ||
| Coimbra | |||||||||||
| AMD evolution | early AMD vs cont | 0.17 | 66 | 65 | 68 | 26 | 0.40 | 78 | 80 | 77 | <0.30 |
| int vs early AMD | −0.13 | 68 | 89 | 15 | 28 | 0.16 | 76 | 91 | 39 | <0.30 | |
| late vs int AMD | −004 | 63 | 23 | 82 | 27 | 0.18 | 72 | 42 | 87 | <0.30 | |
| other models | All AMD vs cont | 0.24 | 83 | 97 | 13 | 27 | 0.38 | 86 | 94 | 51 | <0.30 |
| late AMD vs cont | 0.51 | 78 | 79 | 76 | 28 | 0.58 | 85 | 90 | 80 | 0.35 | |
| late vs early AMD | 0.03 | 60 | 56 | 64 | 33 | 0.37 | 74 | 70 | 79 | 0.34 | |
| Boston | |||||||||||
| AMD evolution | early AMD vs cont | 0.05 | 63 | 58 | 66 | 28 | 0.29 | 71 | 63 | 76 | 0.54 |
| int vs early AMD | 0.09 | 61 | 73 | 38 | 30 | 0.36 | 82 | 89 | 69 | 0.49 | |
| late vs int AMD | 0.11 | 57 | 47 | 64 | 30 | 0.30 | 73 | 66 | 78 | 0.32 | |
| other models | All AMD vs cont | 0.02 | 72 | 89 | 18 | 28 | 0.22 | 78 | 94 | 31 | <0.30 |
| late AMD vs cont | 0.30 | 69 | 71 | 66 | 30 | 0.37 | 77 | 77 | 77 | 0.41 | |
| late vs early AMD | 0.19 | 64 | 71 | 53 | 31 | 0.23 | 71 | 76 | 64 | 0.47 | |
Values in bold and underlined refer to best PLS-DA models.
Best models reported for plasma NMR spectra of similar cohorts.5 All plasma models correspond to CPMG variable-selected spectra with the exception of that for late vs early AMD (Boston), which corresponds to diffusion-edited variable-selected spectra.
Initial unsupervised analysis of each cohort using PCA did not show any significant separation between controls and patients. PLS-DA considering the control group and the three different AMD stages (Figure S4) showed that, in both cohorts, controls (blue) differed mostly from late AMD (purple) patients, and a large degree of overlap was noted between early (red) and intermediate (green) AMD stages. The metabolic changes accompanying the different stages of AMD in the two cohorts were further investigated through pairwise PLS-DA modeling. From the corresponding quality parameters obtained for full resolution spectra (Table 2, left) and variable-selected spectra (Table 2, right), it is clear that the urinary metabolic changes occurring with AMD are small for both cohorts, and only become visible, in some cases, after variable-selection (Q2 ≥ 0.40). For the full resolution spectra (Table 2, left), satisfactory models were obtained only for late AMD patients compared to controls, in both cohorts (Q2 = 0.51, sens 79% and spec 76% for Coimbra; and Q2 = 0.30, sens 71% and spec 66% for Boston), and none of the remaining comparisons (either between AMD stages or for (all AMD patients) vs controls or late vs early AMD) provided meaningful group separations.
Considering variable-selected spectra only, the Coimbra cohort showed satisfactory group separation between controls and early AMD patients (Q2 = 0.40, sens. 80% and spec. 77%) (Figure 2a, Table 2), suggesting that some variations occur early on, with potential value in AMD early diagnostics. Other comparisons revealed that late AMD vs controls provided the strongest PLS-DA model (Q2 = 0.58, sens. 90% and spec. 80%) (Figure S5a). It is interesting to note that, compared to our own previous results on the plasma of similar albeit smaller cohorts5 (Table 2, right column), urine spectra seem to provide better group separation than plasma. On the other hand, in the Boston cohort, group separations were weaker (Q2 ≤ 0.36) (Figure 2b, Table 2), with early vs intermediate AMD groups hinting some separation, although with low specificity (Q2 = 0.36, sens. 89% and spec. 69%). Comparison between late AMD and controls again provided a satisfactory PLS-DA model (Q2 = 0.37, sens. 77% and spec. 77%) (Figure S5b), although notably not as strong as for the Coimbra cohort. In this cohort, the performance of models based on urine seems to fall short of that of plasma, which produced more robust PLS-DA models (Q2 ≥ 0.49) between AMD stages,5 although the cohorts considered differed in size, as noted before.
Figure 2.
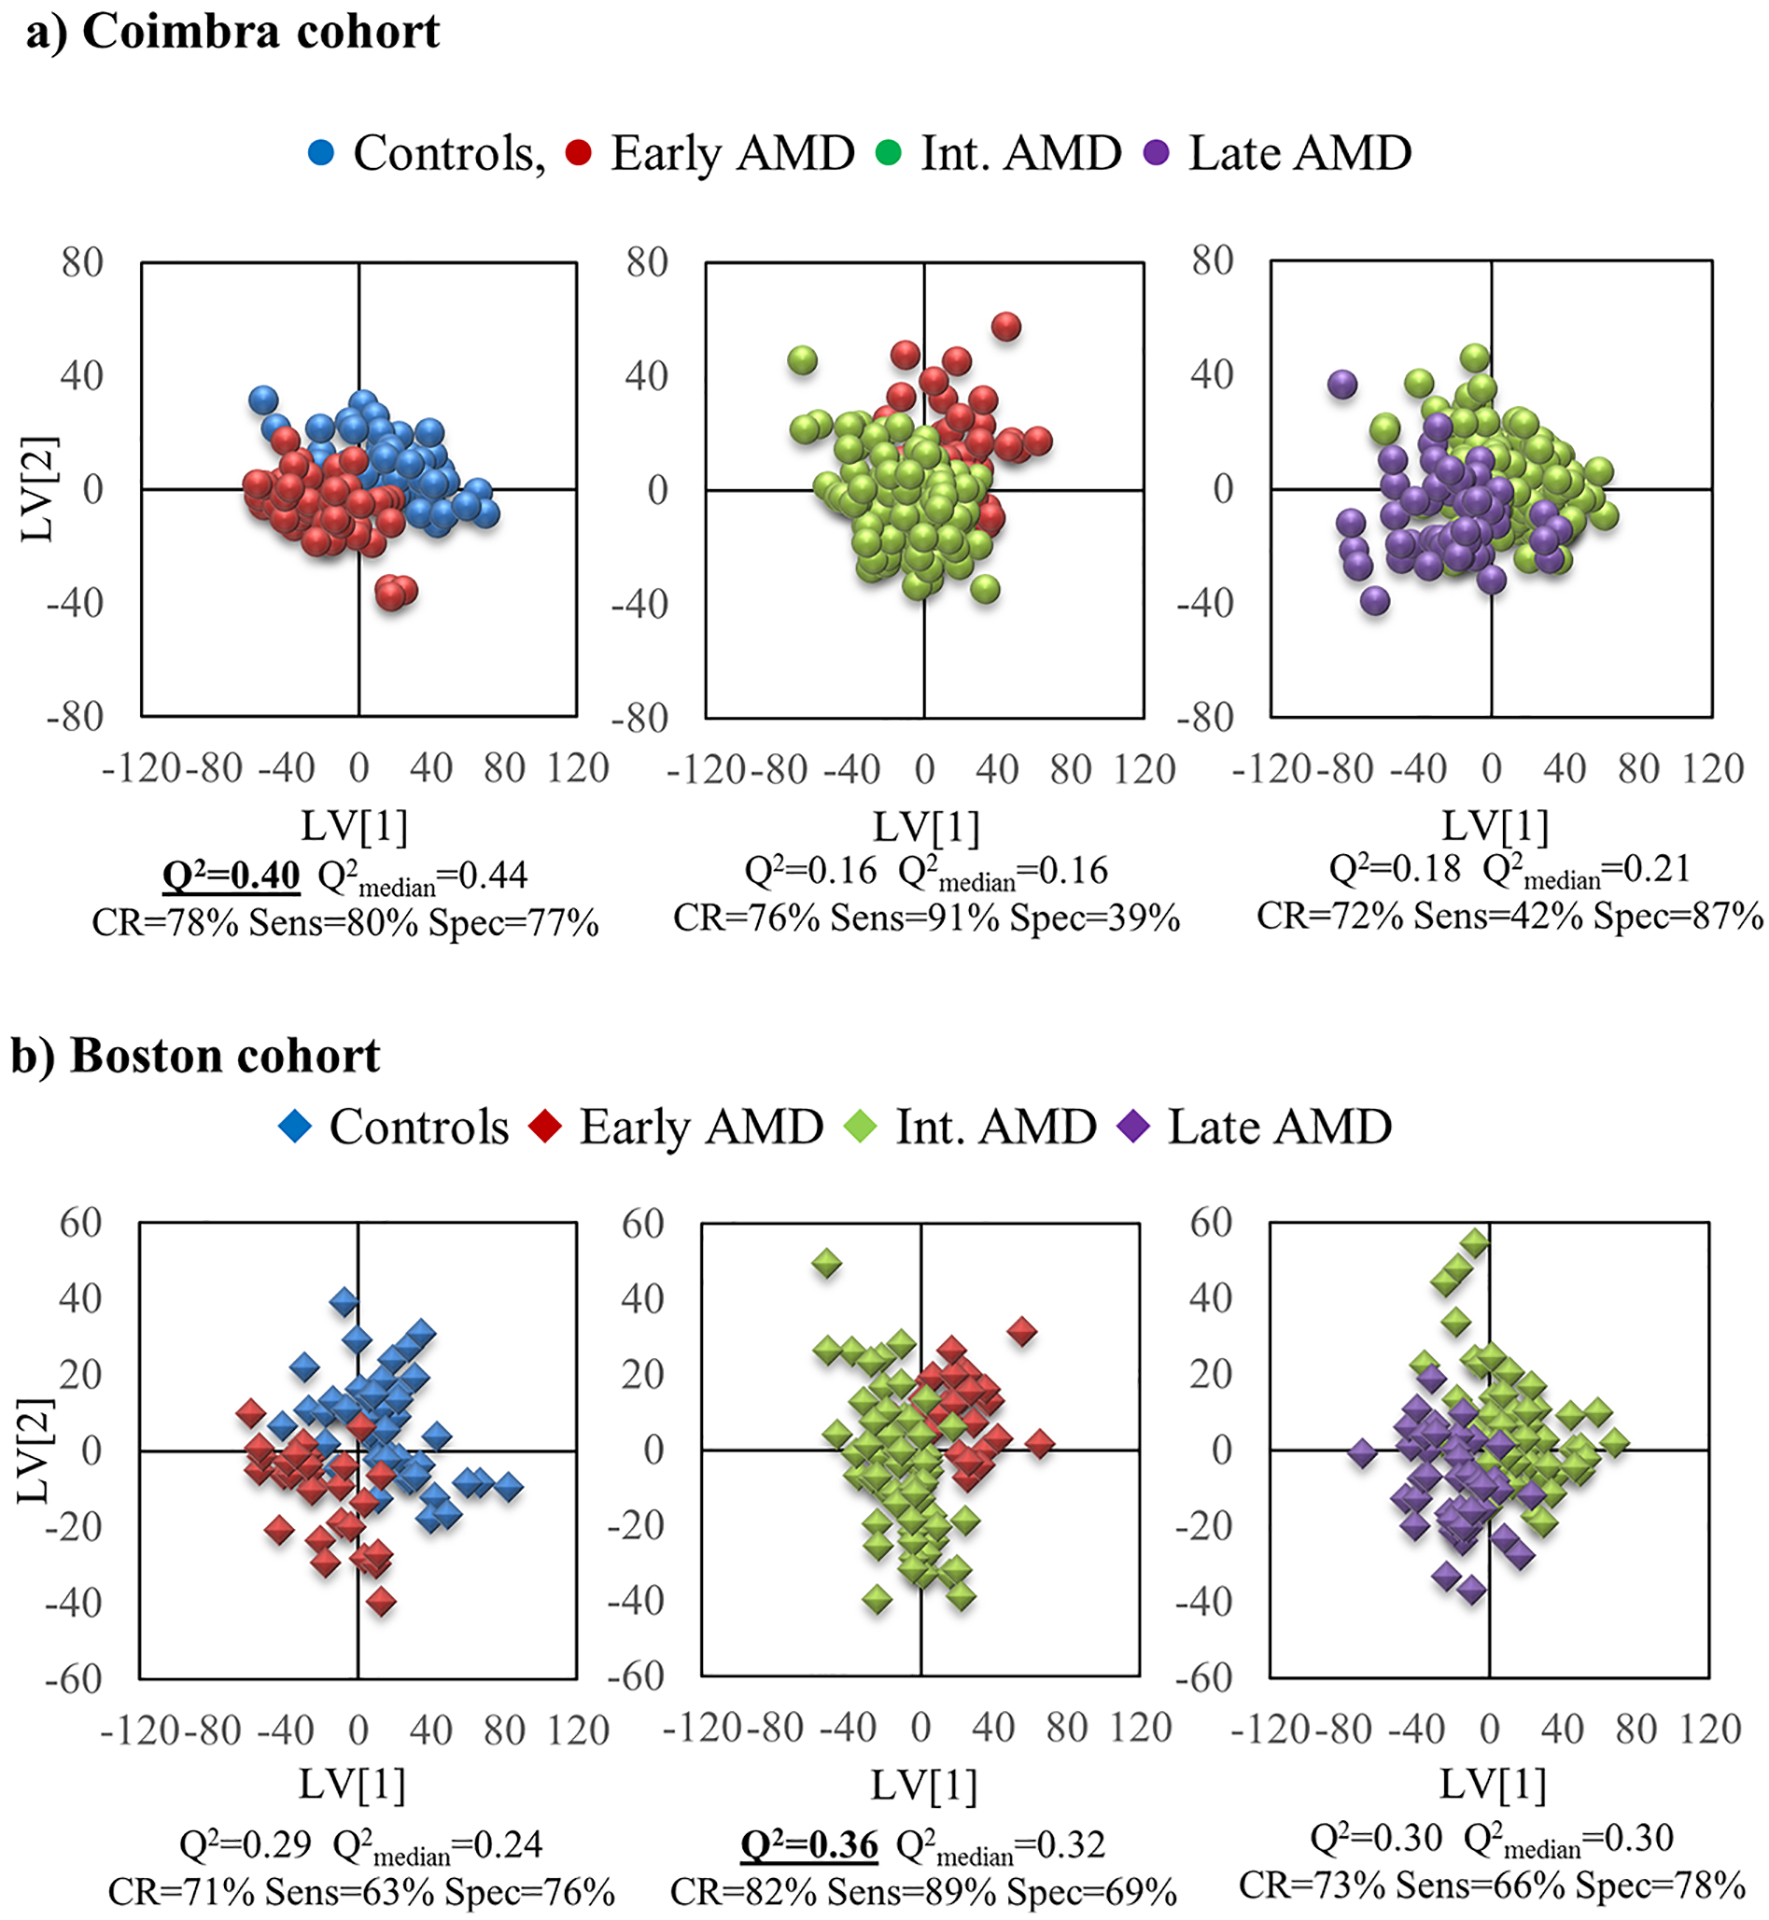
PLS-DA scores plot for pairwise models for variable-selected spectra of urine from the a) Coimbra cohort (circles): left, controls (blue, n = 52) vs early AMD (red, n = 54); middle, early AMD (red, n = 56) vs intermediate AMD (green, n = 141); right, intermediate AMD (green, n = 141) vs late AMD (purple, n = 54), and b) Boston cohort (diamonds): left, controls (blue, n = 46) vs early AMD (red, n = 30); middle, early AMD (red, n = 33) vs intermediate AMD (green, n = 64); right, intermediate AMD (green, n = 63) vs late AMD (purple, n = 43). Q2 value and MCCV results are shown for each model.
In order to assess how age contributed to the observed differences between late AMD and controls, PCA and PLS-DA were applied to the larger intermediate AMD groups, defining age groups above and below the median age for each cohort. The results showed no class separation with age, with PLS-DA models showing no predictive power (Q2 ≤ 0), which meant that age does not impact significantly on the metabolic profile of our subjects, as viewed by NMR. However, detailed spectral analysis suggested tendencies for older subjects in the Coimbra cohort (age >75) to excrete less creatinine (p = 0.0172) and valine (p = 0.0067), and slightly more acetone (p = 0.0043), whereas older subjects in the Boston cohort (age >71) excreted slightly less tyrosine (p = 0.0314). Importantly, these differences were too small to determine any meaningful separation between AMD groups, therefore enabling us to hypothesize that the spectral changes responsible for the shift seen in Figures 2 and S4 are not significantly related to age differences, but mainly to AMD itself. Although gender ratio was found not to differ significantly between groups (Table 1) and, therefore, gender-related metabolic differences should not contribute largely to our results, we have identified the following differences in the urine of women compared to men: (i) in Coimbra: less citrate (p = 1.4 × 10⁻⁷) and cis-aconitate (p = 0.024), and more hippurate (p = 0.026) and dimethylamine (DMA) (p = 0.019); and (ii) in Boston: less creatinine (p = 1.0 × 10⁻⁴), taurine (p = 0.021) and tyrosine (p = 0.032).
Metabolites Responsible for Group Separations in PLS-DA
To interpret the observed group separations in each cohort, analysis of loadings plots and peak integration was carried out to identify specific metabolites the levels of which were changed (Table 3). In the Coimbra cohort, as expected given the relatively higher model predictive powers (Q2), a greater number of changes was noted between patients with early AMD and controls. This was based on decreased levels of 4-hydroxyphenylacetate (4-HPA), formate, s-inositol and sucrose, as well as important changes in unassigned spectral regions at δ 2.86–2.87, 2.87–2.88. The later reflected an interesting shift of an aliphatic feature (Figure S6a), which was not pH related (pH = 7.00 ± 0.02 for all sample groups), and which affected in particular the transition between controls and early AMD (Figure S6b). Although still unassigned, this feature is relevant in distinguishing the two groups and remains significant upon Bonferroni correction for multiple comparisons (see footnote b in Table 3). In the cohort from Coimbra, comparison between intermediate and early AMD revealed a small increase in sucrose levels and small decreases in N-methylnicotinamide (NMND) (in intermediate AMD). In addition, comparison between late and intermediate AMD revealed differences in valine, citrate and in the unassigned δ 2.87–2.88 region. Distinction between late AMD and controls (Table 3) was mainly due to decreased levels of formate (noted in Figure 1), NMND and aliphatic regions at δ 2.86–2.87, 2.87–2.88.
Table 3.
Main Variations in Urine, in Coimbra and Boston Cohorts, between AMD Stages, and Comparing Controls and Late AMD (Bottom Section of Table)a
| Coimbra cohort | Boston cohort | ||||
|---|---|---|---|---|---|
| compound (δ/ppm, multiplicity) | E.S. ± E.S error | p-value | compound (δ/ppm, multiplicity) | E.S. ± E.S error | p-value |
| Early AMD vs Controls | |||||
| formate (8.47, s) | −0.54 ± 0.40 | 1.9 × 10⁻² | citrate (2.54, d) | 0.61 ± 0.48 | 1.5 × 10⁻² |
| 4-HPA (6.86, d) | −0.45 ± 0.39 | 9.1 × 10⁻³ | U1 (6.58, s) | 0.60 ± 0.48 | 3.1 × 10⁻⁴b |
| s-inositol (3.36,s) | −0.48 ± 0.39 | 4.8 × 10⁻³b | U2 (7.68, d) | 0.53 ± 0.47 | 2.2 × 10⁻² |
| sucrose (5.42, d) | −0.47 ± 0.39 | 2.4 × 10⁻³b | U3 (8.79, d) | −0.49 ± 0.48 | 2.9 × 10⁻² |
| (2.86–2.87)c | 0.93 ± 0.42 | 1.1 × 10⁻⁵b | |||
| (2.87–2.88)c | −0.79 ± 0.41 | 4.4 × 10⁻⁵b | |||
| (3.24–3.25)c | −0.71 ± 0.41 | 1.4 × 10⁻⁴b | |||
| Intermediate AMD vs Early AMD | |||||
| NMND (9.28, s) | −0.36 ± 0.32 | 4.7 × 10⁻² | ascorbate (4.52, d) | 0.70 ± 0.46 | 6.9 × 10⁻⁴b |
| sucrose (5.42, d) | 0.55 ± 0.33 | 1.1 × 10⁻⁴b | citrate (2.54, d)d | −0.48 ± 0.45 | 1.8 × 10⁻² |
| creatinine (4.06, s) | −0.66 ± 0.45 | 1.3 × 10⁻² | |||
| glycine (3.57, s) | −0.71 ± 0.46 | 1.5 × 10⁻² | |||
| 2-HIBA (1.36, s) | −0.63 ± 0.46 | 1.6 × 10⁻² | |||
| lysine (1.73, m) | −0.58 ± 0.45 | 1.2 × 10⁻² | |||
| pyruvate (2.38, s) | −0.63 ± 0.45 | 1.7 × 10⁻² | |||
| tyrosine (6.90, d)e | −0.57 ± 0.45 | 4.1 × 10⁻³ | |||
| U1 (6.58, s) | −0.58 ± 0.46 | 1.3 × 10⁻² | |||
| U4 (2.39, d) | −0.51 ± 0.45 | 2.3 × 10⁻² | |||
| U5 (8.03, s) | 0.52 ± 0.45 | 5.3 × 10⁻³ | |||
| U6 (8.70, d) | 0.45 ± 0.45 | 2.6 × 10⁻² | |||
| (8.37–8.42)c | 0.46 ± 0.44 | 4.2 × 10⁻² | |||
| Late AMD vs Intermediate AMD | |||||
| citrate (2.54,d)d | −0.38 ± 0.32 | 9.8 × 10⁻³ | DMA (2.73, sis) | 0.48 ± 0.40 | 8.5 × 10⁻³ |
| valine (1.04, d)e | −0.38 ± 0.32 | 2.1 × 10⁻² | (3.06–3.10)c | 0.47 ± 0.40 | 9.4 × 10⁻⁴b |
| (2.87–2.88)c | −0.37 ± 0.32 | 2.6 × 10⁻³b | (8.23–8.30)c | 0.48 ± 0.40 | 1.5 × 10⁻² |
| Late AMD vs Controls | |||||
| ascorbate (4.52, d) | 0.95 ± 0.46 | 1.6 × 10⁻⁴b | |||
| formate (8.47, s) | −0.70 ± 0.40 | 1.2 × 10⁻³b | |||
| NMND (9.28, s) | −0.61 ± 0.41 | 8.2 × 10⁻³b | |||
| (2.86–2.87)c | 0.67 ± 0.40 | 6.8 × 10⁻⁴b | |||
| (2.87–2.88)c | −1.04 ± 0.43 | 1.1 × 10⁻⁷b | |||
| U2 (7.68, d) | 0.50 ± 0.42 | 9.3 × 10⁻³ | |||
| (3.06–3.10)c | 0.71 ± 0.44 | 2.2 × 10⁻³b | |||
E.S.: effect size; d, doublet; m, multiplet; s, singlet; DMA, dimethylamine; 2-HIBA, 2-hydroxyisobutyrate; 4-HPA, 4-hydroxyphenylactetate; NMND, N-methyl-nicotinamide. Ui: unassigned compound i.
Variations remaining significant after Bonferroni correction, with cutoff p-values of 5.0 × 10⁻³ and 2.8 × 10⁻³, for Coimbra and Boston respectively.
Unassigned complex spectral region varying with statistical relevance.
Metabolite variation common to both cohorts.
Difference could bare contribution from age effects.
In the Boston cohort, the early stage of AMD was weakly distinguished from controls by increased levels of citrate and changes in three unassigned metabolites (U1 to U3) (Table 3). Since 21% of the early stage AMD group also had cardiovascular disease, compared with 4% in controls (Table S1), the urine spectra of those patients were closely inspected. This analysis revealed the absence of any significant changes in citrate and U1–U3 (p-values >0.05), thus suggesting that the changes observed should indeed be related to AMD. In this cohort, stronger differences were noted between intermediate and early AMD stages, with increased levels of ascorbate (the most relevant change even after Bonferroni correction, see footnote b in Table 3), decreased levels of several amino acids (glycine, lysine, tyrosine), citrate, creatinine, 2-hydroxyisobutyrate (2-HIBA), pyruvate and several unassigned resonances. Again, consideration of the spectra corresponding to the subjects with thyroid disease (21% and 6% in intermediate and early AMD, respectively, Table S1) showed that none of these metabolites/resonances were significantly changed (p-values >0.05), which confirmed that the changes listed in Table 3 should indeed be due to AMD. Finally, only small increases in DMA and 2 unassigned regions characterized the separation between late and intermediate AMD stages in the Boston cohort. Patients with late AMD were clearly distinguished from controls by increased levels of ascorbate (Table 3), along with two unassigned features.
Comparison of NMR Plasma and Urine Results
The heatmap in Figure 3 illustrates the metabolic changes between AMD stages in both cohorts, considering both urine and plasma results, the latter obtained for a subset of the cohorts presented in this paper.5 In such heatmap, hot and cold colors represent metabolite increases and decreases, respectively, and both statistically relevant changes and qualitative changes (or tendencies) are shown. Notably, although a large part of the metabolic signatures seems to be population-dependent, the significant decreased levels of excreted amino acids (valine in Coimbra, and glycine, lysine and tyrosine in Boston) and citrate (after an initial increasing tendency in both cohorts) seem to be common features of AMD for both cohorts (footnote d in Table 3, Figure 3). Furthermore, the importance of a large numbers of unassigned peaks in urinary signatures becomes clear.
Figure 3.
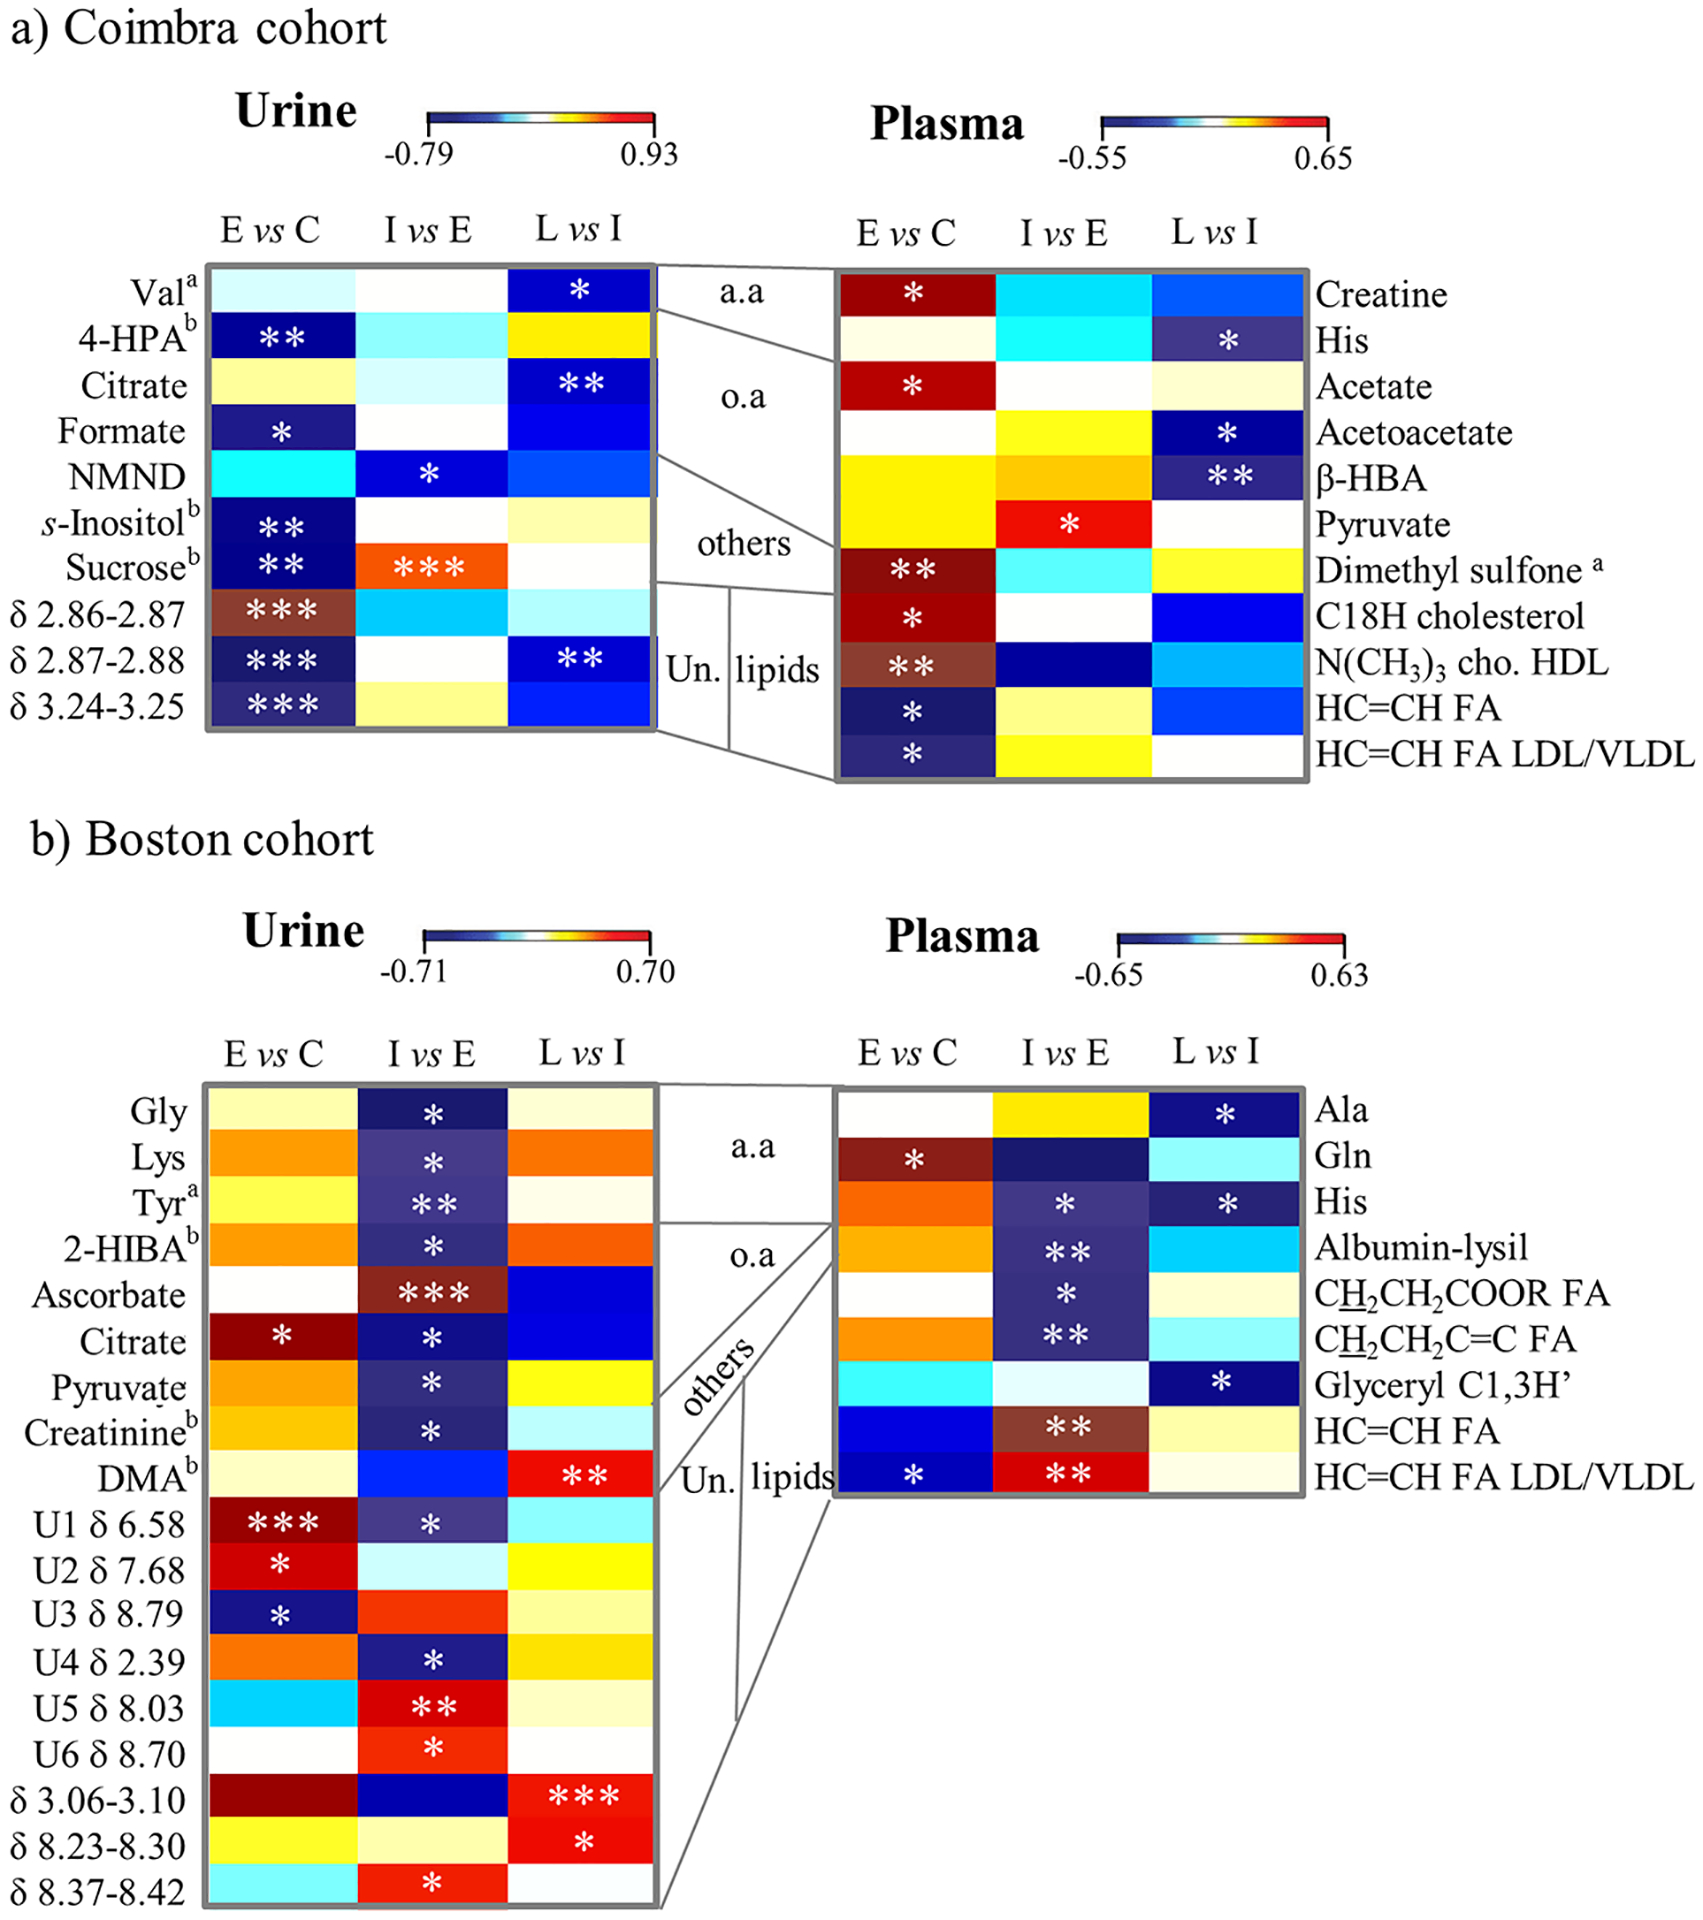
Heatmap of urine (left) and plasma (right) based on previous results5 metabolite changes related to AMD in (a) Coimbra and in (b) Boston cohorts. C: controls, E: early AMD, I: intermediate AMD, L: late AMD, a.a.: amino acids, o.a.: organic acids, Un.: unassigned peaks and regions, 3-letter code used for amino acids, 2-HIBA: 2-hydroxyisobutyrate, 4-HPA: 4-hydroxyphenylacetate, cho: choline, DMA: dimethylamine, β-HBA: β-hydroxybutyrate, FA: fatty acids, NMND: N-methylnicotinamide. a: metabolite whose level may be affected by age to some extent, b: metabolite related to diet and/or gut microflora. * p-value <0.05; ** p-value <0.01; *** p-value <0.001.
DISCUSSION
We present the first urine metabolomics study of AMD patients and controls, where 499 subjects were included from two independent cohorts (Coimbra, Portugal and Boston, United States). An initial comparison between cohorts identified strong inherent differences in urinary profiles, thus potentially masking AMD markers if analysis of joint cohorts was to be followed. Subsequent analysis of each cohort separately demonstrated that the clearest separations in urine NMR metabolomic profiles were observed between late AMD patients and controls, and not as a reflection of age differences. However, important differences were also seen between the early stages of the disease and the control groups. Even though the metabolites responsible for these separations differed between the two study cohorts, common changes were seen on the excreted levels of citrate and selected amino acids in both study groups.
In the cohort from Coimbra, changes were observed when comparing patients with early AMD and controls. These mostly involved metabolite decreases (e.g., formate, 4-HPA, s-inositol. sucrose), with the exception of an unknown at δ 2.86–2.8, which was increased. Interestingly, for this comparison, urine spectra produced better group separation than observed for plasma by NMR, in a similar (although smaller) cohort.5 The biochemical relationship between the changes observed in the two biofluids is not straightforward, but in both biofluids, amino acids and organic acids, together with a list of unassigned resonances in urine and lipids in plasma, seem to represent important features of early AMD. Comparison between early and intermediate AMD did not show many metabolic changes, whereas in late AMD a tendency for decreased excretion of several metabolites was observed, namely for citrate, valine and unassigned aliphatic metabolite(s) (at δ 2.86–2.88).
In the Boston cohort, the general performance of urine NMR metabolomics was weaker than noted for plasma.5 Indeed, we observed relatively little change between early AMD and controls. Despite this, larger changes were seen between early and intermediate AMD stages, including an important increase in ascorbate, a general decrease in amino acids and other organic acids (including citrate, in common with the Coimbra cohort), and some relevant variations in unassigned resonances. Interestingly, in our previous work5 we verified that the plasma NMR profile for early vs intermediate AMD also showed a tendency for amino acids decrease; this persisted in plasma from intermediate to late AMD (alanine, glutamine, histidine), contrary to urine which showed a slight increasing tendency for amino acids in late AMD.
The variability in the metabolic profiles of the two cohorts emphasises the need to further assess the influence of genetic and environmental factors in our results . However, as mentioned, in this study we have observed some common features between the two cohorts regarding citrate (increased in early stages, followed by a decrease at later stages) and selected amino acids (decreased): valine (glucogenic amino acid) in the Coimbra cohort, at late AMD stages; and glycine (glucogenic amino acid), lysine (ketogenic amino acid) and tyrosine (glucogenic/ketogenic amino acid) in the Boston cohort, at intermediate AMD stages. These results are in broad agreement with the previously proposed AMD-specific disturbances assessed by NMR metabolomics of decreased plasma levels of histidine (glucogenic amino acid), fatty acids and proteins.5 Moreover, the decreased levels of excreted glucogenic amino acids in both cohorts, at some stage of the disease, suggest that AMD may induce the use of these amino acids to convert into tricarboxylic acid (TCA) cycle intermediates and/or pyruvate possibly to promote gluconeogenesis, for increased energy production. In addition, ketone bodies production may also be activated to some extent, through ketogenic amino acids (lysine and tyrosine, in the Boston cohort) and lipid oxidation (leading to depletion in plasma lipids in both cohorts),5 in order to activate TCA cycle and gluconeogenesis in extrahepatic tissues. This is consistent with the depletion of acetoacetate and β-hydroxybutyrate (ketone bodies) observed in the plasma of AMD patients from Coimbra.5 Therefore, in general, our NMR results suggest that AMD subjects are likely to undergo activation of energy metabolism, perhaps concomitantly with gluconeogenesis. However, the precise dynamics of the process in relation to AMD staging remains to be established, as it seems to be population-dependent, and additional studies are needed to further clarify the association between urine and plasma signatures and their biological relevance. In addition to these findings, each cohort showed other strong apparent AMD-specific excretory features, which are potentially important as AMD biomarkers, namely: (i) marked changes in still unassigned aliphatic moieties in the Coimbra cohort, which helped differentiate early AMD from controls, and (ii) increased levels of ascorbate in the Boston cohort, which may be related to oxidative stress53 in patients with intermediate AMD and which remain important in late AMD compared to controls.
Importantly, in our study we identified age (both cohorts), and cardiovascular and thyroid diseases (Boston cohort) as potentially important confounding factors between particular study groups. However, none of these factors explained the group separations found, thus suggesting that the observed changes refer to AMD itself. In any case, within the metabolic signatures related to AMD, lower excretion of valine (Coimbra cohort) and tyrosine (Boston cohort) may be partially associated with age. In relation to gender, some metabolites could be weakly related to urine metabolic profile, but only some were present in the AMD signatures: citrate (decreased in women) in the Coimbra cohort, and creatinine and tyrosine (also decreased in women) in the Boston cohort. Hence, it could be argued that the decreases seen in these compounds in AMD patients could originate from the high female/male ratios characterizing these cohorts. However, the facts that (i) no statistical differences were found in female/male ratios between groups (p-value >0.05) and that (ii) the remainder gender-related metabolites found (cis-aconitate, hippurate, DMA, taurine) were not part of the AMD signatures, lead us to propose that the noted decreases in citrate, valine and tyrosine are mainly related to AMD, rather than gender.
One of the largest strengths of this study relates to the inclusion of two cohorts with different geographic origins. Interpopulation studies are particularly important in human metabolomic studies, especially when analyzing urine, which has a highly variable composition. This enables a better assessment of potential confounders capable of masking disease-related metabolite changes, and helps to establish the degree of biomarker specificity to each population. However, this study is not without limitations. First, its cross-sectional design hinders the assessment of causality and evolution of AMD-related metabolomic fingerprints over time. In addition, the biological relevance of biofluid metabolomics in relation to the ocular tissue in AMD was not assessed, and we also did not assess how the observed changes in urine compare to changes with other age-related diseases. Demographics and prior medical history were collected through a self-reporting questionnaire, which allows for the possibility of some degree of response bias, and our cohorts were mostly composed of Caucasian subjects, which limits the external validity of our study. Other limitations relate to the difficulty in identifying many unassigned NMR features that are part of the marker signatures for AMD, and in unambiguously interpreting the changes observed. We also did not consider information on different medication intake, genetics or dietary data, the latter possibly relating to variations in metabolites known to potentially relate to diet/gut microflora (e.g., 4-HPA, s-inositol, sucrose, 2-HIBA, creatinine (meat products), and DMA (fish products)). Finally, here we have assessed the two cohorts separately and compared the findings between them; we suggest that, in future studies with larger sample sizes and for which differences in local characteristics may be accounted for, cohort integration, and training-validation sets definition may be attempted. The above limitations need to be addressed in future work, which could include other techniques of metabolite detection, assessment of genetic and environmental influences in metabolomic profiles, and a longitudinal follow-up of AMD patients.
CONCLUSIONS
We report, for the first time a urine cross-sectional NMR metabolomics study of two independent cohorts of AMD patients and controls. Our results demonstrated that, although urine metabolic profile is, apparently, markedly sensitive to environmental/genetic characteristics, in general, AMD seems to lead to a depletion of excreted citrate and selected amino acids, at some stage of the disease. These changes may suggest an enhancement in energy requirements in AMD patients and the consequent guidance of TCA cycle intermediates toward gluconeogenesis; this is also consistent with indication of ketone bodies being used to trigger energy production in extrahepatic tissues and lipids oxidation, as previously reported in plasma. Further work is needed to explore and validate these findings, which have the potential to develop accessible and reliable biomarkers of AMD.
Supplementary Material
Figure S1. Histograms of age and BMI distributions for controls and AMD patients for Coimbra and Boston cohorts; Figures S2–S5. PCA and PLS-DA results comparing both joint and separate cohorts, in the latter cases (Figures S4 and S5) comparing controls and AMD stages for each cohort in turn; Figure S6. (a) Spectra and (b) boxplots for 2.86–2.88 ppm spectral region, which helps distinguish controls from early AMD groups in Coimbra; Table S1. List of comorbidities characterizing the subject groups under study; and Table S2. List of metabolites and NMR resonances identified in the 1H NMR spectrum of urine of a control subject (Coimbra cohort) (PDF)
ACKNOWLEDGMENTS
This project was funded by the “Fundação para a Ciência e a Tecnologia” (FCT) (HMSP-ICJ/0006/2013), the Miller Retina Research Fund (MEE) and the Miller Champalimaud Award (MEE). This work was developed within the scope of the project CICECO-Aveiro Institute of Materials, FCT ref. UID/CTM/50011/2019 and POCI-01-0145-FEDER-007679, financed by national funds through the FCT/MCTES. AMG and DD acknowledge the Portuguese National NMR Network (RNRMN), supported by FCT funds, and grant SFRH/BD/119509/2016.
Footnotes
Supporting Information
The Supporting Information is available free of charge on the ACS Publications website at DOI: 10.1021/acs.jproteome.8b00877.
The authors declare no competing financial interest.
REFERENCES
- (1).Wong WL; Su X; Li X; Cheung CM; Klein R; Cheng CY; Wong TY; et al. Global prevalence of age-related macular degeneration and disease burden projection for 2020 and 2040: a systematic review and meta-analysis. Lancet Global Health 2014, 2 (2), e106–e116. [DOI] [PubMed] [Google Scholar]
- (2).Sobrin L; Seddon JM Nature and nurture- genes and environment- predict onset and progression of macular degeneration. Prog. Retinal Eye Res 2014, 40, 1–15. [DOI] [PMC free article] [PubMed] [Google Scholar]
- (3).Yonekawa Y; Miller JW; Kim IK Age-Related Macular Degeneration: Advances in Management and Diagnosis. J. Clin. Med 2015, 4 (2), 343–359. [DOI] [PMC free article] [PubMed] [Google Scholar]
- (4).Miller JW Beyond VEGF-The Weisenfeld Lecture. Invest. Ophthalmol. Visual Sci 2016, 57 (15), 6911–6918. [DOI] [PMC free article] [PubMed] [Google Scholar]
- (5).Laíns I; Duarte D; Barros AS; Martins AS; Gil J; Miller JB; et al. Human plasma metabolomics in age-related macular degeneration (AMD) using nuclear magnetic resonance spectroscopy. PLoS One 2017, 12 (5), No. e0177749. [DOI] [PMC free article] [PubMed] [Google Scholar]
- (6).Laíns I; Kelly RS; Miller JB; Silva R; Vavvas D; Kim JK; et al. Human Plasma Metabolomics Study across All Stages of Age-Related Macular Degeneration Identifies Potential Lipid Biomarkers. Ophthalmology 2018, 125 (2), 245–254. [DOI] [PMC free article] [PubMed] [Google Scholar]
- (7).Fiehn O Metabolomics-the link between genotypes and phenotypes. Plant Mol. Biol 2002, 48 (1–2), 155–171. [PubMed] [Google Scholar]
- (8).Nicholson JK; Lindon JC; Holmes E Metabonomics”: understanding the metabolic responses of living systems to pathophysiological stimuli via multivariate statistical analysis of biological NMR spectroscopic data. Xenobiotica 1999, 29 (11), 1181–1189. [DOI] [PubMed] [Google Scholar]
- (9).Dunn WB; Broadhurst D; Begley P; Zelena E; Francis-McIntyre S; Anderson N; et al. Procedures for large-scale metabolic profiling of serum and plasma using gas chromatography and liquid chromatography coupled to mass spectrometry. Nat. Protoc 2011, 6 (7), 1060–1083. [DOI] [PubMed] [Google Scholar]
- (10).Beckonert O; Keun HC; Ebbels TM; Bundy J; Holmes E; Lindon JC; et al. Metabolic profiling, metabolomic and metabonomic procedures for NMR spectroscopy of urine, plasma, serum and tissue extracts. Nat. Protoc 2007, 2 (11), 2692–2703. [DOI] [PubMed] [Google Scholar]
- (11).Psychogios N; Hau DD; Peng J; Guo AC; Mandal R; Bouatra S; et al. The human serum metabolome. PLoS One 2011, 6 (2), No. e16957. [DOI] [PMC free article] [PubMed] [Google Scholar]
- (12).Junot C; Fenaille F; Colsch B; Bécher F High resolution mass spectrometry based techniques at the crossroads of metabolic pathways. Mass Spectrom. Rev 2014, 33 (6), 471–500. [DOI] [PubMed] [Google Scholar]
- (13).Kohler I; Verhoeven A; Derks RJ; Giera M Analytical pitfalls and challenges in clinical metabolomics. Bioanalysis 2016, 8 (14), 1509–1532. [DOI] [PubMed] [Google Scholar]
- (14).Nicholson JK; Holmes E; Kinross JM; Darzi AW; Takats Z; Lindon JC Metabolic phenotyping in clinical and surgical environments. Nature 2012, 491 (7424), 384–392. [DOI] [PubMed] [Google Scholar]
- (15).Senn T; Hazen SL; Tang WH Translating metabolomics to cardiovascular biomarkers. Prog. Cardiovasc. Dis 2012, 55 (1), 70–76. [DOI] [PMC free article] [PubMed] [Google Scholar]
- (16).Duarte IF; Gil AM Metabolic signatures of cancer unveiled by NMR spectroscopy of human biofluids. Prog. Nucl. Magn. Reson. Spectrosc 2012, 62, 51–74. [DOI] [PubMed] [Google Scholar]
- (17).Duarte IF; Rocha CM; Barros AS; Gil AM; Goodfellow BJ; Carreira IM; et al. Can nuclear magnetic resonance (NMR) spectroscopy reveal different metabolic signatures for lung tumours? Virchows Arch. 2010, 457 (6), 715–725. [DOI] [PubMed] [Google Scholar]
- (18).Rocha CM; Carrola J; Barros AS; Gil AM; Goodfellow BJ; Carreira IM; et al. Metabolic signatures of lung cancer in biofluids: NMR-based metabonomics of blood plasma. J. Proteome Res 2011, 10 (9), 4314–4324. [DOI] [PubMed] [Google Scholar]
- (19).Carrola J; Rocha CM; Barros AS; Gil AM; Goodfellow BJ; Carreira IM; et al. Metabolic signatures of lung cancer in biofluids: NMR-based metabonomics of urine. J. Proteome Res 2011, 10 (1), 221–230. [DOI] [PubMed] [Google Scholar]
- (20).Diaz SO; Barros AS; Goodfellow BJ; Duarte IF; Galhano E; Pita C; et al. Second Trimester Maternal Urine for the Diagnosis of Trisomy 21 and Prediction of Poor Pregnancy Outcomes. J. Proteome Res 2013, 12 (6), 2946–2957. [DOI] [PubMed] [Google Scholar]
- (21).Emwas A-H; Roy R; McKay RT; Ryan D; Brennan L; Tenori L; et al. Recommendations and Standardization of Biomarker Quantification Using NMR-Based Metabolomics with Particular Focus on Urinary Analysis. J. Proteome Res 2016, 15 (2), 360–373. [DOI] [PMC free article] [PubMed] [Google Scholar]
- (22).Monteiro MS; Barros AS; Pinto J; Carvalho M; Pires-Luís AS; Henrique R; et al. Nuclear Magnetic Resonance metabolomics reveals an excretory metabolic signature of renal cell carcinoma. Sci. Rep 2016, 6, 37275. [DOI] [PMC free article] [PubMed] [Google Scholar]
- (23).Diaz SO; Pinto J; Barros AS; Morais E; Duarte D; Negrão F; et al. Newborn Urinary Metabolic Signatures of Prematurity and Other Disorders: A Case Control Study. J. Proteome Res 2016, 15 (1), 311–325. [DOI] [PubMed] [Google Scholar]
- (24).Mal M Noninvasive metabolic profiling for painless diagnosis of human diseases and disorders. Future Science OA 2016, 2 (2), FSO106. [DOI] [PMC free article] [PubMed] [Google Scholar]
- (25).Liang Q; Liu H; Wang C; Li B Phenotypic Characterization Analysis of Human Hepatocarcinoma by Urine Metabolomics Approach. Sci. Rep 2016, 6, 19763. [DOI] [PMC free article] [PubMed] [Google Scholar]
- (26).Chen Z; Kim J Urinary proteomics and metabolomics studies to monitor bladder health and urological diseases. BMC Urol. 2016, 16 (1), 11. [DOI] [PMC free article] [PubMed] [Google Scholar]
- (27).Fernández-Peralbo MA; Gómez-Gómez E; Calderón-Santiago M; Carrasco-Valiente J; Ruiz-García J; Requena-Tapia MJ; et al. Prostate Cancer Patients-Negative Biopsy Controls Discrimination by Untargeted Metabolomics Analysis of Urine by LCQTOF: Upstream Information on Other Omics. Sci. Rep 2016, 6, 38243. [DOI] [PMC free article] [PubMed] [Google Scholar]
- (28).Deng L; Fang H; Tso VK; Sun Y; Foshaug RR; Krahn SC; et al. Clinical validation of a novel urine-based metabolomic test for the detection of colonic polyps on Chinese population. International Journal of Colorectal Disease 2017, 32 (5), 741–743. [DOI] [PubMed] [Google Scholar]
- (29).Xu J; Chen Y; Zhang R; He J; Song Y; Wang J; et al. Global metabolomics reveals potential urinary biomarkers of esophageal squamous cell carcinoma for diagnosis and staging. Sci. Rep 2016, 6, 35010. [DOI] [PMC free article] [PubMed] [Google Scholar]
- (30).Tsiropoulou S, McBride M; Padmanabhan S Urine Metabolomics in Hypertension Research In Methods in Molecular Biology; Touyz R, Schiffrin E, Eds.; Humana Press: New York, 2017; Vol 1527, pp 61–68. [DOI] [PubMed] [Google Scholar]
- (31).Li Z; Liu X; Wang J; Gao J; Guo S; Gao K; et al. Analysis of urinary metabolomic profiling for unstable angina pectoris disease based on nuclear magnetic resonance spectroscopy. Mol. BioSyst 2015, 11 (12), 3387–3396. [DOI] [PubMed] [Google Scholar]
- (32).An M; Gao Y Urinary Biomarkers of Brain Diseases. Genomics, Proteomics Bioinf. 2015, 13 (6), 345–354. [DOI] [PMC free article] [PubMed] [Google Scholar]
- (33).Maitre L; Villanueva CM; Lewis MR; Ibarluzea J; Santa-Marina L; Vrijheid M; et al. Maternal urinary metabolic signatures of fetal growth and associated clinical and environmental factors in the INMA study. BMC Med. 2016, 14 (1), 177. [DOI] [PMC free article] [PubMed] [Google Scholar]
- (34).Finco G; Locci E; Mura P; Massa R; Noto A; Musu M; et al. Can Urine Metabolomics Be Helpful in Differentiating Neuropathic and Nociceptive Pain? A Proof-of-Concept Study. PLoS One 2016, 11 (3), No. e0150476. [DOI] [PMC free article] [PubMed] [Google Scholar]
- (35).Yan B; Huang J; Dong F; Yang L; Huang C; Gao M; et al. Urinary metabolomic study of systemic lupus erythematosus based on gas chromatography/mass spectrometry. Biomed. Chromatogr 2016, 30 (11), 1877–1881. [DOI] [PubMed] [Google Scholar]
- (36).Tan SZ; Begley P; Mullard G; Hollywood KA; Bishop PN Introduction to metabolomics and its applications in ophthalmology. Eye (London, U. K.) 2016, 30 (6), 773–783. [DOI] [PMC free article] [PubMed] [Google Scholar]
- (37).Osborn MP; Park Y; Parks MB; Burgess LG; Uppal K; Lee K; et al. Metabolome-wide association study of neovascular age-related macular degeneration. PLoS One 2013, 8 (8), No. e72737. [DOI] [PMC free article] [PubMed] [Google Scholar]
- (38).Brown CN; Green BD; Thompson RB; den Hollander AI; Lengyel I Metabolomics and Age-Related Macular Degeneration. Metabolites 2019, 9 (1), article no. 4. [DOI] [PMC free article] [PubMed] [Google Scholar]
- (39).Cachulo M. da L; Lobo C; Figueira J; Ribeiro L; Laíns I; Vieira A; et al. Prevalence of Age-Related Macular Degeneration in Portugal: The Coimbra Eye Study - Report 1. Ophthalmologica 2015, 233 (3–4), 119–127. [DOI] [PubMed] [Google Scholar]
- (40).Laíns I; Miller JB; Mukai R; Mach S; Vavvas D; Kim JK Health conditions linked to age-related molecular degeneration associated with dark adaptation. Retina 2018, 38, 1145. [DOI] [PubMed] [Google Scholar]
- (41).Age-Related Eye Disease Study Research Group. The Age-Related Eye Disease Study system for classifying age-related macular degeneration from stereoscopic color fundus photographs: the Age-Related Eye Disease Study Report Number 6. Am. J. Ophthalmol 2001, 132 (5), 668–681. [DOI] [PubMed] [Google Scholar]
- (42).Danis RP; Domalpally A; Chew EY; Clemons TE; Armstrong J; SanGiovanni JP; et al. Methods and reproducibility of grading optimized digital color fundus photographs in the Age-Related Eye Disease Study 2 (AREDS2 Report Number 2). Invest. Ophthalmol. Visual Sci 2013, 54 (7), 4548–4554. [DOI] [PMC free article] [PubMed] [Google Scholar]
- (43).Tsikata E; Laíns I; Gil J; Marques M; Brown K; Mesquita T; et al. Automated Brightness and Contrast Adjustment of Color Fundus Photographs for the Grading of Age-Related Macular Degeneration. Translational Vision Science & Technology 2017, 6 (2), 3. [DOI] [PMC free article] [PubMed] [Google Scholar]
- (44).Wishart DS; Feunang YD; Marcu A; Guo AC; Liang K; Vázquez-Fresno R; et al. HMDB 4.0: the human metabolome database for 2018. Nucleic Acids Res. 2018, 46 (D1), D608–D617. [DOI] [PMC free article] [PubMed] [Google Scholar]
- (45).Bouatra S; Aziat F; Mandal R; Guo AC; Wilson MR; Knox C; et al. The Human Urine Metabolome. PLoS One 2013, 8 (9), No. e73076. [DOI] [PMC free article] [PubMed] [Google Scholar]
- (46).Cloarec O; Dumas M-E; Craig A; Barton RH; Trygg J; Hudson J; et al. Statistical Total Correlation Spectroscopy: An Exploratory Approach for Latent Biomarker Identification from Metabolic 1H NMR Data Sets. Anal. Chem 2005, 77 (5), 1282–1289. [DOI] [PubMed] [Google Scholar]
- (47).Veselkov KA; Lindon JC; Ebbels TMD; Crockford D; Volynkin VV; Holmes E; et al. Recursive Segment-Wise Peak Alignment of Biological 1 H NMR Spectra for Improved Metabolic Biomarker Recovery. Anal. Chem 2009, 81 (1), 56–66. [DOI] [PubMed] [Google Scholar]
- (48).Szymańska E; Saccenti E; Smilde AK; Westerhuis JA Double-check: validation of diagnostic statistics for PLS-DA models in metabolomics studies. Metabolomics 2012, 8 (S1), 3–16. [DOI] [PMC free article] [PubMed] [Google Scholar]
- (49).Triba MN; Le Moyec L; Amathieu R; Goossens C; Bouchemal N; Nahon P; et al. PLS/OPLS models in metabolomics: the impact of permutation of dataset rows on the K-fold cross-validation quality parameters. Mol. BioSyst 2015, 11 (1), 13–19. [DOI] [PubMed] [Google Scholar]
- (50).Obuchowski NA; Lieber ML; Wians FH ROC curves in clinical chemistry: uses, misuses, and possible solutions. Clin. Chem 2004, 50 (7), 1118–1125. [DOI] [PubMed] [Google Scholar]
- (51).R Development Core Team. R: A language and environment for statistical computing, version 2.14.1; R Foundation for Statistical Computing: Vienna, 2010. [Google Scholar]
- (52).Berben L; Sereika SM; Engberg S Effect size estimation: Methods and examples. International Journal of Nursing Studies 2012, 49, 1039–1047. [DOI] [PubMed] [Google Scholar]
- (53).Halliwell B Free radicals, antioxidants, and human disease: curiosity, cause, or consequence? Lancet 1994, 344 (8924), 721–724. [DOI] [PubMed] [Google Scholar]
Associated Data
This section collects any data citations, data availability statements, or supplementary materials included in this article.
Supplementary Materials
Figure S1. Histograms of age and BMI distributions for controls and AMD patients for Coimbra and Boston cohorts; Figures S2–S5. PCA and PLS-DA results comparing both joint and separate cohorts, in the latter cases (Figures S4 and S5) comparing controls and AMD stages for each cohort in turn; Figure S6. (a) Spectra and (b) boxplots for 2.86–2.88 ppm spectral region, which helps distinguish controls from early AMD groups in Coimbra; Table S1. List of comorbidities characterizing the subject groups under study; and Table S2. List of metabolites and NMR resonances identified in the 1H NMR spectrum of urine of a control subject (Coimbra cohort) (PDF)