

Abstract
Ongoing social, political and ecological changes in the 21st century have placed more people at risk of life-threatening acute and chronic infections than ever before. The development of new diagnostic, prophylactic, therapeutic and curative strategies is critical to address this burden but is predicated on a detailed understanding of the immensely complex relationship between pathogens and their hosts. Traditional, reductionist approaches to investigate this dynamic often lack the scale and/or scope to faithfully model the dual and codependent nature of this relationship, limiting the success of translational efforts. With recent advances in large-scale, quantitative, omics methodologies as well as advances in integrative analytical strategies, systems biology approaches for the study of infectious disease are quickly forming a new paradigm for how we understand and model host–pathogen relationships for translational applications. Here, we delineate a framework for a systems biology approach to infectious disease in three parts: discovery — the design, collection and analysis of omics data; representation — iterative modelling, integration and visualization of complex data sets; and application — the interpretation and hypothesis-based inquiry towards translational outcomes.
ToC
This Review outlines a broad, universal framework for systems biology applied to infectious disease research. From study design, omics data collection, analysis, visualization and interpretation to translational outcomes, the authors illustrate how systems biology can provide insights into host–pathogen relationships for the betterment of human health.
Introduction
Annually, 15% of all deaths worldwide are directly attributable to infectious diseases.1 Multidrug-resistant pathogens, the rapid spread of emerging diseases exacerbated by increased globalization, and the extended reach of tropical and vector-borne diseases resulting from continued climate change have put an ever-increasing number of people at risk of life-threatening, acute or chronic infections. As such, the infectious disease field is set to face a series of challenges in the next decade that will require a revolution in our ability to rapidly understand, discover and develop novel diagnostic, prophylactic, therapeutic and curative therapies to a wide variety of human pathogens. To meet these challenges, infectious disease researchers are increasingly turning towards systems biology approaches, which enable high-throughput, quantitative descriptions of the molecular networks underlying infection.2,3
Systems biology is the holistic characterization and modelling of a living system as a biological network.4,5 While reductionist approaches seek to simplify or isolate the impact of a single component on a larger biological process, systems approaches endeavour to provide a comprehensive model of a process through quantification of all observable components and their relationships. The resultant models are therefore immensely powerful tools for understanding the role of previously undescribed components, elucidating new relationships between components, and deciphering multi-variable emergent properties that would otherwise be missed. The system being studied can be as large as an ecosystem, organism or tissue, or as small as a single cell, cellular compartment or set of molecules. Likewise, the components that make up the system are accordingly diverse, from single organisms or cells to proteins, genes or metabolites. How a system and its components are defined is critical to the ability of the constructed model to derive novel insight, make predictions and inform hypothesis-driven research.2–5
The application of systems approaches to infectious disease research is particularly complex as it involves the consideration of two principal components: the host and the pathogen.2,6,7 The dual nature of these systems increases their complexity exponentially as researchers have to consider how variations in each component may alter the dynamics and outcome of the overall relationship as well as the interactions between each individual component (FIG. 1). Pathogens not only adapt to and modify the molecular architecture of their hosts for optimal replication but also influence the host response to infection. Additional environmental and immunological variables acting on both host and pathogen contribute to a disease state that is unique to each species, each pathogenic strain and each infected individual.6,8 This complexity highlights both the promise and the challenge of systems biology for infectious disease research. On the one hand, a well-designed systems experiment can work effectively to model the intricacies of a complex system, capturing established knowns as well as revealing novel unknown mechanisms and emergent properties. On the other hand, a poorly designed experiment can lack direction, fail to include the necessary controls to draw pertinent conclusions, or result in models that do not accurately reflect the process at hand.2,3
Figure 1 |. Interdependence of host and pathogen.
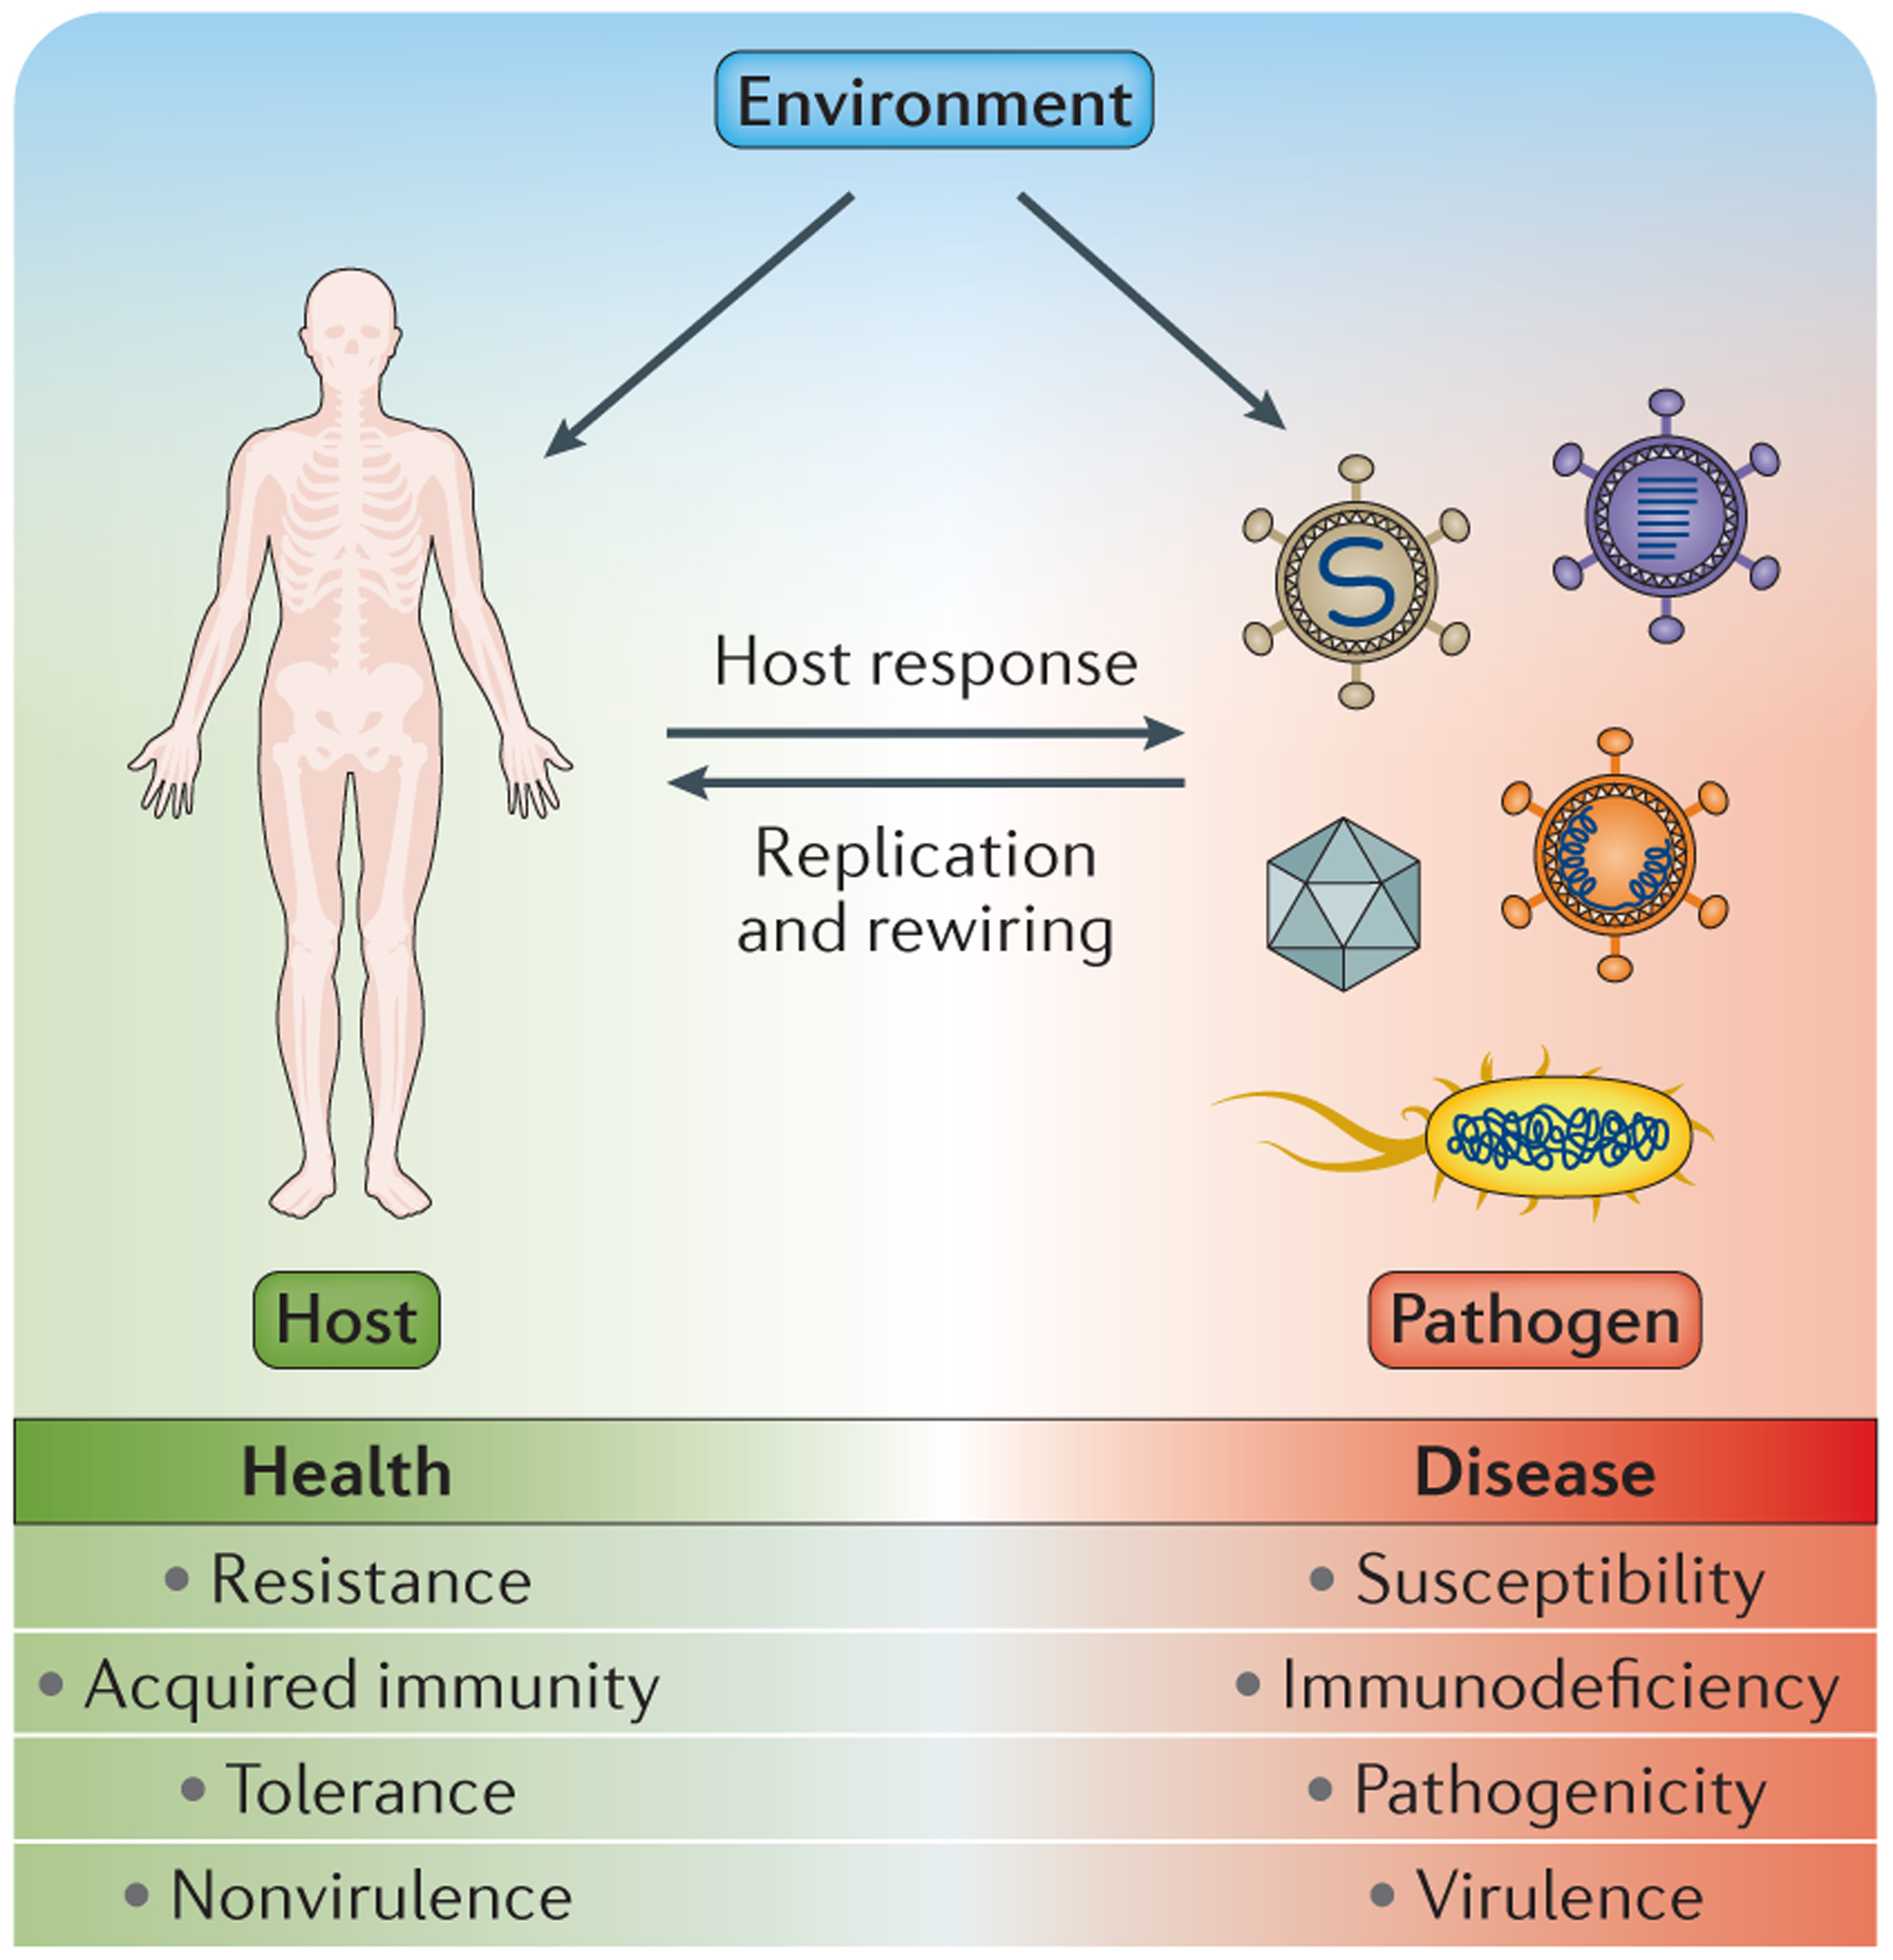
A representation of the intricate relationship between host and pathogen that ultimately dictates the outcome of infection on the spectrum between health and disease. Pathogens effect direct changes on the host, which in turn elicits a response to infection, both of which are influenced by the underlying environment. These influences dictate susceptibility versus resistance, tolerance versus pathogenicity, immune response versus immunodeficiency, virulence versus nonvirulence, and ultimately health versus disease. Systems biology approaches are especially valuable in infectious disease research as a way to capture a comprehensive picture of this intricate relationship.
Recent technological advancements in high-throughput, quantitative measurements have enabled the application of systems approaches at the molecular level.9,10 Several omics approaches such as genomics, functional genomics, epigenomics, proteomics and metabolomics now allow for the identification and quantification of molecules in a system with increasing comprehensiveness, accuracy and sensitivity. The development, application and interpretation of these omics approaches, as well as the computational integration and modelling of the resulting data sets, each constitute its own specialized field that evolves and grows with the technology that enables it. Given the scope, size and continuing evolution of these approaches, team science is inherent in systems biology, requiring interdisciplinary collaboration, effective and ongoing communication and a clear plan for data collection, organization and dissemination.
Here, we review a systems biology approach to infectious disease in three phases: discovery, representation and application (FIG. 2). Rather than focus on a specific technique or pathogen, this Review outlines a broad, universal framework for systems biology through the lens of infectious disease research. In the first section (discovery), we discuss considerations for the appropriate design of a systems experiment, the collection and analysis of omics data, and validation of the primary data set. In the second section (representation), we discuss the integration and visualization of omics data in a network model with regards to the iterative nature of systems approaches. In the third section (application), we discuss how systems-generated models interface with hypothesis-driven research and can lead to new directions for clinical investigation. Systems biology is neither a magic bullet nor a fishing expedition, but a rapidly evolving science that presents many challenges and even more opportunities to revolutionize how we study and understand host–pathogen relationships for the betterment of human health.
Figure 2 |. A systems biology framework.
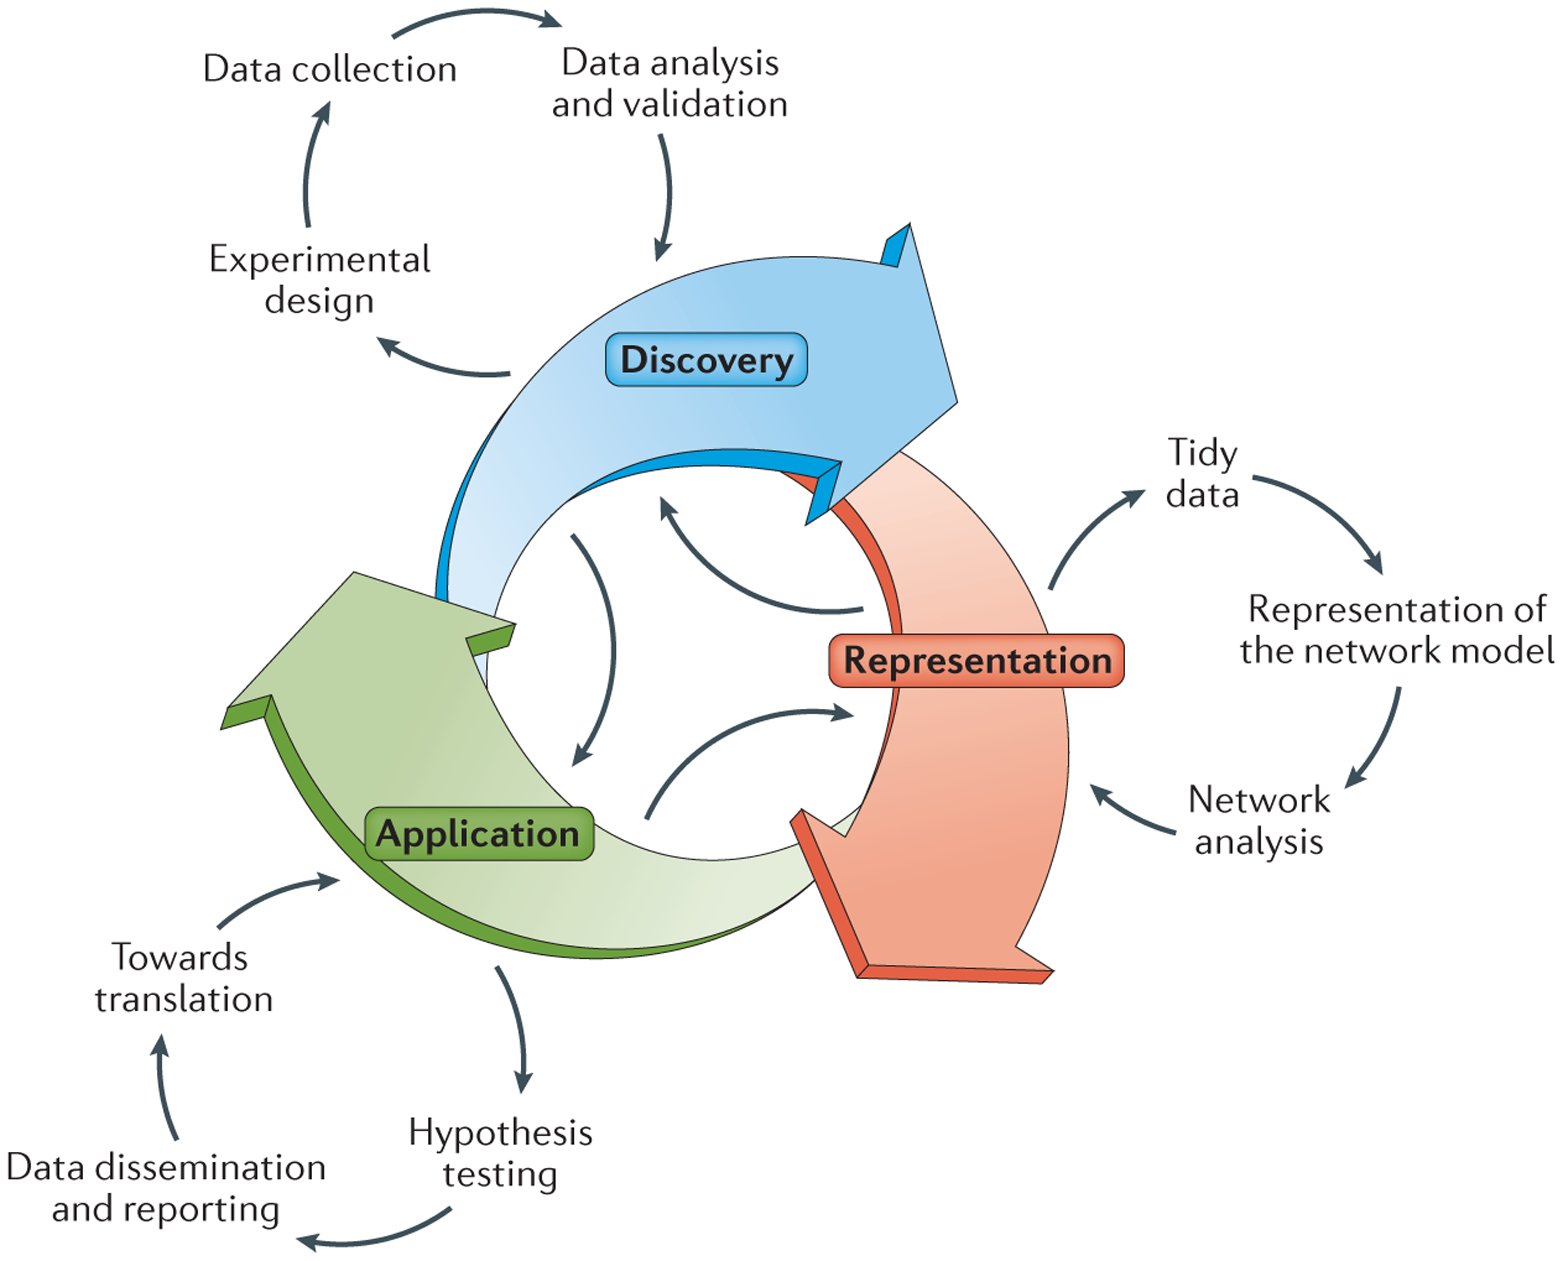
A visual representation of the steps we outline in this review as part of a systems biology approach to infectious disease from discovery to representation to application. Arrows highlight the iterative and interconnected nature of systems biology as a process. CRISPRa, CRISPR activation; CRISPRi, CRISPR inhibition; E-MAP; epistatic mini-array profile; GWAS, genome-wide association studies; RNAi, RNA interference; seq, sequencing.
Our intent is to inform a broad community of researchers in the fields of infectious disease, systems biology and computational biology to promote a shared understanding of the strengths, potential impact and current limitations of systems approaches for studying infectious diseases. For information on the latest technological advances and breakthroughs within specific fields relating to systems biology11–22 or individual applications to infectious diseases23–30, we refer readers to other recent reviews.
Discovery
Experimental design
Unlike hypothesis-driven research, which infers novel relationships from known priors in the established literature, systems approaches seek to first capture a comprehensive, global picture of the system in question to generate a model that serves as a starting point for hypothesis generation.4,5 The most critical step in this process is the experimental design, which needs to account for not only the process of generating and validating a model of the system being studied but also the downstream application of the model to ensure it will derive testable hypotheses that answer pertinent questions in the field. Systems biology studies can take many years to complete, but the models and data sets they generate can inspire hypotheses and follow up studies for decades to come, exemplified by the long-term impact of consortia2,31–33 and pioneering research efforts alike34–38. While it may be tempting to move forward with data collection as soon as possible, detailed preparation upfront goes a long way towards ensuring success downstream. In this section, we highlight some of the considerations that should be taken into account during experimental design, illustrating these points through a hypothetical case study presented in Box 1.
Box 1 |. Experimental design: a case study.
Experimental design is the most important step of any systems biology experiment, but is hard to find transparently represented in the literature. To supplement our discussion, we provide this case study of critical questions to consider in the design of a hypothetical systems biology experiment involving the Dengue virus (DENV) protein NS2B/3.
A researcher is interested in learning more about the role of the DENV protein NS2B/3 in regulating the innate immune response. At minimum, this list of questions should be addressed during experimental design.
1). Question: What are the goals of the experiment?
What is known/unknown about NS2B/3 and the innate immune response?
Can significant unknowns be uncovered using a systems approach or is a hypothesis-driven approach sufficient?
Is the goal to understand the role of NS2B/3 in regulating early events in infection or the systemic response? In what compartment? Is patient outcome important, i.e. mild or severe disease?
2). Experimental System: What model system is being used and what components are being measured?
What cell types does DENV infect? Are there primary or immortalized cell lines available? Animal models? Do these models support DENV infection and recapitulate in vivo characteristics?
Is an in vivo or ex vivo system better to capture the response of interest?
What strain of DENV will be used? At what time point? Is the level of infection important technically or biologically?
What cellular or viral components are the most relevant to answer the question (i.e. phosphorylation sites or RNA transcript abundance)?
Can the technique proposed be robustly applied in this system?
3). Controls: Which technical and biological controls need to be included?
What technical controls are required for the technique to be successful?
Are there previously established negative and positive controls to establish assay sensitivity?
Can additional biological controls focus the dataset further (i.e. the use of an NS2B/3 mutant virus or interferon treatment)?
Is a pilot experiment required to test the experimental pipeline to ensure the system and technique work as expected?
4). Validation: How will the primary data set be validated?
Which orthogonal techniques are available to validate the primary data set? How high is their throughput?
How will data points be selected for validation and how many are required to establish confidence?
What known priors or gold standards are these data expected to recapitulate?
Do outside collaborations need to be established to facilitate validation?
5). Analysis: What computational steps are needed for analysis and interpretation of the data?
How many biological or technical replicates are required to provide sufficient power to the data set to make relevant comparisons and draw meaningful conclusions?
Does a computational expert need to be consulted for data analysis? Have they been consulted for experimental design?
Is a pilot experiment required to test the experimental pipeline to ensure the system and technique work as expected?
6). Hypothesis-testing: Which hypotheses will be tested and how?
What kinds of hypotheses can these data generate? Can these be tested in primary cell models of DENV infection? Are patient samples required and/or available?
How will hypotheses be prioritized for testing?
Do outside collaborations need to be established to facilitate hypothesis testing?
The first and most important step in designing a successful systems biology experiment is a clear definition of the question being asked and the overall goal of the experiment. Systems approaches and omics technologies are powerful tools that can generate a lot of data in relatively short order. For example, a single proteomics sample can yield thousands of peptides and a single deep sequencing reaction can yield millions of reads in a matter of hours. However, data are not inherently valuable if they cannot be applied to a relevant biological question. In fact, in the absence of the appropriate controls or context, large data sets can be hard if not impossible to effectively interpret and thus of limited value. Definition of the goals upfront helps determine the model system to be employed, the approach to be taken, the breadth and depth of the measurements, and the controls to be included. While this does not necessarily preclude a data set from being useful for other purposes, it may not be actionable or effective for follow-up study without clear forethought as to its application.
The second step is to define the system to be modelled and the components to be measured. It is vital to find a model system that closely recapitulates the host and pathogen processes under consideration while simultaneously allowing reproducible and accurate quantification of its components. Primary model systems [G], animal models or patient samples may be ideal for recapitulating the host conditions during infection, but the inherent limitations of these systems may restrict the techniques that can be applied. For example, tissue-resident macrophages are critical regulators of the local immune response and important sites of infection for many viral pathogens, including human immunodeficiency virus (HIV), influenza A virus and Dengue virus, but the limited number of these cells that can be isolated from patient tissues and their sensitivity to environmental stimuli rule out their use in any omics protocols that relies on large cell numbers. Conversely, immortalized cell lines offer great technical flexibility but can often fail to accurately recapitulate the biological process of interest.39–41 It is equally important to consider the pathogen(s) being modelled in terms of strain, infection stage and infection levels to ensure the design is both feasible and fidelitous.
While a perfect model system may not always be available, it is important to consider the benefits and limitations of the model and to weigh the implications of these choices during model building and interpretation. For example, if a laboratory-adapted strain [G] of a pathogen or immortalized human cell line is required for omics data collection, it is important to note that not all aspects of the final model will reflect the behaviour of clinical isolates [G] or primary human cells.39–42 One common strategy is to build the initial model in a technically robust model system and then extend these data sets into more complex in vivo systems during the hypothesis-testing phase of the study (see Application).
The third step is careful consideration of the type of data to be collected and the necessary controls to be run. The question being asked, the model system being employed and the approach to be used are all highly interdependent, and it is critical to carefully assess both the costs and benefits of each component to design a systems experiment that is both relevant and robust. Is the model system proposed appropriate to answer the questions at hand? What types of data are most valuable in answering these questions? And can these types of data be collected in the model system? Including experts from each omics discipline and biostatisticians familiar with such data sets before the design of every systems experiment is especially important to ensure that proper controls are included at each step, that the appropriate number of technical replicates [G] and biological replicates [G] are run, and that confounding factors in data collection are taken into account (Box 2)10,43,44. Each omics data type requires technique-specific controls and has an inherent amount of technical variance that needs to be measured and statistically accounted for, which might not be obvious to researchers approaching these technologies for the first time. It may even be necessary to perform a small-scale pilot experiment to determine the reproducibility and statistical power of the proposed pipeline from sample generation to data collection to determine these parameters and calculate assay power.
Box 2 |. Effective interdisciplinary collaborations.
Systems biology is inherently team science, requiring input and expertise from diverse backgrounds to build reliable and informative models. Recognition that a project requires collaboration across disciplines is only the first step. Finding domain experts who share excitement for the project, bringing together a team and just getting started can be incredibly challenging. To help navigate this complex landscape of potential pitfalls, we summarize a few of the many important principles of interdisciplinary collaboration. These guidelines should be considered a starting point in establishing fruitful collaborations when performing interdisciplinary science.
1). Partnership
It is important to remember that a collaboration should be a mutually beneficial relationship between partners. Collaborations should be built on trust, respect and, most importantly, a shared ownership and responsibility for the success of the project. Many systems projects require collaborations between technological, computational and experimental experts, and it is important that each partner contributes at each phase of the project (i.e., experimental design through data collection, analysis, modelling and publication), rather than viewing the collaboration as an assembly line. While the vision may be shared, each partner brings distinct benefits and skill sets to the team, and it should be clear to each person involved what the responsibilities and benefits of every member of the team are.
2). Organization
How a collaboration is organized can play a crucial role in determining the ultimate success of a project. The roles and responsibilities of each partner should be discussed and communicated upfront to establish expectations and accountability. Outlining plans for data sharing, resource management, grant applications and authorship at the beginning of a collaboration can avert several potential misunderstandings down the road. It is often helpful to designate a single partner as the leader of the team, responsible for upholding these agreements, ensuring effective communication between partners, and seeing that the project proceeds in a timely manner. Many collaborative platforms for scientific communication, project management and data sharing are now available online including Slack, Trello, Box, Dropbox, Confluence and Asana, and these tools should be explored as effective ways to organize and communicate.
3). Communication
Open and regular communication is critical to successful collaboration. The early establishment of recurring project meetings can go a long way towards building relationships, ensuring the timely dissemination of findings, and handling other situations as they arise. It is essential to foster an open and supportive culture in which every member of the team feels free to participate and ask questions. Each discipline has unique expertise, standards, publication expectations and vernacular that may be only poorly understood by people outside the field. Taking the time to translate hypotheses, prior knowledge, experiments, computer code and statistical calculations into a shared understanding between all members of the collaboration will go a long way to overcoming discipline-specific ‘language’ barriers.
Additional resources for establishing and maintaining successful collaborations are available in the literature and through local coursework.43,44,50
Besides required technique-specific controls, additional biological controls may be included to remove confounding effects [G] or infer causal relationships. Many thousands of interdependent molecular changes occur during the course of infection, representing pathogen-directed changes and host-directed responses to infection. While these changes may be accurately measured and modelled by comparing infected versus uninfected systems, the breadth of these changes and the lack of clear causal relationships may complicate downstream hypothesis generation and mechanistic interrogation. Targeted inclusion of other parameters or conditions can go a long way towards refining the model to specifically address the question at hand. This can include using specific host perturbations or pathogen mutants to narrow in on specific processes, monitoring the host response over several time points to provide temporal resolution, or treating the system with a chemical compound that will alter the dynamics of the infection in predictable ways.24,45–48 For example, researchers employed a systems approach to better understand how human cytomegalovirus (HCMV) alters host organelle structure, function and composition.49 Rather than rely on a single omics approach with or without infection, the team integrated a number of proteomic and imaging technologies over an infection time course to effectively capture changes with temporal and spatial resolution. These added data enabled the tracking of viral compartment assembly and egress and for the ready identification of specific host proteins that assist in these viral processes.49
The fourth, and often overlooked, step is to consider how the collected data sets will be validated and how the resultant hypotheses will be tested. All data requires validation using an orthogonal approach to ensure its accuracy. The validation of systems-level data is no different but is complicated by the size of the data set. How many observations will be validated, which ones and the validation method to be used should all be considered prior to data collection. Similarly, it is essential to consider how resulting hypotheses can be tested and if these experiments can be extended to relevant primary models of disease or appropriate patient samples. If the data cannot be validated or if the resultant hypotheses cannot be tested in relevant models with the resources available, the experimental design should be altered accordingly. Again, establishing collaborations with domain experts that have access to these resources in these early stages of experimental design may also reveal additional controls or considerations for inclusion in the main study (Box 2)43,44,50.
Together, careful experimental design takes into account the study goals, model system, approach, controls, validation methods and hypothesis testing before embarking on data collection. While design details are not often reported transparently, elegant designs are often reflected in the final publication. For example, researchers recently reported the development of a new attenuated influenza A virus vaccine that retains full immunogenicity.51 The authors hypothesized that systematic elimination of immune-modulating functions from influenza A virus stocks used for vaccination could improve the quality and quantity of the adaptive immune response. To identify immune-sensitive mutations, they opted for a functional genomics-based systems approach, using saturating mutagenesis [G] across each viral gene to generate a polyclonal virus library. To narrow in on specific residues of interest that affected influenza A virus immune sensitivity, but not viral fitness overall, they performed selection in the presence and absence of interferon. This allowed them to generate a model of the genetic landscape of viral fitness versus immune sensitivity.51 After validating a panel of interferon-sensitizing mutations in individually reconstituted clones, they assembled a hyper-immune-sensitive influenza A virus vaccine to test their hypothesis in a mouse and ferret model, characterizing the breadth and depth of the antibody response to primary and secondary challenges.51 The inclusion of proper biological controls during data collection, the targeted approach for systems data validation, and the attention to hypothesis-testing models downstream were all critical components to the success of the study and all required consideration during the experimental design.
Data collection
Almost any type of data can be considered systems data as long as it offers a quantitative and comprehensive view of the components within a given system. A majority of these data are collected using specialized omics techniques designed for high-confidence, high-throughput measurement of biological components (FIG. 3). Advances in next-generation sequencing (NGS) techniques21 have defined our understanding of the human genetics underlying disease, allowed us to address epidemiologic questions about global pathogen spread, opened new insights into host–pathogen co-evolution [G], and have driven new research into the role of the microbiome and virome in human health and disease (population genomics).45,46,52–57 Advances in flow cytometry, mass cytometry and high-content imaging have provided unprecedented looks into the dynamics of infection and systemic response at the level of cells and tissues (cellomics). The recent adaptations of NGS pipelines to the study of chromatin structure and epigenetic modification of DNA and RNA are now revealing entirely new ways in which the cell adapts to infection and inflammation (epigenomics).58–61 The recent advent of CRISPR–Cas9 gene editing together with pre-existing genome engineering tools has helped us to understand the role of specific human host factors and even specific single nucleotide variants on pathogen replication and the host response (functional genomics).51,54,62–73 The same technological developments that have enabled revolutions in genomics approaches have transformed our understanding of cellular transcriptional rewiring during infection, with recent advancements even allowing for single-cell resolution (transcriptomics).74–79 Continually evolving mass spectrometry approaches have underwritten a recent explosion in our understanding of how pathogens rewire host cell architecture through changing protein expression, protein–protein interactions, protein structures and post-translational modifications (proteomics).47–49,63,71,77,80–90 Recent technological and computational advances in small-molecule mass spectrometry have improved both the characterization of known and the discovery of novel metabolites and lipids, spring-boarding research into the relatively unknown contribution of these molecules to infection and the host response (metabolomics and lipidomics).77,91–94 Combinatorial applications of omics approaches on the side of both the host and the pathogen are being increasingly employed to make integrative discoveries of host–pathogen interactions.46,47,69,71,77,81,90 As just one example, a recent report combined two different functional genomics screens (transposon mutagenesis [G] on the pathogen side combined with a CRISPR-based screen on the host side) to identify ADP-heptose as a novel bacterial pathogen-associated molecular pattern (PAMP) recognized by α-kinase 1 as the corresponding cytosolic pattern-recognition receptor (PRR).69
Figure 3 |. Systems biology technologies for infectious disease research.
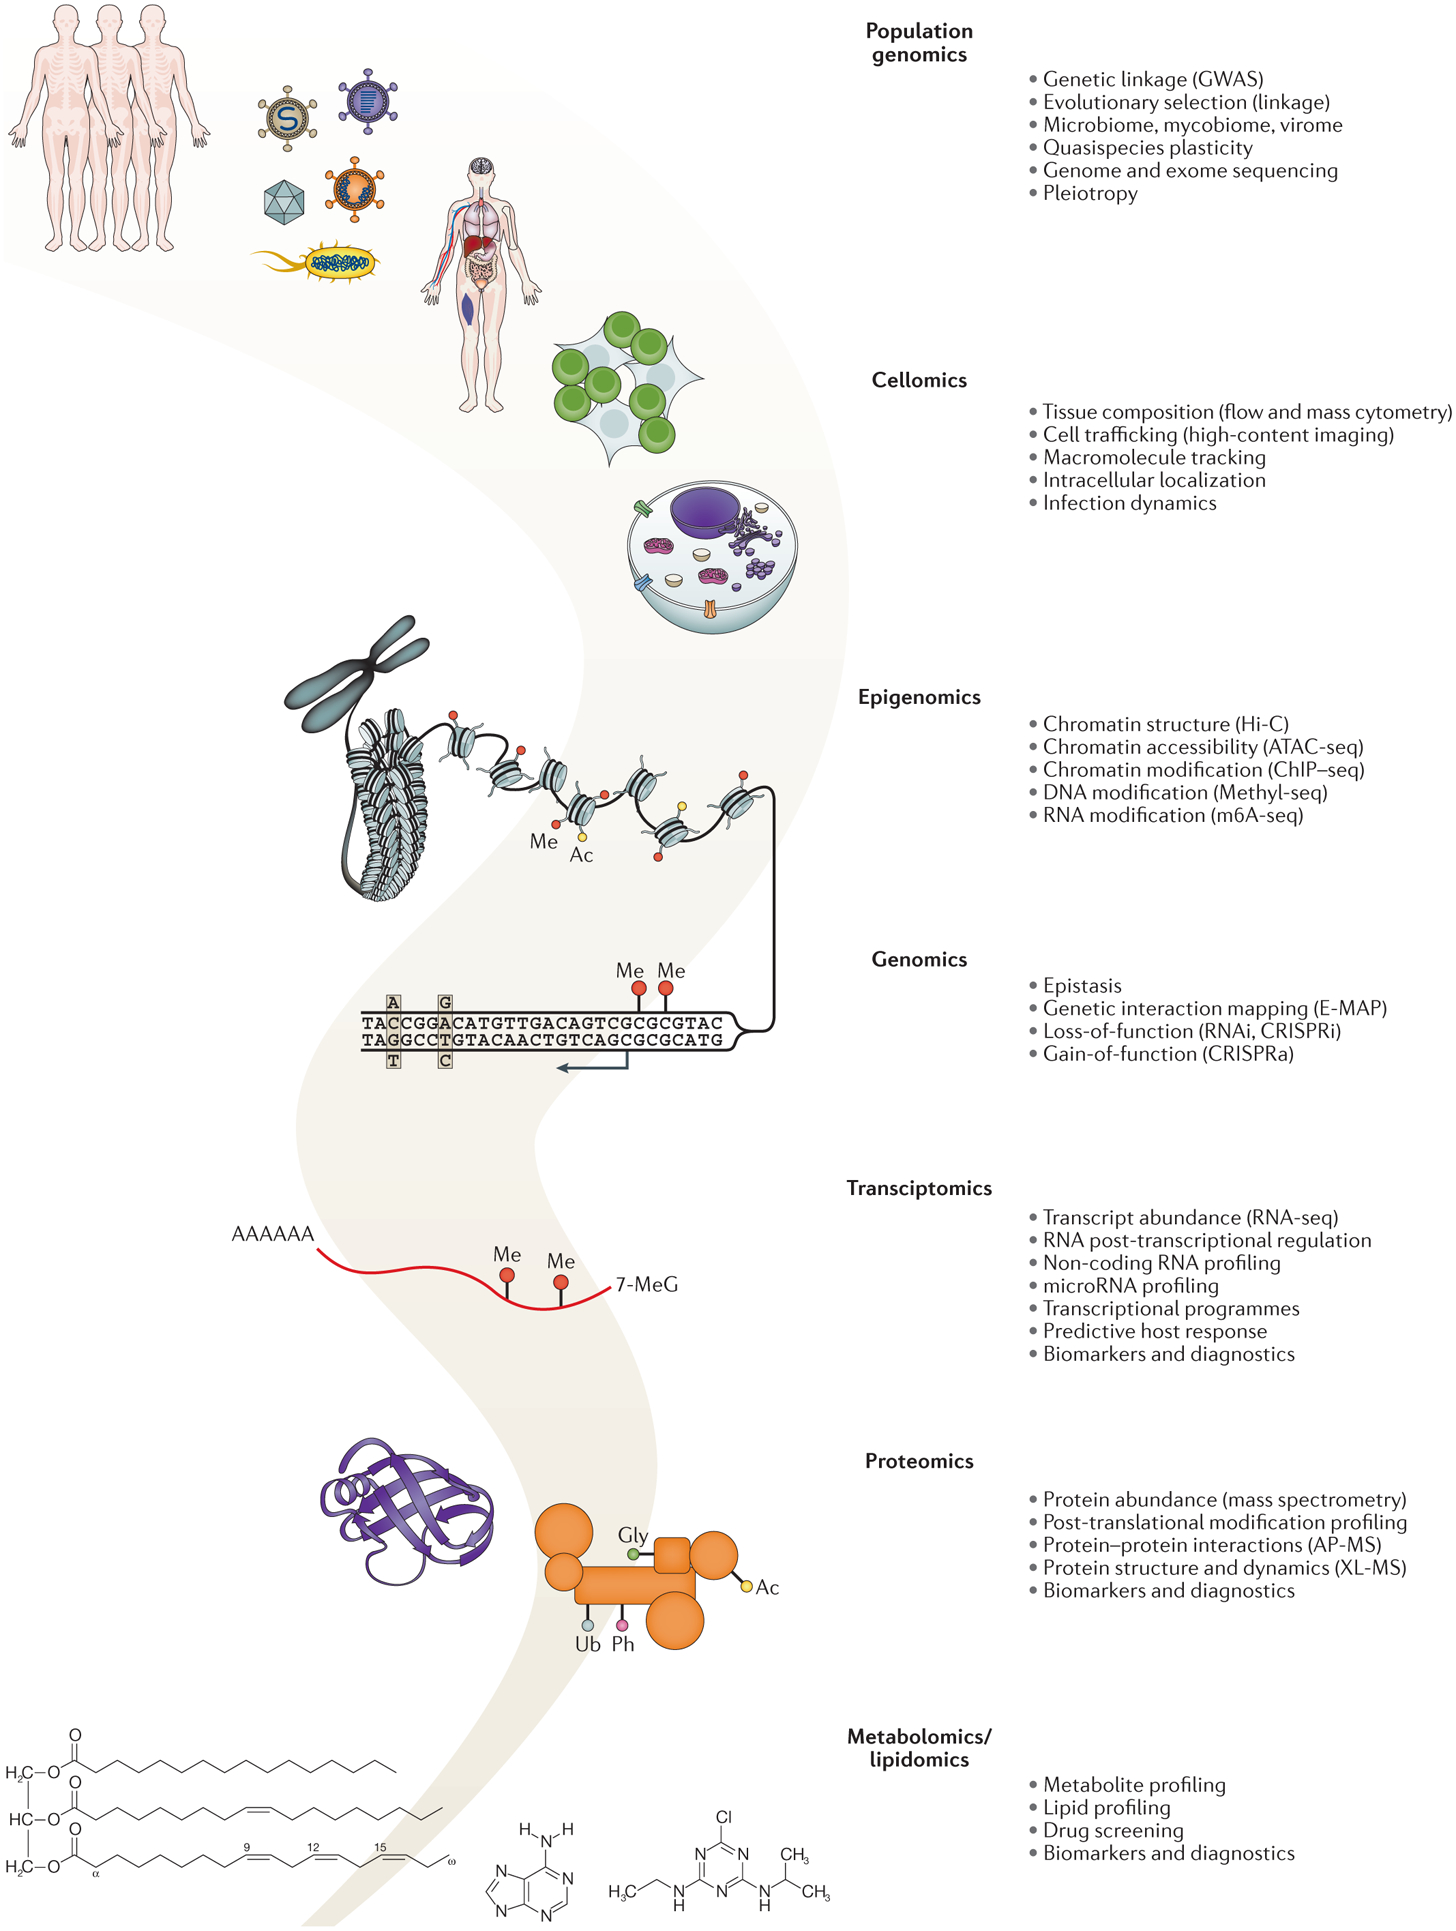
A summary of relevant omics technologies used in infectious disease research alongside the molecular signatures they are designed to capture.
New powerful technologies combined with innovative new applications are expanding the realm of omics approaches and strategies almost daily. At the same time, each of the technologies and their associated disciplines are evolving rapidly, with improvements in instrumentation driving changes in accepted standards for quality control, data analysis and data reporting (discussed in detail below). As each field matures, consensus regarding best practices is formed and subsequently enforced by peers, publishers and funding agencies. NGS approaches, for example, were among the first omics technologies to become widely available, and the associated fields tend to have rigorous standards for reporting quality control statistics, for deposition of raw data in publicly accessible databases, and for statistical analysis of the resultant data sets.95–98 The standards for collecting and reporting other omics data sets still vary widely by associated field, with a wide array of available analysis platforms and quality control parameters. A major ongoing challenge for these rapidly emerging technologies is to standardize data collection practices and establish benchmarks for quality control reporting and data analysis.99
Given the diversity in data collection and analysis practices, careful annotation of the associated metadata [G] is critical for the downstream interpretation of results from omics technologies (see below). While true across all systems biology studies, infectious disease research requires additional parameters be reported to ensure the data are accurately represented and reproducible, although how best to report these parameters is not always clear. For example, given the different kinetics of pathogenic infection in different model systems, should the percent infected cells be a required metadata statistic? When recording a time series, should the timing be based on time after initial inoculation, time until productive infection, time until peak infection, or should an alternate metric be used? What is the best way for recording pathogen titer: multiplicity of infection [G] (MOI), mass equivalents or optical density (OD), or should it be allowed to vary by pathogen? What should the standards be for reporting pathogen strain and authenticating each infection? Should metadata include cell culture conditions or link to appropriate biosafety and animal care protocols? As with the collection of primary data sets, standards for metadata collection are likely to mature over time and may ultimately differ depending on the technology, host and pathogen.
Data analysis and validation
After experimental design and data collection, the next big challenge lies in extracting and analysing the data, or, in other words, distilling them into interpretable parameters with associated statistical measurements to assign significance. As discussed, each technology has its own evolving and established standards for analysing resultant data sets. In fact, for many omics data sets, there may be several correct data analysis strategies, each of which makes unique assumptions and reveals slightly different solutions and interpretations. As such, it is imperative to work with discipline-specific experts and experienced biostatisticians to help evaluate these options (Box 2).44 A hallmark of good systems biology data analysis is the regimented benchmarking of each analysis platform against known positive controls or expected ‘gold standards’ to establish statistics for the detection of true positives versus true negatives.49,71,82,84 For example, in a recent study analysing the proteomic landscape of cell envelope complexes in Escherichia coli, the authors applied three different scoring algorithms for the analysis of their affinity purification mass spectrometry (AP-MS) data.88 Literature-curated interactions were then used to benchmark the true-positive rate as a function of the false-positive rate for each scoring algorithm, allowing them to confidently select and accurately interpret the most relevant platform.88
Once the data have been collected and analysed, they need to be validated. The term validation is used in many different contexts to describe means by which to establish confidence in a data set. In this context, we define validation to refer to the use of an orthogonal approach to confirm select findings from the primary data set under the same conditions. For example, quantitative PCR can be used to confirm RNA sequencing (RNA-seq) data; reciprocal immunoprecipitation, yeast two-hybrid, or fluorescence resonance energy transfer can be used to confirm AP-MS data; immunoblotting can be used to confirm phosphoproteomic data; and different readouts for infection can be used to confirm replication kinetics or pathogen fitness.51,84,88 Comparison with previously published data could serve as validation if the same parameters are being monitored under the same conditions. That being said, finding previous studies that match all experimental variables can be a substantial challenge. Related studies wherein one or more experimental variables are altered (for example, pathogen strain, cell type or measurement) may be valuable extensions to the original data set in demonstrating phenotypic breadth or functional conservation, and may prove useful to include in the overall model (see Representation), but they are not strict validation of the primary data set itself. For example, say an AP-MS experiment identifies 30 proteins that interact with a protein of interest. A separate study in a different cell type previously identified 25 proteins that interact with this same protein of interest, 5 of which are shared between studies. While these 5 shared interactors may indeed be of great interest, this overlap does not technically validate the breadth of data presented in either study. There is a tendency to conflate overlap between data sets as confidence or importance, whereas the differences between the two data sets may be equally as important and/or informative.64,81
The number of additional experiments required to validate a data set depends on the confidence associated with the original analysis. At its most rigorous, validation of systems data would involve the random selection of a percentage of readings to be verified by an orthogonal approach, with selected targets representing the entire spectrum of data, including lower confidence hits.51,88 However, due to a variety of factors including feasibility, time and cost, the majority of systems studies choose to validate only the most statistically significant or biologically interesting findings. While important, these observations are not always representative of the entire data set, and this practice can leave a large number of weaker, but statistically significant observations without meaningful validation. As with all studies, systems or otherwise, it is important to be aware of the type and extent of validation performed when interpreting the results.
Representation
Tidy data
After data collection, statistical analysis and validation of the primary data set, the next major step in all systems biology experiments is construction of the model. For our purposes, we will define a model as a representation of one or more systems, designed to aid in the visualization or exploration of complex phenomena. These models can be a simple representation of a single data set or involve the complex integration of diverse data sets with multiple different data types. While there are many types of models that can be built from systems data, including mathematical, structural, and hierarchical models, we will focus our discussion on network models as these are commonly employed in the description and analysis of omics data100–103. A network model is a type of database model wherein components of a system are represented as a series of nodes [G] and their relationship is depicted by a series of edges [G]. Network models can be dynamic or static in regard to a variety of variables, and can include weights, directionality and spatial clustering to convey additional information. The flexibility and relatively intuitive representation of network models — when constructed appropriately — make them a powerful tool for understanding systems-level data.100–103
The first step in building a network model is parsing or ‘tidying’ up the data sets to be represented (Fig. 4a). In data management, tidy data refers to data in a specific, tabulated structure that allows for it to be easily accessed, interpreted and modelled, such that: 1) each measured variable occupies one column (for example, abundance, fold change, P-value), 2) each observation of that variable occupies one row (for example, one row for each gene or cell monitored), 3) independently monitored variables occupy unique tables (for example, one table per experiment or experimental readout), and 4) each table has a column that allows tables to be linked (for example, a gene or protein identifier).104 While this sounds fairly simple, achieving a tidy data set can be surprisingly difficult, especially when combining multiple kinds of data into a single model.
Figure 4 |. Assembly and representation of a network model.
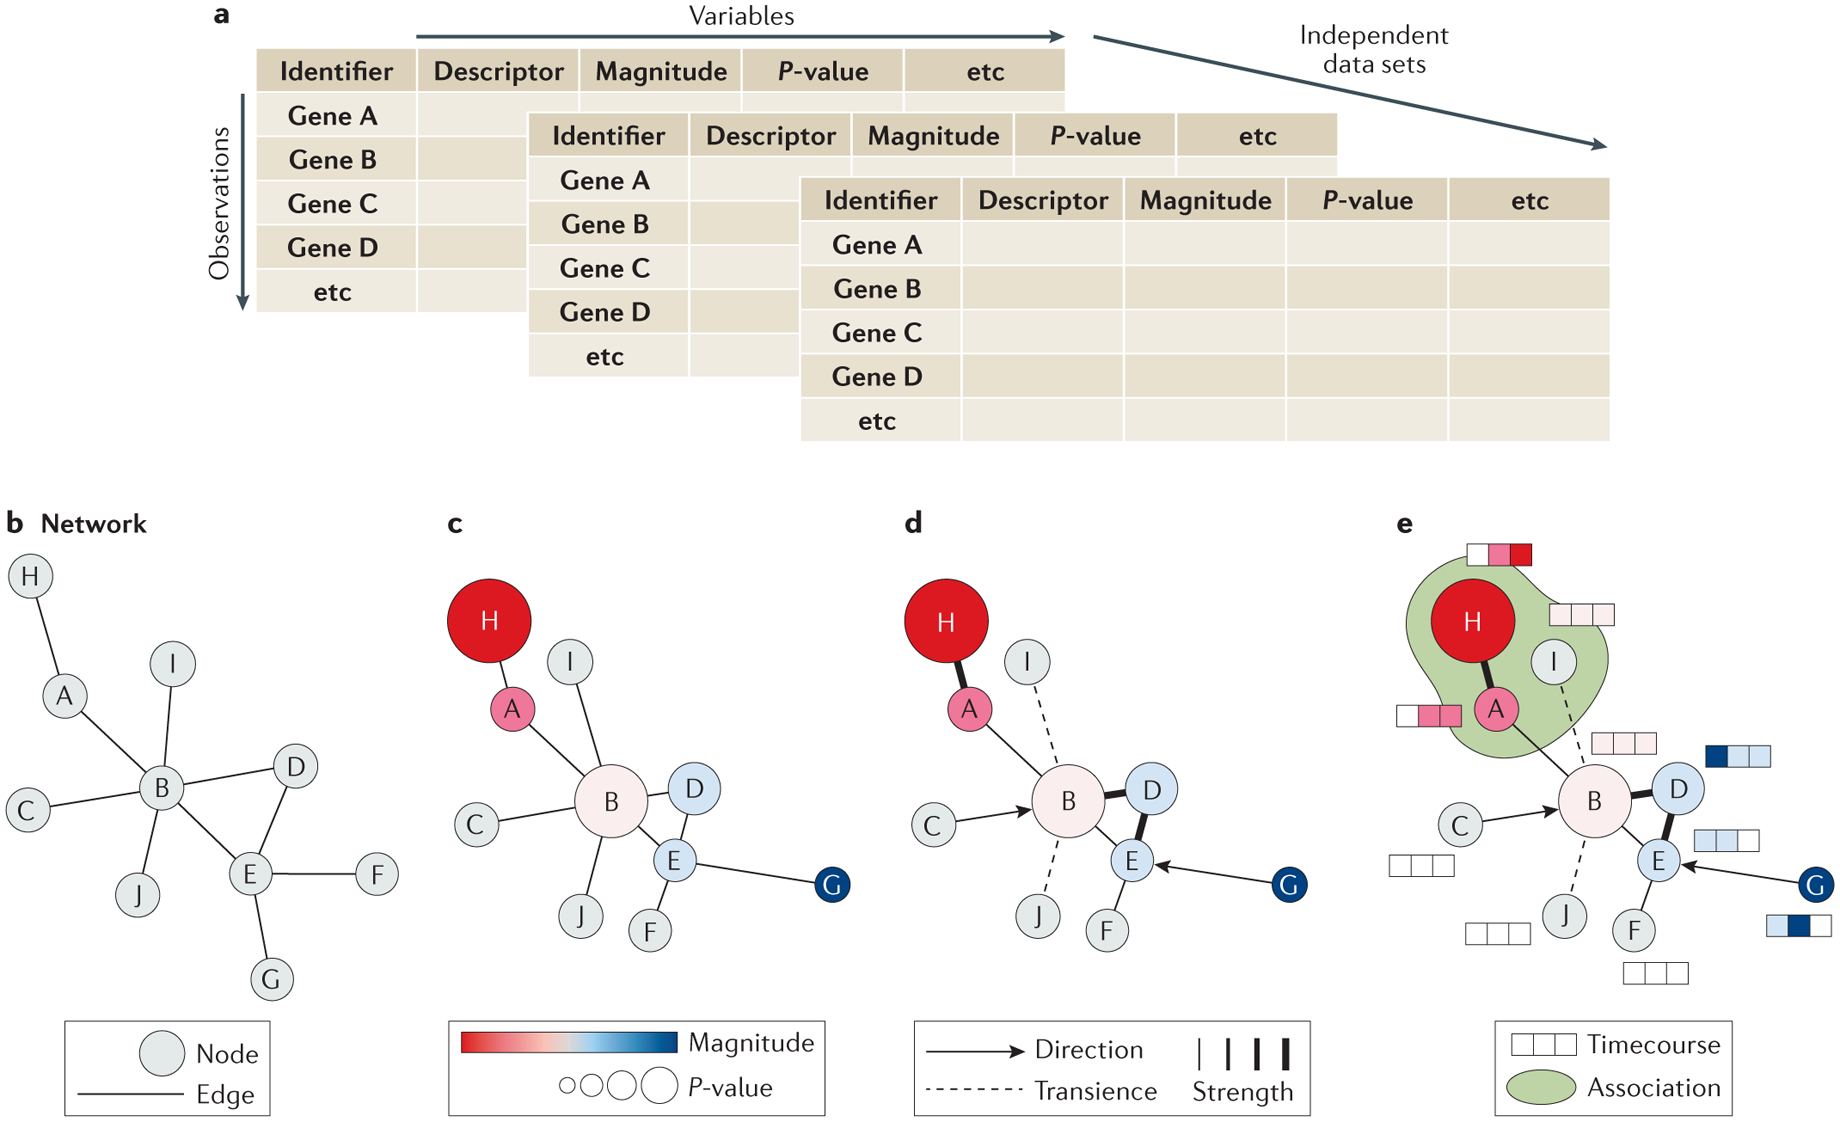
After the organization of the collected data into a tidy format (a), a simple network of nodes and edges can be assembled (b) with each node representing a component of the system and each edge representing their relationships. Varying the size, color, and organization of the nodes can be used to add dimension to the dataset by visualizing magnitude, p-value, or a common descriptor (c). Additional information can be depicted by varying edge characters such as width to indicate associative strength, gaps to indicate transience, or arrows to indicate directionality (d). Different types of data may benefit from different methods of depiction to complement the base network, including heatmaps to illustrate timecourse data or shading to illustrate pathway or complex membership (E).
The first challenge is to define the common identifier used to link all data sets in the model. Usually, this identifier describes each node in the model and may represent almost any physical component of the system. As a single gene may produce many transcripts and several protein isoforms, each of which may be modified by unique, site-specific post-translational modifications, condensing these diverse data types to a single identifier that is both interpretable and maximally informative is not always straightforward. In many cases, assignment of a common identifier can result in the compression of one or more aspects of the data set. In these instances, multiple independent models may need to be constructed, each of which is designed to highlight a unique aspect of the system and reveal new biological insight. For example, in a network model representing both changes in protein phosphorylation and RNA transcript abundance, mapping data to a common gene identifier will compress data on multiple phosphorylation sites and multiple RNA isoforms into a single term. Two models may be constructed in this case, mapping data to specific protein residues or transcript isoforms, to highlight the intricacies of each data type.
Once a common identifier is selected, all identifiers must be converted to that nomenclature, be it gene symbol, UniProt ID, transcript ID or peptide. Several tools exist online to convert between commonly used identifiers.44,105 While these tools are constantly improving, there are challenges to even this simple process: old data sets may include legacy identifiers that are no longer biologically meaningful; incorporation of data sets from different species requires homology-based conversion; and many pathogens and pathogenic strains have no formal identifiers at all. Many international committees and repositories are working to standardize the nomenclature used for pathogen macromolecules (such as the Influenza Research Database106, HIV Sequence database107, International Code of Nomenclature of Prokaryotes108 and others), but this effort remains an ongoing process in systems-level infectious disease research.
Once a common identifier is assigned, the data themselves must be converted into standard units to allow for easy comparison and representation during the process of model building. The standard units used may vary by model and data type as well as by the reporting standards and guidelines of pertinent data repositories (see also Data Dissemination and Reporting). For qualitative variables, including metadata annotations, binary variables (for example, yes or no), and descriptive observations, the language used should be standardized across the entire data set. For quantitative variables, standard units may or may not be possible depending on the data being modelled. If the same data type is being modelled, those data can be analysed using the same criteria and parameters relative to internal control standards to allow for direct, quantitative comparison (for example, by transforming to fold-change relative to the mean, calculating P-values or z-scores). However, due to differences in data collection and analysis pipelines, instrument sensitivity and assay reliability, different types of data may not be directly comparable in this manner. Additionally, null values can have very different meanings in different data sets, and a common nomenclature should be selected for depicting a true measurement of zero versus an unmeasured component. How to properly and effectively combine and analyse different omics data types is currently an area of intense study, and ultimately the answer depends on the type of data being analysed.109,110
Representation of the network model
Once the data are arrayed in defined tables with common identifiers and variables represented in standard units, the model can be built and visualized. When creating a network model specifically, each set of tabulated data forms its own layer of the network that can be visualized independently or as part of the larger whole. Each node will represent a common identifier and the edges between the nodes will represent their relationship (Fig. 4b). The qualitative or quantitative characteristics of each node and edge may be spatially or stylistically represented with colour, weight or arrowheads (Fig. 4c–e). Many different tools exist for both model building and visualization, including Cytoscape111, Graphlet112 and NetworkX113, as well as a wide array of data-type-specific visualization programs.
The process of model building and visualization is necessarily iterative and collaborative, occurring before, after and concurrently with network analysis (see also Network Analysis below). It is important to remember that the model is designed for the expressed purpose of visualizing and exploring data. This representation should therefore be readily understandable, interpretable and intuitive. In many circumstances, multiple types of representation, including networks, but also tables, heatmaps and graphs, are required to effectively visualize different aspects of the model. Multiple independent models may also be needed, each of which serves to highlight the power and purpose of each collected data set. Regardless, a good model should make exploration of the data set(s) easier and help the viewer to draw biological meaning (exemplified in54,81,82, among others). Not all models will need to be displayed in a final publication but instead might serve a temporary role along the iterative process of data representation and interpretation. How these models are shared, published and accessed throughout the scientific process is an ongoing challenge in systems biology and a current priority area for data science research (see also Data Dissemination and Reporting).
Network analysis
Network models are designed to condense and represent complex data sets in simple ways, but a full understanding of the model often requires additional analysis of the network itself. These analyses often reveal new insights that suggest refinement of the model itself and so contribute to the iterative nature of model building and representation. Many different methods for network analysis have been developed, but they can generally be grouped into two major types: supervised and unsupervised. Supervised methods rely on prior information to define overarching groups within the data to determine if known biological pathways, functions or complexes are represented or enriched in the network. Unsupervised methods, by contrast, cluster data based on their inherent structure, irrespective of classification or potential biological meaning.114,115
Supervised methods, such as pathway or functional enrichment analysis [G], are frequently used to reveal biological insights in large data sets or to guide functional follow-up studies. These methods are based on comparison of the provided gene list to previously annotated, curated lists of genes. A range of online tools are available to aide with this type of analysis, such as Metascape,82,116 STRING,117 DAVID,118 Gene Set Enrichment Analysis (GSEA),119,120 KEGG121 and the Gene Ontology (GO).122–124 The goal of these tools, generally, is to determine if the genes or proteins identified in the network or subnetwork are enriched for any particular function, belong to any particular biological pathway, exist in any particular cellular complex, or share other commonalities. This type of analysis can thus be especially helpful to assign function to understudied pathogen proteins,70,83,86 or more generally to prioritize parts of the model as focal points during hypothesis-testing.68,88,91 While valuable, an important caveat to these methods is that they are only as reliable as the databases that they reference, many of which may be out of date or lack meaningful enrichment parameters. Additionally, as pathogens often work to rewire the molecular architecture of their hosts, the same annotations may not apply in a healthy versus diseased state, and so must be interpreted carefully.
Unsupervised approaches, such as k-means clustering [G] or principal component analysis [G], by contrast, do not rely on predefined groupings to assign enrichment scores but rather look to identify clusters based on their similarities in the primary data set itself.115 For example, if two genes have similar gene expression dynamics in an experiment, they might be placed into the same cluster. The number of clusters can then be determined empirically or fit statistically. Data clustering approaches have been particularly powerful with NGS data for the identification of transcriptional programmes, unique host responses and pathogen clades.78,79 While these types of analyses have helped to define characteristics of complex data sets and phenomena,47,49,59,70,88 it can often be difficult to interpret such clusters in biologically meaningful ways, since correlation does not always imply similar function. Complementing these approaches with supervised analyses or other analysis methods better able to accommodate multi-dimensional data, such as machine learning technologies including support vector machines [G] (SVM), neural networks [G] or random forests [G] , can offer additional ways to extract insight from the overall structure of the data set.49,68 For example, researchers looking to mine existing genomics and drug response data of Mycobacterium tuberculosis infection combined a series of network analysis strategies to uncover novel pathways involved in antimicrobial resistance (AMR).125 While simple clustering algorithms lacked the resolution to uncover genetic signatures, adding mutual information [G] (MI) calculations to enable pairwise comparisons enabled the identification of genetic signatures. The team was then able to improve their model by using a tailored SVM approach to account for multi-dimensional correlations, which ultimately allowed for the implication of 24 new pathways in AMR.125
Additional analysis methods are currently being developed to further bridge clustering and enrichment approaches. Network-based stratification approaches seek to use information on the structure of the network model to infer clusters of system components that show similar characteristics. These methods highlight similarities within parts of the network and allow stratification of samples based on their location in specific subnetworks. The potential of network-based stratification approaches has been demonstrated in cancer research, where this method has been employed to define novel tumour subtypes of specific cancers that are predictive of clinical outcomes.126 Similar approaches are now being explored in infectious disease research and will hopefully aid in the development of more targeted treatment approaches for chronic infections in the future.77 Another method is network propagation, which seeks to aggregate the signal of individual nodes across neighbouring nodes as defined by a pre-existing base network.127 This results in the identification of additional, biologically significant components that could not be deduced by gene-level analysis alone in the system under study.90 Integrative approaches similarly seek to expand the network, and do so by inclusion of additional data from orthogonal approaches. These can include many different data types and may span the spatial, temporal or pathogen axis.24,26 Studies integrating a variety of omics data can be especially powerful and have led to important discoveries in recent years.47,58,59,69,71,77,81,82,90 However, as mentioned above, data integration remains a major challenge, and integrative network models should be interpreted with full consideration of the strengths and weakness of the underlying methods and models.
Although essential for identifying key drivers and critical nodes for experimental perturbation, these approaches are not always easy to employ and interpret, and often require biostatistical or computational expertise to complete. Due to the iterative nature of the work, it is highly recommended to closely work with an experienced computational biologist or statistician to create and analyse networks. The model(s) will ultimately reflect the joint effort of both parties, making it essential to build strong collaborations during which both the experimentalist and computational expert are invested in communicating the goals of the work, the analyses performed and the biological meaning of the resultant networks (Box 2).10,43,44,50
Application
Hypothesis-testing
After iterative rounds of representation and analysis, the resulting model should provide an unbiased, global picture of the biological system being studied in the context of the specific biological question. The model can now be applied to generate and test hypotheses using the scientific method. Given the scope of the model being built, the number of components being surveyed, and the number of relationships being defined, determining which hypotheses to test is among the most difficult choices a systems biologist has to make. Careful experimental design, the inclusion of informative controls and the incorporation of complementary data sets into the final model can aid in filtering and prioritizing hypotheses, but even these steps will often lead to more hypotheses than can reasonably be tested. Above all, it is critical to understand the power and limitations of each method and each analysis performed to effectively design testable hypotheses and correctly interpret the results.
Keeping this in mind, a number of strategies can be applied to direct future scientific efforts. The first is to focus on areas of the model that are novel, important and well-supported by the acquired data. These could be central nodes in the network, new nodes that have never been investigated in this system or newly observed relationships between nodes. The raw data supporting these critical nodes should always be reviewed to ensure the hypothesis is based on high-confidence data. The confidence associated with each node may itself help inform which hypotheses to test depending on the nature of the experiment.64,83,89 Secondly, one should aim to prioritize experiments that are feasible, fundable and impactful. Do the critical priors that support the hypothesis hold up in relevant primary models of disease, and can the hypothesis be tested in those models? Does the hypothesis align with high-priority research areas of the major funding agencies in that field of study? Would testing the hypothesis advance the field significantly even if it is rejected? Does the research have any immediate clinical or translational applicability, or does the research reveal any novel drug targets (see also Towards Translation below)?
If these filters — or a combination of several of them — fail to significantly narrow down or prioritize hypotheses for testing, additional data may need to be included in the model or, if unavailable, additional experiments may need to be performed. A common approach used by many systems biologists at this stage is to apply a medium-throughput approach to add targeted data to a specific subset of nodes or edges. This often involves collecting data using one or more orthogonal approaches, model systems or pathogens to extend the model and build confidence in specific predictions. For example, genetic perturbation of nodes can supplement information regarding influence on pathogen replication,71,81 examination of related pathogens can determine conservation or divergence,64,67,81,87 and extending experiments to alternate host model systems, such as primary cells or more disease-relevant systems, can inform which parts of the model are most likely to be translationally relevant.65,92 These data can then be incorporated back into the model to prioritize hypotheses for immediate pursuit.
As one example, a number of these approaches were used to generate and test hypotheses resulting from functional genomics analyses of Flavivirus host factors.64 Using a pooled CRISPR–Cas9 gene knockout approach and a gene trap approach in tandem, the authors performed phenotypic selection [G] by virus infection to identify host factors that inhibit Dengue virus and Hepatitis C virus replication. Genes for functional follow-up were selected based on their phenotypic strength, reproducibility, conserved importance between cell line models, divergent impact on the two distinct viruses, and functional enrichment by supervised clustering. Based on these criteria, the investigators focused on mechanistic understanding of the role the oligosaccharyltransferase (OST) protein complex for Dengue virus replication and the flavin adenine dinucleotide (FAD) biogenesis pathway for Hepatitis C virus replication, identifying critical roles for these processes in the replication of these distinct Flaviviruses.64
While current publications are biased towards the reporting of ‘positive data’, reporting negative findings is just as important in establishing an accurate picture of the system under study and avoiding the investment of additional resources in redundant hypotheses. If a hypothesis generated from the model is not supported, it does not imply that the entirety of the model is wrong. By definition, every model will contain some discrepancies, and all models require iterative rounds of analysis and interpretation to be optimal. In such cases, it is important to evaluate the assumptions underlying the model and the hypothesis, re-examine the design of the experiment testing the hypothesis and understand the limitations involved. As discussed, these studies often require close, interdisciplinary collaboration (Box 2), and it is critical for experimental and computational biologists to understand the power and limitations of each other’s work in order to effectively design testable hypotheses and correctly interpret the results43,44,50.
Towards translation
The ultimate goal of many infectious disease studies is to provide knowledge that has translational potential, in other words, to not only better understand the fundamental biology of the process at hand but to find ways to prevent, diagnose, treat or even cure patients with a disease. As we discuss, systems biology approaches can be powerful in both the identification of potential therapeutic targets as well as in the characterization of lead compounds. Towards this end, it is particularly critical to revisit any assumptions made or reductionist approaches taken during experimental design to ensure the results are robust and hold true in the most physiologically relevant systems available. For example, if an immortalized human cell line or a particular lab strain of a pathogen was used for data collection, it is essential to verify that the principal components of the model hold true in more relevant systems, such as in primary human cell types or with clinical isolates of pathogen strains.39–42,54 Oftentimes, extension of these data to relevant whole animal models that can be used for translational studies is a critical next step.
While small-peptide mimetics, gene delivery mechanisms and cell-based therapies are all becoming more commonplace disease treatment strategies, a majority of therapeutic strategies are small-molecule interventions. Extensive databases of ‘druggable targets’ compiled from previously published studies can be cross-referenced or integrated during network analysis to identify attractive nodes or pathways for further investigation.81,92 These lists typically include proteins that are already known targets of small molecules, proteins with enzymatic activity or cell surface proteins that can be easily accessed.128–132 If no druggable target is directly contained within the primary model, pathway analyses and/or network extension can be valuable tools for identifying critical nodes for potential intervention.
In addition to extending key findings to more clinically relevant systems and linking them to druggable targets, a complementary route of translational investigation involves the development of high-throughput minimalist systems for screening against small-molecule libraries. Several drug and small-molecule libraries compatible with high-throughput in vitro and cell-based assays are available for use to identify lead compounds for chemical interventions (for example, ReFRAME133 and LOPAC134). If enough well-validated drugs are included in the library, these data can even be integrated into the final model as a complementary systems-based approach. Development of in vitro systems can be additionally beneficial in facilitating structural studies of key complexes, which can aid in rational drug design approaches down the line.69,89
Systems approaches are useful for the identification of not only promising drugs but also novel drug targets after small-molecule screening. For example, a recent study applied a systems biology-based chemical screen to repurpose drugs for the treatment of multidrug-resistant M. tuberculosis (MDR-Mtb).68 To identify the host protein targets of the most potent compounds, the authors mined drug–gene databases and performed functional enrichment analyses of identified targets to determine the class of targeted proteins, namely receptor tyrosine kinases (RTKs). A complementary small-scale directed small interfering RNA (siRNA) screen against the human kinome confirmed RTKs as a targeted group of proteins, raising the possibility of inhibiting this host pathway to treat MDR-Mtb in future investigations.68
Data dissemination and reporting
As with all science, the goal of systems biology research is to make discoveries and share knowledge. By providing an unbiased, comprehensive resource that is shared and formatted to be understood by scientists in a broad array of disciplines, the resulting model should provide an exponential return on investment and act as a basis for interdisciplinary research to improve clinical outcomes and better understand human health. Such models serve as hypothesis-generating engines with the potential to unveil new connections and emergent properties that were inaccessible by reductionist approaches. Critical to this vision, however, is the effective dissemination and reporting of systems data, particularly: 1) the transparent and inclusive dissemination of all raw and processed data; 2) the inclusion of detailed metadata describing how the data were acquired and analysed; and 3) the public accessibility of a clear and comprehensible model.
Despite the growing number of publishers and funding agencies that require the deposition of raw omics data sets for publication, lack of incentive, oversight and enforcement have led to consistently poor levels of compliance across many fields of biomedical research135–138. Thus, it is important for individual disciplines and systems biology researchers to set clear standards for data dissemination, enforce such policies in peer review, and foster a cultural environment in which data sharing is prioritized. To this end, a community of scientists has recently come together with a subset of publishers and funding agencies to agree on guidelines for dissemination and reporting, collectively referred to as the FAIR data principles (where FAIR stands for findable, accessible, interpretable and reusable).139 While an important first step, much more needs to be done to standardize and collate practices across disciplines. There are currently a wide variety of freely accessible online public data repositories that specialize in the dissemination of specific omics data sets, but each one has different reporting requirements for raw file formats, analyses and metadata.140 Equally critical, but often overlooked, is the dissemination of the actual outcome of the research in the form of publicly available, interactive and/or downloadable biological models for independent investigation, modification and continued research. Resources for this purpose are just becoming available, but, as with other online repositories, the format and standards for deposition remain highly variable.141–145 Box 3 addresses the current state of repositories for data, metadata and model sharing and discusses some of the challenges of systems-level data dissemination.
Box 3 |. The current state of public repositories for omics data and biological models.
While continually evolving, this discussion summarizes the current state of available public repositories for sharing data, metadata and models resulting from systems biology research, as well as the challenges associated with their dissemination.
Finding discipline-specific, community-recognized repositories for systems data sets can be challenging, especially for non-domain experts and researchers breaking into the field. For an organized, short list of relevant omics-related repositories, we recommend the standards and repositories listed through the Nature Research Group journal, Scientific Data. Another good starting point is the online portal FAIRsharing (https://fairsharing.org/).99,139 This public resource provides easily navigable, expert-curated information about the data and metadata standards and policies of journals, societies, funders, and organizations. Importantly, this resource provides a searchable list of databases and data repositories that are categorized by type and domain, offering direct links to each site. This resource also includes information about available repositories for metadata, such as the National Center for Biotechnology Information (NCBI) BioSample repository144 and the European Molecular Biology Laboratory’s European Bioinformatics Institute (EMBL-EBI) BioSamples repository.145 That being said, a recent review of these two major metadata repositories showed significant variability in the metadata deposited and called for an improvement in enforcement of standardization for these repositories to reach their full potential in sharing FAIR data.140
While the establishment of stable, long-term public repositories has made data sharing easier and may allow domain experts to reproduce the data analysis, the information available is still often insufficient to replicate the biological model as published. This is due in part to the data’s complexity and the iterative nature of generating the resultant models. However, the problem is also in part due to a lack of standards and policies for reporting models. Often, static images are the only representations provided or reported while interactive models may be more informative. Model dissemination is additionally complicated by the fact that raw data files and their resultant models must often be uploaded to unique repositories that lack cross-talk. While some efforts to resolve these problems are being explored (for example, the NCBI BioProject database144), standardizing the reporting of large-scale data sets and their models remains a major challenge.
As models become more important to the field of systems biology, additional reporting standards will need to be implemented. As with the dissemination of primary data, including the exact parameters used to construct and analyse the model is critical for other researchers to independently reproduce the final representation. Some repositories, such as the EMBL-EBI’s BioModels Database141,142, have aimed to include and develop universal standards for all types of computational models. For now, these tend to be non-interactive and solely act as downloadable databases for storing and sharing models. While useful, this requires a fair amount of expertise from researchers hoping to interact with and utilize the model. Other public repositories are more focused, follow a stricter format, and/or allow users to interact with a more visual, user-friendly model. The Network Data Exchange (NDEx)143, for example, serves as a specialized repository for biological network models and includes specific tools to aid researchers in accessing, storing, sharing, and manipulating network models.
As repositories for data, metadata and models continue to develop, improved formats in storage, access, and exploration of systems data should facilitate a more comprehensive understanding of the biological processes underlying health and disease.
Even when biological models are publicly shared and the raw and analysed data are clearly linked and accessible, it is unclear what fraction of biological researchers have the expertise or resources available to access and use them. Vast improvements are required in the teaching of computational methods in biological sciences at every level from trainee to principal investigator for systems approaches to reach their full potential in understanding infectious diseases. While not every researcher will have the expertise to personally build and work with models of high-throughput data sets, it is important that they understand the strengths and weaknesses of such approaches, and that they are made aware of the availability of these data sets to inform their own studies. As science moves towards interdisciplinary collaboration, and systems biology becomes more prevalent, it is furthermore imperative that research institutions invest in the recruitment of faculty and staff that can facilitate these approaches and help their communities access these powerful tools.
Conclusions
Systems biology approaches enable the comprehensive, unbiased modelling of systems to aid in the understanding and hypothesis-based interrogation of complex biological phenomena. Infectious disease research stands to benefit immensely from the application of these approaches to understand the relationship between pathogen and host, as well as between disease and treatment outcome. In this Review, we have outlined a general framework for a systems biology approach to infectious disease, highlighting good practices and major challenges yet to be overcome. Still a fairly new discipline, systems biology has substantial room for improvement and growth, but also immense potential to uncover unforeseen intricacies in biological systems that will lead the way in the design of next-generation therapeutics and personalized medicine.
Our ability to understand biology as systems rather than as collections of isolated players has been driven by continual advancements in technology, computation and modelling. While these advances have yielded unprecedented opportunities to understanding human health and disease, their specialized nature mandates close interdisciplinary collaboration from the earliest stages of experimental design through data analysis, model building, and application. This need for collaboration and integration of experimental and computational expertise has challenged and continues to challenge traditional paradigms of our scientific institutions, which are often structured for the promotion of individual competition rather than team science. Such incentives can lead to the formation of intellectual silos, reflected in the current gaps that exist between technology development and application as well as between scientific discovery and translation. To bridge these gaps and to allow systems biology to reach its full potential, it is essential that we revisit long-standing practices and incentives in authorship, peer review and grantsmanship to facilitate team science. We must furthermore continue to make funding opportunities available for interdisciplinary collaboration, especially between experimental and computational specialties. Finally, we must diversify training in experimental and computational methods to empower the next generation of biological researchers to best utilize these tools to tackle our most pressing unanswered questions. These challenges are not unlike those faced by the physical sciences in the past century, whose lessons and models might provide guidance to biomedical research in the post-genomic era.
Health is a fundamental human right. As the human population continues to expand and our relationship with the environment and with each other continues to evolve, the challenge of meeting this ethical responsibility will continue to grow. Continued innovation in biomedical research and in how we perform biomedical research is essential to meet this challenge, requiring not only a willingness to change, but a drive to continually assess, challenge and revise the status quo. Systems biology reflects a new paradigm to understanding health and disease, one with as much potential for success as room for failure. As these approaches become more commonplace, it is essential we recognize their limitations, revise best practices, and embrace big ideas for the betterment of human health.
Acknowledgements
J.F.H. is supported by amfAR grant 109504-61-RKRL with funds raised by generationCURE, the Gilead Sciences Research Scholars Program in HIV, NIH grant K22 AI136691, a supplement from the NIH-supported Third Coast CFAR P30 AI117943, and a supplement from the NIH-sponsored HARC Center P50 GM082250. R.H. is supported by the Department of Defense Advanced Research Projects Agency HR0011-19-2-0020. N.J.K. is supported by the NIH-sponsored HARC Center P50 GM082250, the NIH-sponsored Host-Pathogen Mapping Initiative (HPMI) U19 AI135990, the NIH-sponsored FluOMICs consortium U19 AI135972, and NIH grant P01 AI063302.
GLOSSARY TERMS
- Saturating mutagenesis
A genetic screening technique wherein a codon or set of codons is randomized to produce all possible amino acids at a position or positions.
- Metadata
Information that describes a set of data.
- Multiplicity of infection
The ratio of infectious agents (such as virions or bacteria) to infection targets (such as cells).
- Nodes
A point of a connection in a network representing a component of the system.
- Edges
A connection between nodes in a network representing a relationship between two components.
- k-means clustering
A method of data clustering that aims to partition a set of components into a total of ‘k’ clusters wherein each component belongs to the cluster with the nearest mean value.
- Principal component analysis
A statistical procedure often used in the development of predictive models, which describes a dataset as a series of uncorrelated variables called principal components that account for sources of variability.
- Support vector machines
A machine learning method related to regression analysis that seeks to identify the separation boundary between clusters of data given predefined clusters in a prelabeled set of input data.
- Neural networks
A machine learning method that seeks to cluster and classify data based on similarities and differences extracted from a prelabeled set of input data.
- Random forests
A machine learning algorithm that seeks to cluster and classify data based on the ensemble output of a series of decisions trees formulated from a prelabeled set of input data.
- Primary model systems
Types of host models that rely on cells taken directly from living tissue (such as from biopsy material or blood) for growth and maintenance ex vivo.
- Laboratory-adapted strain
A genetically distinct strain of a pathogen that has been selected for enhanced fitness ex vivo and for use in laboratory experiments even though it is not found as a major strain in the natural world.
- Technical replicates
Repeat experiments analysing the same sample with the same instrumentation to measure the variability inherent in the testing protocol.
- Biological replicates
Repeat experiments analysing different samples that represent the same thing (such as samples collected from different patients with the same disease outcome) to determine the variability in the sample pools.
- Confounding effects
The influence of one or more unmonitored variables on a system’s components or the relationships between those components that can alter experimental interpretation.
- Clinical isolates
Genetic strains of pathogens isolated directly from patients or clinical samples.
- Host–pathogen co-evolution
Iterative rounds of adaptation and counter-adaptation between a pathogen and its host over evolutionary history as a result of the ability of pathogens to elicit selective pressure on their host populations and vice versa.
- Enrichment analysis
An approach for identifying overrepresented classifications of components by comparing the frequency of a given annotation in a dataset to a pre-defined reference list.
- Mutual information
A measurement of dependency between two variables that is used in machine learning to determine how much can be assumed about one component based on the observed behavior of another.
- Phenotypic selection
Isolation of a given cell population based on an observed trait or characteristic (such as fluorescence or resistance to a toxic compound).
- Transposon mutagenesis
A method for the random disruption of gene function by the untargeted insertion of transposable retroelements into a genome.
Footnotes
Competing interests
The authors declare no competing interests.
Related links
Scientific Data recommended data repositories https://www.nature.com/sdata/policies/repositories
REFERENCES
- 1.(WHO, W. H. O.) Global Health Estimates 2016: Disease burden by Cause, Age, Sex, by Country and by Region, 2000–2016. (2018).
- 2.Aderem A et al. A systems biology approach to infectious disease research: innovating the pathogen-host research paradigm. MBio 2, e00325–00310, doi: 10.1128/mBio.00325-10 (2011). [DOI] [PMC free article] [PubMed] [Google Scholar]
- 3.Hillmer RA Systems biology for biologists. PLoS Pathog 11, e1004786, doi: 10.1371/journal.ppat.1004786 (2015). [DOI] [PMC free article] [PubMed] [Google Scholar]; An approachable introduction to systems biology for experimentalists.
- 4.Kitano H Systems biology: a brief overview. Science 295, 1662–1664, doi: 10.1126/science.1069492 (2002). [DOI] [PubMed] [Google Scholar]; A foundational introduction to the principles of systems biology.
- 5.Ideker T, Galitski T & Hood L A new approach to decoding life: systems biology. Annu Rev Genomics Hum Genet 2, 343–372, doi: 10.1146/annurev.genom.2.1.343 (2001). [DOI] [PubMed] [Google Scholar]
- 6.Casadevall A & Pirofski LA Host-pathogen interactions: redefining the basic concepts of virulence and pathogenicity. Infect Immun 67, 3703–3713 (1999). [DOI] [PMC free article] [PubMed] [Google Scholar]
- 7.Fischbach MA & Krogan NJ The next frontier of systems biology: higher-order and interspecies interactions. Genome Biol 11, 208, doi: 10.1186/gb-2010-11-5-208 (2010). [DOI] [PMC free article] [PubMed] [Google Scholar]
- 8.listed], N. a. Pathogenesis: Of host and pathogen. Nature Immunology 7, doi: 10.1038/ni0306-217 (2006). [DOI] [PubMed] [Google Scholar]
- 9.Westerhoff HV & Palsson BO The evolution of molecular biology into systems biology. Nat Biotechnol 22, 1249–1252, doi: 10.1038/nbt1020 (2004). [DOI] [PubMed] [Google Scholar]
- 10.Hasin Y, Seldin M & Lusis A Multi-omics approaches to disease. Genome Biol 18, 83, doi: 10.1186/s13059-017-1215-1 (2017). [DOI] [PMC free article] [PubMed] [Google Scholar]
- 11.Vidova V & Spacil Z A review on mass spectrometry-based quantitative proteomics: Targeted and data independent acquisition. Anal Chim Acta 964, 7–23, doi: 10.1016/j.aca.2017.01.059 (2017). [DOI] [PubMed] [Google Scholar]
- 12.Aebersold R & Mann M Mass-spectrometric exploration of proteome structure and function. Nature 537, 347–355, doi: 10.1038/nature19949 (2016). [DOI] [PubMed] [Google Scholar]
- 13.Bensimon A, Heck AJ & Aebersold R Mass spectrometry-based proteomics and network biology. Annu Rev Biochem 81, 379–405, doi: 10.1146/annurev-biochem-072909-100424 (2012). [DOI] [PubMed] [Google Scholar]
- 14.Klemm SL, Shipony Z & Greenleaf WJ Chromatin accessibility and the regulatory epigenome. Nat Rev Genet 20, 207–220, doi: 10.1038/s41576-018-0089-8 (2019). [DOI] [PubMed] [Google Scholar]
- 15.Rinschen MM, Ivanisevic J, Giera M & Siuzdak G Identification of bioactive metabolites using activity metabolomics. Nat Rev Mol Cell Biol 20, 353–367, doi: 10.1038/s41580-019-0108-4 (2019). [DOI] [PMC free article] [PubMed] [Google Scholar]
- 16.Doench JG Am I ready for CRISPR? A user’s guide to genetic screens. Nat Rev Genet 19, 67–80, doi: 10.1038/nrg.2017.97 (2018). [DOI] [PubMed] [Google Scholar]
- 17.Johnson CH, Ivanisevic J & Siuzdak G Metabolomics: beyond biomarkers and towards mechanisms. Nat Rev Mol Cell Biol 17, 451–459, doi: 10.1038/nrm.2016.25 (2016). [DOI] [PMC free article] [PubMed] [Google Scholar]
- 18.Needham EJ, Parker BL, Burykin T, James DE & Humphrey SJ Illuminating the dark phosphoproteome. Sci Signal 12, doi: 10.1126/scisignal.aau8645 (2019). [DOI] [PubMed] [Google Scholar]
- 19.Saliba AE, Vonkova I & Gavin AC The systematic analysis of protein-lipid interactions comes of age. Nat Rev Mol Cell Biol 16, 753–761, doi: 10.1038/nrm4080 (2015). [DOI] [PubMed] [Google Scholar]
- 20.Wang D & Bodovitz S Single cell analysis: the new frontier in ‘omics’. Trends Biotechnol 28, 281–290, doi: 10.1016/j.tibtech.2010.03.002 (2010). [DOI] [PMC free article] [PubMed] [Google Scholar]
- 21.Goodwin S, McPherson JD & McCombie WR Coming of age: ten years of next-generation sequencing technologies. Nat Rev Genet 17, 333–351, doi: 10.1038/nrg.2016.49 (2016). [DOI] [PMC free article] [PubMed] [Google Scholar]
- 22.Ideker T & Krogan NJ Differential network biology. Mol Syst Biol 8, 565, doi: 10.1038/msb.2011.99 (2012). [DOI] [PMC free article] [PubMed] [Google Scholar]
- 23.Greco TM & Cristea IM Proteomics Tracing the Footsteps of Infectious Disease. Mol Cell Proteomics 16, S5–S14, doi: 10.1074/mcp.O116.066001 (2017). [DOI] [PMC free article] [PubMed] [Google Scholar]
- 24.Jean Beltran PM, Federspiel JD, Sheng X & Cristea IM Proteomics and integrative omic approaches for understanding host-pathogen interactions and infectious diseases. Mol Syst Biol 13, 922, doi: 10.15252/msb.20167062 (2017). [DOI] [PMC free article] [PubMed] [Google Scholar]
- 25.Oxford KL et al. The landscape of viral proteomics and its potential to impact human health. Expert Rev Proteomics 13, 579–591, doi: 10.1080/14789450.2016.1184091 (2016). [DOI] [PubMed] [Google Scholar]
- 26.Shah PS, Wojcechowskyj JA, Eckhardt M & Krogan NJ Comparative mapping of host-pathogen protein-protein interactions. Curr Opin Microbiol 27, 62–68, doi: 10.1016/j.mib.2015.07.008 (2015). [DOI] [PMC free article] [PubMed] [Google Scholar]
- 27.Puschnik AS, Majzoub K, Ooi YS & Carette JE A CRISPR toolbox to study virus-host interactions. Nat Rev Microbiol 15, 351–364, doi: 10.1038/nrmicro.2017.29 (2017). [DOI] [PMC free article] [PubMed] [Google Scholar]
- 28.Grubaugh ND et al. Tracking virus outbreaks in the twenty-first century. Nat Microbiol 4, 10–19, doi: 10.1038/s41564-018-0296-2 (2019). [DOI] [PMC free article] [PubMed] [Google Scholar]
- 29.Houldcroft CJ, Beale MA & Breuer J Clinical and biological insights from viral genome sequencing. Nat Rev Microbiol 15, 183–192, doi: 10.1038/nrmicro.2016.182 (2017). [DOI] [PMC free article] [PubMed] [Google Scholar]
- 30.Newsom SN & McCall LI Metabolomics: Eavesdropping on silent conversations between hosts and their unwelcome guests. PLoS Pathog 14, e1006926, doi: 10.1371/journal.ppat.1006926 (2018). [DOI] [PMC free article] [PubMed] [Google Scholar]
- 31.Bernstein BE et al. The NIH Roadmap Epigenomics Mapping Consortium. Nat Biotechnol 28, 1045–1048, doi: 10.1038/nbt1010-1045 (2010). [DOI] [PMC free article] [PubMed] [Google Scholar]
- 32.Legrain P et al. The human proteome project: Current state and future direction. Mol Cell Proteomics, doi: 10.1074/mcp.O111.009993 (2011). [DOI] [PubMed] [Google Scholar]
- 33.Lander ES Initial impact of the sequencing of the human genome. Nature 470, 187–197, doi: 10.1038/nature09792 (2011). [DOI] [PubMed] [Google Scholar]
- 34.Mortazavi A, Williams BA, McCue K, Schaeffer L & Wold B Mapping and quantifying mammalian transcriptomes by RNA-Seq. Nat Methods 5, 621–628, doi: 10.1038/nmeth.1226 (2008). [DOI] [PubMed] [Google Scholar]; A pioneering work demonstrating the use of RNA-seq to quantify changes in the mammalian transcriptome.
- 35.Berns K et al. A large-scale RNAi screen in human cells identifies new components of the p53 pathway. Nature 428, 431–437, doi: 10.1038/nature02371 (2004). [DOI] [PubMed] [Google Scholar]
- 36.Paddison PJ et al. A resource for large-scale RNA-interference-based screens in mammals. Nature 428, 427–431, doi: 10.1038/nature02370 (2004). [DOI] [PubMed] [Google Scholar]
- 37.Wang T, Wei JJ, Sabatini DM & Lander ES Genetic screens in human cells using the CRISPR-Cas9 system. Science 343, 80–84, doi: 10.1126/science.1246981 (2014). [DOI] [PMC free article] [PubMed] [Google Scholar]
- 38.Shalem O et al. Genome-scale CRISPR-Cas9 knockout screening in human cells. Science 343, 84–87, doi: 10.1126/science.1247005 (2014). [DOI] [PMC free article] [PubMed] [Google Scholar]
- 39.Pan C, Kumar C, Bohl S, Klingmueller U & Mann M Comparative proteomic phenotyping of cell lines and primary cells to assess preservation of cell type-specific functions. Mol Cell Proteomics 8, 443–450, doi: 10.1074/mcp.M800258-MCP200 (2009). [DOI] [PMC free article] [PubMed] [Google Scholar]
- 40.Sandberg R & Ernberg I The molecular portrait of in vitro growth by meta-analysis of gene-expression profiles. Genome Biol 6, R65, doi: 10.1186/gb-2005-6-8-r65 (2005). [DOI] [PMC free article] [PubMed] [Google Scholar]
- 41.Ross DT et al. Systematic variation in gene expression patterns in human cancer cell lines. Nat Genet 24, 227–235, doi: 10.1038/73432 (2000). [DOI] [PubMed] [Google Scholar]
- 42.Fux CA, Shirtliff M, Stoodley P & Costerton JW Can laboratory reference strains mirror “real-world” pathogenesis? Trends Microbiol 13, 58–63, doi: 10.1016/j.tim.2004.11.001 (2005). [DOI] [PubMed] [Google Scholar]
- 43.Jenkins J What is the key best practice for collaborating with a computational biologist? Cell systems 3, 7–11 (2016). [DOI] [PubMed] [Google Scholar]
- 44.Lapatas V, Stefanidakis M, Jimenez RC, Via A & Schneider MV Data integration in biological research: an overview. J Biol Res (Thessalon) 22, 9, doi: 10.1186/s40709-015-0032-5 (2015). [DOI] [PMC free article] [PubMed] [Google Scholar]
- 45.Elde NC et al. Poxviruses deploy genomic accordions to adapt rapidly against host antiviral defenses. Cell 150, 831–841, doi: 10.1016/j.cell.2012.05.049 (2012). [DOI] [PMC free article] [PubMed] [Google Scholar]
- 46.Rauch BJ et al. Inhibition of CRISPR-Cas9 with Bacteriophage Proteins. Cell 168, 150–158 e110, doi: 10.1016/j.cell.2016.12.009 (2017). [DOI] [PMC free article] [PubMed] [Google Scholar]
- 47.Weekes MP et al. Quantitative temporal viromics: an approach to investigate host-pathogen interaction. Cell 157, 1460–1472, doi: 10.1016/j.cell.2014.04.028 (2014). [DOI] [PMC free article] [PubMed] [Google Scholar]
- 48.Huttenhain R et al. ARIH2 Is a Vif-Dependent Regulator of CUL5-Mediated APOBEC3G Degradation in HIV Infection. Cell Host Microbe 26, 86–99 e87, doi: 10.1016/j.chom.2019.05.008 (2019). [DOI] [PMC free article] [PubMed] [Google Scholar]
- 49.Jean Beltran PM, Mathias RA & Cristea IM A Portrait of the Human Organelle Proteome In Space and Time during Cytomegalovirus Infection. Cell Syst 3, 361–373 e366, doi: 10.1016/j.cels.2016.08.012 (2016). [DOI] [PMC free article] [PubMed] [Google Scholar]
- 50.Holgate SA How to Collaborate. (2012). <https://www.sciencemag.org/careers/2012/07/how-collaborate>.
- 51.Du Y et al. Genome-wide identification of interferon-sensitive mutations enables influenza vaccine design. Science 359, 290–296, doi: 10.1126/science.aan8806 (2018). [DOI] [PubMed] [Google Scholar]; A systems analysis of interferon sensitivity in influenza A viruses enabled the design of new vaccine approaches, with proof-of-principle in animal models.
- 52.Elde NC, Child SJ, Geballe AP & Malik HS Protein kinase R reveals an evolutionary model for defeating viral mimicry. Nature 457, 485–489, doi: 10.1038/nature07529 (2009). [DOI] [PMC free article] [PubMed] [Google Scholar]
- 53.Collins J et al. Dietary trehalose enhances virulence of epidemic Clostridium difficile. Nature 553, 291–294, doi: 10.1038/nature25178 (2018). [DOI] [PMC free article] [PubMed] [Google Scholar]
- 54.Carey AF et al. TnSeq of Mycobacterium tuberculosis clinical isolates reveals strain-specific antibiotic liabilities. PLoS Pathog 14, e1006939, doi: 10.1371/journal.ppat.1006939 (2018). [DOI] [PMC free article] [PubMed] [Google Scholar]
- 55.Integrative HMPRNC The Integrative Human Microbiome Project. Nature 569, 641–648, doi: 10.1038/s41586-019-1238-8 (2019). [DOI] [PMC free article] [PubMed] [Google Scholar]
- 56.Liu R et al. Homozygous defect in HIV-1 coreceptor accounts for resistance of some multiply-exposed individuals to HIV-1 infection. Cell 86, 367–377, doi: 10.1016/s0092-8674(00)80110-5 (1996). [DOI] [PubMed] [Google Scholar]; An early example of population genomics in infectious disease; this is the first report of the Δ32 mutation in human CCR5 conferring natural resistance to HIV-1 infection.
- 57.Bryant JM et al. Whole-genome sequencing to identify transmission of Mycobacterium abscessus between patients with cystic fibrosis: a retrospective cohort study. Lancet 381, 1551–1560, doi: 10.1016/S0140-6736(13)60632-7 (2013). [DOI] [PMC free article] [PubMed] [Google Scholar]
- 58.Bengsch B et al. Epigenomic-Guided Mass Cytometry Profiling Reveals Disease-Specific Features of Exhausted CD8 T Cells. Immunity 48, 1029–1045 e1025, doi: 10.1016/j.immuni.2018.04.026 (2018). [DOI] [PMC free article] [PubMed] [Google Scholar]
- 59.Hamdane N et al. HCV-Induced Epigenetic Changes Associated With Liver Cancer Risk Persist After Sustained Virologic Response. Gastroenterology 156, 2313–2329 e2317, doi: 10.1053/j.gastro.2019.02.038 (2019). [DOI] [PMC free article] [PubMed] [Google Scholar]
- 60.Kennedy EM et al. Posttranscriptional m(6)A Editing of HIV-1 mRNAs Enhances Viral Gene Expression. Cell Host Microbe 22, 830, doi: 10.1016/j.chom.2017.11.010 (2017). [DOI] [PMC free article] [PubMed] [Google Scholar]
- 61.Arvey A et al. An atlas of the Epstein-Barr virus transcriptome and epigenome reveals host-virus regulatory interactions. Cell Host Microbe 12, 233–245, doi: 10.1016/j.chom.2012.06.008 (2012). [DOI] [PMC free article] [PubMed] [Google Scholar]
- 62.Jeng EE et al. Systematic Identification of Host Cell Regulators of Legionella pneumophila Pathogenesis Using a Genome-wide CRISPR Screen. Cell Host Microbe 26, 551–563 e556, doi: 10.1016/j.chom.2019.08.017 (2019). [DOI] [PMC free article] [PubMed] [Google Scholar]
- 63.Pillay S et al. An essential receptor for adeno-associated virus infection. Nature 530, 108–112, doi: 10.1038/nature16465 (2016). [DOI] [PMC free article] [PubMed] [Google Scholar]
- 64.Marceau CD et al. Genetic dissection of Flaviviridae host factors through genome-scale CRISPR screens. Nature 535, 159–163, doi: 10.1038/nature18631 (2016). [DOI] [PMC free article] [PubMed] [Google Scholar]
- 65.Hultquist JF et al. A Cas9 Ribonucleoprotein Platform for Functional Genetic Studies of HIV-Host Interactions in Primary Human T Cells. Cell Rep 17, 1438–1452, doi: 10.1016/j.celrep.2016.09.080 (2016). [DOI] [PMC free article] [PubMed] [Google Scholar]
- 66.Park RJ et al. A genome-wide CRISPR screen identifies a restricted set of HIV host dependency factors. Nat Genet 49, 193–203, doi: 10.1038/ng.3741 (2017). [DOI] [PMC free article] [PubMed] [Google Scholar]
- 67.Hoffmann HH et al. Diverse Viruses Require the Calcium Transporter SPCA1 for Maturation and Spread. Cell Host Microbe 22, 460–470 e465, doi: 10.1016/j.chom.2017.09.002 (2017). [DOI] [PMC free article] [PubMed] [Google Scholar]
- 68.Korbee CJ et al. Combined chemical genetics and data-driven bioinformatics approach identifies receptor tyrosine kinase inhibitors as host-directed antimicrobials. Nat Commun 9, 358, doi: 10.1038/s41467-017-02777-6 (2018). [DOI] [PMC free article] [PubMed] [Google Scholar]
- 69.Zhou P et al. Alpha-kinase 1 is a cytosolic innate immune receptor for bacterial ADP-heptose. Nature 561, 122–126, doi: 10.1038/s41586-018-0433-3 (2018). [DOI] [PubMed] [Google Scholar]; A host- and pathogen-based systems approach allowed for the paired identification of a new bacterial PAMP and its receptor in human cells.
- 70.Patrick KL et al. Quantitative Yeast Genetic Interaction Profiling of Bacterial Effector Proteins Uncovers a Role for the Human Retromer in Salmonella Infection. Cell Syst 7, 323–338 e326, doi: 10.1016/j.cels.2018.06.010 (2018). [DOI] [PMC free article] [PubMed] [Google Scholar]
- 71.Ramage HR et al. A combined proteomics/genomics approach links hepatitis C virus infection with nonsense-mediated mRNA decay. Mol Cell 57, 329–340, doi: 10.1016/j.molcel.2014.12.028 (2015). [DOI] [PMC free article] [PubMed] [Google Scholar]
- 72.Hultquist JF et al. CRISPR-Cas9 genome engineering of primary CD4(+) T cells for the interrogation of HIV-host factor interactions. Nat Protoc 14, 1–27, doi: 10.1038/s41596-018-0069-7 (2019). [DOI] [PMC free article] [PubMed] [Google Scholar]
- 73.Brass AL et al. Identification of host proteins required for HIV infection through a functional genomic screen. Science 319, 921–926, doi: 10.1126/science.1152725 (2008). [DOI] [PubMed] [Google Scholar]; A pioneering, RNAi-based, functional genomics screen for the identification of host factors required for HIV-1 replication in human cells.
- 74.Michlmayr D et al. Comprehensive innate immune profiling of chikungunya virus infection in pediatric cases. Mol Syst Biol 14, e7862, doi: 10.15252/msb.20177862 (2018). [DOI] [PMC free article] [PubMed] [Google Scholar]
- 75.Thompson EG et al. Host blood RNA signatures predict the outcome of tuberculosis treatment. Tuberculosis (Edinb) 107, 48–58, doi: 10.1016/j.tube.2017.08.004 (2017). [DOI] [PMC free article] [PubMed] [Google Scholar]
- 76.Sychev ZE et al. Integrated systems biology analysis of KSHV latent infection reveals viral induction and reliance on peroxisome mediated lipid metabolism. PLoS Pathog 13, e1006256, doi: 10.1371/journal.ppat.1006256 (2017). [DOI] [PMC free article] [PubMed] [Google Scholar]
- 77.Lupberger J et al. Combined Analysis of Metabolomes, Proteomes, and Transcriptomes of Hepatitis C Virus-Infected Cells and Liver to Identify Pathways Associated With Disease Development. Gastroenterology 157, 537–551 e539, doi: 10.1053/j.gastro.2019.04.003 (2019). [DOI] [PMC free article] [PubMed] [Google Scholar]
- 78.Bradley T, Ferrari G, Haynes BF, Margolis DM & Browne EP Single-Cell Analysis of Quiescent HIV Infection Reveals Host Transcriptional Profiles that Regulate Proviral Latency. Cell Rep 25, 107–117 e103, doi: 10.1016/j.celrep.2018.09.020 (2018). [DOI] [PMC free article] [PubMed] [Google Scholar]
- 79.Russell AB, Trapnell C & Bloom JD Extreme heterogeneity of influenza virus infection in single cells. Elife 7, doi: 10.7554/eLife.32303 (2018). [DOI] [PMC free article] [PubMed] [Google Scholar]
- 80.Diep J et al. Enterovirus pathogenesis requires the host methyltransferase SETD3. Nat Microbiol, doi: 10.1038/s41564-019-0551-1 (2019). [DOI] [PMC free article] [PubMed] [Google Scholar]; A combined functional genomics and proteomics approach enabled the identification of a new enterovirus host factor, with validation in primary human cells and translationally focused extension into an animal model.
- 81.Shah PS et al. Comparative Flavivirus-Host Protein Interaction Mapping Reveals Mechanisms of Dengue and Zika Virus Pathogenesis. Cell 175, 1931–1945 e1918, doi: 10.1016/j.cell.2018.11.028 (2018). [DOI] [PMC free article] [PubMed] [Google Scholar]
- 82.Tripathi S et al. Meta- and Orthogonal Integration of Influenza “OMICs” Data Defines a Role for UBR4 in Virus Budding. Cell Host Microbe 18, 723–735, doi: 10.1016/j.chom.2015.11.002 (2015). [DOI] [PMC free article] [PubMed] [Google Scholar]
- 83.Mirrashidi KM et al. Global Mapping of the Inc-Human Interactome Reveals that Retromer Restricts Chlamydia Infection. Cell Host Microbe 18, 109–121, doi: 10.1016/j.chom.2015.06.004 (2015). [DOI] [PMC free article] [PubMed] [Google Scholar]
- 84.Jager S et al. Global landscape of HIV-human protein complexes. Nature 481, 365–370, doi: 10.1038/nature10719 (2011). [DOI] [PMC free article] [PubMed] [Google Scholar]
- 85.Penn BH et al. An Mtb-Human Protein-Protein Interaction Map Identifies a Switch between Host Antiviral and Antibacterial Responses. Mol Cell 71, 637–648 e635, doi: 10.1016/j.molcel.2018.07.010 (2018). [DOI] [PMC free article] [PubMed] [Google Scholar]
- 86.Davis ZH et al. Global mapping of herpesvirus-host protein complexes reveals a transcription strategy for late genes. Mol Cell 57, 349–360, doi: 10.1016/j.molcel.2014.11.026 (2015). [DOI] [PMC free article] [PubMed] [Google Scholar]
- 87.Kane JR et al. Lineage-Specific Viral Hijacking of Non-canonical E3 Ubiquitin Ligase Cofactors in the Evolution of Vif Anti-APOBEC3 Activity. Cell Rep 11, 1236–1250, doi: 10.1016/j.celrep.2015.04.038 (2015). [DOI] [PMC free article] [PubMed] [Google Scholar]
- 88.Babu M et al. Global landscape of cell envelope protein complexes in Escherichia coli. Nat Biotechnol 36, 103–112, doi: 10.1038/nbt.4024 (2018). [DOI] [PMC free article] [PubMed] [Google Scholar]
- 89.Batra J et al. Protein Interaction Mapping Identifies RBBP6 as a Negative Regulator of Ebola Virus Replication. Cell 175, 1917–1930 e1913, doi: 10.1016/j.cell.2018.08.044 (2018). [DOI] [PMC free article] [PubMed] [Google Scholar]
- 90.Eckhardt M et al. Multiple Routes to Oncogenesis Are Promoted by the Human Papillomavirus-Host Protein Network. Cancer Discov 8, 1474–1489, doi: 10.1158/2159-8290.CD-17-1018 (2018). [DOI] [PMC free article] [PubMed] [Google Scholar]
- 91.Zampieri M et al. High-throughput metabolomic analysis predicts mode of action of uncharacterized antimicrobial compounds. Sci Transl Med 10, doi: 10.1126/scitranslmed.aal3973 (2018). [DOI] [PMC free article] [PubMed] [Google Scholar]; A metabolomics approach to decipher the mechanism of action of small molecule antimicrobial compounds with translational potential.
- 92.Rother M et al. Combined Human Genome-wide RNAi and Metabolite Analyses Identify IMPDH as a Host-Directed Target against Chlamydia Infection. Cell Host Microbe 23, 661–671 e668, doi: 10.1016/j.chom.2018.04.002 (2018). [DOI] [PubMed] [Google Scholar]
- 93.Yuan S et al. SREBP-dependent lipidomic reprogramming as a broad-spectrum antiviral target. Nat Commun 10, 120, doi: 10.1038/s41467-018-08015-x (2019). [DOI] [PMC free article] [PubMed] [Google Scholar]
- 94.Fontaine KA, Sanchez EL, Camarda R & Lagunoff M Dengue virus induces and requires glycolysis for optimal replication. J Virol 89, 2358–2366, doi: 10.1128/JVI.02309-14 (2015). [DOI] [PMC free article] [PubMed] [Google Scholar]
- 95.Brazma A Minimum Information About a Microarray Experiment (MIAME)--successes, failures, challenges. ScientificWorldJournal 9, 420–423, doi: 10.1100/tsw.2009.57 (2009). [DOI] [PMC free article] [PubMed] [Google Scholar]
- 96.Barrett T et al. NCBI GEO: archive for functional genomics data sets--update. Nucleic Acids Res 41, D991–995, doi: 10.1093/nar/gks1193 (2013). [DOI] [PMC free article] [PubMed] [Google Scholar]
- 97.Bustin SA et al. The MIQE guidelines: minimum information for publication of quantitative real-time PCR experiments. Clin Chem 55, 611–622, doi: 10.1373/clinchem.2008.112797 (2009). [DOI] [PubMed] [Google Scholar]
- 98.Society TFGD Minimum information about a high-throughput nucleotide sequencing experiment (MINSEQE). The Dictionary of Genomics, Transcriptomics, and Proteomics 1, doi: 10.1002/9783527678679.dg07671 (2015). [DOI] [Google Scholar]
- 99.Sansone SA et al. FAIRsharing as a community approach to standards, repositories and policies. Nat Biotechnol 37, 358–367, doi: 10.1038/s41587-019-0080-8 (2019). [DOI] [PMC free article] [PubMed] [Google Scholar]; An updated call for Findable, Accessible, Interpretable and Reusable (FAIR) data sharing practices as a community approach to improving scientific research integrity.
- 100.Eisenberg D, Marcotte EM, Xenarios I & Yeates TO Protein function in the post-genomic era. Nature 405, 823–826, doi: 10.1038/35015694 (2000). [DOI] [PubMed] [Google Scholar]
- 101.Ma’ayan A, Blitzer RD & Iyengar R Toward predictive models of mammalian cells. Annu Rev Biophys Biomol Struct 34, 319–349, doi: 10.1146/annurev.biophys.34.040204.144415 (2005). [DOI] [PMC free article] [PubMed] [Google Scholar]
- 102.Gosak M et al. Network science of biological systems at different scales: A review. Phys Life Rev 24, 118–135, doi: 10.1016/j.plrev.2017.11.003 (2018). [DOI] [PubMed] [Google Scholar]
- 103.Ideker T & Nussinov R Network approaches and applications in biology. PLoS Comput Biol 13, e1005771, doi: 10.1371/journal.pcbi.1005771 (2017). [DOI] [PMC free article] [PubMed] [Google Scholar]
- 104.Wickham H Tidy Data. Journal of Statistical Software 59, doi: 10.18637/jss.v059.i10 (2014). [DOI] [PMC free article] [PubMed] [Google Scholar]; A fundamental treatise on the clear organization and management of data in modelling and statistics.
- 105.Chavan SS, Shaughnessy JD Jr. & Edmondson RD Overview of biological database mapping services for interoperation between different ‘omics’ datasets. Hum Genomics 5, 703–708 (2011). [DOI] [PMC free article] [PubMed] [Google Scholar]
- 106.Zhang Y et al. Influenza Research Database: An integrated bioinformatics resource for influenza virus research. Nucleic Acids Res 45, D466–D474, doi: 10.1093/nar/gkw857 (2017). [DOI] [PMC free article] [PubMed] [Google Scholar]
- 107.Robertson DL et al. HIV-1 nomenclature proposal. Science 288, 55–56, doi: 10.1126/science.288.5463.55d (2000). [DOI] [PubMed] [Google Scholar]
- 108.International Code of Nomenclature of Prokaryotes. Int J Syst Evol Microbiol 69, S1–S111, doi: 10.1099/ijsem.0.000778 (2019). [DOI] [PubMed] [Google Scholar]
- 109.Kim M & Tagkopoulos I Data integration and predictive modeling methods for multi-omics datasets. Mol Omics 14, 8–25, doi: 10.1039/c7mo00051k (2018). [DOI] [PubMed] [Google Scholar]
- 110.D’Argenio V The High-Throughput Analyses Era: Are We Ready for the Data Struggle? High Throughput 7, doi: 10.3390/ht7010008 (2018). [DOI] [PMC free article] [PubMed] [Google Scholar]
- 111.Shannon P et al. Cytoscape: a software environment for integrated models of biomolecular interaction networks. Genome Res 13, 2498–2504, doi: 10.1101/gr.1239303 (2003). [DOI] [PMC free article] [PubMed] [Google Scholar]
- 112.Sarajlic A, Malod-Dognin N, Yaveroglu ON & Przulj N Graphlet-based Characterization of Directed Networks. Sci Rep 6, 35098, doi: 10.1038/srep35098 (2016). [DOI] [PMC free article] [PubMed] [Google Scholar]
- 113.Hagberg A., Aric, Swart P., Pieter & Chult DS Exploring network structure, dynamics, and function using NetworkX. osti.gov (2008). [Google Scholar]
- 114.Huang S, Chaudhary K & Garmire LX More Is Better: Recent Progress in Multi-Omics Data Integration Methods. Front Genet 8, 84, doi: 10.3389/fgene.2017.00084 (2017). [DOI] [PMC free article] [PubMed] [Google Scholar]
- 115.Tarca AL, Carey VJ, Chen XW, Romero R & Draghici S Machine learning and its applications to biology. PLoS Comput Biol 3, e116, doi: 10.1371/journal.pcbi.0030116 (2007). [DOI] [PMC free article] [PubMed] [Google Scholar]
- 116.Zhou Y et al. Metascape provides a biologist-oriented resource for the analysis of systems-level datasets. Nat Commun 10, 1523, doi: 10.1038/s41467-019-09234-6 (2019). [DOI] [PMC free article] [PubMed] [Google Scholar]
- 117.Szklarczyk D et al. STRING v11: protein-protein association networks with increased coverage, supporting functional discovery in genome-wide experimental datasets. Nucleic Acids Res 47, D607–D613, doi: 10.1093/nar/gky1131 (2019). [DOI] [PMC free article] [PubMed] [Google Scholar]
- 118.Huang DW et al. The DAVID Gene Functional Classification Tool: a novel biological module-centric algorithm to functionally analyze large gene lists. Genome Biol 8, R183, doi: 10.1186/gb-2007-8-9-r183 (2007). [DOI] [PMC free article] [PubMed] [Google Scholar]
- 119.Mootha VK et al. PGC-1alpha-responsive genes involved in oxidative phosphorylation are coordinately downregulated in human diabetes. Nat Genet 34, 267–273, doi: 10.1038/ng1180 (2003). [DOI] [PubMed] [Google Scholar]
- 120.Subramanian A et al. Gene set enrichment analysis: a knowledge-based approach for interpreting genome-wide expression profiles. Proc Natl Acad Sci U S A 102, 15545–15550, doi: 10.1073/pnas.0506580102 (2005). [DOI] [PMC free article] [PubMed] [Google Scholar]; The first peer-reviewed report of enrichment analysis as a supervised approach for the interpretation of large biological data sets.
- 121.Kanehisa M & Goto S KEGG: kyoto encyclopedia of genes and genomes. Nucleic Acids Res 28, 27–30, doi: 10.1093/nar/28.1.27 (2000). [DOI] [PMC free article] [PubMed] [Google Scholar]
- 122.Ashburner M et al. Gene ontology: tool for the unification of biology. The Gene Ontology Consortium. Nat Genet 25, 25–29, doi: 10.1038/75556 (2000). [DOI] [PMC free article] [PubMed] [Google Scholar]; The first report of the widely used Gene Ontology (GO) classifications for human genes to enable standardized interpretation and supervised analysis of genetic data sets.
- 123.Foulger RE et al. Representing virus-host interactions and other multi-organism processes in the Gene Ontology. BMC Microbiol 15, 146, doi: 10.1186/s12866-015-0481-x (2015). [DOI] [PMC free article] [PubMed] [Google Scholar]
- 124.The Gene Ontology C The Gene Ontology Resource: 20 years and still GOing strong. Nucleic Acids Res 47, D330–D338, doi: 10.1093/nar/gky1055 (2019). [DOI] [PMC free article] [PubMed] [Google Scholar]
- 125.Kavvas ES et al. Machine learning and structural analysis of Mycobacterium tuberculosis pan-genome identifies genetic signatures of antibiotic resistance. Nat Commun 9, 4306, doi: 10.1038/s41467-018-06634-y (2018). [DOI] [PMC free article] [PubMed] [Google Scholar]
- 126.Hofree M, Shen JP, Carter H, Gross A & Ideker T Network-based stratification of tumor mutations. Nat Methods 10, 1108–1115, doi: 10.1038/nmeth.2651 (2013). [DOI] [PMC free article] [PubMed] [Google Scholar]
- 127.Leiserson MD et al. Pan-cancer network analysis identifies combinations of rare somatic mutations across pathways and protein complexes. Nat Genet 47, 106–114, doi: 10.1038/ng.3168 (2015). [DOI] [PMC free article] [PubMed] [Google Scholar]
- 128.Cotto KC et al. DGIdb 3.0: a redesign and expansion of the drug-gene interaction database. Nucleic Acids Res 46, D1068–D1073, doi: 10.1093/nar/gkx1143 (2018). [DOI] [PMC free article] [PubMed] [Google Scholar]
- 129.Li YH et al. Therapeutic target database update 2018: enriched resource for facilitating bench-to-clinic research of targeted therapeutics. Nucleic Acids Res 46, D1121–D1127, doi: 10.1093/nar/gkx1076 (2018). [DOI] [PMC free article] [PubMed] [Google Scholar]
- 130.Wishart DS et al. DrugBank 5.0: a major update to the DrugBank database for 2018. Nucleic Acids Res 46, D1074–D1082, doi: 10.1093/nar/gkx1037 (2018). [DOI] [PMC free article] [PubMed] [Google Scholar]
- 131.Whirl-Carrillo M et al. Pharmacogenomics knowledge for personalized medicine. Clin Pharmacol Ther 92, 414–417, doi: 10.1038/clpt.2012.96 (2012). [DOI] [PMC free article] [PubMed] [Google Scholar]
- 132.Gaulton A et al. The ChEMBL database in 2017. Nucleic Acids Res 45, D945–D954, doi: 10.1093/nar/gkw1074 (2017). [DOI] [PMC free article] [PubMed] [Google Scholar]
- 133.Janes J et al. The ReFRAME library as a comprehensive drug repurposing library and its application to the treatment of cryptosporidiosis. Proc Natl Acad Sci U S A 115, 10750–10755, doi: 10.1073/pnas.1810137115 (2018). [DOI] [PMC free article] [PubMed] [Google Scholar]
- 134.Miller CH, Nisa S, Dempsey S, Jack C & O’Toole R Modifying culture conditions in chemical library screening identifies alternative inhibitors of mycobacteria. Antimicrob Agents Chemother 53, 5279–5283, doi: 10.1128/AAC.00803-09 (2009). [DOI] [PMC free article] [PubMed] [Google Scholar]
- 135.Couture JL, Blake RE, McDonald G & Ward CL A funder-imposed data publication requirement seldom inspired data sharing. PLoS One 13, e0199789, doi: 10.1371/journal.pone.0199789 (2018). [DOI] [PMC free article] [PubMed] [Google Scholar]
- 136.Alsheikh-Ali AA, Qureshi W, Al-Mallah MH & Ioannidis JP Public availability of published research data in high-impact journals. PLoS One 6, e24357, doi: 10.1371/journal.pone.0024357 (2011). [DOI] [PMC free article] [PubMed] [Google Scholar]
- 137.Vines TH et al. The availability of research data declines rapidly with article age. Curr Biol 24, 94–97, doi: 10.1016/j.cub.2013.11.014 (2014). [DOI] [PubMed] [Google Scholar]
- 138.Savage CJ & Vickers AJ Empirical study of data sharing by authors publishing in PLoS journals. PLoS One 4, e7078, doi: 10.1371/journal.pone.0007078 (2009). [DOI] [PMC free article] [PubMed] [Google Scholar]
- 139.Wilkinson MD et al. The FAIR Guiding Principles for scientific data management and stewardship. Sci Data 3, 160018, doi: 10.1038/sdata.2016.18 (2016). [DOI] [PMC free article] [PubMed] [Google Scholar]
- 140.Goncalves RS & Musen MA The variable quality of metadata about biological samples used in biomedical experiments. Sci Data 6, 190021, doi: 10.1038/sdata.2019.21 (2019). [DOI] [PMC free article] [PubMed] [Google Scholar]
- 141.Chelliah V et al. BioModels: ten-year anniversary. Nucleic Acids Res 43, D542–548, doi: 10.1093/nar/gku1181 (2015). [DOI] [PMC free article] [PubMed] [Google Scholar]
- 142.Juty N et al. BioModels: Content, Features, Functionality, and Use. CPT Pharmacometrics Syst Pharmacol 4, e3, doi: 10.1002/psp4.3 (2015). [DOI] [PMC free article] [PubMed] [Google Scholar]
- 143.Pillich RT, Chen J, Rynkov V, Welker D & Pratt D NDEx: A Community Resource for Sharing and Publishing of Biological Networks. Methods Mol Biol 1558, 271–301, doi: 10.1007/978-1-4939-6783-4_13 (2017). [DOI] [PubMed] [Google Scholar]
- 144.Barrett T et al. BioProject and BioSample databases at NCBI: facilitating capture and organization of metadata. Nucleic Acids Res 40, D57–63, doi: 10.1093/nar/gkr1163 (2012). [DOI] [PMC free article] [PubMed] [Google Scholar]
- 145.Courtot M et al. BioSamples database: an updated sample metadata hub. Nucleic Acids Res 47, D1172–D1178, doi: 10.1093/nar/gky1061 (2019). [DOI] [PMC free article] [PubMed] [Google Scholar]