Abstract
Ciliary motion in the upper airway is the primary mechanism by which the body transports foreign particulates out of the respiratory system in order to maintain proper respiratory function. The ciliary beating frequency (CBF) is often disrupted with the onset of disease as well as other conditions, such as changes in temperature or in response to drug administration. Current imaging of ciliary motion relies on microscopy and high-speed cameras, which cannot be easily adapted to in-vivo imaging. M-mode optical coherence tomography (OCT) imaging is capable of visualization of ciliary activity, but the field of view is limited. We report on the development of a spectrally encoded interferometric microscopy (SEIM) system using a phase-resolved Doppler (PRD) algorithm to measure and map the ciliary beating frequency within an en face region. This novel high speed, high resolution system allows for visualization of both temporal and spatial ciliary motion patterns as well as propagation of metachronal wave. Rabbit tracheal CBF ranging from 9 to 13 Hz has been observed under different temperature conditions, and the effects of using lidocaine and albuterol have also been measured. This study is the stepping stone to in-vivo studies and the translation of imaging spatial CBF to clinics.
Keywords: ciliary beating frequency, ciliary beating pattern, en face Doppler imaging, spectrally encoded, microscopy, phase-resolved Doppler
Graphical Abstract
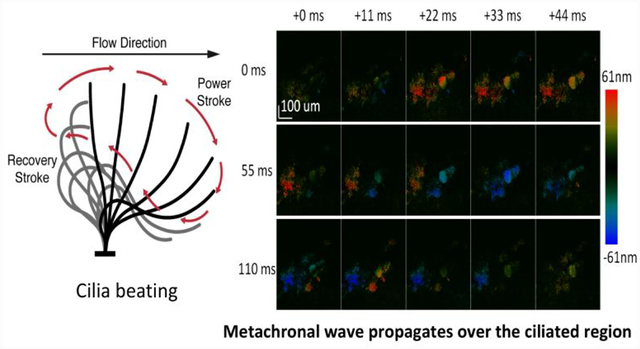
The human airway serves not only as a passage for oxygen intake but also as the first line of defense to protect the lungs from harmful foreign particulates. The main defense mechanism is the mechanical clearance of mucus through ciliary activity and regulation of airway surfaces1. Specifically, ciliary beat frequency and amplitude are considered the main factors that determine the maximal transportation speed of the mucus from the lower airway to the pharynx and, hence, affect the mucociliary clearance rate (MCR)2. In addition, it was reported that the ciliary beating synchronicity would also contribute to the MCR. Dysfunction of cilia, caused by ciliary defects such as primary ciliary dyskinesia (PCD), virus, toxins, or trauma, will usually result in ineffective mucociliary clearance and lead to lung damage3. Although the damage caused by ciliary defects such as PCD cannot be fully treated, previous studies indicate that it is possible to maintain sufficient lung function through appropriate respiratory care4. Therefore, it is important to monitor the spatial ciliary beat frequency (CBF) and the ciliary beat pattern (CBP) in human airways for disease diagnosis and management.
The traditional procedure to analyze airway ciliary activity involves three steps: sample preparation, recording, and CBF measurement. A biopsy using a cytology brush is usually performed to harvest the ciliated cells from human respiratory tracts for cell culture5,6. Many techniques, based on the photoelectric method7 and video cameras, were reported to be capable of evaluating ciliary activity. Due to the microscopic nature of ciliary structure and movement, a high resolution and high sensitivity imaging modality is essential to visualize the ciliary beating pattern and frequency. Optical microscopy is useful in resolving single cilia movements, but sufficient imaging speed is also required to obtain quantitative results of CBF and record the entire beating cycle. This leads to the utilization of a high speed digital camera microscopy system5,8. However, a conventional digital camera system cannot investigate ciliary functions in-vivo and thereby diminishes the effectiveness of the measurement in physiological settings.
In order to overcome these limitations and perform in-vivo studies, optical coherence tomography (OCT) was recently applied to ciliary motion imaging, taking advantage of its micron scale resolution, real time imaging capability, and potential for endoscopic imaging9. Given these powerful features, the study of ciliary functions moves from the dish plate to its natural environment and demonstrates the feasibility of using OCT to investigate ciliary activity in-vivo10–16. Specifically, a high-resolution OCT endoscope is inserted into either the respiratory or uterus cavity to perform continuous acquisition at one cross sectional site, so that the intensity fluctuations caused by ciliary activity can be visualized over time10–16. To further expand the effectiveness of using an OCT system in imaging ciliary activity, our group used a phase resolved Doppler OCT (PRD-OCT) technique to probe the beating direction and speed of cilia. PRD-OCT is well known for its capability of measuring microscopic particle movement with pico-meter sensitivity17–22 and is proven to be a powerful tool in visualizing accurate ciliary dynamics by providing not only its transient position but also the relative speed and direction of the ciliary beat23. Therefore, the beating phase of different cilia can be simultaneously monitored to study their synchronicity and beating patterns. In addition, the velocity imaging ability of PRD-OCT also benefits ciliary studies by enhancing the contrast of moving cilia versus other stationery tissue components and may possibly aid in locating the ciliated area within the entire cavity during in-vivo experiments. However, to visualize spatial-temporal cilia motion pattern using OCT requires a two-dimensional beam scan to encompass the ciliary motion that occurs in two directions over the ciliated surface24. Because the rate of the spatial scan must be at least two times greater than the CBF for effective measurements according to the Nyquist theory, there is a limitation on the number of scanning points, which limits the lateral field of view (FOV).
A spectrally encoded interferometer (SEI) is capable of lateral 2-D imaging with a single axis beam scan25–28 which allows for en face imaging at a speed comparable with OCT cross-sectional scans. Recent studies have demonstrated the integration of the PRD method and SEI technique and have achieved phase sensitive en face Doppler imaging using a continuous wave laser as the light source24,29,30. Therefore, SEI could be a potential solution to solve the unmet needs in the field of in-vivo ciliary imaging. We report on a swept source spectrally encoded interferometric microscopy (SS-SEIM) system to obtain the en face image of cilia beating frequency and pattern at high speed. We have optimized the traditional SEI design by using a swept source laser as the light source and incorporating a microscopy setup. Compared to the continuous laser, the swept source laser has been suggested to offer superior sensitivity, faster imaging speed, and less susceptibility to fringe washout phenomenon31–35. The microscopy setup allows for high resolution visualization of ciliary structures. With these optimizations, we are able to achieve 91 frames per second (fps) over an enface image area up to 1 mm2. The novel SS-SEIM system enables, to the best of our knowledge, the first study to map out spatial-temporal ciliary activity and opens up the possibility of investigating spatial ciliary beating frequency and pattern in-vivo.
Method
Spectrally Encoded Microscopy System Design
The SS-SEIM system was developed using a vertical-cavity surface-emitting laser (VCSEL) based on a swept source OCT system that has been explained in a previous publication23. The center wavelength of the system is 1.3 um, and the A-line rate is 100 kHz. The lateral resolution and displacement sensitivity are measured to be 1.2 um and 0.3 nm, respectively. The sample arm is replaced by a spectrally encoded microscopy setup, which allows for simultaneous sample illumination with a single mode fiber input. The light in the sample arm is first collimated and diffracted by the diffraction gratings, yielding a line pattern as the laser sweeps through its full bandwidth. The 1-D galvanometer mirror G1 scans the wavelength encoded line of light in its perpendicular direction to produce en face optical imaging. Two optical relays are employed to center the line of light onto the galvanometer mirror and the back focal point of the objective lens, hence ensuring a flat scanning plane on the sample surface. Afterwards, a focused line is illuminated on the sample through the objective where different wavelengths are focused on different locations of the sample based on their diffraction angles. The collected backscattered light interferes with the reference light to form an interferogram which is detected by a balance detector. The system is capable of real time en face displacement imaging at up to 100 fps with 1000 A-lines per image and 2048 pixels per A-line, providing a FOV of approximately 480 × 750 um. The system schematic is illustrated in figure 1.
Fig. 1.
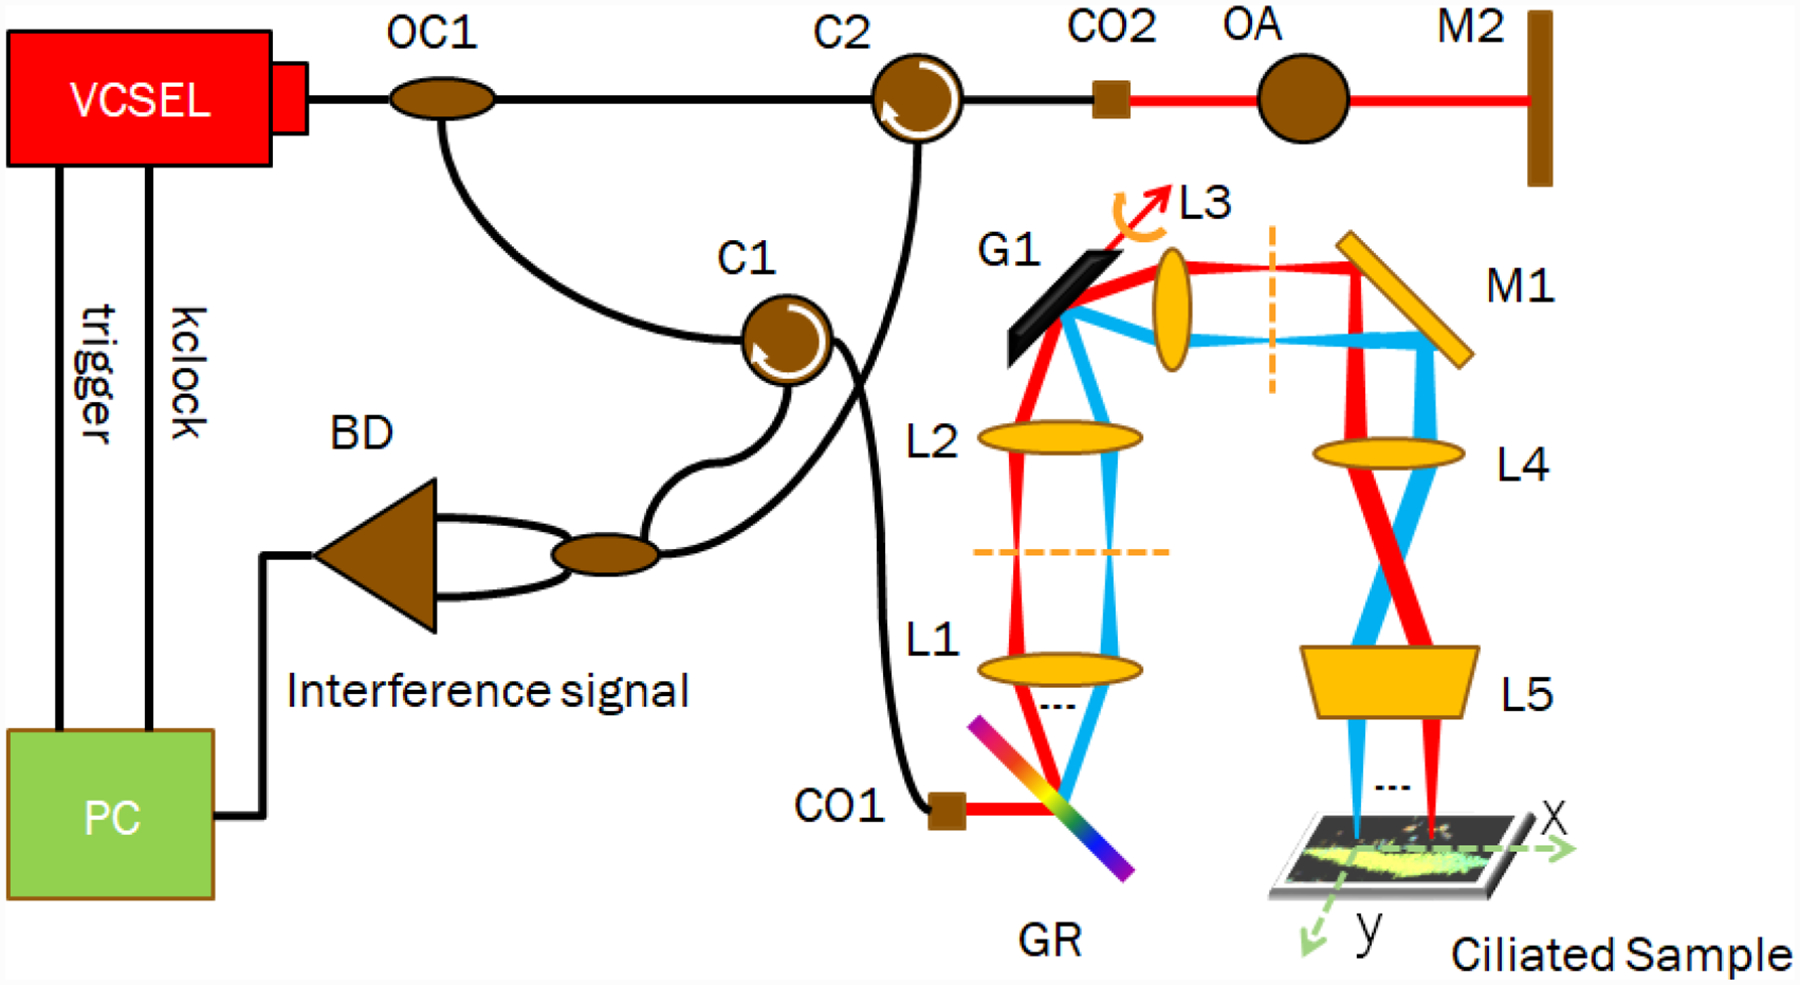
System setup for SS-SEIM system. OC: optical coupler; C: circulator; CO: collimator; OA: optical attenuator; M: mirror; BD: balanced detector; GR: diffraction grating; L: lens; G1: galvanometer; FP: focal plane. The beam is dispersed in x-direction based on wavelength and the galvanometer scans the beam along the y-direction.
Ex-vivo Tissue Preparation
Rabbit tracheal samples were harvested from freshly euthanized male New Zealand white rabbits under the approval of the Animal Care and Use Committee (IACUC) at UC Irvine. The tissues were immediately submerged in Hanks Balanced Salt Solution (HBSS) and kept at a room temperature of approximately 23 °C. Soft tissue was carefully dissected from the outer surface of the trachea to ensure an even surface for imaging. The tissue was cut along the long axis of the trachea to reveal the mucosal surface for imaging and then secured down with pins onto a silicone-lined petri dish. A layer of HBSS was added to the dish to mimic the natural tissue environment and minimize disruption of ciliary motion. Finally, the sample was moved to the imaging stage where it was placed on a temperature-controlled hot plate for temperature regulation during imaging. For lidocaine treatment, 2% lidocaine was added to the sample while submerged in HBSS, and imaging was performed after 5 minutes. For albuterol experiments, the sample was kept in 2 ml HBSS buffer with 0.3% albuterol, and imaging was performed approximately 1 minute after drug application.
Processing Algorithm
The principle behind ciliary motion induced Doppler OCT was explained in our previous publication23 where a PRD-OCT algorithm was employed for axial displacement estimation. According to PRD-OCT36–38, the particle displacement ΔZ can be measured by analyzing the temporal phase changes of its corresponding interference component. Under the context of SEIM imaging, the position of the particle is indexed by the wave number due to the laterally dispersed sample illumination, and thereby, the PRD-OCT equation for the SEIM system can be modified as below:
| (1) |
where k denotes the wave number of the illumination on the particle of interest, n denotes the reflective index of tissue, and Δt represents the sampling interval that was determined by the frame rate. For the purpose of investigating the temporal dynamics of ciliated tissue, the region of interest was oversampled at 91 fps. The instantaneous phase, φ(x,t), was derived from the Hilbert transformation on the spectral interference fringe. By performing the algorithm on consecutive en face images, spatial-temporal ciliary dynamics can be visualized. The spatial beating frequency of cilia was mapped out by extracting the beating frequency from the spatial-temporal data through a Fourier transformation over time. The flow chart of the processing algorithm is shown in figure 2. The PRD-based processing algorithm and SEM system control program are implemented in a custom C++ software and accelerated by a graphics processing unit (GPU) to provide en face displacement images in real-time.
Fig. 2.

Processing flow chart for obtaining spatial temporal ciliary activity and spatial CBF. The color bars below images b) and c) encode displacement and beating frequency of ciliary activity, respectively. a) Algorithm to achieve phase value at each imaging point. b) Axial displacement images spaced at same time intervals. c) 2-D CBF map.
Results
During imaging, the line scan was made to focus on the cilia layer on the top surface of the trachea sample. In addition to synchronized ciliary motion, some random ciliary movements were also observed at certain parts of the sample. For the purpose of measuring the CBF, we focused on the regions with synchronized motion. The ciliary motion was visualized in real-time, and the region of interest could be identified and imaged efficiently. Figure 3 shows the spatial ciliary activity at room temperature from an ex-vivo rabbit trachea sample, where 15 temporally consequent images were arranged from left to right and top to bottom at time intervals of 11 ms. Synchronized ciliary activity can be demonstrated by the metachronal wave propagates over the ciliated region. The synchronicity can be further visualized by the video attached in the appendix which demonstrates the ciliary activity continuously captured within 2.2s at the same region of interest. It has to be noted that the color scale in figure 3 is half of that in the video for better visualization.
Fig. 3.
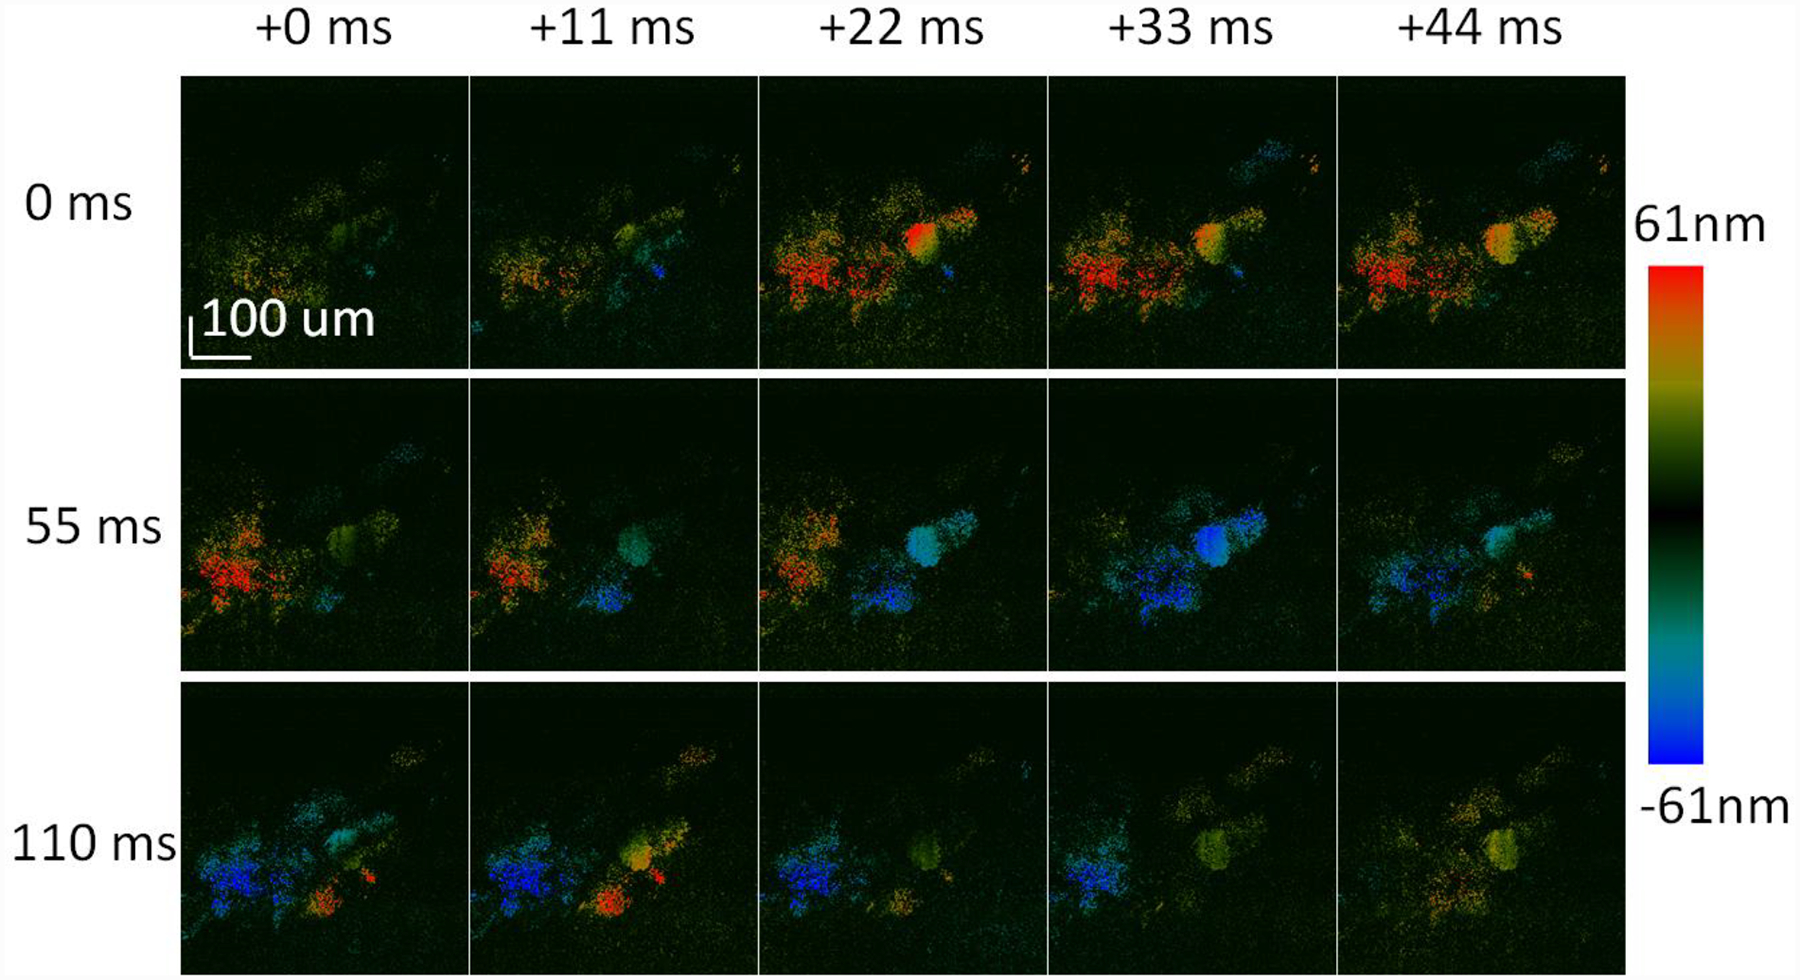
Consequent images showing metachronal wave propagates over the ciliated region acquired at time intervals of 11ms: the color bar encodes displacement of ciliary activity. The images are arranged from left to right and top to bottom.
Spatially Mapped CBF vs. Temperature
The tracheal sample was acquired as described in the methods section and a region with synchronized ciliary motion was identified. SEIM en face imaging was done while increasing the temperature of the sample from room temperature to 33 °C. The raw line-scan Doppler SEIM images are shown in figures 4a–c, where the same area of interest is imaged at 27 °C, 30 °C, and 33°C, respectively. Different colors correspond to the change in the phase amplitude and the direction of the ciliary motion which are directly proportional to the velocity of the motion. For different temperatures, the time at which the cilia complete a single power stroke cycle can be distinguished. The duration of the phase cycle can be estimated to be approximately 0.132 s for 27°C, 0.11 s for 30 °C, and 0.088 s for 33 °C. These results show that the CBF increases with temperature as expected from previous literature23.
Fig. 4.
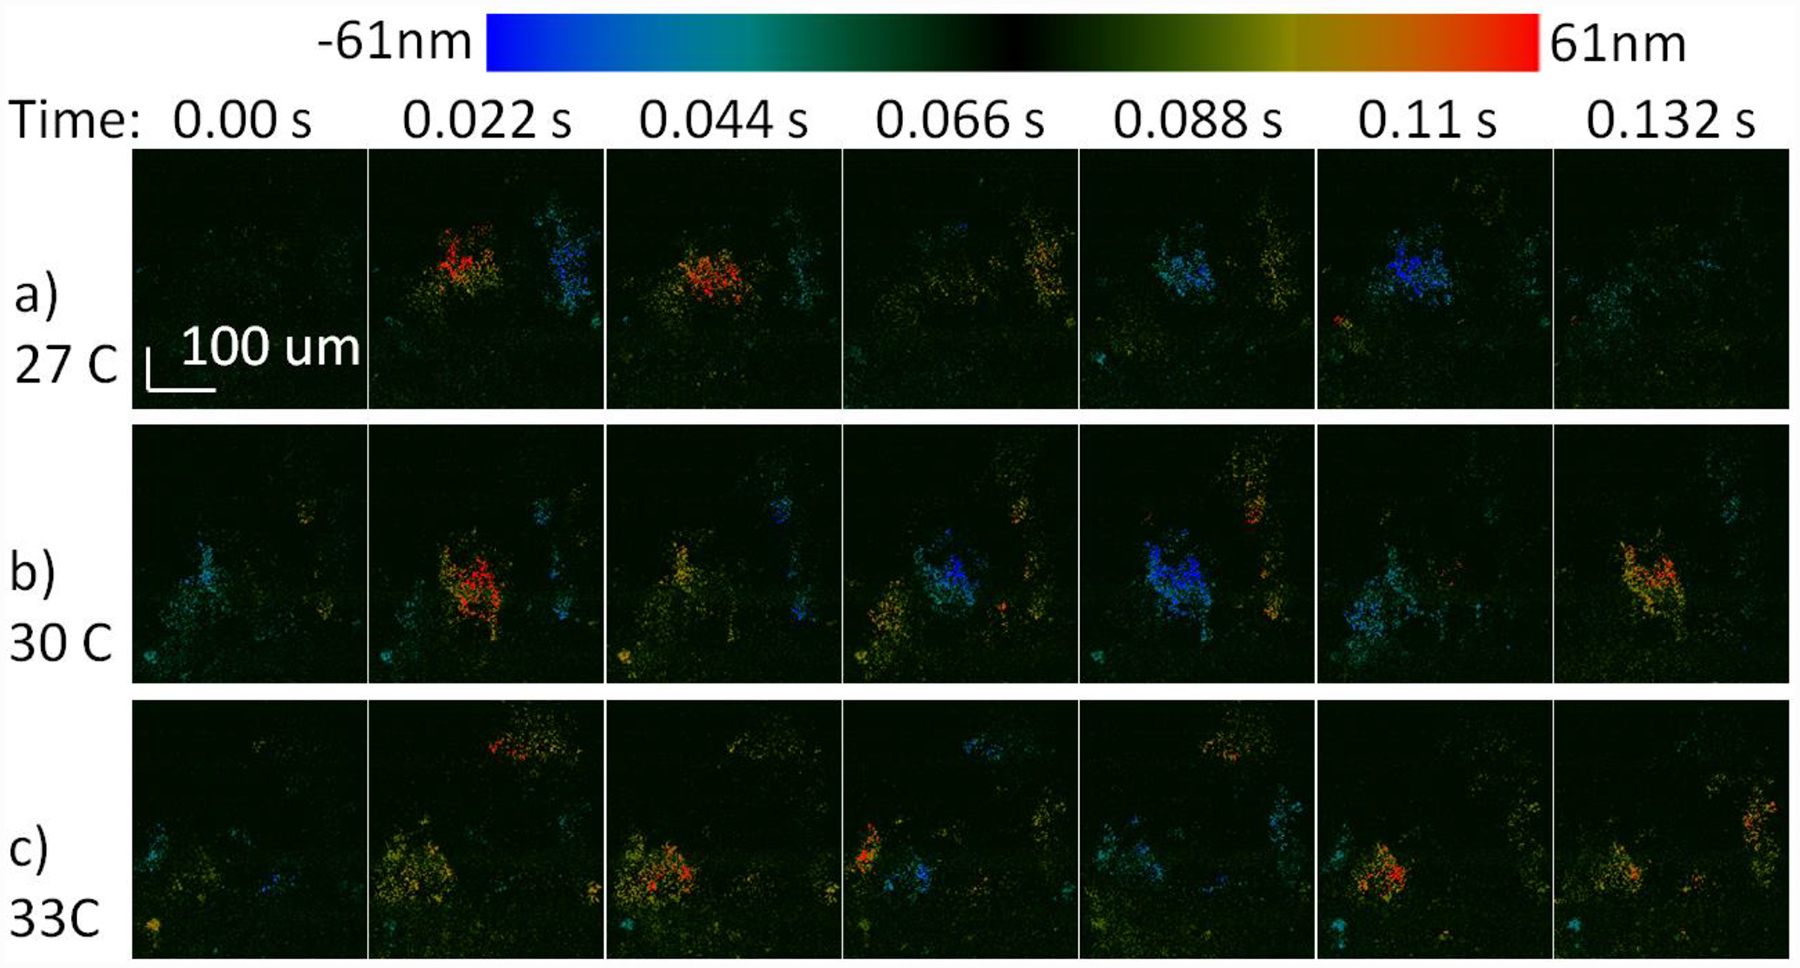
Cilia motion at different temperatures: the color bar encodes displacement of ciliary activity. a) Synchronized cilia cycle from 0 to 0.2 s at 27 °C, b) at 30 °C, c) at 33 °C.
Since the spatially encoded data is continuously collected over 6 seconds, the temporal data can also be extracted. The temporal profile or M-mode at each spatial location can be measured along the depth direction. It is important to note that the line scan system has advantages in visualizing lateral spatial and temporal information but sacrifices depth information and can only image superficial structures. However, for thin samples like cilia, tens of microns in depth are more than sufficient. An example of the temporal profile at one line under the 3 temperature conditions is presented in figures 5a–c. The phase is averaged across the entire depth of view and drawn out in figures 5d–f. Although the phase amplitude varies depending on the angular fluctuations of the sample and noise, the CBF is mostly consistent. In order to quantitatively determine the CBF at that particular location, a FFT is performed on the phase plot to yield the frequency plots in figures 5g–i. The peak frequency occurs at 9 Hz, 12 Hz, and 13 Hz for the 27 °C, 30 °C, and 33 °C cilia samples, respectively.
Fig. 5.
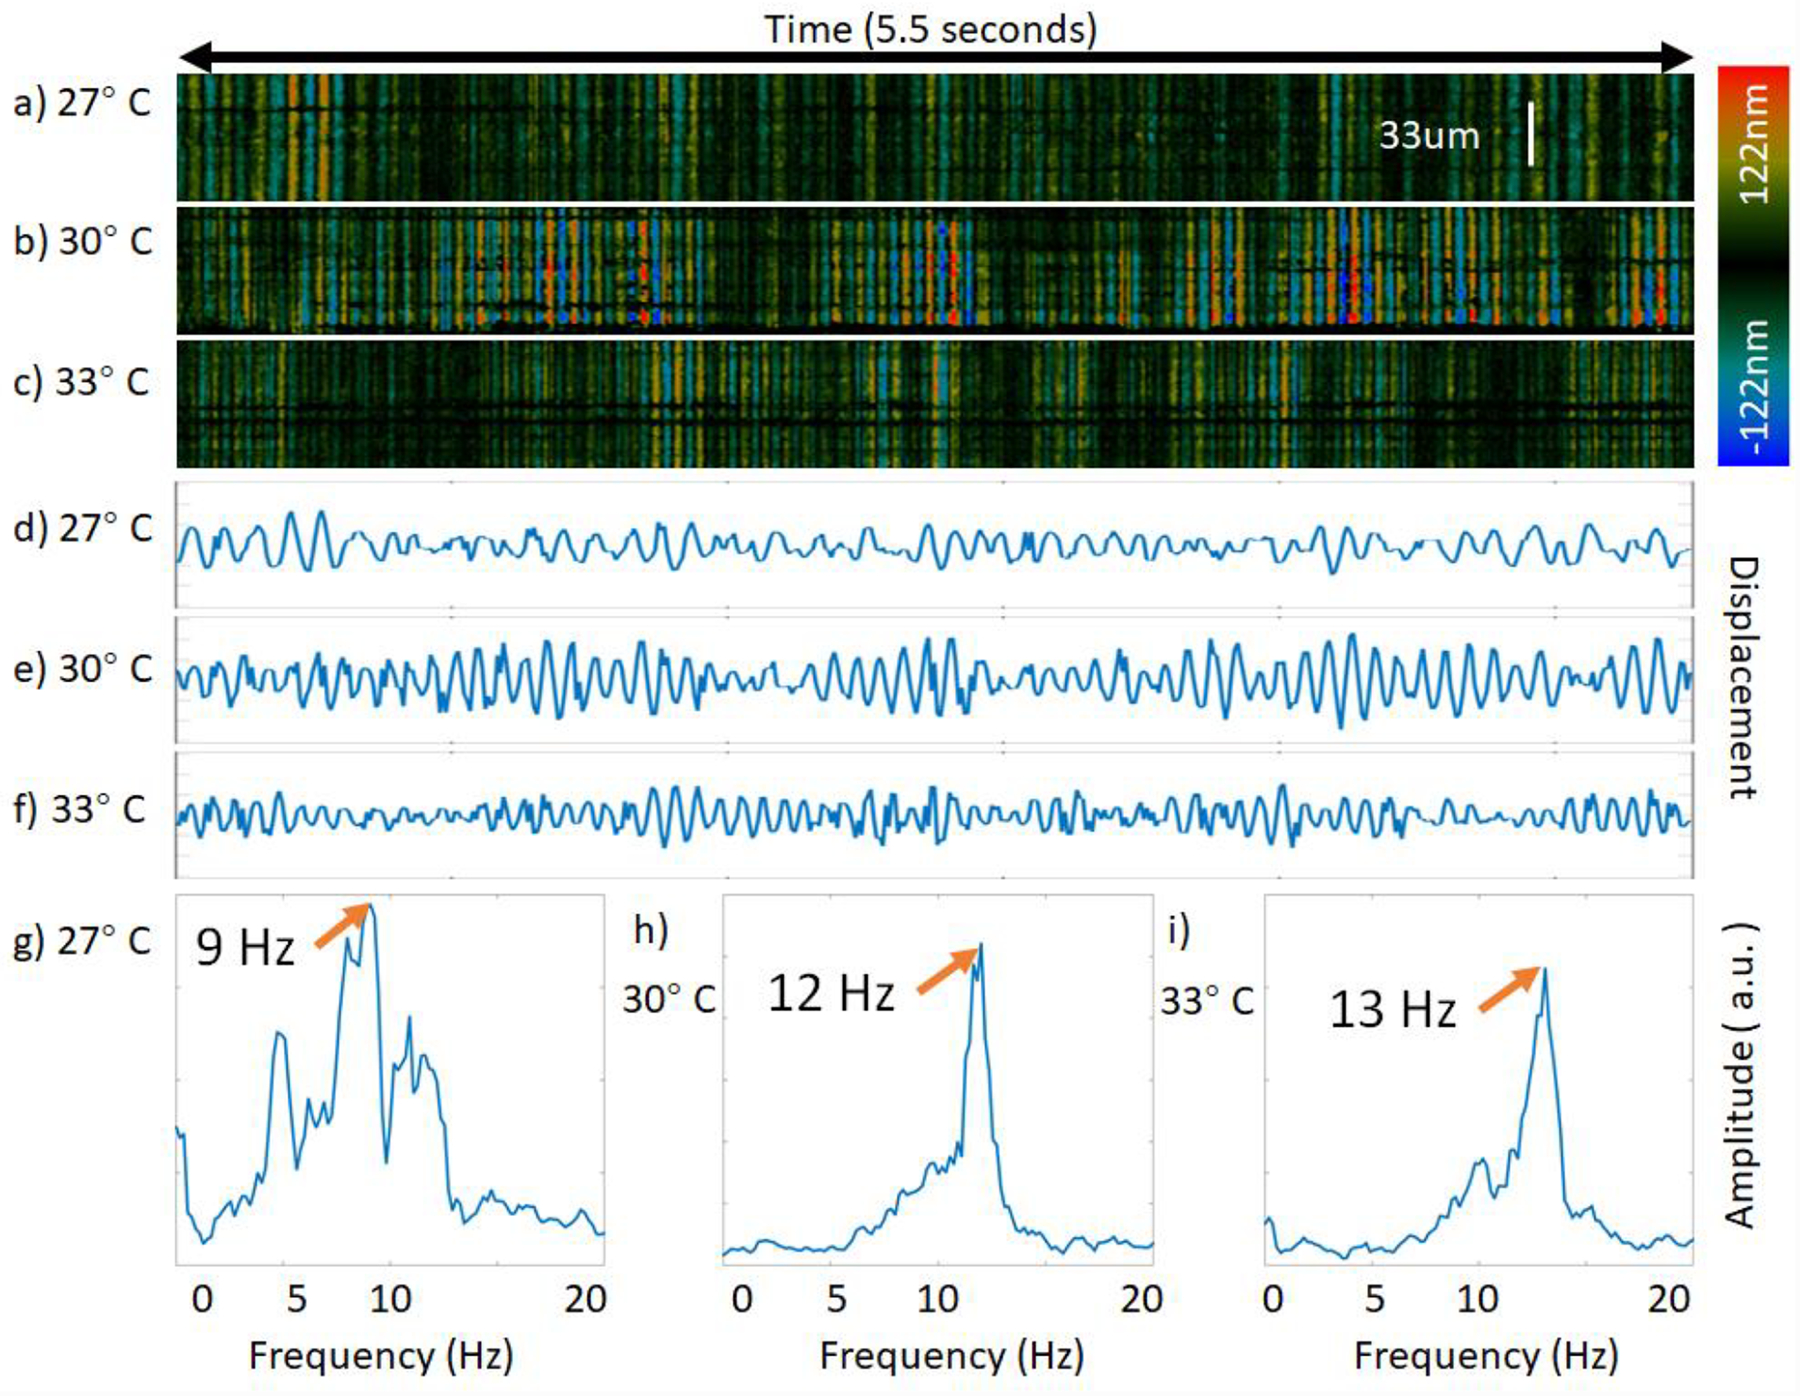
Ciliary beat frequency measurements at a single location on synchronized cilia; the color bar encodes displacement of ciliary activity in images a-c). a-c) Raw phase data over depth, d-f) mean phase plot of raw data, g-i) frequency distribution after FFT.
With the same data processing method, the temporal data is analyzed at each spatial location to yield the spatially coded CBF maps shown in figures 6a–c for the three temperatures, respectively. The same region was imaged for all three conditions where there appeared to be two separate bodies of synchronized cilia, marked by the yellow and red boxes. Small changes in the CBF can be observed between the two spatial regions at each temperature. With the increase in temperature, the CBF of all cilia increased as expected, and the means and standard deviations of both regions at each temperature have been plotted in figure 6d. The mean values ranged between 7.4 Hz and 13 Hz, all reasonable values for mammalian CBF. A general upward trend can be concluded between the CBF and the temperature.
Fig. 6.
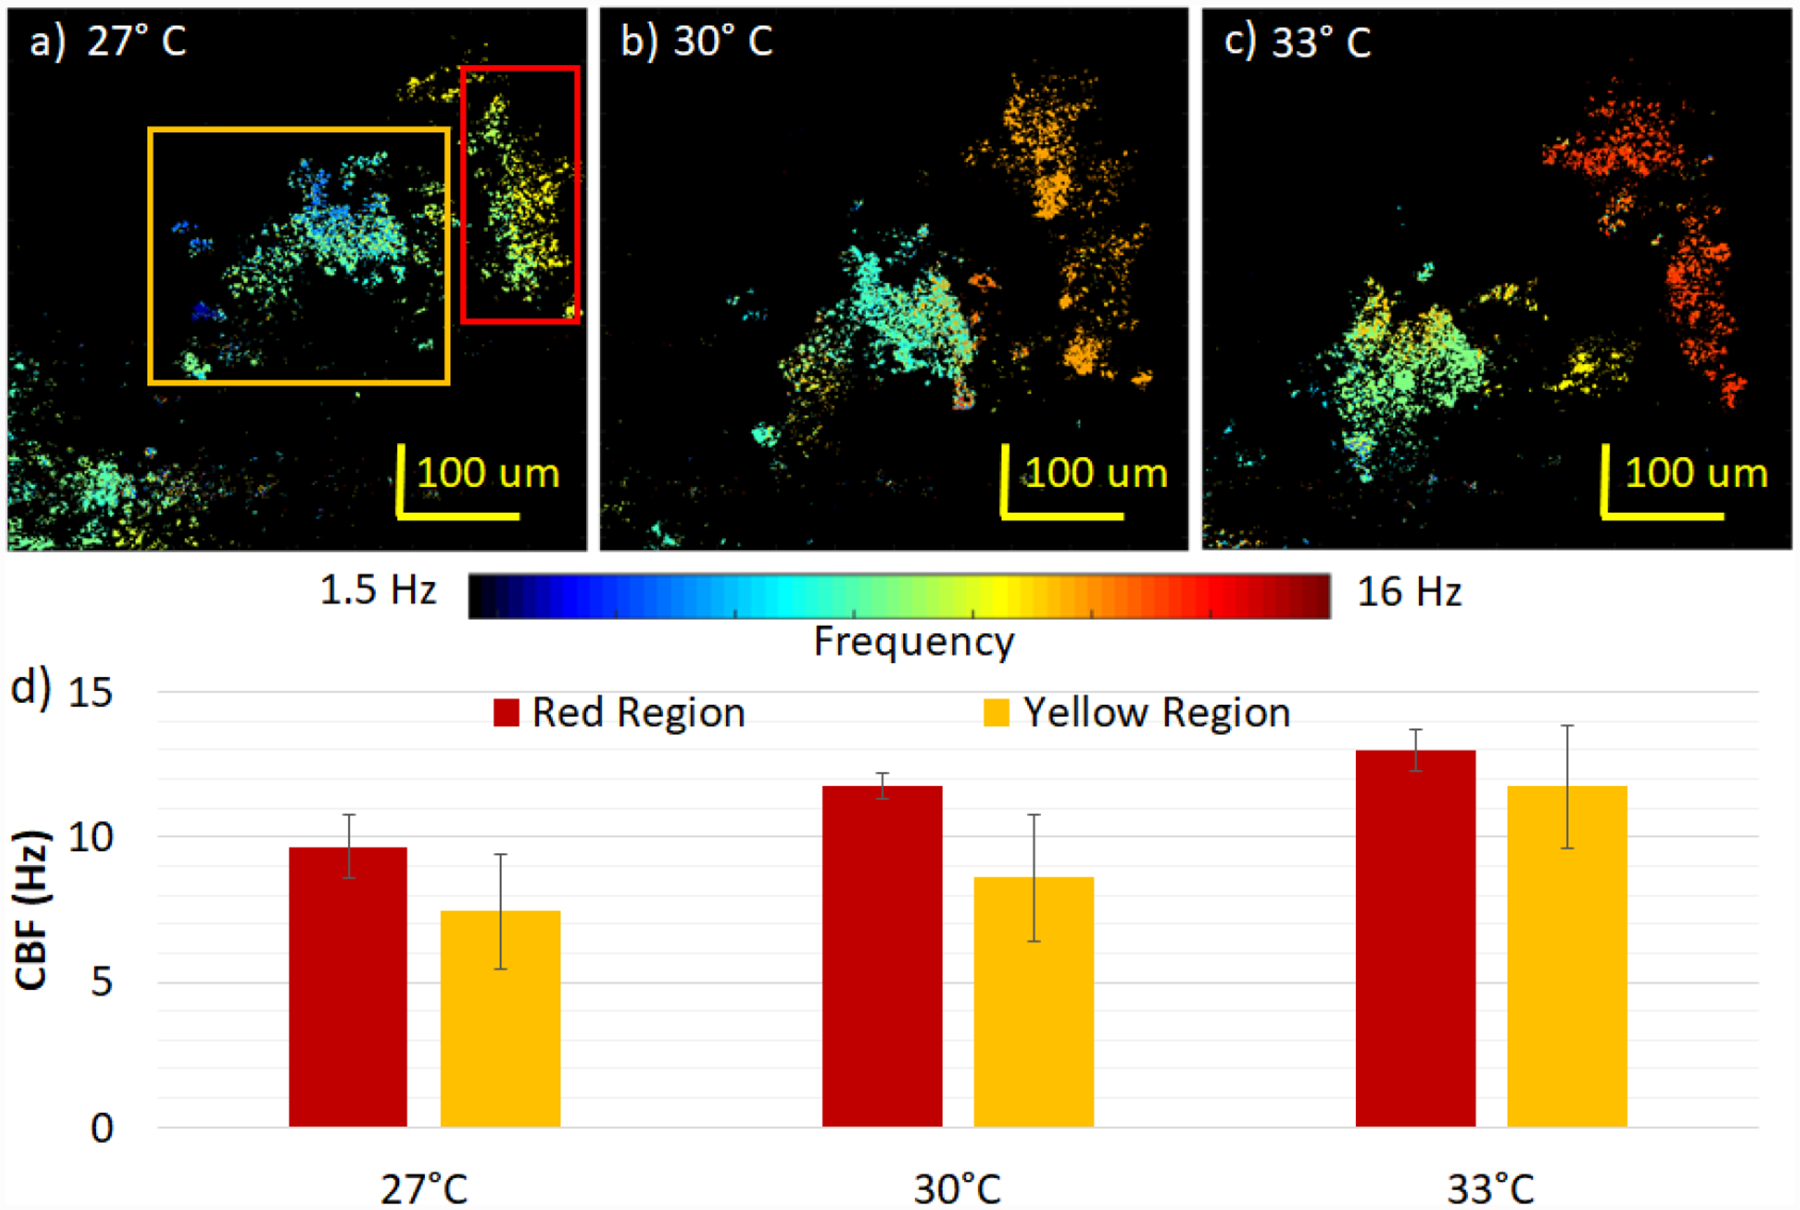
Spatial distribution of ciliary beat frequency with changes in temperature. The color bar encodes the CBF for images a-c): a) at 27 °C, b) at 30 °C, c) at 33 °C with the same corresponding region. d) CBF analysis of yellow and red regions. The CBF at 27 °C, b) at 30 °C, c) at 33 °C for the red region is 9.7±1.1 Hz, 11.8±0.5 Hz, 13.0±0.7 Hz and for the yellow region, 7.4±1.9 Hz, 8.6±2.2 Hz, 11.7±2.1 Hz, respectively.
Spatially Mapped CBF vs. Lidocaine Application
For the next experiment, the effects of lidocaine administration were studied. In general, lidocaine is a local anesthetic that is expected to significantly slow down ciliary motion and mucus transport. For this experiment, all samples were kept at 27 °C. As described in the methods section, 2% lidocaine was applied to the sample and imaging took place after 5 minutes. The raw en face images for the baseline measurement and after lidocaine application are shown in figures 7a and 7b, respectively. While the baseline cilia completed a full power stroke cycle in approximately 0.14 s, the lidocaine-treated cilia were not even halfway through the cycle in the same amount of time. Again, the temporal or M-mode data is plotted at every spatial location, yielding in the examples shown in figures 7c and 7d for the baseline and lidocaine-treated cilia, respectively. From the temporal data, it is evident that the frequency decreased significantly after lidocaine administration. The displacement plot was generated using the average phase over the entire depth, and FFT was performed to calculate the frequency peak at each location. Finally, the spatial map can be visualized in figures 7e and 7f, which are before and after drug administration, respectively. The mean and standard deviation for the baseline and treatment data were calculated using the CBF from each spatial location where cilia were present and plotted in figure 7g. The CBF before treatment was 7.2±2.2 Hz and decreased to 2.7±0.7 Hz after treatment. As shown in the spatial map, many of the cilia stopped moving altogether after lidocaine was applied, while others merely slowed down. Only the active cilia were taken into account when calculating the mean CBF and standard deviation.
Fig. 7.
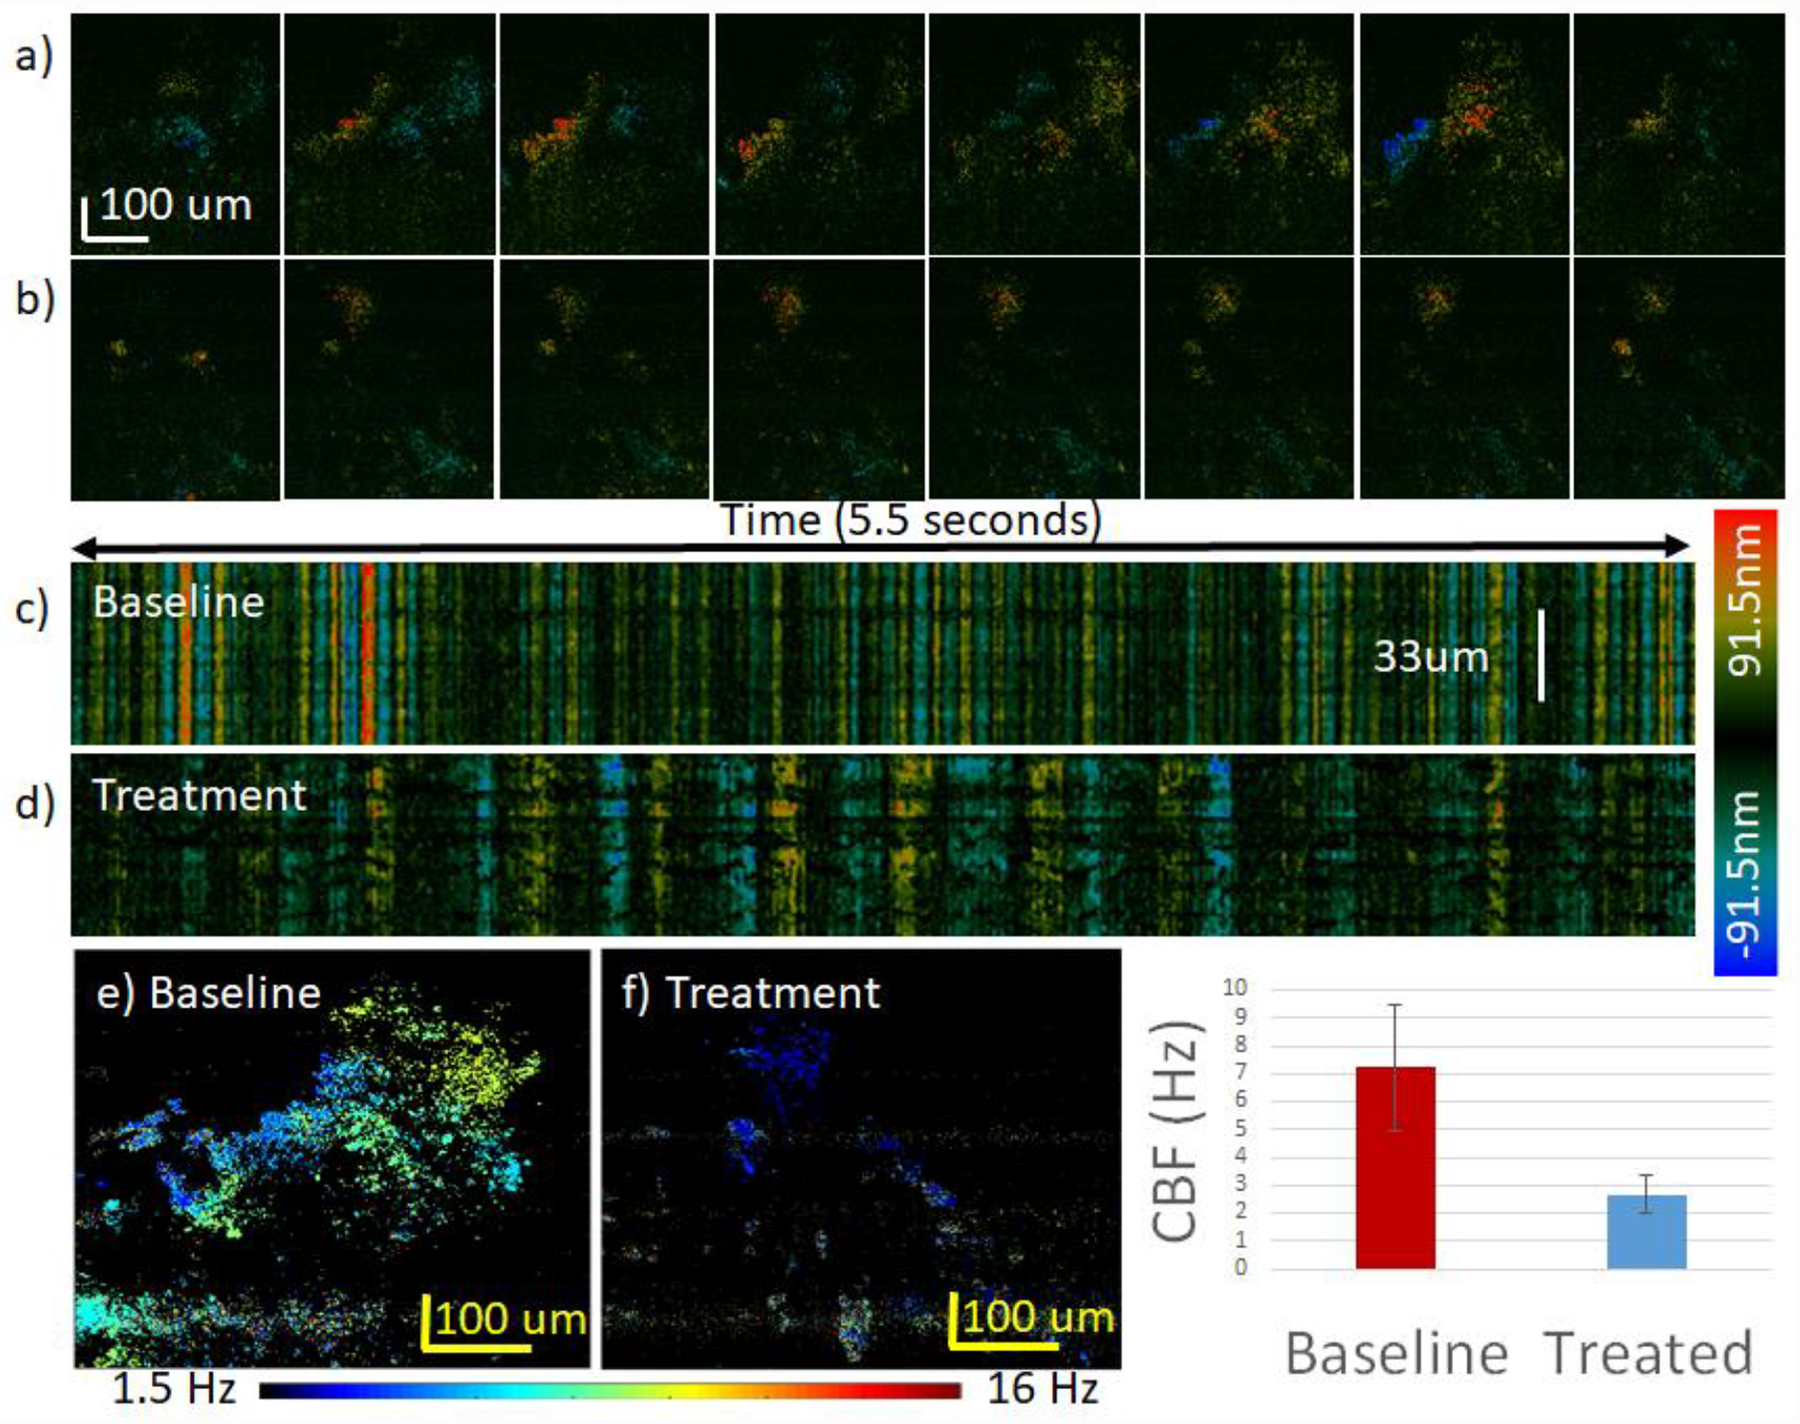
Effect of 2% lidocaine treatment on CBF. The color bar on the right of images c-d) encodes ciliary displacement for images a-d). The color bar on the bottom encodes the CBF for images e-f). a) Synchronized cilia cycle from 0 to 0.2 s for baseline sample at 23 °C. b) Synchronized cilia cycle from 0 to 0.2 s for treatment sample at 23 °C. c) Raw phase data of baseline data. b) Raw phase data after treatment. Note that most of the cilia were no longer active after treatment, and a small region of active cilia was used for analysis. e) Spatial distribution of CBF for baseline sample. f) Spatial distribution of CBF for treatment sample. g) CBF analysis of entire region. The CBF before treatment was 7.2±2.2 Hz and decreased to 2.7±0.7 Hz after treatment.
Spatially Mapped CBF vs. Albuterol Treatment
Ciliary activity in response to albuterol, which is commonly used to increase respiratory function, was also investigated to further verify the system effectiveness. According to previous reports about the effects of albuterol on ciliary tissue23,39–41, CBF is expected to increase with the introduction of the drug. Similar to the lidocaine experiment, a rabbit trachea sample was kept at room temperature and the baseline data was first recorded when the sample was placed in HBSS buffer only. Then the buffer was replaced with a 0.3% albuterol solution as mentioned in the methods section, and imaging was performed after approximately 1 minute. As shown in figure 8, the spatial CBF for the experimental group increased across the region of interest from a baseline of 5.6±0.8 Hz to 6.1±0.8 Hz. We then added more albuterol to the buffer to achieve a 0.6% drug concentration. As expected, the overall CBF increased again to 6.7±1.3 Hz. In addition, more regions of ciliated cells were activated and contributed to more synchronized ciliary activity within the same imaging area. The mean and standard deviation values were calculated and plotted in figure 8d.
Fig. 8.
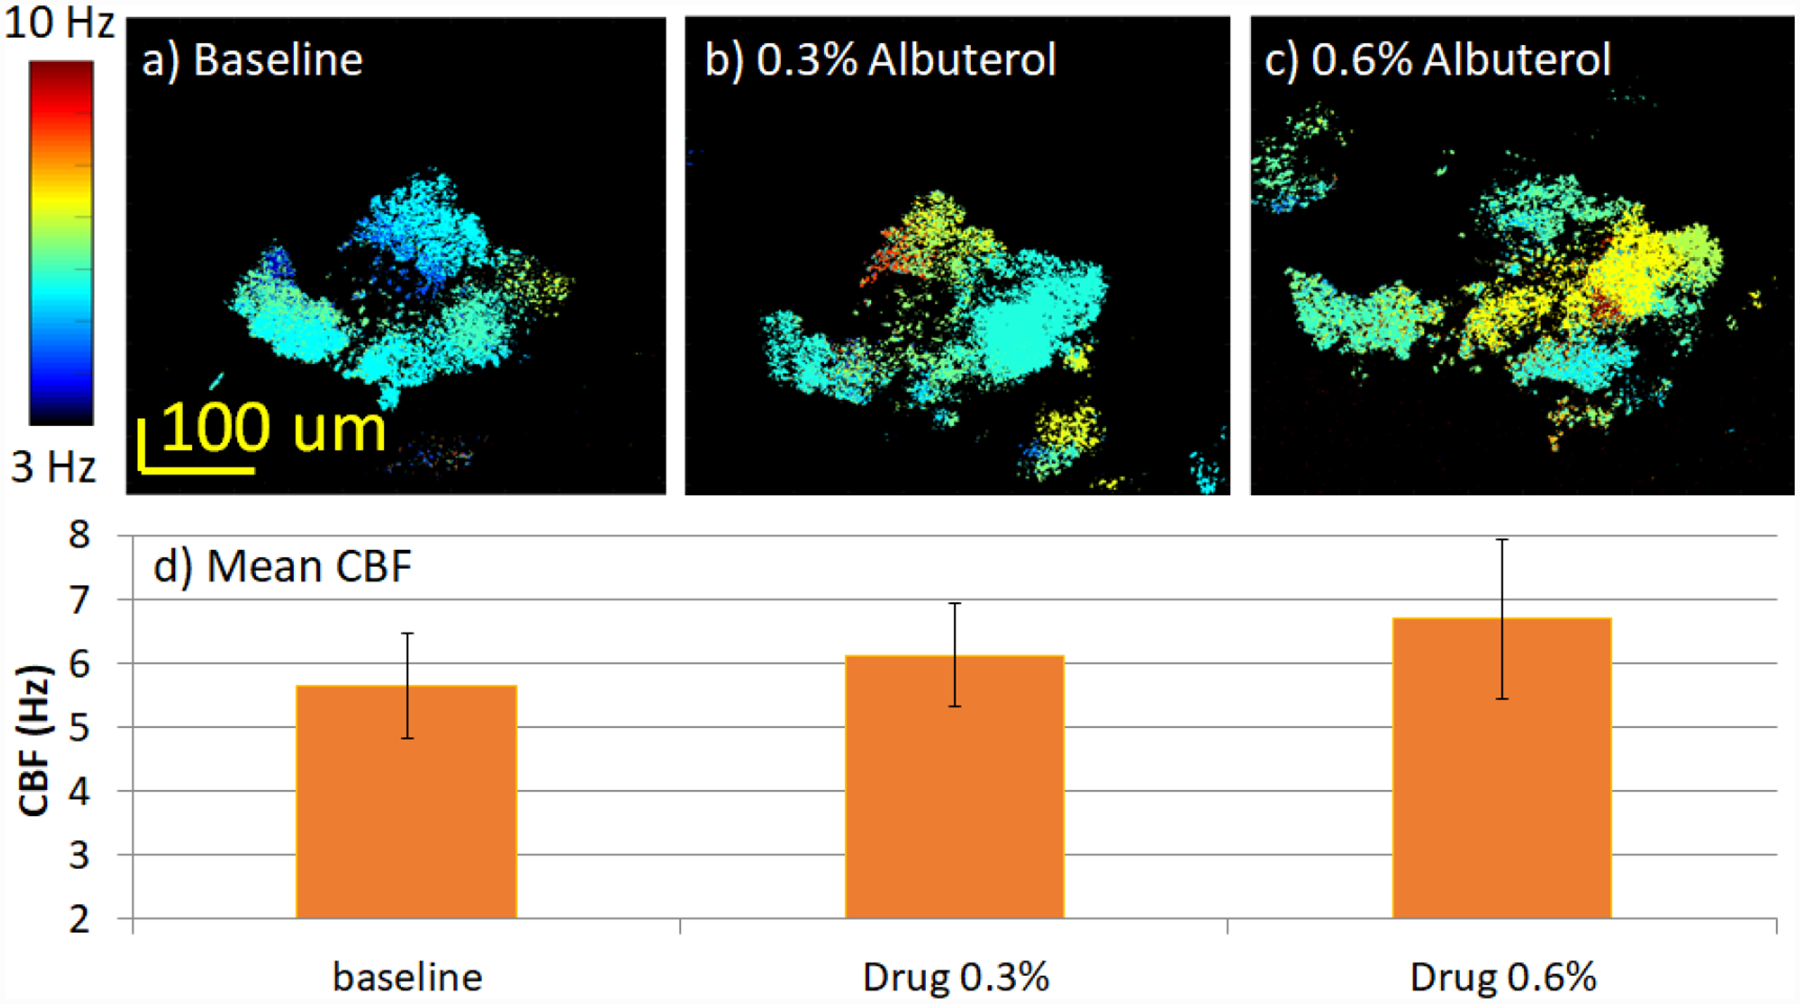
Effect of albuterol treatment on CBF. The color scale for images a-c) encodes CBF. a) Spatial distribution of CBF for baseline. b) Spatial distribution of CBF for sample treated with 0.3% albuterol. c) Spatial distribution of CBF for sample treated with 0.6% albuterol. d) CBF analysis of entire region. The CBF of images a-c) are 5.6±0.8Hz, 6.1±0.8Hz, and 6.7±1.3 Hz, respectively.
Discussion & Conclusion:
CBF is one of the most important indicators of respiratory health, and studying the mechanisms of ciliary motion is crucial in understanding diseases of the airway. The currently available methods mostly focus on ex-vivo microscopy and high-speed camera imaging, which do not offer a realistic examination of the CBF in its natural environment. Recent studies have demonstrated in-vivo ciliary studies using a micro-OCT system which visualizes the ciliary beating frequency within a cross-sectional field of view10–16. However, ciliary motion naturally occurs on the surface of ciliated tissue and a cross-sectional field of view may be insufficient to demonstrate the spatial pattern of the coordinated ciliary beats that occurs in two dimensions. Therefore, this study aims to visualize and analyze the CBF both spatially and temporally with potential adaptability for clinical translation and in-vivo analysis.
For this initial feasibility study, variations in the CBF were observed within a spatial region. While some differences in CBF are expected across a sample, it would be worthwhile to more closely analyze the origin of these variations to better understand ciliary motion. It was also obvious that some cilia were beginning to degrade and were no longer moving in a synchronized manner with each other. These randomly moving cilia contributed to noise within the sample and the measured CBF. Future in-vivo studies can help better explain the loss of synchronicity and spatial changes in CBF by eliminating tissue degradation and freshness factors.
The two primary challenges of translating this technology to in-vivo studies are the noise factor and the clinical adaptability of the scanner. Bulk motion from breathing is expected to have a large impact on the data. However, since noise from breathing is largely characterized by a low frequency bulk movement, frequency analysis can be utilized to eliminate these factors. The current system’s sample arm and scanner unit are bulky and unsuitable for in-vivo studies. However, a handheld probe based design is currently under fabrication to ensure clinical adaptability in the next study.
In summary, we have demonstrated a novel method of spatially mapping the CBF and ciliary motion with high speed, high resolution Doppler SEIM. With this line-scan system, we were able to acquire real-time en face images of the cilia and analyze the synchronicity of the motion. A general trend was observed between increases in the external temperature and increases in the CBF. In addition, the CBF decreased significantly after application of lidocaine, and an increasing trend was observed with the introduction of albuterol. The feasibility of using SS-SEIM technology to map the CBF has been validated across different conditions, and the results serve as a stepping stone to our ongoing translation of the technique for in-vivo and clinical studies.
Supplementary Material
Acknowledgments
This work was supported by grants from the National Institutes of Health (R01HL-125084, R01HL-127271, R01EY-026091, R01EY-028662), and the Air Force Office of Scientific Research (FA9550-17-1-0193).
Footnotes
Disclosures
Dr. Zhongping Chen has a financial interest in OCT Medical Inc., which, however, did not support this work.
Support information: Video of ciliary activity captured with 91 fps for 2.2 s.
References
- 1.Knowles MR; Boucher RC Mucus clearance as a primary innate defense mechanism for mammalian airways. J. Clin. Invest 2002, 109, 571–577. [DOI] [PMC free article] [PubMed] [Google Scholar]
- 2.King M Physiology of mucus clearance. Paediatr. Respir. Rev 2006, 7, S212–S214. [DOI] [PubMed] [Google Scholar]
- 3.Liu L; Chu KK; Houser GH; Diephuis BJ; Li Y; Wilsterman EJ; Shastry S; Dierksen G; Birket SE; Mazur M Method for quantitative study of airway functional microanatomy using micro-optical coherence tomography. PloS One 2013, 8, e54473. [DOI] [PMC free article] [PubMed] [Google Scholar]
- 4.Ellerman A; Bisgaard H Longitudinal study of lung function in a cohort of primary ciliary dyskinesia. Eur. Respir. J 1997, 10, 2376–2379. [DOI] [PubMed] [Google Scholar]
- 5.Smith CM; Djakow J; Free RC; Djakow P; Lonnen R; Williams G; Pohunek P; Hirst RA; Easton AJ; Andrew PW; O’Callaghan C ciliaFA: a research tool for automated, high-throughput measurement of ciliary beat frequency using freely available software. Cilia 2012. 1, 14. [DOI] [PMC free article] [PubMed] [Google Scholar]
- 6.Puybareau E; Talbot H; Pelle G; Louis B; Papon J-F; Coste A; Najman L; editors. A regionalized automated measurement of ciliary beating frequency. in 2015 IEEE 12th International Symposium on Biomedical Imaging (ISBI). 2015, 528–531. [Google Scholar]
- 7.Dalhamn T; Rylander R Frequency of ciliary beat measured with a photo-sensitive cell. Nature 1962, 196, 592. [DOI] [PubMed] [Google Scholar]
- 8.Chilvers MA; O’callaghan C Analysis of ciliary beat pattern and beat frequency using digital high speed imaging: comparison with the photomultiplier and photodiode methods. Thorax 2000. 55, 314–317. [DOI] [PMC free article] [PubMed] [Google Scholar]
- 9.Fercher AF; Drexler W; Hitzenberger CK; Lasser TJ Optical coherence tomography-principles and applications. Reports on Progress in Physics 2003, 66, 239. [Google Scholar]
- 10.Chu KK; Unglert C; Ford TN; Cui D; Carruth RW; Singh K; Liu L; Birket SE; Solomon GM; Rowe SM; Tearney GJ In vivo imaging of airway cilia and mucus clearance with micro-optical coherence tomography. Biomedical Optics Express 2016, 7, 2494–2505. [DOI] [PMC free article] [PubMed] [Google Scholar]
- 11.Wang S; Burton JC; Behringer RR; Larina IV In vivo micro-scale tomography of ciliary behavior in the mammalian oviduct. Scientific Reports 2015, 5, 13216. [DOI] [PMC free article] [PubMed] [Google Scholar]
- 12.Wang S; Larina IV In vivo imaging of the mouse reproductive organs, embryo transfer, and oviduct cilia dynamics using optical coherence tomography Mouse Embryogenesis, Springer, New York, 2018, 53–62. [DOI] [PubMed] [Google Scholar]
- 13.Wang S; Syed R; Grishina OA; Larina IV Prolonged in vivo functional assessment of the mouse oviduct using optical coherence tomography through a dorsal imaging window. J. Biophotonics 2018, 11, e201700316. [DOI] [PMC free article] [PubMed] [Google Scholar]
- 14.Leung HM; Birket SE; Hyun C; Ford TN; Cui D; Solomon GM; Shei R-J; Adewale AT; Lenzie AR; Fernandez-Petty CM Intranasal micro-optical coherence tomography imaging for cystic fibrosis studies. Science Translational Medicine 2019, 11, 3505. [DOI] [PMC free article] [PubMed] [Google Scholar]
- 15.Solomon GM; Francis R; Chu KK; Birket SE; Gabriel G; Trombley JE; Lemke KL; Klena N; Turner B; Tearney GJ Assessment of ciliary phenotype in primary ciliary dyskinesia by micro-optical coherence tomography. JCI Insight 2017, 2, e91702. [DOI] [PMC free article] [PubMed] [Google Scholar]
- 16.Cui D; Chu KK; Yin B Ford TN; Hyun C; Leung HM; Gardecki JA; Solomon GM; Birket SE; Liu L Flexible high-resolution micro-optical coherence tomography endobronchial probe toward in vivo imaging of cilia. Optics Letters 2017, 42, 867–870. [DOI] [PMC free article] [PubMed] [Google Scholar]
- 17.Zhang J; Rao B; Yu L; Chen ZJ High-dynamic-range quantitative phase imaging with spectral domain phase microscopy. Optics Letters 2009, 34, 3442–3444. [DOI] [PMC free article] [PubMed] [Google Scholar]
- 18.He Y; Qu Y; Zhu J; Zhang Y; Saidi A; Ma T; Zhou Q; Chen Z Confocal Shear Wave Acoustic Radiation Force Optical Coherence Elastography for Imaging and Quantification of theIn VivoPosterior Eye. IEEE J. Selected Topics in Quantum Electronics 2019, 25, 1–7. [DOI] [PMC free article] [PubMed] [Google Scholar]
- 19.Qu Y; He Y; Saidi A; Xin Y; Zhou Y; Zhu J; Ma T; Silverman RH; Minckler DS; Zhou Q; Chen Z In vivo elasticity mapping of posterior ocular layers using acoustic radiation force optical coherence elastography. Investigative Ophthalmology & Visual Science 2018,59, 455–461. [DOI] [PMC free article] [PubMed] [Google Scholar]
- 20.Qu Y; He Y; Zhang Y; Ma T; Zhu J; Miao Y; Dai C; Humayun M; Zhou Q; Chen Z; Quantified elasticity mapping of retinal layers using synchronized acoustic radiation force optical coherence elastography. Biomedical Optics Express 2018, 9, 4054–4063. [DOI] [PMC free article] [PubMed] [Google Scholar]
- 21.Qu Y; Ma T; He Y; Yu M; Zhu J; Miao Y; Dai C; Patel P; Shung KK; Zhou Q; Chen Z Miniature probe for mapping mechanical properties of vascular lesions using acoustic radiation force optical coherence elastography. Scientific Reprots 2017, 7, 4731. [DOI] [PMC free article] [PubMed] [Google Scholar]
- 22.Qu Y; Ma T; He Y; Zhu J; Dai C; Yu M Huang S; Lu F; Shung KK; Zhou Q; Chen Z Acoustic radiation force optical coherence elastography of corneal tissue. IEEE J. Sel. Top. Quantume Electronics 2016, 22, 288–294. [DOI] [PMC free article] [PubMed] [Google Scholar]
- 23.Jing JC; Chen JJ; Chou L; Wong BJ; Chen Z Visualization and detection of ciliary beating pattern and frequency in the upper airway using phase resolved Doppler optical coherence tomography. Scientific Reports 2017, 7, 8522. [DOI] [PMC free article] [PubMed] [Google Scholar]
- 24.Ilgayev O; Yelin D Phase-sensitive imaging of tissue acoustic vibrations using spectrally encoded interferometry. Optics Express 2013, 21, 19681–19689. [DOI] [PubMed] [Google Scholar]
- 25.Tearney GJ; Webb R; Bouma B Spectrally encoded confocal microscopy. Optics Letters 1998, 23, 1152–1154. [DOI] [PubMed] [Google Scholar]
- 26.Tearney G; Shishkov M; Bouma B Spectrally encoded miniature endoscopy. Optics Letters 2002, 27, 412–414. [DOI] [PubMed] [Google Scholar]
- 27.Ikuta M; Do D; Kang D; Tearney GJ; Brauer JS Spectrally encoded endoscopic probe having a fixed fiber. US patent 10321810B1, 2019.
- 28.Yelin D; Bouma B; Iftimia N; Tearney G Three-dimensional spectrally encoded imaging. Optics Letters 2003, 28, 2321–2323. [DOI] [PubMed] [Google Scholar]
- 29.Grechin S; Yelin D Imaging acoustic vibrations in an ear model using spectrally encoded interferometry. Optics Communication 2018, 407, 175–180. [Google Scholar]
- 30.Yelin D; Bouma B; Rosowsky J; Tearney G Doppler imaging using spectrally-encoded endoscopy. Optics Express 2018, 16, 14836–14844. [DOI] [PMC free article] [PubMed] [Google Scholar]
- 31.Yun S; Tearney G; de Boer JF; Bouma B Pulsed-source and swept-source spectral-domain optical coherence tomography with reduced motion artifacts. Optics Express 2004, 12, 5614–5624. [DOI] [PMC free article] [PubMed] [Google Scholar]
- 32.Walther J; Mueller G; Morawietz H; Koch E Signal power decrease due to fringe washout as an extension of the limited Doppler flow measurement range in spectral domain optical coherence tomography. Journal of Biomedical Optics 2010, 15, 041511. [DOI] [PubMed] [Google Scholar]
- 33.De Boer JF; Leitgeb R; Wojtkowski M Twenty-five years of optical coherence tomography: the paradigm shift in sensitivity and speed provided by Fourier domain OCT. Biomedical Optics Express 2017, 8, 3248–3280. [DOI] [PMC free article] [PubMed] [Google Scholar]
- 34.Choma MA; Sarunic MV; Yang C; Izatt JA Sensitivity advantage of swept source and Fourier domain optical coherence tomography. Optics Express 2003, 11, 2183–2189. [DOI] [PubMed] [Google Scholar]
- 35.Yun S-H; Tearney GJ; de Boer JF; Iftimia N; Bouma BE High-speed optical frequency-domain imaging. Optics Express 2003, 11, 2953–2963. [DOI] [PMC free article] [PubMed] [Google Scholar]
- 36.Chen Z; Milner TE; Srinivas S; Wang X; Malekafzali A; van Gemert MJ; Nelson JS Noninvasive imaging of in vivo blood flow velocity using optical Doppler tomography. Optics Letters 1997, 22, 1119–1121. [DOI] [PubMed] [Google Scholar]
- 37.Chen Z; Zhao Y; Srinivas SM; Nelson JS; Prakash N; Frostig RD Optical doppler tomography. IEEE J. Sel. Top. Quantume Electronics 1999, 5, 1134–1142. [Google Scholar]
- 38.Zhao Y; Chen Z; Saxer C; Xiang S; de Boer JF; Nelson JS Phase-resolved optical coherence tomography and optical Doppler tomography for imaging blood flow in human skin with fast scanning speed and high velocity sensitivity. Optics Letters 2000, 25, 114–116. [DOI] [PubMed] [Google Scholar]
- 39.Frohock JI; Wijkstrom-Frei C; Salathe M Effects of albuterol enantiomers on ciliary beat frequency in ovine tracheal epithelial cells. J. Applied Physiology 2002, 92, 2396–2402. [DOI] [PubMed] [Google Scholar]
- 40.Devalia J; Sapsford R; Rusznak C; Toumbis M; Davies R The effects of salmeterol and salbutamol on ciliary beat frequency of cultured human bronchial epithelial cells, in vitro. Pulm. Pharmacol 1992, 5, 257–263. [DOI] [PubMed] [Google Scholar]
- 41.Seybold ZV; Mariassy AT; Stroh D; Kim CS; Gazeroglu H; Wanner A Mucociliary interaction in vitro: effects of physiological and inflammatory stimuli. J. Applied Physiology 1990. 68, 1421–1426. [DOI] [PubMed] [Google Scholar]
Associated Data
This section collects any data citations, data availability statements, or supplementary materials included in this article.


