



Keywords: benign prostatic hyperplasia, collagen type I-α1, Escherichia coli, lower urinary tract symptoms, prostatitis
Abstract
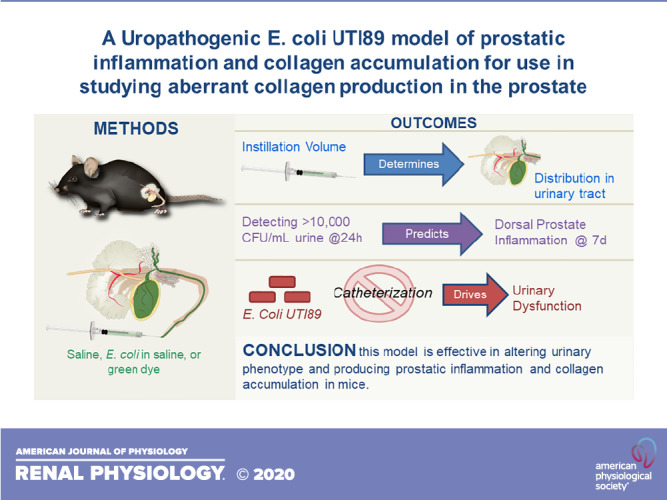
Bacterial infection is one known etiology of prostatic inflammation. Prostatic inflammation is associated with prostatic collagen accumulation and both are linked to progressive lower urinary tract symptoms in men. We characterized a model of prostatic inflammation using transurethral instillations of Escherichia coli UTI89 in C57BL/6J male mice with the goal of determining the optimal instillation conditions, understanding the impact of instillation conditions on urinary physiology, and identifying ideal prostatic lobes and collagen 1a1 prostatic cell types for further analysis. The smallest instillation volume tested (50 µL) distributed exclusively to the bladder, 100- and 200-µL volumes distributed to the bladder and prostate, and a 500-µL volume distributed to the bladder, prostate, and ureter. A threshold optical density of 0.4 E. coli UTI89 in the instillation fluid was necessary for significant (P < 0.05) prostate colonization. E. coli UTI89 infection resulted in a low frequency, high volume spontaneous voiding pattern. This phenotype was due to exposure to E. coli UTI89, not catheterization alone, and was minimally altered by a 50-µL increase in instillation volume and doubling of E. coli concentration. Prostate inflammation was isolated to the dorsal prostate and was accompanied by increased collagen density. This was partnered with increased density of protein tyrosine phosphatase receptor type C+, procollagen type I-α1+ copositive cells and decreased density of α2-smooth muscle actin+, procollagen type I-α1+ copositive cells. Overall, we determined that this model is effective in altering urinary phenotype and producing prostatic inflammation and collagen accumulation in mice.
INTRODUCTION
Most men of advancing age experience lower urinary tract symptoms (LUTS), which are characterized by frequent voiding, especially at night (nocturia), a weak urine stream, and a feeling of incomplete bladder emptying (20, 35). LUTS reduce quality of life in a significant population of men (10, 16, 38, 54). Men who have LUTS can progress to experiencing severe lower urinary tract dysfunction including urinary retention, bladder wall remodeling, recurrent urinary tract infections, bladder calculi, and renal impairment (20, 22).
Current evidence suggests that LUTS are derived from a multifactorial process, with prostatic inflammation serving as a key driver (7). Histological inflammation, especially lymphocytic (chronic) inflammation, is common in men with LUTS and strongly associates with LUTS severity (33). Prostatic inflammation also associates with prostatic collagen abundance, which itself associates with urinary dysfunction (3, 9, 14, 15, 26, 30, 47).
Mice have emerged as an important resource for modeling prostatic inflammation and for identifying molecular signaling pathways that contribute to pathology and urinary voiding physiology (4, 25, 44). Rodent prostate inflammation has been driven by a genetic approach (2), by initiating autoimmunity against the prostate (17, 40), and by introducing noxious stimuli into the prostate (13, 23, 29). Bacterial infection is also used to initiate prostate inflammation, especially in genetically modified mice, where it can facilitate a mechanistic understanding of inflammation, pain, collagen accumulation, and voiding dysfunction. Inflammation of the mouse prostate in a transurethral bacterial infection mouse model uses a natural causal agent of prostate inflammation (1, 32), rather than noxious stimulus, to produce prostate bacterial colonization and drive prostatic inflammation. This approach does not necessarily recapitulate a natural route of bacterial colonization of the prostate in men; however, it does provide a reproducible model for studying the long-term sequelae of prostatic bacterial colonization.
We used Escherichia coli UTI89, a strain of uropathogenic E. coli recovered from a human patient with cystitis (24) and transformed with a pCOMGFP plasmid (48) to confer green fluorescent protein expression and kanamycin resistance. Other researchers have used 4017 and 1677 E. coli strains in C3H/HeJ and C3H/HeOuJ mice, but C57BL/6J mice do not develop significant infections with these E. coli strains (11). The C3H/HeOuJ mice used in previous prostate infection studies harbor a Toll receptor variant (lpsd) that renders them hyporesponsive to endotoxin (18, 46) and makes them susceptible to chronic infection (34). In contrast, C57BL/6J mice clear the infection, enabling study of both the acute infection phase and long-term response following bacterial clearance. The overarching goal of this study was to address some of the remaining questions about the transurethral bacterial infection system, including which bacterial instillation methods are most efficient and reproducible in driving prostate inflammation in mice, if urinary function is altered acutely (<7 days postbacterial instillation) in C57Bl/6J mice (the most common background strain for commercially available transgenic mice), and which prostatic cells produce collagen in the acute phase of bacterial inflammation. Answering these three questions will facilitate our future goals of determining targetable collagen production pathways and conducting preclinical testing of novel therapeutics.
Bacterial inflammation of the mouse prostate was achieved by catheterizing anesthetized male mice and instilling a bacterial solution into the male urethra. The first goal of this study was to determine how instillation volume and bacterial concentration influence instillation fluid distribution across the lower urinary tract and infection severity within the mouse prostate. We found that large (200 µL+) instillation fluid volumes distributed more widely across the lower urinary tract than a smaller volume (50 µL), which distributed only to the bladder. We found that a threshold concentration of E. coli UTI89 in instillation fluid [optical density (OD) 0.4] was needed to achieve a significant E. coli load in the prostate. Further increases beyond the threshold concentration of E. coli in instillation fluid did not significantly increase the bacterial load in the prostate. We also found that free catch urine, captured and cultured within 24 h of bacterial instillation, can be used to predict which mice will have histological prostatic inflammation at 7 days postinstallation.
The second goal of this study was to determine the impact of acute E. coli UTI89 infection on urinary physiology using the spontaneous void spot assay (VSA) and anesthetized cystometry. Whether catheterization alone induced injury and altered VSA and anesthetized cystometry parameters was previously unknown. We found that urinary catheter placement does not by itself change male mouse urinary function, nor does urethral instillation of sterile saline (up to 100 µL). E. coli UTI89 infection resulted in a low frequency, high volume spontaneous voiding phenotype, which was uniquely observed when monitoring spontaneous voiding and not when monitoring urinary voiding of anesthetized mice by cystometry. Our results are consistent with an E. coli-mediated change in mouse behavior and not E. coli-mediated changes to the lower urinary tract physiology. In addition, there were no differences in voiding behaviors between mice colonized with E. coli (positive urine culture) and mice that were uncolonized (negative urine culture) at 7 days postinstillation, suggesting that voiding behavior changes evoked by transurethral instillation of bacteria are caused by bacterial exposure and not bacterial colonization.
The third goal of this study was to establish anatomic relationships between bacterial colonization, inflammation, and collagen density in the mouse prostate and determine which prostatic cell types produce collagen in inflamed regions. Previous E. coli-driven mouse models of prostatic inflammation have documented prostatic collagen accumulation (4, 55). No previous study has examined if the E. coli UTI89 strain also causes prostatic collagen accumulation and if infection, inflammation, and collagen accumulation are colocalized. A clear relationship has been established between collagen content, prostate stiffness, voiding symptom severity, and resistance to medical therapy in men (26, 27). However, no previous study has determined which cell types are responsible for driving inflammation-mediated prostatic collagen in vivo. We evaluated prostate tissue 7 days after transurethral delivery of E. coli UTI89. The inflammation was confined to the dorsal prostate and was heterogeneous. Collagen was denser in E. coli UTI89-infected mice, particularly in regions with dense prostatic stromal cellularity. We also found that the majority of prostatic procollagen type I-α1 (proCOL1A1)-immunopositive cells within inflammatory lesions were also protein tyrosine phosphatase receptor type C (PTPRC; also known as CD45) immunopositive and α2-smooth muscle actin (ACTA2) immunonegative, suggesting circulating bone marrow derivation as a potential origin of prostatic collagen-producing cells.
MATERIALS AND METHODS
Mice
All experiments were conducted under an approved protocol from the University of Wisconsin Animal Care and Use Committee and in accordance with the National Institutes of Health Guide for the Care and Use of Laboratory Animals. Mice were housed in Udel Polysulfone microisolator cages on racks or in Innocage disposable mouse cages on an Innorack. Room lighting was maintained on 12:12-h light-dark cycles, room temperature was typically 20.5 ± 5°C, and humidity was 30–70%. Mice were fed 8604 Teklad Rodent Diet (Harlan Laboratories, Madison, WI), and food and water were available ad libitum. Cages contained corn cob bedding.
To determine the anatomic regions into which instillation fluid distributes (Fig. 1), we tested multiple instillation volumes using mice of multiple ages and genetic backgrounds (including retired breeders, old stock animals, or genotype-inappropriate animals from other experiments) to follow the 3Rs of humane animal research and reduce animals used for this study. Each instillation volume included one C57BL/6J mouse to ensure no variations due to background strain. All mice were sexually mature adult male mice and included wild-type C57BL/6J (stock no. 000664), wild-type FVB/NJ (stock no. 001800), BALB/c-Tg(S100a4-cre)1Egn/YunkJ (stock no. 012641), Wnt10b-G2aCE (stock no. 028116), B6.Cg-Tg(Gt(ROSA)26Sor-EGFP)I1Able/J (Rosa-GFP) (stock no. 007897), B6.Cg-Gt(ROSA)26Sortm14(CAG-tdTomato)Hze/J (stock no. 007914), 129S/Sv-Ccn2tm2Mae/J (stock no. 030767), and Tet-ON IL-1b (2) mice.
Figure. 1.

The volume of transurethral instillation fluid determines the anatomic distribution of instilled fluid across the male mouse lower urinary tract. A: mouse with lower urinary tract schematic and labeled lower urinary tract anatomic components, including anterior (AP), ventral (VP), dorsolateral (DLP), bladder (Bld), and seminal vesicle (SV). Mice were euthanized, a transurethral catheter (2.5 cm, PE-10) was placed into mice of various genetic backgrounds and strains (see materials and methods), and green Davidson Tissue Dye was instilled. A loose suture was placed around the tip of the penis, the catheter was removed, and the suture was tightened to prevent dye leakage. B: two cuts extending from the pubis to lateral ribs were used to open the abdomen and visualize the urinary tract. Ureters, bladder, seminal vesicles, prostatic lobes, and ductus deferens were visually inspected for green dye. C: instillation of 50 µL of fluid distributed dye to the bladder. D: instillation of 100 µL of fluid distributed dye to the bladder and dorsal prostate. E: instillation of 200 µL of fluid distributed dye to the bladder and multiple prostate lobes. F: instillation of 500 µL distributed dye to the bladder all prostate lobes, seminal vesicle, and ureters.
C57BL/6J mice (stock no. 000664) were used to characterize urinary physiology, stromal cell infiltration, collagen accumulation, and collagen-producing cell types (Fig. 2, Fig. 4, Fig. 5, Fig. 6, Fig. 7, and Fig. 8 and Table 1, Table 2, Table 3, and Table 4). C57BL/6J mice were purchased from Jackson Laboratories (Bar Habor, ME) and transurethrally catheterized at 6−8 wk of age.
Fig. 2.

One hundred microliters of E. coli UTI89 [optical density (OD) 0.80] contains 1–8.2 × 10⁸ colony-forming units (CFU) of E. coli. To determine the range of CFU for E. coli UTI89 culture and transurethral instillation, and to establish biologically significant cutoffs for CFU values in tissue or urine, we measured the concentration of 12 (6 per tube) instillation aliquots originating from two separate culture tubes [tube 1 (lane A) and tube 2 (lane B)]. Culture tubes of inoculation solution were prepared at an OD of 0.80 and were prepared by the same person on the same day and both colonies were taken from a single streaked plate. An image of the culture plate of serial dilutes from two aliquots are depicted to the left of the graph. The graph on the right shows means ± SD. A Shapiro-Wilk test was used to test for normality, and transformation was applied to normalize data. Data could not be normalized using transformation, so the Mann-Whitney test was applied to compare tubes. P < 0.05 was considered statistically significant.
Fig. 4.
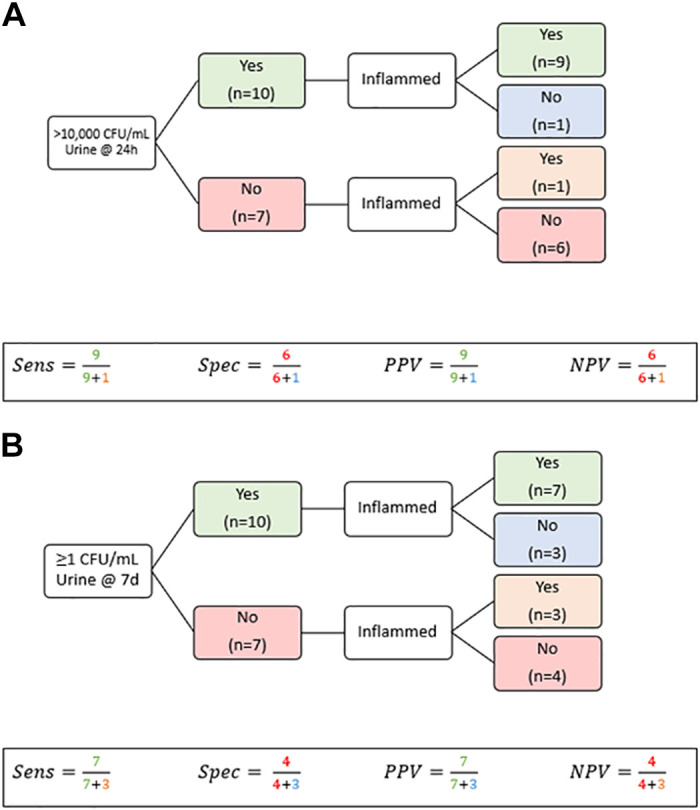
Free catch urine culture can be used to predict prostatic inflammation. Urine was collected and cultured at 1 and 7 days postinstillation and assessed for dorsal prostate inflammation. A: detection of >10,000 colony-forming units (CFU) of E. coli UTI89 in free catch urine culture at 24 h (the clinical cutoff for bacterial infection) had a sensitivity (Sens; 90%), specificity (Spec; 86%), positive predictive value (PPV; 90%), and negative predictive value (NPV; 86%) for dorsal prostate inflammation. B: detection of any CFU of E. coli UTI89 in free catch urine culture at 7 days had a sensitivity (70%), specificity (57%), positive predictive value (70%), and negative predictive value (57%) for dorsal prostate inflammation. Data shown in A and B are from a single cohort of n = 17 mice with urine culture performed at both 24 h and 7 days. Inflammation was assessed on hematoxylin and eosin-stained sections from dorsal prostate lobes collected 7–8 days postinfection.
Fig. 5.

E. coli UTI89 infection results in a low frequency, high volume voiding phenotype. All control and E. coli UTI89-infected C57BL/6J male mice were grouped, regardless of instillation concentration or volume, to maximize sample size compared spontaneous void spot assays end points over time and between E. coli UTI89-infected mice and PBS controls. Included are selected end points that summarize the detailed void spot assay data shown in Tables 1–5 [spot count (A), total area (B), percent area in the corners of the paper (C), and average spot size (D)]. Lines are placed at the mean. A mixed-effects model REML was fit to the data, and Geisser-Greenhouse correction was applied. Results are representative of n = 20–22 per group. P < 0.05 was considered statistically significant. Tx, treatment.
Fig. 6.

Catheterization alone does not impact voiding. We compared void spot assay results obtained 7 days after sterile PBS instillation with results from historical control C57BL/6J male mice of the same age and strain that were not catheterized (42). A: total area. B: number of spots of >4 cm2. Graphs are means ± SD and representative of n = 9–21 per group. A Shapiro-Wilk test was used to test for normality, and transformation was applied to normalize data. Bartlett’s test was used to test for homogeneity of variance. When variance was equal, comparisons between groups were made using ordinary one-way ANOVA followed by Tukey’s multiple-comparisons test. If data could not be normalized through transformation, a Kruskal-Wallis test was applied. P < 0.05 was considered statistically significant.
Fig. 7.

Transurethral instillation of E. coli UTI89 into C57BL/6J male mice results in increased dorsal prostate lobe stromal cell density and collagen accumulation. Histological inflammation was confined to the dorsal prostate, and collagen density was quantified exclusively in this lobe. A: picrosirius red (PSR) staining was conducted to assess dorsal prostate collagen content. Graph shows means ± SD, and results are representative of 6–7 mice/group. A Mann-Whitney test was used to compare groups. B: linear regression analysis was performed to compare dorsal prostate stromal cell number and collagen density. Results are representative of assessment of 21 regions of interest. C: histological inflammation was variable between mice with some E. coli UTI89 infected displaying no inflammation and others with expansive leukocyte recruitment and collagen accumulation. H&E, hematoxylin and eosin.
Fig. 8.
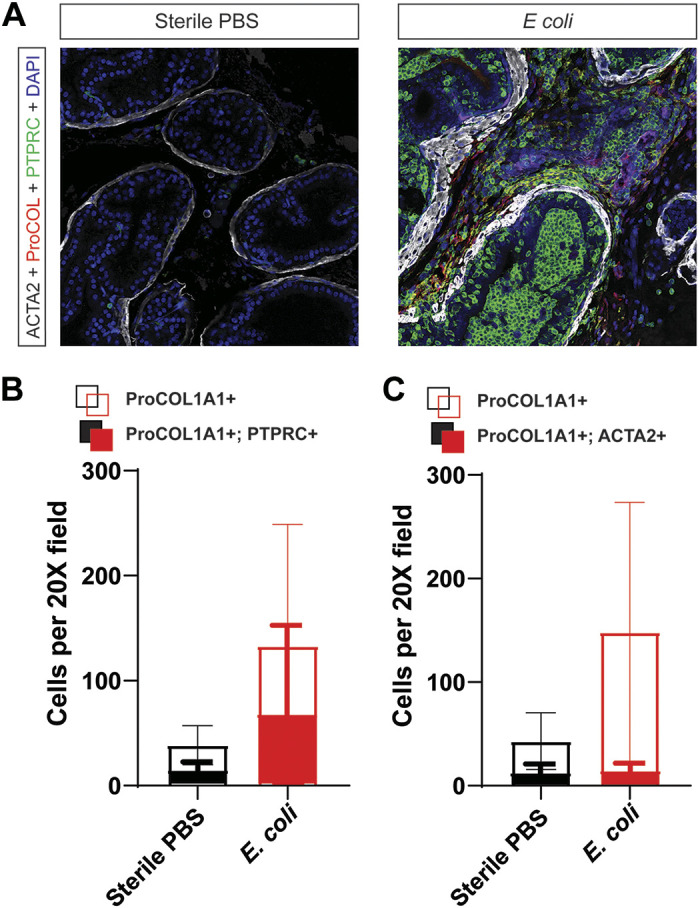
Transurethral instillation of UTI89 increases the density of procollagen type I-α1 (proCOL1A1)+ cells in the C57BL/6J male mouse prostate, and transurethral instillation of UTI89 increases the density of protein tyrosine phosphatase receptor type C (PTPRC)+ proCOL1A1+ cells and decreases the percentage of α2-smooth muscle actin (ACTA2)+ proCol1A1+ cells in the C57BL/6J male mouse prostate. A: immunohistochemical staining for ACTA2, proCol1A1, and PTPRC (also known as CD45) was performed on dorsal prostate sections from E. coli UTI89-infected mice and PBS controls. B and C: infection increased the density of total collagen-producing cells (proCol1A1+) compared with the sterile PBS control (P = 0.0369). B: infection also increased the density of collagen-producing bone marrow--derived cells (P = 0.0420). However, the proportion of collagen-producing immune cells (dual PTPRC+; proCOL1A1+/total proCOL1A1+) was similar between groups (P = 0.1531). C: infection did not alter the density of proCOL1A1+ ACTA2+ cells (P = 0.7233). However, the proportion of collagen-producing ACTA2+ cells (dual ACTA2+; proCOL1A1+/total proCOL1A1+) was significantly lower compared with control (P = 0.0326). Graphs show means ± SD and are representative of 6−7 mice/group. A Shapiro-Wilk test was used to test for normality, and transformation was applied to normalize data. Bartlett’s test was used to test for homogeneity of variance. When variance was equal, comparisons between groups were made using ordinary one-way ANOVA followed by Tukey’s multiple-comparisons test. If data could not be normalized through transformation, a Kruskal-Wallis test was applied. P < 0.05 was considered statistically significant.
Table 1.
Spontaneous void behavior 1 day posturethral instillation with sterile PBS (control) or PBS containing Escherichia coli UTI89
| 50 L Sterile PBS Control (n = 8) |
100 L Sterile PBS Control (n = 12) |
All Sterile PBS Control (n = 22) |
50 L PBS With OD 0.35 E. coli UTI89 (n = 8) |
100 L PBS With OD 0.7 E. coli UTI89 (n = 12) |
All PBS With E. coli UTI89 (n = 22) |
|
|---|---|---|---|---|---|---|
| Count | 15.25 (10.87) | 21.92 (36.15) | 19.77 (27.16) | 6.125 (4.970) | 13.17 (13.60) | 13.23 (14.27) |
| Total area, cm2 | 18.32 (11.88) | 16.54 (12.64) | 16.67 (11.80) | 13.45 (16.49) | 12.45 (6.532) | 15.03 (12.91) |
| Percent area in center | 7.907 (21.01) | 3.434 (5.772) | 7.287 (16.90) | 13.61 (31.72) | 14.81 (29.92) | 13.73 (28.50) |
| Percent area in corners | 60.46 (43.76) | 63.27 (28.87) | 59.95 (34.31) | 37.76 (40.05) | 41.37 (40.54) | 39.22 (37.53) |
| Spots of a certain size, cm2 | ||||||
| 0−0.1 | 12.75 (9.867) | 17.17 (29.69) | 15.68 (22.36) | 4.625 (4.069) | 11.67 (13.21) | 11.41 (13.32) |
| 0.1−0.25 | 0.6250 (1.061) | 2.333 (5.990) | 1.591 (4.469) | 0.3750 (0.5175) | 0.08333 (0.2887) | 0.3636 (0.6580) |
| 0.25−0.5 | 0.5000 (0.5345) | 0.5000 (0.9045) | 0.7727 (1.572) | 0.1250 (0.3536) | 0.08333 (0.2887) | 0.1818 (0.3948) |
| 0.5−1 | 0.2500 (0.4629) | 0.5833 (0.9962) | 0.5000 (0.8591) | 0.1250 (0.3536) | 0 (0) | 0.09091 (0.2942) |
| 1−2 | 0 (0) | 0.08333 (0.2887) | 0.04545 (0.2132) | 0.1250 (0.3536) | 0 (0) | 0.04545 (0.2132) |
| 2−3 | 0 (0) | 0.08333 (0.2887) | 0.04545 (0.2132) | 0 (0) | 0.08333 (0.2887) | 0.04545 (0.2132) |
| 3−4 | 0 (0) | 0 (0) | 0.04545 (0.2132) | 0 (0) | 0.1667 (0.5774) | 0.09091 (0.4264) |
| 4+ | 1.125 (0.6409) | 1.167 (0.9374) | 1.091 (0.8112) | 0.7500 (0.8864) | 1.083 (0.5149) | 1.000 (0.6901) |
Values are averages (SD). Results of the void spot assay are shown. OD, optical density.
Table 2.
Spontaneous void behavior 3 days posturethral instillation with sterile PBS (control) or PBS containing Escherichia coli UTI89
| 50 L Sterile PBS Control (n = 8) |
100 L Sterile PBS Control (n = 11) |
All Sterile PBS Control (n = 21) |
50 L PBS With OD 0.35 E. coli UTI89 (n = 8) |
100 L PBS With OD 0.7 E. coli UTI89 (n = 11) |
All PBS With E. coli UTI89 (n = 21) | |
|---|---|---|---|---|---|---|
| Count | 136.6 (221.6) | 20.55 (17.03) | 64.19 (144.0) | 41.63 (61.91) | 9.455 (13.37) | 22.43 (40.94) |
| Total area, cm2 | 21.33 (6.374) | 23.40 (14.08) | 21.44 (11.63) | 26.13 (15.49) | 21.75 (13.83) | 25.60 (15.27) |
| Percent area in the center of the paper | 6.374 (11.03) | 9.612 (15.64) | 8.674 (13.61) | 1.168 (1.619) | 17.77 (31.76) | 9.996 (23.98) |
| Percent area in corners of the paper | 61.36 (28.20) | 51.88 (29.38) | 57.20 (28.08) | 46.11 (34.84) | 63.67 (22.24) | 56.28 (26.72) |
| Spots of a certain size, cm2 | ||||||
| 0−0.1 | 116.1 (197.0) | 16.18 (15.4) | 53.71 (127.4) | 34.13 (48.85) | 6.909 (12.45) | 17.95 (32.98) |
| 0.1−0.25 | 14.38 (30.18) | 1.182 (1.662) | 6.238 (19.05) | 3.750 (8.294) | 0.1818 (0.4045) | 1.619 (5.210) |
| 0.25−0.5 | 3.75 (5.825) | 0.5455 (0.6876) | 1.905 (3.807) | 1.375 (2.722) | 0.3636 (0.6742) | 0.7143 (1.765) |
| 0.5−1 | 1.250 (2.375) | 0.4545 (0.6876) | 0.7143 (1.554) | 0.3750 (1.061) | 0.2727 (0.4671) | 0.3333 (0.7303) |
| 1−2 | 0.2500 (0.7071) | 0.1818 (0.4045) | 0.1905 (0.5118) | 0.2500 (0.4629) | 0.1818 (0.4045) | 0.1905 (0.4024) |
| 2−3 | 0 (0) | 0.1818 (0.4045) | 0.09524 (0.3008) | 0.1250 (0.3536) | 0.1818 (0.4045) | 0.1429 (0.3586) |
| 3−4 | 0 (0) | 0 (0) | 0.000 (0.000) | 0.1250 (0.3536) | 0.09091 (0.3015) | 0.09524 (0.3008) |
| 4+ | 0.8750 (0.6409) | 1.818 (1.250) | 1.333 (1.111) | 1.500 (0.7559) | 1.273 (0.7862) | 1.381 (0.7400) |
Values are averages (SD). Results of the void spot assay are shown. OD, optical density.
Table 3.
Spontaneous void behavior 5 days posturethral instillation with sterile PBS (control) or PBS containing Escherichia coli UTI89
| 50 L Sterile PBS Control (n = 8) |
100 L Sterile PBS Control (n = 11) |
All Sterile PBS Control (n = 21) |
50 L PBS With OD 0.35 E. coli UTI89 (n = 8) |
100 L PBS With OD 0.7 E. coli UTI89 (n = 11) |
All PBS With E. coli UTI89 (n = 21) | |
|---|---|---|---|---|---|---|
| Count | 41.50 (40.10) | 19.50 (24.95) | 27.18 (31.55) | 38.13 (22.64) | 12.55 (20.87) | 23.29 (23.43) |
| Total area, cm2 | 23.76 (7.168) | 14.11 (9.768) | 17.59 (10.32) | 25.20 (12.69) | 28.26 (19.41) | 26.78 (16.04) |
| Percent area in the center of the paper | 8.175 (16.53) | 1.611 (3.119) | 7.919 (20.87) | 3.491 (4.650) | 4.979 (8.877) | 3.961 (6.942) |
| Percent area in the corners of the paper | 65.38 (27.77) | 75.18 (29.03) | 67.81 (30.83) | 34.65 (27.82) | 48.81 (36.18) | 46.05 (32.77) |
| Spots of a certain size, cm2 | ||||||
| 0−0.1 | 30.75 (24.45) | 16.92 (24.04) | 21.68 (23.69) | 33.50 (19.49) | 9.909 (20.94) | 19.81 (21.94) |
| 0.1−0.25 | 5.750 (12.68) | 0.9167 (1.311) | 2.636 (7.768) | 1.500 (1.852) | 0.1818 (0.4045) | 0.8095 (1.401) |
| 0.25−0.5 | 1.625 (3.021) | 0.2500 (0.8660) | 0.7727 (1.974) | 1.250 (1.753) | 0.1818 (0.4045) | 0.6190 (1.203) |
| 0.5−1 | 1.125 (1.727) | 0.1667 (0.3892) | 0.5455 (1.143) | 0.2500 (0.4629) | 0.3636 (0.5045) | 0.2857 (0.4629) |
| 1−2 | 0.1250 (0.3536) | 0 (0) | 0.04545 (0.2132) | 0 (0) | 0 (0) | 0.000 (0.000) |
| 2−3 | 0 (0) | 0.08333 (0.2887) | 0.04545 (0.2132) | 0 (0) | 0 (0) | 0.000 (0.000) |
| 3−4 | 0.1250 (0.3536) | 0.08333 (0.2887) | 0.09091 (0.2942) | 0 (0) | 0 (0) | 0.000 (0.000) |
| 4+ | 2.000 (1.195) | 1.083 (0.6686) | 1.364 (1.002) | 1.625 (0.9161) | 1.909 (1.044) | 1.762 (0.9437) |
Values are averages (SD). Results of the void spot assay are shown. OD, optical density.
Table 4.
Spontaneous void behavior 7 days posturethral instillation with sterile PBS (control) or PBS containing Escherichia coli UTI89
| 50 L Sterile PBS Control (n = 8) |
100 L Sterile PBS Control (n = 11) |
All Sterile PBS Control (n = 21) |
50 L PBS With OD 0.35 E. coli UTI89 (n = 8) |
100 L PBS With OD 0.7 E. coli UTI89 (n = 11) |
All PBS With E. coli UTI89 (n = 21) | |
|---|---|---|---|---|---|---|
| Count | 19.75 (17.65) | 46.67 (78.86) | 40.81 (64.88) | 37.00 (21.39) | 7.273 (10.43) | 19.50 (20.53) |
| Total area, cm2 | 11.26 (16.11) | 17.54 (10.25) | 15.94 (13.25) | 26.14 (14.10) | 29.38 (13.37) | 28.47 (13.25) |
| Percent area in the center of the paper | 1.936 (2.531) | 5.121 (8.867) | 4.554 (7.643) | 8.606 (15.36) | 7.314 (9.500) | 7.159 (11.25) |
| Percent area in the corners of the paper | 44.74 (38.97) | 63.44 (31.63) | 55.72 (34.16) | 54.14 (31.55) | 55.83 (29.51) | 58.00 (29.16) |
| Spots of a certain size, cm2 | ||||||
| 0−0.1 | 17.75 (15.79) | 37.08 (64.06) | 31.81 (50.60) | 31.57 (18.12) | 3.909 (9.016) | 15.20 (18.28) |
| 0.1−0.25 | 0.6250 (1.061) | 5.583 (13.83) | 5.143 (12.71) | 2.000 (3.162) | 0.3636 (0.9244) | 1.050 (2.064) |
| 0.25−0.5 | 0.1250 (0.3536) | 1.333 (2.229) | 1.381 (3.008) | 1.286 (1.254) | 0 (0) | 0.5000 (0.9459) |
| 0.5−1 | 0.2500 (0.7071) | 0.4167 (0.6686) | 0.6667 (1.592) | 0.4286 (0.5345) | 0 (0) | 0.1500 (0.3663) |
| 1−2 | 0 (0) | 0.3333 (0.7785) | 0.2857 (0.7171) | 0 (0) | 0.09091 (0.3015) | 0.1000 (0.3078) |
| 2−3 | 0.1250 (0.3536) | 0.4167 (0.7930) | 0.2857 (0.6437) | 0 (0) | 0 (0) | 0.05000 (0.2236) |
| 3−4 | 0.1250 (0.3536) | 0.8333 (0.2887) | 0.09524 (0.3008) | 0 (0) | 0.1818 (0.4045) | 0.1500 (0.3663) |
| 4+ | 0.7500 (1.165) | 1.417 (0.9962) | 1.143 (1.062) | 1.714 (0.7559) | 2.727 (0.7862) | 2.300 (0.9234) |
Values are averages (SD). Results of the void spot assay are shown. OD, optical density.
Escherichia coli
Experiments involved E. coli UTI89 (31), a strain of uropathogenic Escherichia coli recovered from a human patient with cystitis (24) and transformed with a pCOMGFP plasmid (48) to confer green fluorescent protein expression and kanamycin resistance. Prior to inoculation, E. coli UTI89 were grown as a static culture for 18 h in antibiotic free Luria-Bertani (LB) broth at 37°C. OD was determined before mouse inoculation. The culture was centrifugated for 15 min at 1,157 rcf, and the resulting pellet was resuspended into sterile PBS for instillation.
Transurethral Instillation
At 6−8 wk of age, C57BL/6J mice were anesthetized with isoflurane and instilled with sterile PBS (control) or PBS containing E. coli UTI89 via transurethral catheter as previously described (25).
Tissue Dye Instillation
Mice were euthanized, a transurethral catheter (2.5 cm, PE-10) was placed, and green Davidson Tissue Dye was instilled (Fig. 1A). A loose suture was placed around the tip of the penis, the catheter was removed, and the suture was tightened to prevent dye leakage. Two cuts extending from pubis to lateral ribs were used to open the abdomen and visualize the urinary tract (Fig. 1B). Ureters, bladder, seminal vesicles, prostatic lobes, and ductus deferens were visually inspected for green dye. The instillation fluid was considered to have distributed to a lower urinary tract compartment if staining was visibly apparent in any part of that compartment, including a single duct of the prostate lobe.
Free Catch Urine Culture
Mice were restrained using a two-finger tail grip and placed in a squat posture over a sterile petri dish. Most mice urinated immediately. Those that did not urinate were scruffed with the handlers opposite hand while in the squat posture. If the mouse still did not urinate, the handler rotated the scruffing hand so the mouse was in dorsal recumbency in the palm of the hand. The handler’s thumb and index finger were swept from the lateral abdomen (near the kidneys) toward the pubis applying slight pressure to locate and apply pressure to the bladder. The mouse was positioned above the petri dish, and the bladder was expressed. Collected urine was serial diluted in sterile PBS and plated on LB agar containing kanamycin (50 µg/mL). Culture colony-forming units (CFU) were calculated per milliliter of urine.
Prostate Tissue Culture
Mice were euthanized, placed on sterile surgical drape, and drenched in 70% ethanol. Because our goal was to determine the distribution and severity of E. coli infection, great care was taken during dissection to reduce the risk of cross-contaminating organs or surgical instruments. A sterile scissors was used to open the body cavity and expose the lower urinary tract. Intestines were moved aside with a sterile gloved finger. Needle tipped forceps were used to grasp the bladder and pull up while a second sterile scissors was used to sever the bladder ligament and vas deferens. The same forceps were used to pass sterile silk suture under the dorsal surface of the urethra at the pelvic inlet. Hand ties were placed to close the urethra. The same scissors used to cut the bladder ligament was used to sever the urethra caudal to the suture tie. The strings of the urethra suture were used to gently exteriorize the bladder and attached seminal vesicle and prostate lobes from the abdomen and place in a sterile petri dish containing sterile PBS. The ureters were severed due to tension during removal. The same forceps used to grasp the bladder earlier was used to adjust the position of the tissue in the dish. A new clean needle tipped forceps was used to remove the lobes by grasping the urethral attachment and pulling. The left lobes were removed first, ventral lobe, then dorsolateral, and finally anterior, and the right lobes were then removed in the same order. Each lobe was placed in a sterile 1.5-mL tube with 100 µL of sterile PBS and hand ground with a sterile pestle. The supernatant was removed and placed in a 96-well plate for serial dilution (10-fold dilution series), and 5 µL were plated per dilution on LB agar containing kanamycin (50 µg/mL). Scissors and forceps were sterilized between mice using a bead sterilizer, and a new sterile surgical drape, sterile suture, sterile petri dish, and sterile PBS were used for each mouse. CFU values were calculated per milliliter of supernatant.
Urinary Function Testing
VSA and cystometry were performed and analyzed as previously described (42). We followed the recommended guidelines of reporting VSA data (19, 21, 52). VSA was performed in the vivarium where mice were housed. Whatman grade 540 (no. 057163-W, Fisher Scientific) filter papers (27 × 16 cm) were placed in the bottom of Udel Polysulfone microisolator cages. Mice were placed in the cage (singly housed) with food ad libitum but no water for 4 h starting from 8 to 11 AM Greenwich mean time. Filter papers were dried and imaged with an Autochemi AC1 Darkroom ultraviolet imaging cabinet (UVP, Upland, CA) equipped with an Auto Chemi Zoom lens 2UV and an epi-illuminator. Image capture settings were adjusted using UVP VisonWorksLS image acquisition software. Images were captured using an Ethidium Bromide filter set (570–640 nm) and 365-nm epi-illumination. Void Whizzard was downloaded from http://imagej.net/Void_Whizzard and run according to the user guide (52). Analyzed parameters included total spot count, total void area (cm2), percent area in the center of the paper, percent area in corners of the paper, and mass distribution of spots (0–0.1, 0.1–0.25, 0.25–0.5, 0.5–1, 1–2, 2–3, 3–4, and 4+ cm2).
Cystometry was performed with minimal alterations to previously published protocols and following best practices (5, 12, 37). Mice were anesthetized with urethane (1.43 g/kg sc). Thirty minutes after urethane dosing, an incision was made in the ventral abdomen to expose the bladder. Bladder length and diameter were measured for volume calculation. A purse-string suture was placed in the bladder dome. Polyethylene cystostomy tubing (PE-50, outer diameter: 0.965 mm and inner diameter: 0.58 mm) was inserted into the bladder through the center of the suture, and the purse string was secured to hold the tubing in place with 2–3 mm of tubing within the bladder. The abdominal wall and skin were closed separately in a simple interrupted pattern. The exterior tubing was secured to the ventral abdominal skin with two simple interrupted sutures. Mice were placed on a heat pad for 1 h after the procedure.
The exposed cystostomy tube was connected to a three-way stopcock, and the other two arms of the stopcock were connected to an infusion pump (Harvard Apparatus, Holliston, MA) and pressure transducer (Memscap). Intravesical pressure was recorded continuously using a PowerLab data collection system (ADI Instruments, Colorado Springs, CO). Room temperature sterile saline (0.9%) was infused into the bladder at a rate of 0.8 m/h.
Mice were placed in lateral recumbency above a force transducer (model FT03, Grass Instruments) attached to a 3D-printed urine collection funnel. The force transducer was calibrated with known volumes of saline to create a pressure-volume conversion. The mass of voided urine was recorded continuously using PowerLab.
At least 1 h of voiding activity was recorded. Three to five consecutive voids, occurring after stabilization of micturition cycles, were used for analyses. Multiple parameters were measured as previously defined (42) and included void duration, intervoid interval, baseline pressure, normalized threshold pressure, normalized peak void pressure, number of nonvoiding contractions, voided volume, compliance, volume flow rate, mass-based flow rate, and efficiency.
Tissue Preparation
Lower urinary tracts were collected for histology 7 or 8 days postinstillation. Tissues were prepared, fixed, and sectioned as previously described (28, 50, 51). To remove the lower urinary tract, ureters were cut at the entry to the bladder wall, the vas deferens was cut at the entry to the bladder neck, and the urethra was cut immediately dorsal to the pubic symphysis. Tissues were prepared for embedding in one of three ways. For the first method, the seminal vesicles, ampullary gland, anterior prostate, and hemiventral, dorsal, and lateral prostates were removed. The bladder and urethra were separated at the level of the bladder neck with a single transverse cut. Urethras with hemiventral, dorsal, and lateral prostates attached were fixed in 4% paraformaldehyde, washed in PBS, and placed in arrays using 1% bactoagar. The array was dehydrated in ethanol, cleared in xylene, and infiltrated with paraffin. Urethras were serially sectioned starting at the bladder neck in the transverse plane (41). For the second method, hemi-dorsal prostate lobes were removed, fixed in 4% paraformaldehyde, washed in PBS, and placed in arrays using 1% bactoagar. The array was dehydrated in ethanol, cleared in xylene, and infiltrated with paraffin. The lobes were sectioned in the plane yielding the greatest surface area of the dorsal prostate. For the third method, hemiseminal vesicle and prostate lobes were removed as well as the ampullary gland. The remaining bladder, urethra, and hemiseminal vesicle and prostate lobes were fixed in 4% paraformaldehyde, washed in PBS, dehydrated in ethanol, cleared in xylene, and infiltrated with paraffin. Sections were cut in the sagittal plane. All sections were 5 μm thick and mounted on Superfrost Plus Gold Slides (ThermoFisher Scientific, Waltham, MA).
Hematoxylin and Eosin Staining
Hematoxylin and eosin staining was performed by the Histology Service in the School of Veterinary Medicine at the University of Wisconsin-Madison. Stains were imaged using a BZ-X710 digital microscope (Keyence, Itasca, IL) fitted with a ×20 (PlanFluor, numerical aperture: 0.45) objective.
Collagen Quantification With Picrosirius Red Staining
Picrosirius red staining (PSR), fluorescent imaging, and quantitation were performed as previously described (53). Stained tissue sections were cleared with xylene and mounted with Richard-Allan toluene-based mounting medium. PSR staining was then imaged using a BZ-X710 digital microscope (Keyence, Itasca, IL) fitted with a ×20 (PlanFluor, numerical aperture: 0.45) objective and illuminated by full spectrum light filtered with Texas red and FICZ filters.
Specific collagen staining was determined by subtracting the tissue autofluorescence (FICZ channel) from the PSR fluorescence (Texas red channel) using the “image calculator” function of ImageJ. Additional fluorescence from ductal lumens was removed manually. Total image area was defined as the pixel area of the image. Prostatic stromal area was calculated by tracing exterior boundaries of lobes and the duct lumen, calculating the pixel area, and subtracting the area from the total pixel area of the image. Collagen density was defined as the PSR pixel area divided by the stromal tissue area. Analysis was performed on 3 images/mouse and 5−9 mice/group.
Immunohistochemistry and Cell Counts
Immunohistochemistry was conducted on dorsal prostate tissue sections from mice in the sterile PBS control group and the E. coli UTI89-infected group. Tissue sections were deparaffinized with xylene and 50%, 75%, and 100% ethanol. Tissues were immersed in citrate buffer (pH 6.0) heated in a microwave for epitope decloaking. Tris-buffered saline containing 0.1% Tween 20 and 5% donkey serum was used as a blocking reagent, and primary and secondary antibodies were diluted in blocking reagent. Antibodies and dilutions were as follows: proCOL1A1 [Developmental Studies Hybridoma Bank, SP1.D8-c (concentrated, 238 µg/mL), 1:1,000], PTPRC (also known as CD45, AB10558, Abcam, RRID: AB 442810, 1:500), ACTA2 (SMA; PA5-18292, Invitrogen, RRID: AB 10980764, 1:100), anti-goat 488 (no. 705-545-003, Jackson ImmunoResearch, RRID: AB_2340428, 1:250), anti-rabbit Cy3 (no. 711-165-152, Jackson ImmunoResearch, RRID: AB_2307443, 1:250), anti-mouse 647 (no. 715-605-150, Jackson ImmunoResearch, RRID: AB_2340846, 1:250), and DAPI. Antibody validation information can be found at https://doi.org/10.25548/17-3ZTY (49). Sections were imaged using an SP8 Confocal Microscope (Leica, Wetzlar, Germany) fitted with a ×20 oil immersion objective (HC PL Apo CS2, numerical aperture 0.75, Leica). Samples were excited and detected using the recommended settings for each secondary antibody fluorophore. Images were captured at 1024 × 1024 resolution using LASX 8 software (Leica). Three images of the dorsal prostate were captured per mouse, and five to nine mice were imaged per group.
Collagen-producing cells were defined as proCOL1A1 immunopositive. ProCOL1A1 is the precursor to collagen type I-α1, the most abundant collagen subtype in the extracellular matrix (36). Bone marrow-derived cells were defined as PTPRC immunopositive. Myofibroblasts were defined as ACTA2 immunopositive and differentiated from fibroblasts, which were defined as ACTA2 immunonegative. DAPI was used to identify cell nuclei. Cells lying within blood vessels, prostate ducts, or the prostate ductal epithelium were excluded. All remaining nucleated cells were counted, and all cells that were partially or completely stained were considered positive. Cells were manually counted per image using the ImageJ cell counter (43).
Statistical Analysis
Statistical analyses were performed with Graph Pad Prism 8.0.2. Differences were considered significant at the P < 0.05 level. A Shapiro-Wilk test was used to test for normality, and transformation was applied to normalize data. Bartlett’s test was used to test for homogeneity of variance. For group comparisons, Welsh’s ANOVA was applied when variance was unequal followed by Dunnett's T3 multiple-comparisons test. When variance was equal, comparisons between groups were made using ordinary one-way ANOVA followed by a Tukey’s multiple-comparisons test. A Kruskal-Wallis test was applied when data could not be normalized through transformation. For pairwise comparisons, Student’s t test was applied when variances were equal and a t test with Welsh’s correction was applied when variances were unequal between groups. A Mann-Whitney test was performed when data could not be normalized through transformation. A Wilcoxon matched-pairs signed rank test was performed for matched pairs. A Fisher’s exact test was performed to determine if there were associations between infection conditions, catheter-induced bleeding and leaking, and biomarkers of prostatic inflammation. Linear regression was performed to correlate stromal cell density with pixel density. For the results shown in Fig. 5 only, a mixed-effects model REML was fit to the data and Geisser-Greenhouse correction was applied.
RESULTS AND DISCUSSION
The Volume of Transurethral Instillation Fluid Determines How Widely the Instilled Fluid Distributes Across the Male Mouse Lower Urinary Tract
A common goal of urological researchers using the bacterial infection model is to increase its consistency by identifying factors that drive or enhance prostatic inflammation. Elkahwaji et al. (11) were among the first to deliver bacteria transurethrally to male mice for the purpose of driving prostate inflammation and reported heterogenous and inconsistent infection rates. Volumes of instillation fluid in previous studies ranged from 10 to 200 µL (6, 39). One reason for the large range of instillation volumes is that it is unclear how bacteria gain access to the prostate. Some believe that large volumes of instilled fluid create hydrostatic pressure and drive bacteria into the prostate. Bacteria could also enter the prostate as reflux in voided urine or actively “crawl” into the prostate through swimming, swarming, or twitching motility.
Here, we tested the impact of instilled volume on anatomic distribution of instilled fluid, which may, in turn, influence the distribution of inflammation. Three mice were instilled with 100 µL of undiluted tissue dye, and dye was observed in the bladder (3/3 mice, 100%) and dorsal prostate (3/3 mice, 100%; Fig. 1D). The tissue dye was diluted in PBS to decrease viscosity and delivered via a transurethral catheter into freshly euthanized mice in a volume of 50, 100, 200, and 500 µL (3 mice/volume). The 50-µL instillation volume resulted in the visual appearance of dye in the bladder (3/3 mice, 100%) and minimal infiltration of the dorsolateral prostate (1/3 mice, 33.3%) but not in the anterior (0/3 mice, 0%) or ventral (0/3 mice, 0%) prostate (Fig. 1C). The 100-µL instillation volume resulted in the appearance of dye in the bladder (3/3 mice, 100%) and dorsolateral prostate (3/3 mice, 100%) but not in the anterior (0/3 mice, 0%) or ventral (0/3 mice, 0%) prostate. The 200-µL instillation volume resulted in the appearance of dye in the bladder (3/3 mice, 100%), dorsolateral (3/3 mice, 100%), anterior prostate (3/3 mice, 100%), and seminal vesicles (3/3 mice, 100%) but not in the ventral (0/3, 0%) prostate (Fig. 1E). The 500-µL instillation volume resulted in the appearance of intense dye staining in the dorsolateral prostate (3/3 mice, 100%), anterior prostate (3/3 mice, 100%), ventral prostate (3/3, 100%), seminal vesicles (2/3 mice, 66.67%), and ureters (2/3 mice, 66.67%; Fig. 1F).
We conclude that urethral instillation fluid volumes of ≤50 µL do not consistently distribute to the prostate. Prostate inflammation caused by instilled E. coli solution volumes of ≤50 µL likely occurs from bacteria entering prostatic ducts through reflux voiding or through swimming, swarming, or twitching motility. Urethral instillation volumes of ≥100 µL directly infiltrate the prostate. A volume of 100 µL distributes specifically to the dorsolateral prostate, while 200- and 500-µL volumes distribute to multiple lobes and the 500-µL volume also distributes to ureters. We do not recommend instilling ≥500 µL of fluid into the urethra unless infection of the ureters and ascending infection of the kidneys is desired.
One Hundred Microliters of E. coli UTI89 (OD 0.80) Contains 1–8.2 × 10⁸ CFU of E. coli
A generic E. coli growth curve is often used to convert OD to CFU concentrations and reported as a single value for the number of E. coli colonies delivered in a transurethral bolus. Such a practice fails to account for bacterial strain specific growth curves and individual laboratory growth conditions and masks the inherent biological variability of the model. To determine the range of CFU values for E. coli UTI89 culture and transurethral instillation, and to establish biologically significant cutoffs for CFU values in tissue or urine, we measured the concentration of 12 (6 per tube) instillation aliquots originating from two separate culture tubes.
A loop of frozen E. coli UTI89 was streaked for isolation on a LB kanamycin agar plate and incubated at 37°C for 24 h. Streaked plates were stored at 4°C for up to 2 mo. One day before instillation, a single colony of E. coli UTI89 was transferred to 5 mL of antibiotic-free LB broth and incubated for 18 h at 37°C. OD was then determined using 1 mL of culture solution. The remaining 4 mL of culture solution was centrifuged at 1157 rcf for 15 min at 25°C. The supernatant was removed with gentle suction, taking care not to disturb the E. coli UTI89 pellet. The pellet was suspended in sterile PBS. Two culture tubes (tube 1 and tube 2) of inoculation solution at an OD of 0.80 were prepared by the same person on the same day, and both colonies were taken from a single streaked plate. CFU values per 100 µL sample ranged from 1 to 8.2 × 10⁸ CFU. The difference between tubes approached significance (mean of 2.06 × 10⁸ in tube 1 and 5.33 × 10⁸ in tube 2, P = 0.0584; Fig. 2). Although the two tubes approached significantly different sample CFU counts, they remained within one order of magnitude of each other.
Based on our results, we recommend using a cutoff of at least one order of magnitude a difference when comparing CFU counts between groups, as differences less than this may be due to the intrinsic variability of inoculate samples rather than true biological differences.
The Concentration of E. coli in Iinstillation Fluid Determines Acute Prostatic CFU Load
A range of E. coli concentrations have been delivered transurethrally by research groups to study mouse prostatic inflammation (6, 39). Here, we tested if the E. coli UTI89 concentration in instillation fluid determines the severity of prostatic infection and we determined the minimum concentration for significant infection of the dorsolateral prostate.
Mice were instilled with 100 µL sterile PBS (OD 0) or PBS containing E. coli UTI89 (OD 0.2, 0.4, or 0.8). Mice were euthanized within 1 min of instillation, and the right dorsolateral, left dorsolateral, right ventral, left ventral, right anterior, and left anterior prostate were collected, homogenized, and plated in serial dilution to determine CFU per mL prostatic tissue homogenate. Two to five mice were instilled per group, and six tissue homogenates were prepared from each mouse.
An inoculate of OD 0.8 resulted in more bacterial CFU in the dorsolateral prostate than an inoculate of OD 0.2 (P = 0.0017; Fig. 3A). An inoculate of OD 0.4 resulted in more CFU in the dorsolateral (P = 0.0170; Fig. 3A) and anterior (P = 0.0497; Fig. 3C) prostate than an inoculate of OD 0.2. Inoculates above OD 0.4 did not result in more CFU than an inoculate of OD 0.4 in any lobes (Fig. 3). Additionally, there was an overall trend toward an increase in CFU in left hemi prostate lobes compared with right hemi prostate lobes (P = 0.0804; Fig. 3D).
Fig. 3.

Concentration of E. coli in instillation fluid determines acute prostatic colony-forming unit (CFU) load. C57BL/6J male mice were instilled with sterile PBS [optical density (OD) 0] or PBS containing graded concentrations of E. coli (OD 0.2, 0.4, or 0.8). Mice were euthanized within 1 min of instillation. Prostate lobes were collected, homogenized, and plated in serial dilution to determine CFU per mL tissue homogenate. Graphs show means ± SD. The mouse prostate contains bilaterally symmetrical prostate lobes, and for the purposes of this figure, half of one lobe (hemi prostate) was used as the statistical unit. Results are representative of 4–10 hemi prostate lobes from 2−5 mice/group and 2 hemi prostate lobes/mouse. For A−C, the Shapiro-Wilk test was used to test for normality, and transformation was applied to normalize data. Bartlett’s test was used to test for homogeneity of variance. Welsh’s ANOVA was applied when variance was unequal followed by Dunnett's T3 multiple-comparisons test. When variance was equal, comparisons between groups were made using ordinary one-way ANOVA followed by Tukey’s multiple-comparisons test. For D, a Wilcoxon matched-pairs signed rank test was performed to compare right to left in each lobe (dorsolateral, ventral, and anterior) in each mouse instilled with inoculate (OD 0.2–0.8). P < 0.05 was considered statistically significant. P < 0.10 is shown.
Our findings suggest a threshold bacterial concentration in the instillation fluid (OD 0.4 for E. coli UTI89) is needed to achieve significant prostate infection, and further increases in the instillation fluid bacterial concentration (up to OD 0.8) do not increase CFU in the prostate. The dorsolateral prostate is susceptible to E. coli UTI89 colonization and is also the lobe where instillation fluid is most readily distributed.
Free Catch Urine Culture Can Be Used to Predict Prostatic Inflammation
Prostate inflammation in men presents as acute, chronic, or episodic (45), raising a need to determine molecular and cellular phenotypes during inflammation and after resolution. It is particularly challenging to study the consequences of inflammation after resolution because prostate inflammation from transurethral instillation of E. coli is variable in penetrance and severity. We tested whether bacterial load in free catch urine, captured 1 and 7 days after transurethral instillation of E. coli UTI89, could be used as a noninvasive biomarker to predict which mice will develop or have prostate inflammation.
Urine was collected and cultured at 1 and 7 days postinstillation and assessed for dorsal prostate inflammation. Detection of >10,000 CFU of E. coli UTI89 in free catch urine culture at 24 h (the clinical cutoff for bacterial infection) had a sensitivity (90%), specificity (86%), positive predictive value (90%), and negative predictive value (86%) for dorsal prostate inflammation (Fig. 4A). Detection of any CFU of E. coli UTI89 in free catch urine culture at 7 days had a sensitivity (70%), specificity (57%), positive predictive value (70%), and negative predictive value (57%) for dorsal prostate inflammation (Fig. 4B).
A free catch urine culture at 24 h after bacterial instillation appears to be an effective noninvasive biomarker to predict which mice will display dorsal prostate inflammation 6 days later. We used current clinical recommendations of cutoffs for diagnosing urinary tract infection in veterinary practice, and determining bacterial load in free catch urine provides a robust means for tracking mice with a probable inflammatory event over time, including timepoints after inflammation and colonization have resolved.
Larger Inoculation Volumes and E. coli Concentrations Do Not Change the Incidence of Bleeding, Leaking, or Irregular Voiding Associated With Catheter Placement
A criticism of delivering E. coli to establish prostate inflammation and alter urinary voiding behavior is that it requires catheterization and instillation of fluid. There is a concern that fluid loading the urinary tract will influence voiding by damaging the bladder, prostate, and urethra. Because of this concern, some researchers use small volumes of instillation fluid and rely on reflux urine or swimming, swarming, or twitching of bacteria to attain prostate infection. Other researchers use a large instillation volume to directly infuse bacteria into the prostate. We used two methods of bacterial instillation: one low volume (50 µL of sterile PBS containing E. coli UTI89 OD 0.35, which we expect does not deliver bacteria directly into the prostate based on outcomes of dye instillation experiments shown in Fig. 1) and one high volume (100 µL of sterile PBS containing E. coli UTI89 OD 0.7, which we expect directly infects the prostate lobe based on the dye instillation outcomes shown in Fig. 1). Using these two methods, we examined the influence of the inoculation method on the incidence of catheter associated bleeding and leaking, the predicted efficiency of attaining dorsal prostate inflammation using free catch urine culture, and urinary function as measured by VSA 1, 3, 5, and 7 days postinstillation.
We collected free catch urine for culture 1 and 7 days postinstillation and plated 10 µL of urine on LB kanamycin+ plates. The presence of >10,000 CFU/mL was considered a “clinical” infection 1 day postinstillation. The presence of any colonies after 24-h incubation at 37°C was considered positive at 7 days postinstillation. There was not a significant association between “clinical” infection and instillation method at 1 day postinstillation. 54.55% of mice instilled with 100 µL of sterile PBS containing E. coli UTI89 with OD 0.7 were positive at 7 days compared with 25.00% in mice instilled with 50 µL of sterile PBS containing E. coli UTI89 with OD 0.35 (P = 0.3521). However, there was a significant association between the presence of positive culture and the E. coli UTI89 infection method at 7 days. 81.82% of mice instilled with 100 µL of sterile PBS containing E. coli UTI89 (OD 0.7) were positive at 7 days compared with 28.57% of mice instilled with 50 µL of sterile PBS containing E. coli UTI89 (OD 0.35, P = 0.0491).
We used a scale of 0–3 to score leaking of instillation fluid from the catheter and urethral bleeding associated with catheterization. For leaking, 0: absent, 1: <10%, 2: <50%, and 3: ≥50% of instilled volume. For bleeding, 0: absent, 1: minimal but no continuous bleeding, 2: minimal continued bleeding, and 3: continued bleed that requires holding pressure. There were no significant differences between the four groups for either leaking or bleeding scores (see Supplemental Fig. S1, available online at https://doi.org/10.25548/17-3ZTY) (49). A larger instillation fluid volume (100 µL) containing E. coli UTI89 did not increase catherization associated bleeding and leaking. These findings support use of the higher volume instillation volume of 100 µL with E. coli UTI89 OD > 0.40 without concern for increased confounding trauma in C57Bl/6J mice.
Researchers in the field have expressed concerns about using transurethral infections to drive prostate inflammation because it had been thought that fluid loading caused by large volume of instillation solution would by itself elicit changes in voiding and confound studies. We compared VSA parameters between mice instilled with a low volume of fluid, a high volume of fluid, and their respective controls. Detailed VSA results are shown in Tables 1–6. We detected no significant differences between mice instilled with either 50 or 100 µL sterile PBS control groups at any time and concluded that transurethral catheterization and fluid loading with up to 100 µL of sterile PBS does not significantly change adult male mouse urinary function.
Table 6.
Spontaneous void behavior 7 days posturethral instillation positive versus negative urine culture
| Negative Urine Culture (n = 7) |
Positive Urine Culture (n = 11) |
P Value | |
|---|---|---|---|
| Count | 27.00 (26.94) | 13.64 (15.79) | 0.4611 |
| Total Area (cm2) | 26.92 (17.34) | 28.88 (10.97) | >0.9999 |
| Percent area in the center of the paper | 6.684 (15.54) | 8.536 (9.289) | 0.4196 |
| Percent area in the corners of the paper | 54.66 (28.82) | 55.50 (31.15) | 0.9553 |
| Spots of a certain size, cm2 | |||
| 0−0.1 | 22.29 (23.64) | 9.818 (14.27) | 0.1852 |
| 0.1−0.25 | 1.714 (3.302) | 0.5455 (0.9342) | 0.6868 |
| 0.25−0.5 | 0.7143 (1.113) | 0.3636 (0.9244) | 0.4653 |
| 0.5−1 | 0.2857 (0.4880) | 0.09091 (0.3015) | 0.5282 |
| 1−2 | 0 (0) | 0.09091 (0.3015) | >0.9999 |
| 2−3 | 0 (0) | 0 (0) | >0.9999 |
| 3−4 | 0 (0) | 0.1818 (0.4045) | 0.4967 |
| 4+ | 2.000 (1.000) | 2.545 (0.8202) | 0.2939 |
Values are averages (SD). Results of the void spot assay are shown. OD, optical density.
At 3, 5, and 7 days postinstillation, there was a difference between one of the E. coli UTI89-treated groups and one of the control groups consistent with high volume, low frequency voiding in infected mice. Three days postinstillation, mice instilled with 100 µL of sterile PBS containing E. coli UTI89 (OD 0.7) voided less frequently than mice with 50 µL of sterile PBS (control, P = 0.0050). The difference in voiding frequency derived specifically from small volume void spots (0–0.1 cm2, P = 0.0060). Five days postinstillation, mice instilled with 50 µL of sterile PBS containing E. coli UTI89 (OD 0.35) voided in the corners of the cage less frequently than mice instilled with 100 µL of sterile PBS control (P = 0.0211). Seven days postinstillation, mice instilled with 100 µL of sterile PBS containing E. coli UTI89 (OD 0.7) voided fewer 0.25- to 0.5-cm2 spots than mice instilled with 100 µL of sterile PBS control (P = 0.0250). Also, at 7 days, mice instilled with 100 µL of sterile PBS containing E. coli UTI89 (OD 0.7) had larger void spots (>4 cm2) than mice instilled with either 50 or 100 µL of sterile PBS (P = 0.0018 and 0.0300).
The volume and concentration of E. coli UTI89 instilled into the urethra influenced spontaneous voiding behaviors 7 days postinstillation. Mice instilled with 100 µL of sterile PBS containing E. coli UTI89 (OD 0.7) voided less frequently than mice instilled with 50 µL of sterile PBS containing E. coli UTI89 (OD 0.35, P = 0.0366). The difference in voiding frequency was driven specifically by small volume void spots, specifically spots that were 0–0.1 cm2 (P = 0.0043) and spots that were 0.25–0.5cm2 (P = 0.0136).
Due to the increased percentage of mice with a positive urine culture at 7 days in mice instilled with 100 µL of sterile PBS containing E. coli UTI89 (OD 0.7) compared with 50 µL of sterile PBS containing E. coli UTI89 (OD 0.35), we tested whether the voiding pattern of mice with an E. coli UTI89-positive urine culture at 7 days postinfection differs from that of mice with a negative urine culture at 7 days. There were no significant differences between those with a positive urine culture and those with a negative urine culture (Table 6).
We conclude that mice instilled with 100 µL of sterile PBS containing E. coli UTI89 (OD 0.7) and mice instilled with 50 µL of sterile PBS containing E. coli (OD 0.35) had a similar voiding phenotype 1−5 days postinstillation, showing a largely preserved acute voiding phenotype between the two instillation methods. We hypothesized that voiding differences at 7 days were due to an increased percentage of mice with positive urine culture in the group instilled with 100 µL of sterile PBS containing E. coli (OD 0.7), but this hypothesis was rejected as there were no differences in voiding phenotype between mice with a positive and negative urine culture at the 7-day time point. This is particularly interesting because it supports the idea that exposure to a different volume/concentration of E. coli UTI89 is sufficient to change duration of voiding phenotypes and is independent of E. coli burden. It is possible that any exposure to E. coli creates a durable response that persists at least 1 wk. However, further study is needed on the coordinated response to E. coli exposure.
E. coli UTI89 Infection Results in a Low Frequency, High Volume Voiding Phenotype
We grouped all control mice and all E. coli UTI89-infected mice to maximize sample size and conducted a pairwise comparison of spontaneous VSA end points 1, 3, 5, and 7 days postinfection and cystometry end points 7−8 days postinfection. Detailed results are shown in Table 1, Table 2, Table 3, Table 4, and Table 7, and results are shown in Fig. 5. At 1 day postinstillation, there were no significant voiding differences between E. coli-infected and PBS control mice. At 3 days postinstillation, E. coli UTI89-infected mice voided less frequently than PBS controls (P = 0.0436). At 5 days postinstillation, E. coli UTI89-infected mice voided a greater volume of urine (P = 0.0301) and voided less frequently in the corners of the cage (P = 0.0192) than PBS controls. At 7 days postinstillation, E. coli UTI89-infected mice voided a greater volume of urine (P = 0.0044) and voided more frequently in large volumes (greater number of spots 4 cm2 in area or larger, P = 0.0011) than PBS controls. Abridged VSA results are shown in Fig. 5, which shows a comparison of E. coli UTI89-infected mice with PBS control mice over the 7-day period. There were no significant differences in cystometric end points between E. coli UTI89-instilled and PBS control mice at 7−8 days postinstillation.
Table 7.
Bladder pressure associated with filling and emptying 7−8 days posturethral instillation with sterile PBS (control) or PBS containing Escherichia coli UTI89
| Sterile PBS Control (n = 12) |
PBS With E. coli UTI89 (n = 12) |
P Value | |
|---|---|---|---|
| Void duration | 0.7465 (0.2880) | 0.7033 (0.2457) | 0.6272 |
| Intervoid interval | 4.814 (1.792) | 4.866 (1.762) | 0.9254 |
| Baseline pressure | 2.652 (0.9032) | 2.782 (0.9265) | 0.7261 |
| Normalized threshold pressure | 2.677 (1.108) | 3.082 (0.9127) | 0.3276 |
| Normalized peak void pressure | 19.26 (6.043) | 20.53 (4.999) | 0.5717 |
| Nonvoiding contractions | 3.417 (2.072) | 3.890 (1.459) | 0.5131 |
| Voided volume, × 10−2 | 0.06622 (0.02635) | 0.06527 (0.02294) | 0.8061 |
| Compliance, × 10−2 | 0.02269 (0.01012) | 0.01978 (0.008291) | 0.2863 |
| Volume flow rate, × 10−3 | 0.001715 (0.0008992) | 0.001814 (0.0008551) | 0.7813 |
| Mass-based flow rate | 37.80 (9.447) | 41.18 (11.03) | 0.3134 |
| Efficiency, % | 105.0 (19.90) | 103.9 (11.35) | 0.3684 |
Values are averages (SD). Results of cystometry are shown. OD, optical density.
Table 5.
Spontaneous void behavior
| Mouse Strain | Instillation Volume | Solution | 1 Day | 3 Days | 5 Days | 7 Days |
|---|---|---|---|---|---|---|
| C57Bl/6J | 50 µL | Sterile PBS | ||||
| 100 µL |
Sterile PBS | |||||
| 50 µL |
E. coli UTI89 OD 0.35 in Sterile PBS | ↓Voiding in corners of cage | ||||
| 100 µL |
E. coli UTI89 OD 0.70 in Sterile PBS | ↓Void frequency ↓spots 0−0.1 cm2 |
↓Void frequency ↓spots 0−0.01 cm2 |
|||
| ↓Spots 0.25−0.5 cm2 | ||||||
| ↑Spots > 4 cm2 | ||||||
|
Results of a previous study (25) with similar end points (infected versus sterile PBS/saline control)
| ||||||
| C3H/HeOuJ | 200 µL | E. coli 1677 (2 × 10⁶ colony-forming units/mL) | ↑Void frequency ↓Total void volume ↓Volume per void |
↑Void frequency ↓total void volume ↓volume per void |
||
OD, optical density.
To test whether transurethral catheterization influences urinary physiology, we compared VSA results obtained 7 days after sterile PBS instillation to results from historical control mice of the same age and strain that were not catheterized (42). We found no differences between mice given a transurethral catheter and instilled with sterile PBS and mice that were not catheterized. Mice instilled with E. coli UTI89 voided a significantly greater volume of urine and voided more frequently in large volumes than mice that were catheterized and given sterile PBS and mice that were not catheterized (Fig. 6). We also compared cystometry results at 7 days after sterile PBS instillation with that of age- and strain-matched historical controls that were not catheterized (42) and detected no significant differences.
It is interesting that E. coli UTI89-infected mice displayed a high volume, low void frequency phenotype. This voiding phenotype suggests increased water intake based on the high volume phenotype in E. coli UTI89-infected mice but does not explain the low void frequency phenotype. The high volume void is also consistent with a physiological response of high volume voids to flush the urinary tract. The low void frequency may suggest a reluctancy to urinate.
When using cystometry to evaluate voiding behavior, no differences were observed between infected and uninfected mice. One possible explanation is that the VSA is more sensitive than cystometry in detecting bacteria-induced changes to urinary voiding. Another possibility is that the bacterial change in voiding phenotype is a voluntary behavioral response that is eliminated during anesthesia. Butler et al. (8) determined that social stress could cause long lasting voiding dysfunction in mice, specifically less frequent and larger volume voids. E. coli exposure and instillation of PBS may trigger a stress pattern of voiding like what is manifested during aggressive behavior.
The voiding response to bacterial infection that we observed differs from the response reported in previous work. Specifically, a previous study (25) has identified a low volume, high void frequency phenotype with acute E. coli 1677 infection. The results described here may differ from previous studies because we used a different strain of mice, a different strain of E. coli, a different installation volume, and a different way to quantify E. coli and VSA papers. C3H/HeOuJ mice used in a previous prostate infection study harbor a Toll receptor variant (lpsd) that renders them hyporesponsive to endotoxin (18, 46) and makes them susceptible to chronic infection (34). Prostatic E. coli infections in C3H/HeOuJ mice are persistent and become lymphocytic over time, and this may lead to a different voiding phenotype than prostate infections in C57Bl/6J mice. Some research groups omit small spots from analysis, attributing them to footprints, although our previous study supports the notion that impact of mouse tracking through deposited urine spots is negligible (52). We used Void Whizzard software (52) and followed recommendations for the reporting of VSA data (19) to improve the rigor and reproducibility of our VSA findings. Further studies are needed to parse out driving factors of this differed voiding phenotype.
Transurethral Instillation of E. coli UTI89 Increases Dorsal Prostate Lobe Stromal Cell Density and Collagen Content
Histological inflammation is confined to the dorsal prostate, so collagen density was quantified exclusively in this lobe. Histological inflammation was extremely variable between mice, with some E. coli UTI89-infected mice displaying no inflammation and others with expansive leukocyte recruitment and infiltration (Fig. 7C). PSR staining was conducted to assess dorsal prostate collagen content. E. coli UTI89-infected mice had significantly denser collagen (P = 0.0221) than sterile PBS control mice (Fig. 7A). In addition, there was a strong direct correlation (P < 0.0001) between dorsal prostate stromal cell number and collagen density (Fig. 7B).
Our results support previous findings that transurethral instillation favors infiltration of the dorsal prostate lobe. Bacterial load drives immune cell recruitment, and the extent of the immune cell recruitment drives collagen production and accumulation. E. coli UTI89-infected mice may exhibit variable responsiveness to inflammation for a variety of reasons. When mice are instilled with E. coli UTI89, there is potential variation in the instillation technique from mouse to mouse and which may vary in the amount of E. coli UTI89 in the prostate. In addition, each mouse may have a different biological response to the E. coli UTI89 infection, further varying the immune response. Despite the variability in response, collagen density increases when inflammation is present.
Transurethral Instillation of E. coli UTI89 Increases the Number of PTPRC+ proCOL1A1+ Cells and Decreases the Percentage of ACTA2+ proCol1A1+ Cells
E. coli UTI89 infection increased the density of total collagen-producing cells (proCol1A1+) compared with the sterile PBS control (P = 0.0369; Fig. 8). Infection also increased the density of collagen-producing bone marrow-derived cells (P = 0.0420). However, the proportion of collagen-producing bone marrow-derived cells (dual PTPRC+; proCOL1A1+/total proCOL1A1+) was similar between groups (P = 0.1531). Infection resulted in a similar density of collagen-producing ACTA2+ cells compared with sterile saline-infused controls (P = 0.7233). Furthermore, the proportion of collagen-producing ACTA2+ cells (dual ACTA2+; proCOL1A1+/total proCOL1A1+) was significantly lower in infected mice compared with controls (P = 0.0326).
The fact that E. coli UTI89 significantly increases the density of total collagen-producing cells indicates that infection triggers a collagen accumulation response in the dorsal prostate. The significant increase in collagen-producing bone marrow-derived cells suggests, but does not confirm, that fibrocytes are recruited to the prostate along with other inflammatory cells and contribute nearly 50% of the collagen-producing cells in E. coli UTI89-infected prostates. Future lineage analysis could provide definitive evidence of the identity of these collagen type I-α1-producing cells. The significantly lower proportion of collagen-producing ACTA2+ cells (dual ACTA2+; proCOL1A1+/total proCOL1A1+) in the E. coli UTI89-infected group provides evidence that myofibroblasts are not a major contributor to excess collagen production following E. coli UTI89 infection, a contrast to the cellular origins of collagen production in other organs. Future work is needed to determine if this is a timing or insult-specific response in the prostate or if the prostate has a truly unique collagen production process.
Conclusions
We examined the use of transurethral instillations of UTI89 E. coli to induce prostate infection and inflammation in mice and thereby model prostate inflammation in men. We optimized instillation volume and instillation E. coli UTI89 concentration and identified a noninvasive biomarker for prostatic inflammation at 1 wk, thereby establishing a predictable and reproducible model. We determined that volume of instillations positively correlates with the extent of inflammation distribution, an observed threshold of OD 0.4 is needed to achieve significant prostate infection, free catch urine culture assays are an effective means to predict if the mouse experience prostatic inflammation, mice that are infected demonstrate a low frequency, high voiding phenotype, and transurethral instillations increase collagen density in the prostate, which is associated with an increased total number of proCol1A1+ cells.
GRANTS
This work was supported by National Institutes of Health (NIH) Grants U54DK104310, the Summer Program In Undergraduate Urologic Research (U54DK104310S1), R01ES001332, R01DK099328, F31ES028594, TL1TR002375, and F30DK122686 and by the School of Veterinary Medicine, University of Wisconsin-Madison. T.H.S. and J.M.B. are supported by the George M. O’Brien Urology Research Center (NIH Grant 2U54DK10430906, to J.M.B.).
DISCLAIMERS
The content is solely the responsibility of the authors and does not necessarily represent the official views of the National Institutes of Health.
DISCLOSURES
No conflicts of interest, financial or otherwise, are declared by the author(s).
AUTHOR CONTRIBUTIONS
H.R., C.M.V., J.K.S., B.M., P.W., K.A.W., and M.T.C. conceived and designed research; H.R., Z.W., J.K.S., B.M., P.W., K.A.W., M.T.C., S.K.S., and L.L.A. performed experiments; H.R., C.A.O., B.C., J.K.S., B.M., and H.L.Z. analyzed data; H.R., C.A.O., B.C., C.M.V., J.K.S., B.M., P.W., K.A.W., M.T.C., and L.L.A. interpreted results of experiments; H.R., J.K.S. and B.M. prepared figures; H.R., J.Z., J.K.S. and B.M. drafted manuscript; H.R., J.Z., Z.W., T.S., D.E.B., C.M.V., J.K.S., B.M., P.W., H.L.Z., K.A.W., and S.K.S. edited and revised manuscript; H.R., J.Z., C.A.O., B.C., Z.W., T.S., J.B., D.E.B., C.M.V., J.K.S., B.M., P.W., H.L.Z., K.A.W., M.T.C., S.K.S., and L.L.A. approved final version of manuscript.
ACKNOWLEDGMENTS
The authors thank Petra Popovics and Brandon Scharpf for engaging discussions and helpful critiques during manuscript preparation.
REFERENCES
- 1.Aiello SE, Moses MA, Allen DG. The Merck Veterinary Manual. Kenilworth, NJ: Merck, 2016. [Google Scholar]
- 2.Ashok A, Keener R, Rubenstein M, Stookey S, Bajpai S, Hicks J, Alme AK, Drake CG, Zheng Q, Trabzonlu L, Yegnasubramanian S, De Marzo AM, Bieberich CJ. Consequences of interleukin 1β-triggered chronic inflammation in the mouse prostate gland: Altered architecture associated with prolonged CD4+ infiltration mimics human proliferative inflammatory atrophy. Prostate 79: 732–745, 2019. doi: 10.1002/pros.23784. [DOI] [PubMed] [Google Scholar]
- 3.Bauman TM, Nicholson TM, Abler LL, Eliceiri KW, Huang W, Vezina CM, Ricke WA. Characterization of fibrillar collagens and extracellular matrix of glandular benign prostatic hyperplasia nodules. PLoS One 9: e109102, 2014. doi: 10.1371/journal.pone.0109102. [DOI] [PMC free article] [PubMed] [Google Scholar]
- 4.Bell-Cohn A, Mazur DJ, Hall C, Schaeffer AJ, Thumbikat P. Uropathogenic Escherichia coli-induced fibrosis, leading to lower urinary tract symptoms, is associated with type 2 cytokine signaling. Am J Physiol Renal Physiol 316: F682–F692, 2019. doi: 10.1152/ajprenal.00222.2018. [DOI] [PMC free article] [PubMed] [Google Scholar]
- 5.Bjorling DE, Wang Z, Vezina CM, Ricke WA, Keil KP, Yu W, Guo L, Zeidel ML, Hill WG. Evaluation of voiding assays in mice: impact of genetic strains and sex. Am J Physiol Renal Physiol 308: F1369–F1378, 2015. doi: 10.1152/ajprenal.00072.2015. [DOI] [PMC free article] [PubMed] [Google Scholar]
- 6.Boehm BJ, Colopy SA, Jerde TJ, Loftus CJ, Bushman W. Acute bacterial inflammation of the mouse prostate. Prostate 72: 307–317, 2012. doi: 10.1002/pros.21433. [DOI] [PMC free article] [PubMed] [Google Scholar]
- 7.Bushman WA, Jerde TJ. The role of prostate inflammation and fibrosis in lower urinary tract symptoms. Am J Physiol Renal Physiol 311: F817–F821, 2016. doi: 10.1152/ajprenal.00602.2015. [DOI] [PubMed] [Google Scholar]
- 8.Butler S, Luz S, McFadden K, Fesi J, Long C, Spruce L, Seeholzer S, Canning D, Valentino R, Zderic S. Murine social stress results in long lasting voiding dysfunction. Physiol Behav 183: 10–17, 2018. doi: 10.1016/j.physbeh.2017.09.020. [DOI] [PubMed] [Google Scholar]
- 9.Cantiello F, Cicione A, Salonia A, Autorino R, Tucci L, Madeo I, Damiano R. Periurethral fibrosis secondary to prostatic inflammation causing lower urinary tract symptoms: a prospective cohort study. Urology 81: 1018–1023, 2013. doi: 10.1016/j.urology.2013.01.053. [DOI] [PubMed] [Google Scholar]
- 10.Coyne KS, Wein AJ, Tubaro A, Sexton CC, Thompson CL, Kopp ZS, Aiyer LP. The burden of lower urinary tract symptoms: evaluating the effect of LUTS on health-related quality of life, anxiety and depression: EpiLUTS. BJU Int 103, Suppl 3: 4–11, 2009. doi: 10.1111/j.1464-410X.2009.08371.x. [DOI] [PubMed] [Google Scholar]
- 11.Elkahwaji JE, Ott CJ, Janda LM, Hopkins WJ. Mouse model for acute bacterial prostatitis in genetically distinct inbred strains. Urology 66: 883–887, 2005. doi: 10.1016/j.urology.2005.04.013. [DOI] [PubMed] [Google Scholar]
- 12.Fraser MO, Smith PP, Sullivan MP, Bjorling DE, Campeau L, Andersson KE, Yoshiyama M. Best practices for cystometric evaluation of lower urinary tract function in muriform rodents. Neurourol Urodyn 39: 1868–1884, 2020. doi: 10.1002/nau.24415. [DOI] [PMC free article] [PubMed] [Google Scholar]
- 13.Funahashi Y, O’Malley KJ, Kawamorita N, Tyagi P, DeFranco DB, Takahashi R, Gotoh M, Wang Z, Yoshimura N. Upregulation of androgen-responsive genes and transforming growth factor-β1 cascade genes in a rat model of non-bacterial prostatic inflammation. Prostate 74: 337–345, 2014. doi: 10.1002/pros.22668. [DOI] [PMC free article] [PubMed] [Google Scholar]
- 14.Gharaee-Kermani M, Kasina S, Moore BB, Thomas D, Mehra R, Macoska JA. CXC-type chemokines promote myofibroblast phenoconversion and prostatic fibrosis. PLoS One 7: e49278, 2012. doi: 10.1371/journal.pone.0049278. [DOI] [PMC free article] [PubMed] [Google Scholar]
- 15.Gharaee-Kermani M, Rodriguez-Nieves JA, Mehra R, Vezina CA, Sarma AV, Macoska JA. Obesity-induced diabetes and lower urinary tract fibrosis promote urinary voiding dysfunction in a mouse model. Prostate 73: 1123–1133, 2013. doi: 10.1002/pros.22662. [DOI] [PMC free article] [PubMed] [Google Scholar]
- 16.Girman CJ, Jacobsen SJ, Tsukamoto T, Richard F, Garraway WM, Sagnier PP, Guess HA, Rhodes T, Boyle P, Lieber MM. Health-related quality of life associated with lower urinary tract symptoms in four countries. Urology 51: 428–436, 1998. doi: 10.1016/S0090-4295(97)00717-6. [DOI] [PubMed] [Google Scholar]
- 17.Haverkamp JM, Charbonneau B, Crist SA, Meyerholz DK, Cohen MB, Snyder PW, Svensson RU, Henry MD, Wang HH, Ratliff TL. An inducible model of abacterial prostatitis induces antigen specific inflammatory and proliferative changes in the murine prostate. Prostate 71: 1139–1150, 2011. doi: 10.1002/pros.21327. [DOI] [PMC free article] [PubMed] [Google Scholar]
- 18.Heppner G, Weiss DW. High susceptibility of strain A mice to endotoxin and endotoxin-red blood cell mixtures. J Bacteriol 90: 696–703, 1965. doi: 10.1128/JB.90.3.696-703.1965. [DOI] [PMC free article] [PubMed] [Google Scholar]
- 19.Hill WG, Zeidel ML, Bjorling DE, Vezina CM. Void spot assay: recommendations on the use of a simple micturition assay for mice. Am J Physiol Renal Physiol 315: F1422–F1429, 2018. doi: 10.1152/ajprenal.00350.2018. [DOI] [PMC free article] [PubMed] [Google Scholar]
- 20.Irwin DE, Kopp ZS, Agatep B, Milsom I, Abrams P. Worldwide prevalence estimates of lower urinary tract symptoms, overactive bladder, urinary incontinence and bladder outlet obstruction. BJU Int 108: 1132–1138, 2011. doi: 10.1111/j.1464-410X.2010.09993.x. [DOI] [PubMed] [Google Scholar]
- 21.Keil KP, Abler LL, Altmann HM, Bushman W, Marker PC, Li L, Ricke WA, Bjorling DE, Vezina CM. Influence of animal husbandry practices on void spot assay outcomes in C57BL/6J male mice. Neurourol Urodyn 35: 192–198, 2016. doi: 10.1002/nau.22692. [DOI] [PMC free article] [PubMed] [Google Scholar]
- 22.Parsons JK, Bergstrom J, Silberstein J, Barrett-Connor E. Prevalence and characteristics of lower urinary tract symptoms in men aged > or = 80 years. Urology 72: 318–321, 2008. doi: 10.1016/j.urology.2008.03.057. [DOI] [PMC free article] [PubMed] [Google Scholar]
- 23.Lang MD, Nickel JC, Olson ME, Howard SR, Ceri H. Rat model of experimentally induced abacterial prostatitis. Prostate 45: 201–206, 2000. doi: 10.1002/1097-0045(20001101)45:3<201:AID-PROS1>3.0.CO;2-Q. [DOI] [PubMed] [Google Scholar]
- 24.Langermann S, Möllby R, Burlein JE, Palaszynski SR, Auguste CG, DeFusco A, Strouse R, Schenerman MA, Hultgren SJ, Pinkner JS, Winberg J, Guldevall L, Söderhäll M, Ishikawa K, Normark S, Koenig S. Vaccination with FimH adhesin protects cynomolgus monkeys from colonization and infection by uropathogenic Escherichia coli. J Infect Dis 181: 774–778, 2000. doi: 10.1086/315258. [DOI] [PubMed] [Google Scholar]
- 25.Lee S, Yang G, Bushman W. Prostatic inflammation induces urinary frequency in adult mice. PLoS One 10: e0116827, 2015. doi: 10.1371/journal.pone.0116827. [DOI] [PMC free article] [PubMed] [Google Scholar]
- 26.Ma J, Gharaee-Kermani M, Kunju L, Hollingsworth JM, Adler J, Arruda EM, Macoska JA. Prostatic fibrosis is associated with lower urinary tract symptoms. J Urol 188: 1375–1381, 2012. doi: 10.1016/j.juro.2012.06.007. [DOI] [PMC free article] [PubMed] [Google Scholar]
- 27.Macoska JA, Uchtmann KS, Leverson GE, McVary KT, Ricke WA. Prostate transition zone fibrosis is associated with clinical progression in the MTOPS study. J Urol 202: 1240–1247, 2019. doi: 10.1097/JU.0000000000000385. [DOI] [PMC free article] [PubMed] [Google Scholar]
- 28.Mehta V, Abler LL, Keil KP, Schmitz CT, Joshi PS, Vezina CM. Atlas of Wnt and R-spondin gene expression in the developing male mouse lower urogenital tract. Dev Dyn 240: 2548–2560, 2011. doi: 10.1002/dvdy.22741. [DOI] [PMC free article] [PubMed] [Google Scholar]
- 29.Mizoguchi S, Mori K, Wang Z, Liu T, Funahashi Y, Sato F, DeFranco DB, Yoshimura N, Mimata H. Effects of estrogen receptor β stimulation in a rat model of non-bacterial prostatic inflammation. Prostate 77: 803–811, 2017. doi: 10.1002/pros.23320. [DOI] [PMC free article] [PubMed] [Google Scholar]
- 30.Morrison C, Thornhill J, Gaffney E. The connective tissue framework in the normal prostate, BPH and prostate cancer: analysis by scanning electron microscopy after cellular digestion. Urol Res 28: 304–307, 2000. doi: 10.1007/s002400000123. [DOI] [PubMed] [Google Scholar]
- 31.Mysorekar IU, Hultgren SJ. Mechanisms of uropathogenic Escherichia coli persistence and eradication from the urinary tract. Proc Natl Acad Sci USA 103: 14170–14175, 2006. doi: 10.1073/pnas.0602136103. [DOI] [PMC free article] [PubMed] [Google Scholar]
- 32.Nickel JC. Prostatitis. Can Urol Assoc J 5: 306–315, 2011. doi: 10.5489/cuaj.686. [DOI] [PMC free article] [PubMed] [Google Scholar]
- 33.Nickel JC, Roehrborn CG, O’Leary MP, Bostwick DG, Somerville MC, Rittmaster RS. The relationship between prostate inflammation and lower urinary tract symptoms: examination of baseline data from the REDUCE trial. Eur Urol 54: 1379–1384, 2008. doi: 10.1016/j.eururo.2007.11.026. [DOI] [PMC free article] [PubMed] [Google Scholar]
- 34.Nowicki B, Singhal J, Fang L, Nowicki S, Yallampalli C. Inverse relationship between severity of experimental pyelonephritis and nitric oxide production in C3H/HeJ mice. Infect Immun 67: 2421–2427, 1999. doi: 10.1128/IAI.67.5.2421-2427.1999. [DOI] [PMC free article] [PubMed] [Google Scholar]
- 35.Parsons JK, Bergstrom J, Silberstein J, Barrett-Connor E. Prevalence and characteristics of lower urinary tract symptoms in men aged > or = 80 years. Urology 72: 318–321, 2008. doi: 10.1016/j.urology.2008.03.057. [DOI] [PMC free article] [PubMed] [Google Scholar]
- 36.Ricard-Blum S. The collagen family. Cold Spring Harb Perspect Biol 3: a004978, 2011. doi: 10.1101/cshperspect.a004978. [DOI] [PMC free article] [PubMed] [Google Scholar]
- 37.Ritter KE, Wang Z, Vezina CM, Bjorling DE, Southard-Smith EM. Serotonin receptor 5-HT3A affects development of bladder innervation and urinary bladder function. Front Neurosci 11: 690, 2017. doi: 10.3389/fnins.2017.00690. [DOI] [PMC free article] [PubMed] [Google Scholar]
- 38.Robertson C, Link CL, Onel E, Mazzetta C, Keech M, Hobbs R, Fourcade R, Kiemeney L, Lee C, Boyle P, McKinlay JB. The impact of lower urinary tract symptoms and comorbidities on quality of life: the BACH and UREPIK studies. BJU Int 99: 347–354, 2007. doi: 10.1111/j.1464-410X.2007.06609.x. [DOI] [PubMed] [Google Scholar]
- 39.Rudick CN, Berry RE, Johnson JR, Johnston B, Klumpp DJ, Schaeffer AJ, Thumbikat P. Uropathogenic Escherichia coli induces chronic pelvic pain. Infect Immun 79: 628–635, 2011. doi: 10.1128/IAI.00910-10. [DOI] [PMC free article] [PubMed] [Google Scholar]
- 40.Rudick CN, Schaeffer AJ, Thumbikat P. Experimental autoimmune prostatitis induces chronic pelvic pain. Am J Physiol Regul Integr Comp Physiol 294: R1268–R1275, 2008. doi: 10.1152/ajpregu.00836.2007. [DOI] [PubMed] [Google Scholar]
- 41.Ruetten H, Wegner KA, Zhang HL, Wang P, Sandhu J, Sandhu S, Morkrid J, Mueller B, Wang Z, Macoska J, Peterson RE, Bjorling DE, Ricke WA, Marker PC, Vezina CM. Insight and resources from a study of the “Impact of sex, androgens, and prostate size on C57BL/6J mouse urinary physiology”. Toxicol Pathol 47: 1038–1042, 2019. doi: 10.1177/0192623319877867. [DOI] [PMC free article] [PubMed] [Google Scholar]
- 42.Ruetten H, Wegner KA, Zhang HL, Wang P, Sandhu J, Sandhu S, Mueller B, Wang Z, Macoska J, Peterson RE, Bjorling DE, Ricke WA, Marker PC, Vezina CM. Impact of sex, androgens, and prostate size on C57BL/6J mouse urinary physiology: functional assessment. Am J Physiol Renal Physiol 317: F996–F1009, 2019. doi: 10.1152/ajprenal.00270.2019. [DOI] [PMC free article] [PubMed] [Google Scholar]
- 43.Schindelin J, Arganda-Carreras I, Frise E, Kaynig V, Longair M, Pietzsch T, Preibisch S, Rueden C, Saalfeld S, Schmid B, Tinevez JY, White DJ, Hartenstein V, Eliceiri K, Tomancak P, Cardona A. Fiji: an open-source platform for biological-image analysis. Nat Methods 9: 676–682, 2012. doi: 10.1038/nmeth.2019. [DOI] [PMC free article] [PubMed] [Google Scholar]
- 44.Schwartz ES, La JH, Young EE, Feng B, Joyce S, Gebhart GF. Chronic prostatitis induces bladder hypersensitivity and sensitizes bladder afferents in the mouse. J Urol 196: 892–901, 2016. doi: 10.1016/j.juro.2016.03.077. [DOI] [PMC free article] [PubMed] [Google Scholar]
- 45.Steiner GE, Stix U, Handisurya A, Willheim M, Haitel A, Reithmayr F, Paikl D, Ecker RC, Hrachowitz K, Kramer G, Lee C, Marberger M. Cytokine expression pattern in benign prostatic hyperplasia infiltrating T cells and impact of lymphocytic infiltration on cytokine mRNA profile in prostatic tissue. Lab Invest 83: 1131–1146, 2003. doi: 10.1097/01.LAB.0000081388.40145.65. [DOI] [PubMed] [Google Scholar]
- 46.Sultzer BM. Endotoxin-induced resistance to a staphylococcal infection: cellular and humoral responses compared in two mouse strains. J Infect Dis 118: 340–348, 1968. doi: 10.1093/infdis/118.3.340. [DOI] [PubMed] [Google Scholar]
- 47.Torkko KC, Wilson RS, Smith EE, Kusek JW, van Bokhoven A, Lucia MS. Prostate biopsy markers of inflammation are associated with risk of clinical progression of benign prostatic hyperplasia: findings from the MTOPS study. J Urol 194: 454–461, 2015. doi: 10.1016/j.juro.2015.03.103. [DOI] [PubMed] [Google Scholar]
- 48.Valdivia RH, Hromockyj AE, Monack D, Ramakrishnan L, Falkow S. Applications for green fluorescent protein (GFP) in the study of host-pathogen interactions. Gene 173: 47–52, 1996. doi: 10.1016/0378-1119(95)00706-7. [DOI] [PubMed] [Google Scholar]
- 49.Vezina C; GUDMAP Consortium . A Uropathogenic E. coli UTI89 Model of Prostatic Inflammation and Collagen Accumulation for Use in Studying Aberrant Collagen Production in the Prostate. doi: 10.25548/17-3ZTY. [DOI] [PMC free article] [PubMed]
- 50.Wegner K, Ruetten H, Sandhu S, Vezina C; GUDMAP Consortium . Guide to Individual Prostate Lobe Dissection. doi: 10.25548/0KNR. [DOI]
- 51.Wegner K, Vezina C; GUDMAP Consortium . Overview of Embedding Prostatic Urethra in Transverse Plane. doi: 10.25548/0QFR. [DOI]
- 52.Wegner KA, Abler LL, Oakes SR, Mehta GS, Ritter KE, Hill WG, Zwaans BM, Lamb LE, Wang Z, Bjorling DE, Ricke WA, Macoska J, Marker PC, Southard-Smith EM, Eliceiri KW, Vezina CM. Void spot assay procedural optimization and software for rapid and objective quantification of rodent voiding function, including overlapping urine spots. Am J Physiol Renal Physiol 315: F1067–F1080, 2018. doi: 10.1152/ajprenal.00245.2018. [DOI] [PMC free article] [PubMed] [Google Scholar]
- 53.Wegner KA, Keikhosravi A, Eliceiri KW, Vezina CM. Fluorescence of picrosirius red multiplexed with immunohistochemistry for the quantitative assessment of collagen in tissue sections. J Histochem Cytochem 65: 479–490, 2017. doi: 10.1369/0022155417718541. [DOI] [PMC free article] [PubMed] [Google Scholar]
- 54.Welch G, Weinger K, Barry MJ. Quality-of-life impact of lower urinary tract symptom severity: results from the Health Professionals Follow-up Study. Urology 59: 245–250, 2002. doi: 10.1016/S0090-4295(01)01506-0. [DOI] [PubMed] [Google Scholar]
- 55.Wong L, Hutson PR, Bushman W. Prostatic inflammation induces fibrosis in a mouse model of chronic bacterial infection. PLoS One 9: e100770, 2014. doi: 10.1371/journal.pone.0100770. [DOI] [PMC free article] [PubMed] [Google Scholar]
