Significance
Hostile influence operations (IOs) that weaponize digital communications and social media pose a rising threat to open democracies. This paper presents a system framework to automate detection of disinformation narratives, networks, and influential actors. The framework integrates natural language processing, machine learning, graph analytics, and network causal inference to quantify the impact of individual actors in spreading the IO narrative. We present a classifier that detects reported IO accounts with 96% precision, 79% recall, and 96% AUPRC, demonstrated on real social media data collected for the 2017 French presidential election and known IO accounts disclosed by Twitter. Our system also discovers salient network communities and high-impact accounts that are independently corroborated by US Congressional reports and investigative journalism.
Keywords: causal inference, networks, machine learning, social media, influence operations
Abstract
The weaponization of digital communications and social media to conduct disinformation campaigns at immense scale, speed, and reach presents new challenges to identify and counter hostile influence operations (IOs). This paper presents an end-to-end framework to automate detection of disinformation narratives, networks, and influential actors. The framework integrates natural language processing, machine learning, graph analytics, and a network causal inference approach to quantify the impact of individual actors in spreading IO narratives. We demonstrate its capability on real-world hostile IO campaigns with Twitter datasets collected during the 2017 French presidential elections and known IO accounts disclosed by Twitter over a broad range of IO campaigns (May 2007 to February 2020), over 50,000 accounts, 17 countries, and different account types including both trolls and bots. Our system detects IO accounts with 96% precision, 79% recall, and 96% area-under-the precision-recall (P-R) curve; maps out salient network communities; and discovers high-impact accounts that escape the lens of traditional impact statistics based on activity counts and network centrality. Results are corroborated with independent sources of known IO accounts from US Congressional reports, investigative journalism, and IO datasets provided by Twitter.
Although propaganda is an ancient mode of statecraft, the weaponization of digital communications and social media to conduct disinformation campaigns at previously unobtainable scales, speeds, and reach presents new challenges to identify and counter hostile influence operations (1–6). Before the internet, the tools used to conduct such campaigns adopted longstanding—but effective—technologies. For example, Mao’s guerrilla strategy emphasizes “[p]ropaganda materials are very important. Every large guerrilla unit should have a printing press and a mimeograph stone” (ref. 7, p. 85). Today, many powers have exploited the internet to spread propaganda and disinformation to weaken their competitors. For example, Russia’s official military doctrine calls to “[e]xert simultaneous pressure on the enemy throughout the enemy’s territory in the global information space” (ref. 8, section II).
Online influence operations (IOs) are enabled by the low cost, scalability, automation, and speed provided by social media platforms on which a variety of automated and semiautomated innovations are used to spread disinformation (1, 2, 4). Situational awareness of semiautomated IOs at speed and scale requires a semiautomated response capable of detecting and characterizing IO narratives and networks and estimating their impact either directly within the communications medium or more broadly in the actions and attitudes of the target audience. This arena presents a challenging, fluid problem whose measured data are composed of large volumes of human- and machine-generated multimedia content (9), many hybrid interactions within a social media network (10), and actions or consequences resulting from the IO campaign (11). These characteristics of modern IOs can be addressed by recent advances in machine learning in several relevant fields: natural language processing (NLP), semisupervised learning, and network causal inference.
This paper presents a framework to automate detection and characterization of IO campaigns. The contributions of this paper are 1) an end-to-end system to perform narrative detection, IO account classification, network discovery, and estimation of IO causal impact; 2) a robust semisupervised approach to IO account classification; 3) a method for detection and quantification of causal influence on a network (10); and 4) application of this approach to genuine hostile IO campaigns and datasets, with classifier and impact estimation performance curves evaluated on confirmed IO networks. Our system discovers salient network communities and high-impact accounts in spreading propaganda. The framework integrates natural language processing, machine learning, graph analytics, and network causal inference to quantify the impact of individual actors in spreading IO narratives. Our general dataset was collected over numerous IO scenarios during 2017 and contains nearly 800 million tweets and 13 million accounts. IO account classification is performed using a semisupervised ensemble-tree classifier that uses both semantic and behavioral features and is trained and tested on accounts from our general dataset labeled using Twitter’s election integrity dataset that contains over 50,000 known IO accounts active between May 2007 and February 2020 from 17 countries, including both trolls and bots (9). To the extent possible, classifier performance is compared to other online account classifiers. The impact of each account is inferred by its causal contribution to the overall narrative propagation over the entire network, which is not accurately captured by traditional activity- and topology-based impact statistics. The identities of several high-impact accounts are corroborated to be agents of foreign influence operations or influential participants in known IO campaigns using Twitter’s election integrity dataset and reports from the US Congress and investigative journalists (9, 11–15).
Framework
The end-to-end system framework collects contextually relevant data, identifies potential IO narratives, classifies accounts based on their behavior and content, constructs a narrative network, and estimates the impact of accounts or networks in spreading specific narratives (Fig. 1). First, potentially relevant social media content is collected using the Twitter public application programming interface (API) based on keywords, accounts, languages, and spatiotemporal ranges. Second, distinct narratives are identified using topic modeling, from which narratives of interest are identified by analysts. In general, more sophisticated NLP techniques that exploit semantic similarity, e.g., transformer models (16), can be used to identify salient narratives. Third, accounts participating in the selected narrative receive an IO classifier score based on their behavioral, linguistic, and content features. The second and third steps may be repeated to provide a more focused corpus for IO narrative detection. Fourth, the social network of accounts participating in the IO narrative is constructed using their pattern of interactions. Fifth, the unique impact of each account—measured using its contribution to the narrative spread over the network—is quantified using a network causal inference methodology. The end product of this framework is a mapping of the IO narrative network where IO accounts of high impact are identified.
Fig. 1.
Framework block diagram of end-to-end IO detection and characterization.
Methodology
Targeted Collection.
Contextually relevant Twitter data are collected using the Twitter API based on keywords, accounts, languages, and spatiotemporal filters specified by us. For example, during the 2017 French presidential election, keywords include the leading candidates, #Macron and #LePen, and French election-related issues, including hostile narratives expected to harm specific candidates, e.g., voter abstention (17) and unsubstantiated allegations (6, 18). Because specific narratives and influential IO accounts are discovered subsequently, they offer additional cues to either broaden or refocus the collection. In the analysis described in the preceding subsection, 28 million Twitter posts and nearly 1 million accounts potentially relevant to the 2017 French presidential election were collected over a 30-d period preceding the election, and a total of nearly 800 million tweets and information on 13 million distinct accounts were collected.
Narrative Detection.
Narratives are automatically generated from the targeted Twitter data using a topic modeling algorithm (19). First, accounts whose tweets contain keywords relevant to the subject or exhibit predefined, heuristic behavioral patterns within a relevant time period are identified. Second, content from these accounts is passed to a topic modeling algorithm, and all topics are represented by a collection or bag of words. Third, interesting topics are identified manually. Fourth, tweets that match these topics above a predefined threshold are selected. Fifth, a narrative network is constructed with vertices defined by accounts whose content matches the selected narrative and edges defined by retweets between these accounts. In the case of the 2017 French elections, the relevant keywords are “Macron,” “leaks,” “election,” and “France”; the languages used in topic modeling are English and French.
IO Account Classification.
Developing an automated IO classifier is challenging because the number of actual examples is necessarily small, and the behavior and content of these accounts can change over both time and scenario. Semisupervised classifiers trained using heuristic rules can address these challenges by augmenting limited truth data with additional accounts that match IO heuristics within a target narrative that does not necessarily appear in the training data. This approach has the additional intrinsic benefits of preventing the classifier from being overfitted to a specific training set or narrative and provides a path to adapt the classifier to future narratives. IO account classifier design is implemented using this semisupervised machine-learning approach built with the open source libraries scikit-learn and Snorkel (20, 21) and soft labeling functions based on heuristics of IO account metadata, content, and behavior. The feature space comprises behavioral characteristics, profile characteristics, languages used, and the 1- and 2-grams used in tweets; full details are provided in SI Appendix, section C, and feature importances are illustrated in Results (see Fig. 4). Our design approach to semisupervised learning is to develop labeling functions only for behavioral and profile characteristics, not narrative- or content-specific features, with the expectation that such labeling functions are transferable across multiple scenarios.
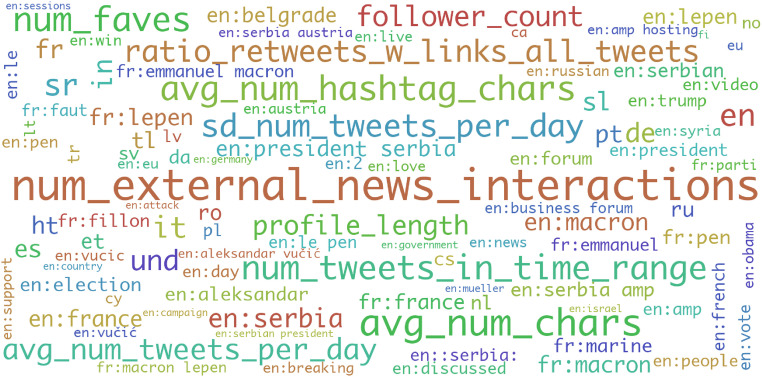
Fig. 4.
The 100 most important features in the French and English combined classifier, represented by relative size in a word cloud.
The classifier is trained and tested using sampled accounts representing both IO-related and general narratives. The approach is designed to prevent overfitting by labeling these sampled accounts using semisupervised Snorkel heuristics. These accounts are collected as described in Targeted Collection. There are four categories of training and testing data: known IO accounts (known positives from the publicly available Twitter elections integrity dataset) (9), known non-IO accounts (known negatives composed of mainstream media accounts), Snorkel-labeled positive accounts (heuristic positives), and Snorkel-labeled negative accounts (heuristic negatives). All known positives are eligible to be in the training set, whether they are manually operated troll IO accounts or automated bots. Because we include samples that represent both accounts engaging in the IO campaign and general accounts, our training approach is weakly dependent upon the IO campaign in two ways. First, only known IO accounts whose content includes languages relevant to the IO campaign are used. Second, a significant fraction (e.g., ) of Snorkel-labeled accounts (either positive or negative) must be participants in the narrative. Finally, we establish confidence that we are not overfitting by using cross-validation to compute classifier performance. Additionally, overfitting is observed without using Snorkel heuristics (SI Appendix, section C.2), supporting the claim that semisupervised learning is a necessary component of our design. Dimensionality reduction and classifier algorithm selection are performed by optimizing precision-recall performance over a broad set of dimensionality reduction approaches, classifiers, and parameters (SI Appendix, section C). In Results, dimensionality reduction is performed with Extra-Trees (ET) (20) and the classifier is the Random Forest (RF) algorithm (20). Ensemble tree classifiers learn the complex concepts of IO account behaviors and characteristics without overfitting to the training data through a collection of decision trees, each representing a simple concept using only a few features.
Network Discovery.
The narrative network—a social network of participants involved in discussing and propagating a specific narrative—is constructed from their observed pattern of interactions. In Results, narrative networks are constructed using retweets. Narrative networks and their pattern of influence are represented as graphs whose edges represent strength of interactions. The (directed) influence from (account) vertex to vertex is denoted by the weighted edge . For simplicity in the sequel, network vertex is also referred to as . The influence network is represented by the adjacency matrix . Because actual influence is not directly observable, the influence network is modeled as a random variable with Poisson distribution parameterized by the observed evidence of influence. Specifically, influence is modeled with prior distribution , as counts of interactive influence in real-world networks. Observations of past interactions or influence on a subset of edges can be used to estimate the rates on the missing edges through inference on a network model that captures realistic characteristics such as sparsity, varying vertex degrees, and community structure (22).
Impact Estimation.
Impact estimation is based on a method that quantifies each account’s unique causal contribution to the overall narrative propagation over the entire network. It accounts for social confounders (e.g., community membership, popularity) and disentangles their effects from the causal estimation. This approach is based on the network potential outcome framework (23), itself based upon Rubin’s causal framework (24). Mathematical details are provided in SI Appendix, section D.
The fundamental quantity is the network potential outcome of each vertex, denoted , under exposure to the narrative from the source vector via the influence network . Precisely, is a binary vector of narrative sources (a.k.a. treatment vector). In this study, vertices are user accounts, edges represent influence as described in Network Discovery, and the potential outcomes are the number of tweets in the narrative. The influence network is an important part of the treatment exposure mechanism. An accounts exposure to the narrative is determined by both the sources and exposures to them delivered through the influence network. The impact of each vertex on the overall narrative propagation is defined using network potential outcome differentials averaged over the entire network:
| [1] |
This causal estimand is the average difference between the individual outcomes with as a source such that , versus not a source, . This impact is the average (per vertex) number of additional tweets generated by a user’s participation in the narrative. The source is said to be uniquely impactful if it is the only source.
It is impossible to observe the outcomes at each vertex with both exposure conditions under source vectors and ; therefore, the missing potential outcomes must be estimated, which can be accomplished using a model. After estimating the model parameters from the observed outcomes and vertex covariates, missing potential outcomes in the causal estimand can be imputed using the fitted model. Potential outcomes are modeled using a Poisson generalized linear mixed model (GLMM) with the canonical log-link function and linear predictor coefficients corresponding to the source indicator , -hop exposure vector , the covariate vector , and the baseline outcome. The covariate vector includes the potential social confounders such as popularity and community membership. These confounders are accounted for through covariate adjustment to disentangle actual causal impact from effects of homophily (birds of a feather flock together) and vertex degree on outcomes, by meeting the key unconfounded influence network assumption 2 in SI Appendix, Assumption 2. For correctness and rigor, imputation of the missing potential outcomes is designed to meet the unconfoundedness assumptions that lead to an ignorable treatment exposure mechanism under network interference, detailed in SI Appendix, section D.4. The GLMM for the potential outcomes is
| [2] |
where represents the primary effect from the source, represents the accumulative social influence effect from -hop exposures to the source, (between 0 and 1) represents how quickly the effect decays over each additional th hop, is the effect of the unit covariates including potential social confounders such as popularity and community membership, is the baseline effect on the entire population, and provides independent and identically distributed variation for heterogeneity between the units. The amounts of social exposure at the th hop are determined by . This captures narrative propagation via all exposure to sources within the narrative network. Diminishing return of additional exposures is modeled using (elementwise) log-exposure, . The influence matrix , with prior distribution specified in Network Discovery, is jointly estimated with the model parameters , , , , through Markov chain Monte Carlo (MCMC) and Bayesian regression.
Results
Targeted Collection.
The targeted collection for the 2017 French presidential election includes potentially relevant tweets and distinct accounts, all collected over a 30-d period preceding the election on 7 May 2017. Targeted collections for several other IO scenarios were also collected during 2017, resulting in a dataset with tweets and distinct accounts. Of these, there are known IO accounts that posted in English or French (SI Appendix, Fig. S1). The great majority of accounts are unrelated to both these known IO accounts and the French election, but will provide negative examples for IO classifier training.
Narrative Detection.
Narratives immediately preceding the election are generated automatically by dividing this broad content into language groups; restricting the content and time period to election-related posts within 1 wk preceding the election’s media blackout date of 5 May 2017; and filtering accounts based on interaction with non-French media sites pushing narratives expected to harm specific candidates. Topic modeling (19) is applied to the separate English and French language corpora, and the resulting topics are inspected by us to identify relevant narratives. Two such narratives are illustrated in Fig. 2 by the most frequent word and emoji usage appearing in tweets included within the topic. From the English corpus (), 15 topics are generated and from the French (), 30 topics. These automatically generated topics correspond closely to allegations claimed to be spread by WikiLeaks, candidate Marine Le Pen, and others (14, 25). The role of bots in spreading allegations using the #MacronLeaks hashtag narrative is studied by Ferrara (26). Two topics, one in English and one in French, pertaining to unsubstantiated financial allegations (Fig. 2) will be used to identify accounts involved in spreading these narratives, independent of whether the accounts were used for narrative detection.
Fig. 2.
Word clouds associated with the “offshore accounts” topic in English (Top) and French (Bottom). Topics are selected from those generated from the English corpus () and the French corpus () as described in SI Appendix.
IO Account Classification.
Twitter published IO truth data containing known IO account identities and their multimedia content (9). IO accounts represent a tiny fraction of all Twitter accounts; e.g., Twitter’s known IO accounts are only 0.02% of its 330 million active monthly users, and bots are estimated to comprise 9 to 15% of all Twitter accounts (27). This dataset is used along with heuristic rules to train a semisupervised classifier (21) using the approach described in Methodology, and the rulesets are detailed in SI Appendix, section C. The classifier is trained and tested using content from these sources: known IO accounts that have tweeted on any topic at least once in either English or French, 20 known non-IO mainstream media accounts, and Snorkel-labeled accounts randomly drawn from our dataset, such that are topically relevant and are topically neutral. There are known IO accounts from Twitter’s dataset in our dataset that have tweeted in English or French. To account for a possible upper bound of up to 15% bots (IO related or not), we randomly select presumptively false examples with each of three false classes: topically relevant accounts that tweeted at least once in English, at least once in French, and topically neutral, randomly chosen from the general dataset (SI Appendix, Fig. S1).
Precision-recall performance.
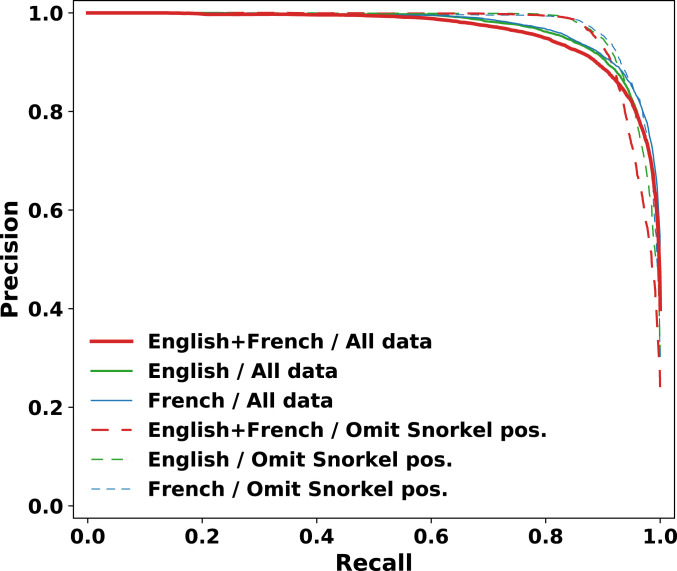
Precision-recall (P-R) performance of the classifier is computed via cross-validation using the same dataset with a split, averaged over 20 rounds (Fig. 3). Because the number of known cases is limited, weak supervision from the heuristic Snorkel labeling functions is used to identify true examples before cross-validation (21). All training is performed with Snorkel-labeled data, and cross-validation is performed both using Snorkel-labeled data (solid curves in Fig. 3) and omitting Snorkel positives (dashed curves). Sensitivity to language-specific training data is also computed by restricting topically relevant, false examples to specific languages. All classifiers exhibit comparably strong performance, and small differences in relative performance are consistent with our expectations. All classifiers detect IO accounts with 96% precision and 79% recall at a nominal operating point, 96% area-under-the P-R curve (AUPRC), and 8% equal-error rate (EER). The English-only and French-only classifiers perform slightly better (nominally 0 to 3%) than the combined language model, consistent with the expectation that models with greater specificity outperform less-specific models. This strong classifier performance will be combined with additional inferences—narrative networks, community structure, and impact estimation—to identify potentially influential IO accounts involved in spreading particular narratives.
Fig. 3.
P-R classifier performance with known IO accounts (9) and language-specific training data: combined English and French (red curves, ), English only (green curves, ), and French only (blue curves, ), cross-validated using a split and all data (solid curves) and Snorkel positives omitted (dashed curves).
With this dataset, the original feature space has dimension : 17 behavior and profile features, 61 languages, and - and 2-grams. SI Appendix, section C lists the behavior, profile features, and language features. Grid search over feature dimensionality is used to identify the best feature set for dimensionality reduction: 10 behavioral and profile features, 30 language features, and - and 2-grams. The most important features used by the classifier are illustrated by the relative sizes of feature names appearing in the word cloud of Fig. 4. Note that the most important features for IO account classification are independent of topic and pertain instead to account behavioral characteristics and frequency of languages other than English or French. This topic independence suggests the potential applicability of the classifier to other IO narratives. Furthermore, the diversity of behavioral features suggests robustness against future changes of any single behavior.
Classifier performance comparisons.
Several online bot classifiers are used to report upon and study influence campaigns (3, 26, 29), notably Botometer (formerly BotOrNot) (30) and Bot Sentinel (31). Indeed, Rauchfleisch and Kaiser (32) assert based on several influential papers that analyze online political influence that Despite the differences between general, automated bot activity and the combination of troll and bot accounts used for IO campaigns, comparing the classifier performance between these different classifiers is important because it is widespread practice to use such bot classifiers for insight into IO campaigns. Therefore, we compare the P-R performance of our IO classifier to both Botometer and Bot Sentinel. This comparison is complicated by three factors: 1) Neither Botometer nor Bot Sentinel has published classifier performance against known IO accounts; 2) neither project has posted open source code; and 3) known IO accounts are immediately suspended, which prevents post hoc analysis with these online tools.
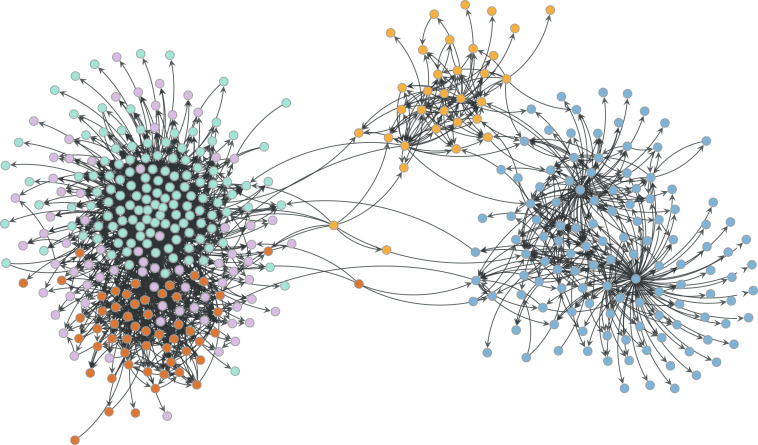
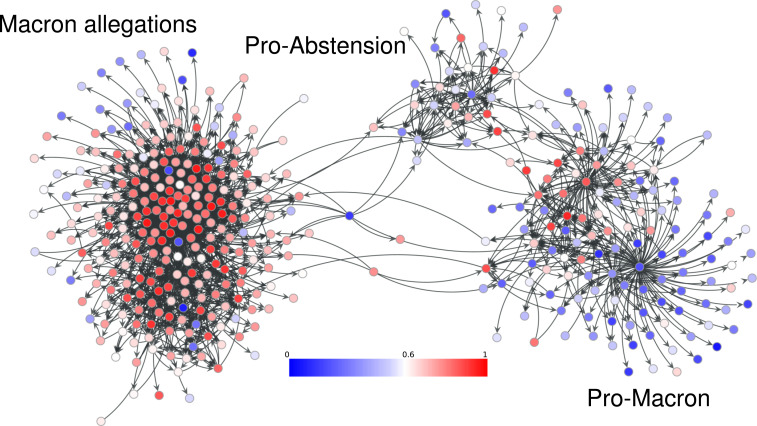
Therefore, a proxy for known IO accounts must be used for performance comparisons. We use the observation that there exists strong correlation between likely IO accounts in our narrative network and membership in specific, distinguishable communities independently computed using an MCMC-based blockmodel (28). Community membership of accounts in the French language narrative network (Fig. 2) is illustrated in Fig. 5. Five distinct communities are detected, three of which are identified to have promoted Macron allegation narratives. The other two narratives promote pro-Macron and pro-abstention narratives. Accounts in this narrative network are classified on a 0 to 1 scale of their similarity to known IO accounts, shown in Fig. 6. Comparing Figs. 5 and 6 shows that the great majority of accounts in the “Macron allegation” communities are classified as highly similar to known IO accounts and, conversely, the great majority of accounts in the pro-Macron and pro-abstention communities are classified as highly dissimilar to known IO accounts. This visual comparison is quantified by the account histogram illustrated in SI Appendix, Fig. S9.
Fig. 5.
Community membership in the French narrative network (Fig. 2). Colors show inferred membership from a blockmodel (28).
Fig. 6.
Classifier scores over the French narrative network (Fig. 2). The 0 to 1 score range indicates increasing similarity to known IO accounts.
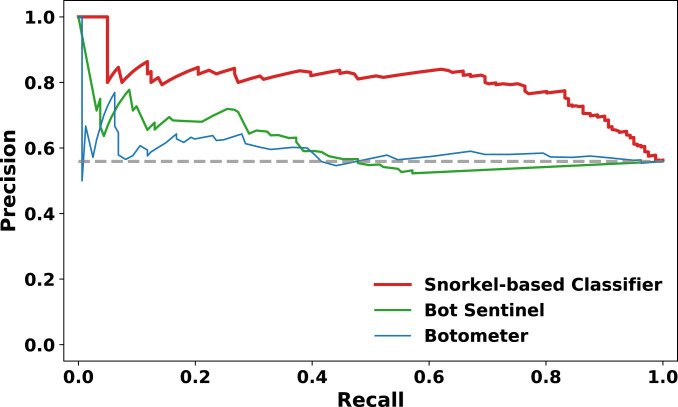
Using membership in these Macron allegation communities as a proxy for known IO accounts, P-R performance is computed for our IO classifier, Botometer, and Bot Sentinel (Fig. 7). Note that Botometer’s performance in Fig. 7 at a nominal 50% recall is 56% precision, which is very close to the 50% Botometer precision performance shown by Rauchfleisch and Kaiser (32) using a distinctly different dataset and truthing methodology (ref. 32, figure 4, “all”). Given this narrative network and truth proxy, both Botometer and Bot Sentinel perform nominally at random chance of 63% precision, the fraction of presumptive IO accounts. Our IO classifier has precision performance of 82 to 85% over recalls of range 20 to 80%, which exceeds random chance performance by 19 to 22%. These results are also qualitatively consistent with known issues of false positives and false negatives in bot detectors (32), although some performance differences are also likely caused by the intended design of Botometer or Bot Sentinel, which is to detect general bot activity, rather than the specific IO behavior on which our classifier is trained.
Fig. 7.
Classifier performance comparison: Snorkel-based classifier (red curve, ) vs. Botometer (green curve, ) vs. Bot Sentinel (blue curve, ), given proxy, community-based truth. The dashed gray horizontal line at 63% is the fraction of presumptively true examples in the community-based proxy for known IO accounts and therefore represents random chance precision performance.
Network Discovery.
Tweets that match topics of Fig. 2 are extracted from the collected Twitter data. French language tweets made in the week leading up to the blackout period, 28 April through 5 May 2017, are checked for similarity to the French language topic. To ensure the inclusion of tweets on the #MacronLeaks data dump (10, 14, 26), which occurred on the eve of the French media blackout, English language tweets from 29 April through 7 May 2017 are compared to the English topic. In total, the French topic network consists of accounts and the English topic network consists of accounts. For visual clarity, network figures are generated on the most active accounts, 459 in the French and 752 in the English networks.
Impact Estimation.
Estimation on the causal impact of each account in propagating the narrative is performed by computing the estimand in Eq. 1, considering each account as the source. Unlike existing propagation methods on network topology (33), causal inference accounts also for the observed counts from each account to capture how each source contributes to the subsequent tweets made by other accounts. Results demonstrate this method’s advantage over traditional impact statistics based on activity count and network topology alone.
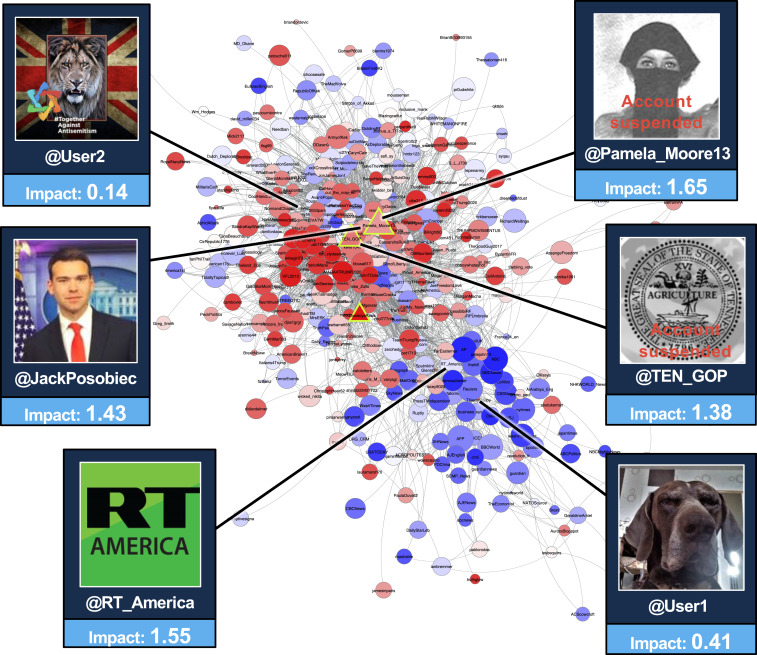
Impact estimation and IO classification on the English narrative network (Fig. 2) are demonstrated in Fig. 8. Graph vertices are Twitter accounts sized by the causal impact score (i.e., posterior mean of the causal estimand) and colored by the IO classifier using the same scale as Fig. 6. Redness indicates account behavior and content like known IO accounts, whereas blueness indicates the opposite. This graph layout reveals two major communities involved in narrative propagation of unsubstantiated financial allegations during the French election. The large community at the top left comprises many accounts whose behavior and content are consistent with known IO accounts. The relatively smaller community at the bottom right includes many mainstream media accounts that publish reports on this narrative. Within this mainstream journalism-focused community, the media accounts AP, ABC, RT, and Reuters are among the most impactful, consistent with expectation. The most remarkable result, however, is that known IO accounts are among the most impactful among the large community of IO-like accounts. The existence of these IO accounts was known previously (9, 12, 13), but not their impact in spreading specific IO narratives. Also note the impactful IO accounts (i.e., the large red vertices) in the upper community that appear to target many benign accounts (i.e., the white and blue vertices).
Fig. 8.
Impact network (accounts sized by impact) colored by IO classifier score on the English narrative network (Fig. 2). Known IO accounts are highlighted in triangles. Image credits: Twitter/JackPosobiec, Twitter/RT_America, Twitter/Pamela_Moore13, Twitter/TEN_GOP.
A comparison between the causal impact and traditional impact statistics is provided in Table 1 on several representative and/or noteworthy accounts highlighted in Fig. 8. The prominent @RT_America, a major Russian media outlet, and @JackPosobiec, a widely reported (14) account in spreading this narrative, corroborate our estimate of their very high causal impact scores. This is also consistent with their early participation in this narrative, high tweet counts, high number of followers, and large PageRank centralities. Conversely, @User1 and @User2 have low impact statistics and also receive low causal impact scores as relatively nonimpactful accounts. It is often possible to interpret why accounts were impactful. E.g., @JackPosobiec was one of the earliest participants and has been reported as a key source in pushing the related #MacronLeaks narrative (14, 26) (SI Appendix, Fig. S10). In that same narrative, another impactful account @UserB serves as the initial bridge from the English subnetwork into the predominantly French-speaking subnetwork (SI Appendix, section E).
Table 1.
Comparison of impact statistics between accounts on the English network: tweets (T), retweets (RT), followers (F), first tweet time on 28 April, PageRank centrality (PR), and causal impact (CI)
| Screen name | T | RT | F | 1st time | PR | CI* |
| @RT_America | 39 | 8 | 386,000 | 12:00 | 2,706 | 1.55 |
| @JackPosobiec | 28 | 123 | 23,000 | 01:54 | 4,690 | 1.43 |
| @User1† | 8 | 0 | 1,400 | 22:53 | 44 | 0.14 |
| @User2† | 12 | 15 | 19,000 | 12:27 | 151 | 0.41 |
| @Pamela_Moore13 | 10 | 31 | 56,000 | 18:46 | 97 | 1.65 |
| @TEN_GOP | 12 | 42 | 112,000 | 22:15 | 191 | 1.38 |
Estimate of the causal estimand in Eq. 1.
Anonymized screen names of currently active accounts.
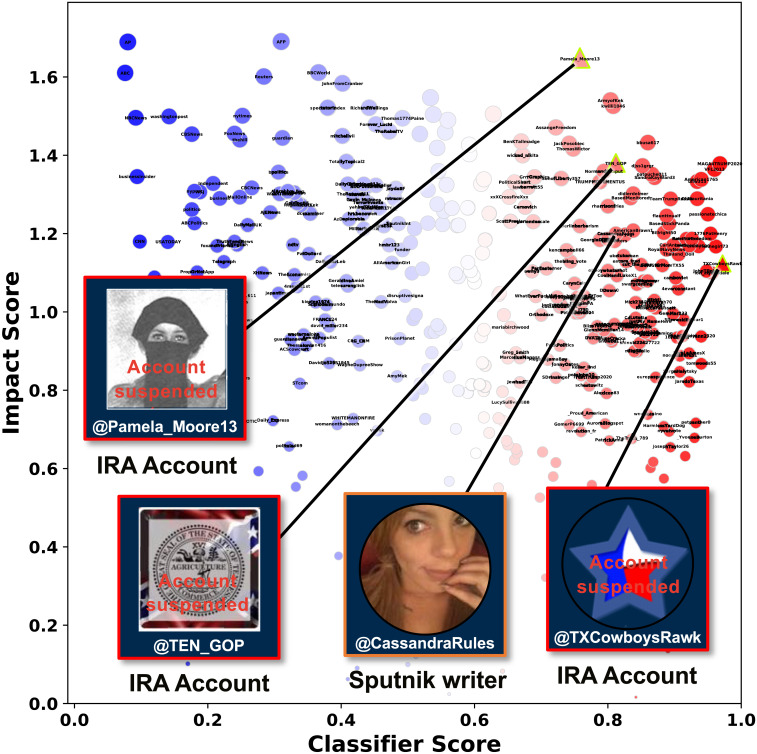
Known IO account (9–13) @Pamela_Moore13’s involvement in this narrative illustrates the relative strength of the causal impact estimates in identifying relevant IO accounts. @Pamela_Moore13 stands out as one of the most prominent accounts spreading this narrative. Yet “her” other impact statistics (T, RT, F, PR) are not distinctive and comparable in value to the not-impactful account @User2. Additionally, known IO accounts @TEN_GOP and @TXCowboysRawk (9, 12, 13, 15) and Sputnik writer @CassandraRules (34) all stand out for their relatively high causal impact and IO account classifier scores (Fig. 9). Causal impact estimation is shown to find high-impact accounts that do not stand out using traditional impact statistics. This estimation is accomplished by considering how the narrative propagates over the influence network, and its utility is demonstrated using data from known IO accounts on known IO narratives. Additional impact estimation results are provided in SI Appendix, section E.
Fig. 9.
Impact versus classifier score, English narrative network (Fig. 2). Known IO accounts run by the Internet Research Agency (IRA) (9, 11–13, 15) are highlighted. Image credits: Twitter/Pamela_Moore13, Twitter/TEN_GOP, Twitter/CassandraRules, Twitter/TXCowboysRawk.
Influential IO Account Detection.
The outcome of the automated framework proposed in this article is the identification of influential IO accounts in spreading IO narratives. This is accomplished by combining IO classifier scores with IO impact scores for a specific narrative (Fig. 9). Accounts whose behavior and content appear like known IO accounts and whose impact in spreading an IO narrative is relatively high are of potential interest. Such accounts appear in the upper right side of the scatterplot illustrated in Fig. 9. Partial validation of this approach is provided by the known IO accounts discussed above. Many other accounts in the upper right side of Fig. 9 have since been suspended by Twitter, and some at the time of writing are actively spreading conspiracy theories about the 2020 coronavirus pandemic (35). These currently active accounts participate in IO-aligned narratives across multiple geo-political regions and topics, and no matter their authenticity, their content is used hundreds of times by known IO accounts (9) (SI Appendix, section F). Also note that this approach identifies both managed IO accounts [e.g., @Pamela_Moore13, @TEN_GOP, and @TXCowboysRawk (9, 12, 13, 15)] as well as accounts of real individuals [@JackPosobiec and @CassandraRules (14, 34)] involved in the spread of IO narratives. As an effective tool for situational awareness, the framework in this article can alert social media platform providers and the public of influential IO accounts and networks and the content they spread.
Discussion
We present a framework to automate detection of disinformation narratives, networks, and influential actors. The framework integrates NLP, machine learning, graph analytics, and network causal inference to quantify the impact of individual actors in spreading the IO narrative. Application of this framework to several authentic influence operation campaigns run during the 2017 French elections provides alerts to likely IO accounts that are influential in spreading IO narratives. Our results are corroborated by independent press reports, US Congressional reports, and Twitter’s election integrity dataset. The detection of IO narratives and high-impact accounts is demonstrated on a dataset comprising 29 million Twitter posts and 1 million accounts collected in 30 d leading up to the 2017 French elections. We also measure and compare the classification performance of a semisupervised classifier for IO accounts involved in spreading specific IO narratives. At a representative operating point, our classifier performs with 96% precision, 79% recall, 96% AUPRC, and 8% EER. Our classifier precision is shown to outperform two online Bot detectors by 20% (nominally) at this operating point, conditioned on a network–community-based truth model. A causal network inference approach is used to quantify the impact of accounts spreading specific narratives. This method accounts for the influence network topology and the observed volume from each account and removes the effects of social confounders (e.g., community membership, popularity). We demonstrate the approach’s advantage over traditional impact statistics based on activity count (e.g., tweet and retweet counts) and network topology (e.g., network centralities) alone in discovering high-impact IO accounts that are independently corroborated.
Supplementary Material
Acknowledgments
This material is based upon work supported by the Under Secretary of Defense for Research and Engineering under Air Force Contract No. FA8702-15-D-0001. Any opinions, findings, conclusions or recommendations expressed in this material are those of the author(s) and do not necessarily reflect the views of the Under Secretary of Defense for Research and Engineering.
Footnotes
The authors declare no competing interest.
This article contains supporting information online at https://www.pnas.org/lookup/suppl/doi:10.1073/pnas.2011216118/-/DCSupplemental.
Data Availability.
Comma-separated value (CSV) data of the narrative networks analyzed in this paper have been deposited in GitHub (https://github.com/Influence-Disinformation-Networks/PNAS-Narrative-Networks) and Zenodo (https://doi.org/10.5281/zenodo.4361708).
References
- 1.King G., Pan J., Roberts M. E., How the Chinese government fabricates social media posts for strategic distraction, not engaged argument. Am. Polit. Sci. Rev. 111, 484–501 (2017). [Google Scholar]
- 2.Stella M., Ferrara E., De Domenico M., Bots increase exposure to negative and inflammatory content in online social systems. Proc. Natl. Acad. Sci. U.S.A. 115, 12435–12440 (2018). [DOI] [PMC free article] [PubMed] [Google Scholar]
- 3.Vosoughi S., Roy D., Aral S., The spread of true and false news online. Science 359, 1146–1151 (2018). [DOI] [PubMed] [Google Scholar]
- 4.Starbird K., Disinformation’s spread: Bots, trolls and all of us. Nature 571, 449 (2019). [DOI] [PubMed] [Google Scholar]
- 5.Rid T., Active Measures: The Secret History of Disinformation and Political Warfare (Farrar, Straus and Giroux, New York, NY, 2020). [Google Scholar]
- 6.Schmidt M. S., Perlroth N., U. S. charges Russian intelligence officers in major cyberattacks. NY Times, 19 October 2020. https://www.nytimes.com/2020/10/19/us/politics/russian-intelligence-cyberattacks.html. Accessed 19 October 2020.
- 7.Tse-tung M., On guerilla warfare. https://www.marines.mil/Portals/1/Publications/FMFRP%2012-18%20%20Mao%20Tse-tung%20on%20Guerrilla%20Warfare.pdf. Accessed 15 December 2020.
- 8.Putin V., The military doctrine of the Russian Federation. https://rusemb.org.uk/press/2029. Accessed 1 January 2018.
- 9.Gadde V., Roth Y., Enabling further research of information operations on Twitter. Twitter, 17 October 2018. https://blog.twitter.com/en_us/topics/company/2018/enabling-further-research-of-information-operations-on-twitter.html. Accessed 1 January 2020.
- 10.Smith S. T., Kao E. K., Shah D. C., Simek O., Rubin D. B., “Influence estimation on social media networks using causal inference” in Proceedings of the 2018 IEEE Statistical Signal Processing Workshop (SSP) (IEEE, Piscataway, NJ, 2018) pp. 28–32. [Google Scholar]
- 11.Birnbaum E., Mueller identified ‘dozens’ of US rallies organized by Russian troll farm. The Hill, 18 April 2019. https://thehill.com/policy/technology/439532-mueller-identified-dozens-of-us-rallies-organized-by-russian-troll-farm. Accessed 1 March 2019.
- 12.US House Permanent Select Committee on Intelligence , HPSCI minority exhibits during open hearing, memorandum, 1 November 2017. https://intelligence.house.gov/uploadedfiles/hpsci_minority_exhibits_memo_11.1.17.pdf. Accessed 1 January 2018. [Google Scholar]
- 13.US House Permanent Select Committee on Intelligence , Exhibit of the user account handles that Twitter has identified as being tied to Russia’s “Internet Research Agency.” https://intelligence.house.gov/uploadedfiles/exhibit_b.pdf. Accessed 1 January 2018.
- 14.Marantz A., The far-right American nationalist who tweeted #MacronLeaks. New Yorker, 7 May 2017. https://www.newyorker.com/news/news-desk/the-far-right-american-nationalist-who-tweeted-macronleaks. Accessed 1 January 2018.
- 15.Kessler A., Who is @TEN_GOP from the Russia indictment? Here’s what we found reading 2,000 of its tweets. CNN, 17 February 2018. https://www.cnn.com/2018/02/16/politics/who-is-ten-gop/index.html. Accessed 1 March 2020. [Google Scholar]
- 16.Reimers N., Gurevych I., “Sentence-BERT: Sentence embeddings using Siamese BERT-networks” in Proceedings of the 2019 Conference Empirical Methods in Natural Language Processing in 9th International Joint Conference on Natural Language Processing (EMNLP-IJCNLP), Inui K., Jiang J., Ng V., Wan X., Eds. (The Association for Computational Linguistics, Stroudsburg, PA, 2019), pp. 3973–3983.
- 17.RT en Français, «Sans moi le 7 mai», l’abstentionnisme gagne Twitter. RT en Français, 24 April 2017. https://francais.rt.com/france/37496-sans-moi-7-mai-abstentionnisme-gagne-twitter. Accessed 24 April 2017.
- 18.Borger J., US official says France warned about Russian hacking before Macron leak. The Guardian, 9 May 2017. https://www.theguardian.com/technology/2017/may/09/us-russians-hacking-france-election-macron-leak. Accessed 1 January 2018.
- 19.McCallum A. K., Mallet: A machine learning for language toolkit. http://mallet.cs.umass.edu. Accessed 1 January 2018.
- 20.Pedregosa F., et al. , Scikit-learn: Machine learning in python. J. Mach. Learn. Res. 12, 2825–2830 (2011). [Google Scholar]
- 21.Ratner A., et al. , Snorkel: Rapid training data creation with weak supervision. Proc. VLDB Endowment 11, 269–282 (2017). [DOI] [PMC free article] [PubMed] [Google Scholar]
- 22.Kao E. K., Smith S. T., Airoldi E. M., Hybrid mixed-membership blockmodel for inference on realistic network interactions. IEEE Trans. Netw. Sci. Eng. 6, 336–350 (2019). [Google Scholar]
- 23.Kao E. K., Causal inference under network interference: A framework for experiments on social networks. arXiv:1708.08522 (28 August 2017).
- 24.Imbens G. W., Rubin D. B., Causal Inference for Statistics, Social, and Biomedical Sciences (Cambridge University Press, 2015). [Google Scholar]
- 25.Dearden L., Emmanuel Macron launches legal complaint over offshore account allegations spread by Marine Le Pen. The Independent, 4 May 2017. https://www.independent.co.uk/news/world/europe/french-presidential-election-latest-emmanuel-macron-legal-complaint-marine-le-pen-offshore-account-a7717461.html. Accessed 1 April 2020.
- 26.Ferrara E., Disinformation and social bot operations in the run up to the 2017 French presidential election. First Monday, 10.5210/fm.v22i8.8005 (2017). [DOI] [Google Scholar]
- 27.Varol O., Ferrara E., Davis C. A., Menczer F., Flammini A., “Online human-bot interactions: Detection, estimation, and characterization” in Proceedings of the 11th International AAAI Conference on Web and Social Media (ICWSM 2017) (International World Wide Web Conferences Steering Committee, Geneva, Switzerland, 2017), pp. 280–289. [Google Scholar]
- 28.Peixoto T. P., Efficient Monte Carlo and greedy heuristic for the inference of stochastic block models. Phys. Rev. E 89, 012804 (2014). [DOI] [PubMed] [Google Scholar]
- 29.McEwan B., How social media misinformation wins—even if you don’t believe it. The Week, 25 January 2020. https://theweek.com/articles/890910/how-social-media-misinformation-winseven-dont-believe. Accessed 1 March 2020.
- 30.Davis C. A., Varol O., Ferrara E., Flammini A., Menczer F., “BotOrNot: A system to evaluate social bots” in Proceedings of the 25th International Conference Companion on World Wide Web (2016), pp. 273–274.
- 31.Bot Sentinel, Platform developed to detect and track political bots, trollbots, and untrustworthy accounts. https://botsentinel.com. Accessed 1 March 2020.
- 32.Rauchfleisch A., Kaiser J., The false positive problem of automatic bot detection in social science research. PLoS One 15, e0241045 (2020). [DOI] [PMC free article] [PubMed] [Google Scholar]
- 33.Smith S. T., Kao E. K., Senne K. D., Bernstein G., Philips S., Bayesian discovery of threat networks. IEEE Trans. Signal Process. 62, 5324–5338 (2014). [Google Scholar]
- 34.Fairbanks C., Cassandra Fairbanks. Sputnik News. https://sputniknews.com/authors/cassandra_fairbanks. Accessed 1 March 2020.
- 35.Donati J., U.S. adversaries are accelerating, coordinating coronavirus disinformation, report says. The Wall Street Journal, 21 April 2020. https://www.wsj.com/articles/u-s-adversaries-are-accelerating-coordinating-coronavirus-disinformation-report-says-11587514724. Accessed 21 April 2020. [Google Scholar]
Associated Data
This section collects any data citations, data availability statements, or supplementary materials included in this article.
Supplementary Materials
Data Availability Statement
Comma-separated value (CSV) data of the narrative networks analyzed in this paper have been deposited in GitHub (https://github.com/Influence-Disinformation-Networks/PNAS-Narrative-Networks) and Zenodo (https://doi.org/10.5281/zenodo.4361708).


