

Abstract
Neurogenesis in the adult hippocampus declines with age, a process that has been implicated in cognitive and emotional impairments. However, the mechanisms underlying this decline have remained elusive. Here, we show that the age‐dependent downregulation of lamin B1, one of the nuclear lamins in adult neural stem/progenitor cells (ANSPCs), underlies age‐related alterations in adult hippocampal neurogenesis. Our results indicate that higher levels of lamin B1 in ANSPCs safeguard against premature differentiation and regulate the maintenance of ANSPCs. However, the level of lamin B1 in ANSPCs declines during aging. Precocious loss of lamin B1 in ANSPCs transiently promotes neurogenesis but eventually depletes it. Furthermore, the reduction of lamin B1 in ANSPCs recapitulates age‐related anxiety‐like behavior in mice. Our results indicate that the decline in lamin B1 underlies stem cell aging and impacts the homeostasis of adult neurogenesis and mood regulation.
Keywords: adult hippocampal neurogenesis, lamin B1, mood regulation, stem cell aging
Subject Categories: Development & Differentiation, Neuroscience, Regenerative Medicine
Ablation of the nuclear envelope protein lamin B1 in neural stem/progenitor cells disrupts neurogenesis and causes aging‐associated behavioral changes in mice.
Introduction
The continuous generation of new neurons in the dentate gyrus (DG) of the hippocampus provides structural and functional plasticity in the adult brain (Goncalves, Schafer et al, 2016; Anacker & Hen, 2017). Radial glia‐like adult neural stem cells (RGL‐ANSCs, also referred to as type‐1 cells) have the capability to be activated and to give rise to dentate granule cells (DGCs) via the amplification of proliferating adult neural progenitor cells (ANPCs, also referred to as intermediate progenitor cells or type‐2a cells) and neuroblasts throughout life in most mammals (Ming & Song, 2005). Studies have proposed that impaired neurogenesis underlies the pathophysiology of some cognitive and emotional disorders (Cameron & McKay, 1998; Deng, Aimone et al, 2010; Anacker & Hen, 2017; Toda, Parylak et al, 2018); therefore, maintaining neurogenesis is vital to retain healthy brain function throughout life.
Aging is one of the most critical predictors of dementia and neurodegenerative disease, as well as a strong contributing factor to the reduction in adult hippocampal neurogenesis in healthy individuals. Based on the functional importance of adult‐born neurons (Saxe, Battaglia et al, 2006; Clelland, Choi et al, 2009; Deng, Saxe et al, 2009; Sahay, Scobie et al, 2011; Nakashiba, Cushman et al, 2012; Akers, Martinez‐Canabal et al, 2014; McAvoy, Scobie et al, 2016), age‐dependent reductions in neurogenesis may underlie age‐related mood dysregulation and cognitive decline (Campbell, Marriott et al, 2004; van Praag, Shubert et al, 2005; Surget, Saxe et al, 2008; Villeda, Luo et al, 2011; Lehmann, Brachman et al, 2013; Smith, He et al, 2015). Supposedly, one of the key mechanisms underlying this reduction in neurogenesis is somatic stem cell aging. Somatic stem cells replenish new cells and contribute to tissue homeostasis and plasticity in adult tissues (Kubben & Misteli, 2017). As somatic stem cells age, their capacity to generate new neurons deteriorates (Seki & Arai, 1995; Kuhn, Dickinson‐Anson et al, 1996; Ben Abdallah, Slomianka et al, 2010; Lugert, Basak et al, 2010; Encinas, Michurina et al, 2011; Kuipers, Schroeder et al, 2015). This age‐dependent reduction in neurogenesis can be observed as early as 5 months of age in mice (Ben Abdallah et al, 2010; Encinas et al, 2011), but the mechanisms underlying this phenomenon have remained elusive.
Nuclear lamins play a pivotal role in cellular aging and comprise two major types: A‐type (lamins A and C) and B‐type (lamins B1 and B2). Lamins are nuclear intermediate filaments and are the main components of the nuclear laminas at the nuclear periphery, which anchor heterochromatin and are believed to contribute to stable gene repression in a cell type‐specific manner (Peric‐Hupkes & van Steensel, 2010; Butin‐Israeli, Adam et al, 2012; Zuela, Bar et al, 2012). Mutations in LMNA cause several genetic diseases, including a premature aging disease known as Hutchinson–Gilford Progeria syndrome (HGPS) (Butin‐Israeli et al, 2012). However, most of the diseases that involve A‐type lamins affect peripheral tissues, not the brain. Conversely, many tissues remain normal in Lmnb1 knockout mice despite B‐type lamins having a broad expression pattern (Coffinier, Jung et al, 2011; Kim, Sharov et al, 2011). In addition, B‐type lamins are not essential to the maintenance of either embryonic stem cells or keratinocytes (Kim et al, 2011; Yang, Chang et al, 2011). On the other hand, knockout of Lmnb1 in mice causes severe developmental defects in the central nervous system (Coffinier et al, 2011; Mahajani, Giacomini et al, 2017), suggesting brain‐specific roles for lamin B1 in development. Depletion of lamin B1 has also been implicated in cellular senescence (Sadaie, Salama et al, 2013; Chen, Zheng et al, 2014), and lamins contribute to asymmetric segregation of damaged proteins to likely prevent stem cell aging (Moore, Pilz et al, 2015). Coincidently, when we looked for nuclear structural proteins contributing to the maintenance of neural stem cells in our previous studies (Bracko, Singer et al, 2012; Toda, Hsu et al, 2017), we found that Lmnb1 was highly expressed in adult neural stem/progenitor cells (ANSPCs) in rodents, implying that lamin B1 might play specific roles in the homeostasis of ANSPCs and adult hippocampal neurogenesis. However, due to the perinatal lethality and severe developmental deficits in the embryonic nervous system of Lmnb1 knockout mice, the roles for lamin B1 in the adult brain remain largely elusive.
Here, we investigated the role of lamin B1 in the maintenance of adult hippocampal neurogenesis during aging. We first characterized the expression pattern of lamin B1 in the dentate gyrus (DG) of the hippocampus, observing that lamin B1 is highly expressed in ANSPCs but its expression levels decline with age as early as 5 months, coinciding with the timing of reduced adult neurogenesis. To address the consequence of declining lamin B1, we generated a mouse line with conditional knockout of Lmnb1 from ANSPCs that revealed critical roles in the maintenance of neurogenesis and adult‐born neurons. Strikingly, we found that a precocious depletion of lamin B1 in ANSPCs recapitulated age‐related anxiety‐like behavior. We investigated the roles of lamin B1 in the maintenance of adult hippocampal neurogenesis. Taken together, our data provide new insights into how nuclear lamins regulate the homeostasis of adult hippocampal neurogenesis and identify lamin B1 as a key target in neural stem cell aging.
Results
Lamin B1 is highly expressed in ANSPCs
Our previous transcriptomic analysis indicated that Lmnb1 is highly expressed in ANSPCs and immature neurons (Bracko et al, 2012; Toda et al, 2017). To address the function of lamin B1 in adult hippocampal neurogenesis, we first explored the expression pattern of lamin B1 protein using immunohistochemistry. We found a strong enrichment of lamin B1 signal in the subgranular zone (SGZ) of the DG where ANSPCs reside (Fig 1A). When we refer to combined population ANPCs and ANSCs, we use the term ANSPCs, in accordance with existing literature. However, where possible we have sought to segregate cells into RGL‐ANSCs and ANPCs using additional features. At higher magnification, we observed that lamin B1 was highly expressed in SGZ cells positive for Sox2, a marker for ANSPCs, or polysialylated‐neural cell adhesion molecule (PSA‐NCAM), a marker for adult‐born immature neurons (Fig 1B). In contrast, lamin B1 was not highly expressed in dentate granule cells (DGCs, Prox1‐positive cells) in the granular layers of the hippocampus (Fig 1A and B). The level of lamin B1 between RGL‐ANSCs and ANPCs was also compared using pNestin‐GFP transgenic mice (Yamaguchi, Saito et al, 2000), and we found that the intermediate ANPCs exhibited greater laminB1 expression than RGL‐ANSCs (Fig 1C, see also Fig 2F). These data suggest that levels of lamin B1 are neural cell type‐dependent and can be dramatically reorganized during the process of adult neurogenesis (Fig 1D). To further characterize cell type‐dependent lamin B1 levels, we compared the expression levels of lamin B1 among different neural cell types using neural progenitor cells (NPCs) derived from the adult hippocampus in vitro (Ray & Gage, 2006). Over the course of neural differentiation, both lamin B1 immunoreactivity and transcripts were significantly decreased (Fig 1E and F). When lamin B1 levels were compared at the single‐cell level in various neural cell types using three‐dimensional confocal microscopy of immunocytochemistry with cell type‐specific markers (Sox2 for NPCs, Tuj1 for neurons, S100β for astrocytes, and MBP for oligodendrocytes), we found that lamin B1 levels varied not only with neuronal differentiation but among different neural cell types. Among the tested neural cell types, the level of lamin B1 was highest in NPCs and lowest in astrocytes in vitro (Signal intensity: Sox2+, 26.8 ± 0.89, Tuj1+; 15.4 ± 0.8; S100β+, 6.6 ± 0.41, MBP+, 8.1 ± 0.66, P = 1.2e−34, one‐way ANOVA; Fig 1G). Taken together, these data suggest that the levels of lamin B1 are tightly controlled depending on neural cell type.
Figure 1. Enrichment of lamin B1 in ANSPCs.
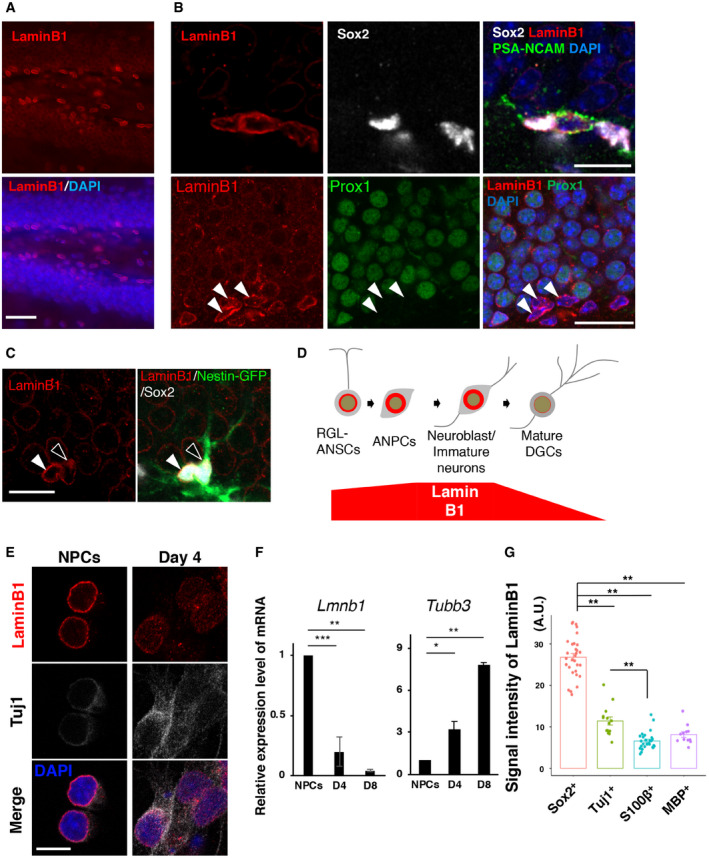
- Enrichment of lamin B1 in the SGZ of DG.
- Immunohistochemical analyses of lamin B1‐high cells. The lamin B1‐high cells express Sox2 or PSA‐NCAM, but not Prox1. Arrowheads indicate Prox1‐negative lamin B1‐high cells in the SGZ.
- Immunohistochemical analyses of lamin B1 in pNestin‐GFP mice. An open arrowhead indicates RGL‐ANSC, and a closed arrowhead indicates a non‐RGL(NR)‐NPC.
- A schema for the changes in lamin B1 levels during adult hippocampal neurogenesis.
- Immunocytochemistry of lamin B1 in NPCs and Tuj1+ differentiating neurons 4 days after the induction of differentiation.
- Relative expression of Lmnb1 and Tubb3 revealed by qRT–PCR from NPCs and differentiating neurons at the indicated days. ***P < 0.001, **P < 0.01, *P < 0.05, one‐sample t‐test (n = 4).
- Quantification of signal intensity of lamin B1 immunoreactivity in different neural cell types. F 3,82 = 173.1, P = 1.2 e‐34, n = 12–30 cells per cell type, one‐way ANOVA followed by Tukey–Kramer test (**P < 0.01).
Data information: A.U. = Arbitrary units. Bar graphs show mean ± SEM. Scale bars, 75 µm in (A), 25 µm in (B lower, C), 10 µm in (B upper, E).
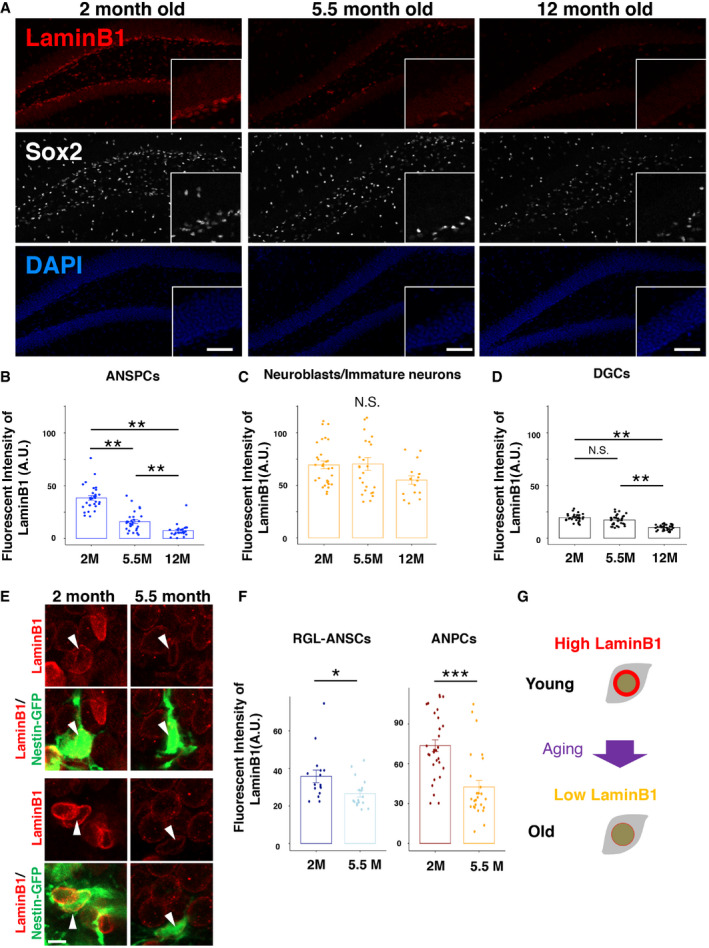
Figure 2. Age‐dependent reduction in lamin B1 in ANSPCs.
-
AAge‐dependent reduction of lamin B1 in the SGZ. As early as 5.5 months of age, the levels of lamin B1 in the SGZ were markedly reduced. Insets show higher magnification images in the SGZ.
-
B–DQuantification of lamin B1 levels using immunofluorescent signals. Lamin B1 levels in Sox2‐positive, PSA‐NCAM‐negative‐ANSPCs were selectively downregulated at 5.5 months of age (ANPCs, P = 1.02129e‐19; Neuroblasts, P = 0.09, DGCs, P = 6.4011e‐15, ANOVA). **P < 0.001, ANOVA followed by Tukey–Kramer test. (3 animals, 30 cells per conditions)
-
EAge‐dependent reduction of lamin B1 in RGL‐ANSCs (upper) and NR‐ANPC (lower) from 2 to 5.5 months of age. Arrowheads indicate RGL‐ANSCs or NR‐ANPCs.
-
FQuantification of lamin B1 levels in RGL‐ANSCs and ANPCs. *P < 0.05, ***P < 0.001, (4 animals, 18‐32 cells per conditions, Mann–Whitney test).
-
GA hypothetical model. Aging induces the reduction of lamin B1 in ANSPCs, which underlies stem cell aging.
Data information: Scale bars, 100 µm in (A), 10 µm in (E). Bar graphs show mean ± SEM. A.U. = Arbitrary units.
Age‐dependent reduction of lamin B1 in ANSPCs
Deterioration of A‐type nuclear lamins causes physiological cellular aging in peripheral organs and tissues, as well as premature aging diseases such as HGPS (Scaffidi & Misteli, 2006; Scaffidi & Misteli, 2008; Butin‐Israeli et al, 2012). Neither a mouse model of HGPS nor human patients have shown clear age‐related neurological phenotypes (Baek, Schmidt et al, 2015; Ullrich & Gordon, 2015), presumably due to the lack of lamin A expression in neural cells (Jung, Coffinier et al, 2012). Whether lamins are implicated in brain aging has thus remained unknown. We therefore investigated whether lamin B1 levels change in the context of adult hippocampal neurogenesis over the course of brain aging. We conducted immunohistochemical analyses of the mouse DG between 2 and 12 months of age. We quantified laminB1 signals using Sox2, a marker of both ANSCs and ANPCs. Compared to 2‐month levels, lamin B1 immunofluorescence levels in the SGZ were markedly reduced as early as 5.5 months of age, despite the fact that Sox2‐positive ANSPCs still existed in the SGZ (Fig 2A). We quantified immunofluorescent signals of lamin B1 in ANSPCs (Sox2‐positive, PSA‐NCAM‐negative cells in the SGZ), immature neurons (PSA‐NCAM‐positive, Sox2 negative cells), and DGCs (in the outer granular layer). Lamin B1 levels were reduced in ANSPCs as early as 5.5 months of age (Signal intensity, arbitrary unit; 2M, 38.4 ± 2.2; 5.5M, 16.1 ± 1.8; 12M, 7.5 ± 1.2; P = 1.02e−19, ANOVA; Fig 2B), whereas lamin B1 levels in immature neurons were not significantly changed with age (Signal intensity, arbitrary unit; 2M, 69.5 ± 3.7; 5.5M, 70.3 ± 6.1; 12M, 55.0 ± 4.0; P = 0.09, ANOVA; Fig 2C). Lamin B1 levels declined only at the 12‐month time point in DGCs (Signal intensity, arbitrary unit; 2M, 19.6 ± 0.66; 5.5M, 17.3 ± 0.89; 12M, 10.2 ± 0.47; P = 0.09, ANOVA P = 6.4e−15, ANOVA; Fig 2D). Since Sox2‐positive ANSPCs are primarily affected by aging (Fig 2A–D), we examined whether the effect of aging on the levels of lamin B1 was different between RGL‐ANSCs and ANPCs. We found that both exhibited reduced levels of lamin B1 from 2 to 5.5 months of age (Fig 2E and F; RGL‐ANSCs 2M; 35.8 ± 3.4, 5.5M, 26.6 ± 1.8; ANPCs 2M, 75.9 ± 4.4; 5.5M, 33.9 ± 2.9; *P < 0.05, ***P < 0.001, t‐test), indicating that aging might affect both RGL‐ANSCs and ANPCs through lamin B1 reduction (Fig 2E and F). The early reduction in lamin B1 in ANSPCs is temporally correlated with early age‐dependent reductions in adult hippocampal neurogenesis (Ben Abdallah et al, 2010; Encinas et al, 2011). Therefore, we hypothesized that high levels of lamin B1 in ANSPCs are essential for the maintenance of adult hippocampal neurogenesis and that the age‐dependent decline in lamin B1 contributes to age‐related loss of neurogenic capability in the hippocampus (Fig 2G).
Precocious reduction of lamin B1 in ANSPCs induces age‐related anxiety‐like behavior
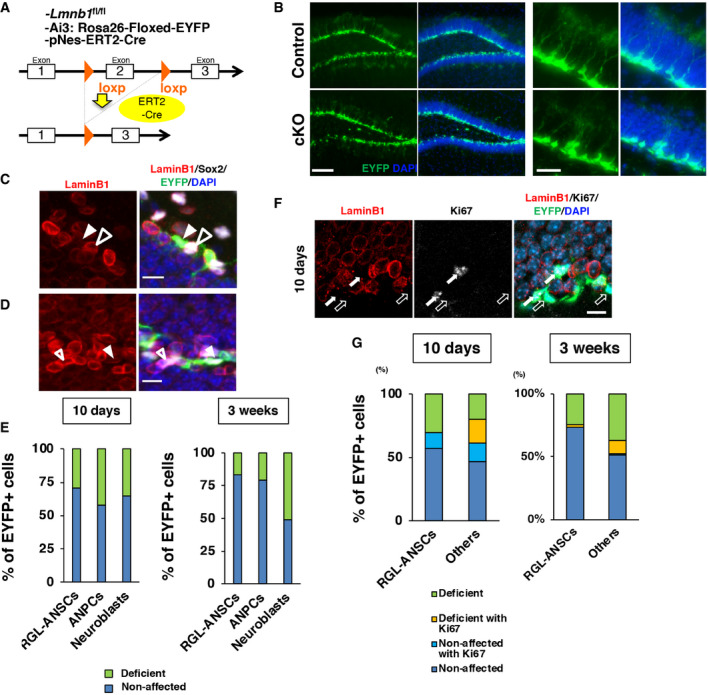
To determine the effect of reduced lamin B1 in the adult brain, we designed a genetic system to conditionally knock out Lmnb1 in ANSPCs to avoid the perinatal lethality associated with constitutive Lmnb1 knockout (Coffinier et al, 2011). Mice carrying a nestin promoter‐driven tamoxifen‐inducible Cre‐ERT2 fusion protein (pNes‐ERT2‐Cre) were crossed to mice carrying a conditional Lmnb1 allele (Yang et al, 2011) (Fig EV1A) and a Cre‐dependent yellow fluorescent reporter allele (R26Ai3). In this system, tamoxifen (TAM) treatment triggers Lmnb1 knockout selectively in nestin‐expressing ANSPCs, and both the mutant ANSPCs and their progeny can be visualized via expression of yellow fluorescent protein (EYFP) (Madisen, Zwingman et al, 2010). Ten days after the infusion of TAM, we observed induction of EYFP in the SGZ and reduction in lamin B1 immunoreactivity within EYFP+ cells compared to non‐EYFP+ cells (Fig EV1B–D). We quantified the fraction of laminB1 deficiency in EYFP+ cells as either complete loss or more than 30% immunofluorescent signal reduction (Fig EV1C–E). Although laminB1 deficiency was observed 10 days after TAM induction, the fraction of lamin B1‐deficient cells in RGL‐ANSCs and ANPCs was not further increased 3 weeks after TAM induction (fraction of lamin B1‐deficient cells after 10 days, 29.7% in RGL‐ANSCs, 42.5% in ANPCs, and 35.5% in neuroblasts; fraction of lamin B1‐deficient cells after 3 weeks, 17.2% in RGL‐ANSCs, 20.3% in ANPCs, and 51.2% in neuroblasts). Using Ki67, a proliferating cell marker, we then examined whether proliferating cells preferentially lost or reduced lamin B1 (Fig EV1F and G). We observed loss of lamin B1 in Ki67+ non‐RGL‐ANSCs cells (10 days, Ki67+ laminB1‐deficient cells, 17.9%, 3 weeks Ki67+ laminB1‐deficient cells, 9.9%). However, we rarely observed lamin B1 deficiency in Ki67+ RGL‐ANSCs (10 days, Ki67+ laminB1‐deficient cells, 0%; 3 weeks Ki67+ laminB1‐deficient cells, 2.4%). These observations imply that depletion of lamin B1 proteins requires cellular proliferation after the activation of RGL‐ANSCs.
Figure EV1. Generation and evaluation of Lmnb1 conditional knockout mouse line.
-
AA schematic illustration of Lmnb1 conditional knockout mouse line (cKO).
-
BInduction of EYFP in ANSCPs 10 days after the administration of TAM in the SGZ of DG.
-
C, DRepresentative images of lamin B1 complete‐loss cell (arrowhead) and non‐EYFP ANPC (open arrowhead) (C), lamin B1 partial‐loss cell (arrowhead), and non‐EYFP ANPC (open arrowhead) (D).
-
EThe fractions of EYFP+ cells with lamin B1 deficiency for each cell type 10 days or 3 weeks after TAM administration (Total number of counted cells, 10 days; RGL‐ANSCs. 81 cells, ANPCs = 116 cells, Neuroblasts = 74 cells from 3 animals; 3 weeks, RGL‐ANSCs = 39 cells, ANPCs = 59 cells, neuroblasts = 84 cells from 3 animals). Lamin B1‐deficient cells are defined as having 30% or more reduced levels of lamin B1 intensity compared to the averaged intensity of the same type of control cells.
-
FA confocal image of lamin B1 deficiency in Ki67+ proliferating cells (arrows) 10 days after TAM infusion. Open arrows indicate lamin B1 deficient cells without Ki67.
-
GThe fraction of lamin B1‐deficient cells in Ki67+ proliferating cells. Ki67+ non‐RGL cells (others cells) show lamin B1 deficiency whereas only a few Ki67+ RGL‐ANSCs exhibit laminB1 deficiency, implying the necessity for cellular proliferation to deplete lamin B1 proteins (Total number of counted cells, 10 days; RGL‐ANSCs. 115 cells, non‐RGL cells = 196 cells, from 3 animals; 3 weeks; RGL‐ANSCs. 42 cells, non‐RGL cells = 142 cells, from 3 animals).
Data information: Scale bars, 200 µm in (B, Left), 50 µm in (B, Right), 10 µm (C, D, F).
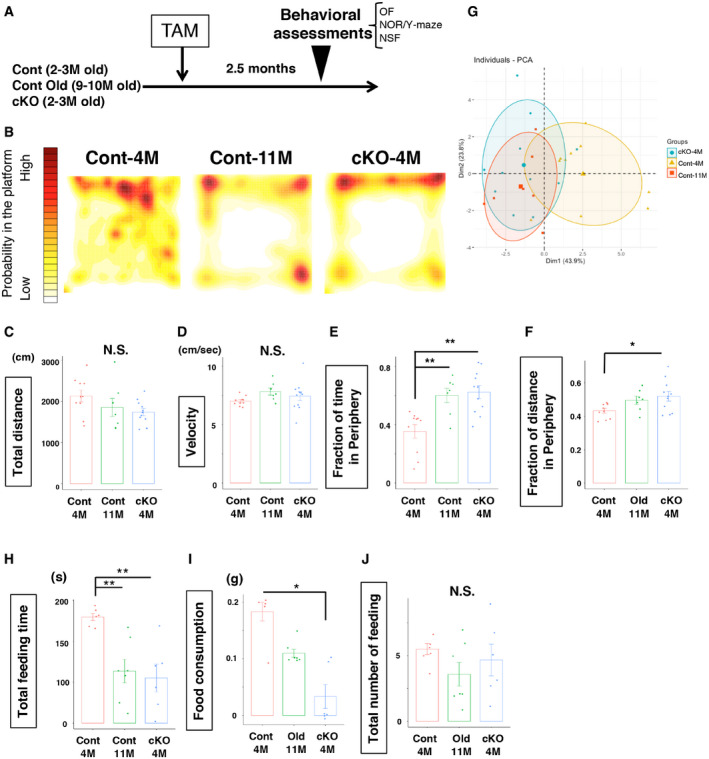
Using this lamin B1 conditional knockout mouse model, we examined if a precocious reduction in lamin B1 from ANSPCs recapitulated brain aging at the behavioral level (Fig 3A). Since it takes 3 weeks to reduce lamin B1 proteins in 51% of neuroblasts (Fig EV1E), and adult‐born neurons take 6–7 weeks to fully mature after their production, we waited for two and a half months after the infusion of TAM to compare locomotor and anxiety‐like behavior among young control (Lmnb1+/+:pNes‐ERT2‐Cre:R26Ai, Cont‐4M; 4.5‐ to 5.5‐month‐old), young Lmnb1‐cKO (Lmnb1fl/fl:pNes‐ERT2‐Cre:R26Ai, cKO‐4M; 4.5‐ to 5.5‐month‐old), and old control (Lmnb1+/+:pNes‐ERT2‐Cre:R26Ai, Cont‐11M; 11.5‐ to 12.5‐month‐old) mice using the open‐field test (OF) (Seibenhener & Wooten, 2015). We did not observe significant differences in total ambulatory distance (Cont‐4M 2,133 ± 143 cm, Cont‐11M 1,856 ± 184 cm, cKO‐4M 1,717 ± 94 cm, P = 0.13, ANOVA) or average velocity (Cont‐4M 7.01 ± 0.13 cm/s, Cont‐11M 7.81 ± 0.30 cm/s, cKO‐4M 7.35 ± 0.39 cm/sec, P = 0.22, ANOVA) among the three groups, but rearing counts were reduced in Cont‐11M mice (Cont‐4M 175.6 ± 26.8, Cont‐11M 46.6 ± 21.2, cKO‐4M 147.5 ± 36.9, P = 0.032, ANOVA, Fig EV2A), presumably due to their age. In general, a precocious depletion of lamin B1 in ANSPCs did not affect locomotor ability (Fig 3C and D). We then investigated anxiety‐like behaviors based on thigmotaxis, a preference for staying in the periphery of the arena (Simon, Dupuis et al, 1994; David, Samuels et al, 2009; Seibenhener & Wooten, 2015). Compared to young Cont‐4M mice, old Cont‐11M mice showed an increased preference for staying close to the wall of the arena (Fig 3B). Quantitative analyses revealed that Cont‐11M mice rested in and spent a longer time in the periphery of the arena than in the center of the arena, indicating an age‐dependent increase in anxiety (Figs 3B, E and F, and EV2C–E), which is consistent with a previous report (Shoji, Takao et al, 2016). Intriguingly, cKO‐4M mice also spent more time in the periphery of the arena than age‐matched controls (Fig 3B and E, fraction of time in periphery, Cont‐4M 0.35 ± 0.046, Cont‐11M 0.60 ± 0.049, cKO‐4M 0.62 ± 0.043, P = 0.00044, ANOVA; Fig 3F, fraction of distance in periphery, Cont‐4M 0.43 ± 0.012, Cont‐11M 0.49 ± 0.018, cKO‐4M 0.52 ± 0.026, P = 0.0013, ANOVA; Fig EV2C, total resting time, Cont‐4M 3.58 ± 0.30 min, Cont‐11M 4.76 ± 0.42 min, cKO‐4M 4.68 ± 0.23 min, P = 0.019; Fig EV2D, resting time in periphery, Cont‐4M 1.38 ± 0.25 min, Cont‐11M 3.12 ± 0.35 min, cKO‐4M 3.29 ± 0.34 min, P = 0.0023, ANOVA; P = 0.0057, Kruskal–Wallis test). The cKO‐4M mice did not differ from Cont‐11M mice in their preference for the periphery, supporting the idea that a precocious reduction in lamin B1 from ANSPCs triggers age‐related anxiety‐like behavior. The mean duration of stereotypic behavior, which is associated with aging, was also increased in cKO‐4M mice, similar to Cont‐11M mice (Fig EV2B, mean stereotypic time, Cont‐4M 1.7 ± 0.015 s, Cont‐11M 1.8 ± 0.025 s, cKO‐4M 1.77 ± 0.0056 s, P = 0.0035, ANOVA). To assess behavioral changes in an unbiased way, we conducted a principal components analysis (PCA) of the OF data with 16 recorded parameters (ex. resting time, distance travelled, velocity, etc.). Cont‐11M mice were clustered differently from Cont‐4M mice, indicating that PCA analyses could segregate the two populations (Fig 3G). cKO‐4M mice clustered together with old Cont‐11M mice (Fig 3G). Thus, accounting for all behavioral changes in the OF, young cKO‐4M mice shared similar behavioral traits with old Cont‐11M mice, supporting our hypothesis that the reduction in lamin B1 in ANSPCs underlies brain aging at least to some extent. Note that neither spontaneous alternation ratios in the Y‐maze test nor novel object discrimination performance were affected (Fig EV2F, Y‐maze % alternation, Cont‐4M 56.9 ± 4.8%, Cont‐11M 57.4 ± 9.8%, cKO‐4M 60.1 ± 4.9%, P = 0.89, ANOVA; Fig EV2G, novel object preference, Cont‐4M 0.66 ± 0.053, Cont‐11M 0.60 ± 0.075, cKO‐4M 0.66 ± 0.036, P = 0.45, ANOVA), suggesting that working memory to recognize new areas/objects was not significantly affected by aging or by the reduction in lamin B1.
Figure 3. Precocious reduction of lamin B1 in ANSPCs induces anxiety‐like behaviors.
-
ASchematic of TAM treatment and behavioral tests.
-
B–FOpen‐field (OF) test. (B) Color‐coded distribution of the exploratory path in the open‐field test. X‐Y axes of squares correspond to the OF arena. Old WT mice and Lmnb1‐cKO mice spend more time in the periphery of the OF arena. (C) Total distance travelled during the OF test. No significant difference among groups. F 2,25 = 2.23, P = 0.13, ANOVA. (D) Velocity of travel during the OF test. F 2,25 = 1.60, P = 0.22, ANOVA. N.S. (not significant). (E) Fraction of time spent in the periphery. F 2, 25 = 10.71, P = 0.00044, ANOVA followed by Tukey–Kramer, **P < 0.01. (F) Fraction of travelled distance in the periphery, F 2, 25 = 3.84, P = 0.035, ANOVA followed by Tukey–Kramer, *P < 0.05 (n: WT = 10, WT‐old = 7, Lmnb1‐cKO = 11 for the OF test).
-
GPrincipal components analysis of behavior from the OF test (n: WT = 10, WT‐old = 7, Lmnb1‐cKO = 11 for the OF test). Circles indicate 66% confidence levels for each group.
-
H–JNovelty‐suppressed feeding. (H) Total feeding time during the NSF test, P = 0.0068, Kruskal–Wallis test followed by Dunn’s test. **P < 0.01. (n: WT = 6, WT‐old = 7, Lmnb1‐cKO = 6 for novelty‐suppressed feeding). (I) Food consumption during the NSF test, P = 0.014, Kruskal–Wallis test followed by Dunn’s test. *P < 0.05. (J) Total number of feeding instances during NSF test. N.S. (not significant).
Data information: Bar graphs show mean ± SEM.
Figure EV2. Increased age‐related behavior in Lmnb1‐cKO mice.
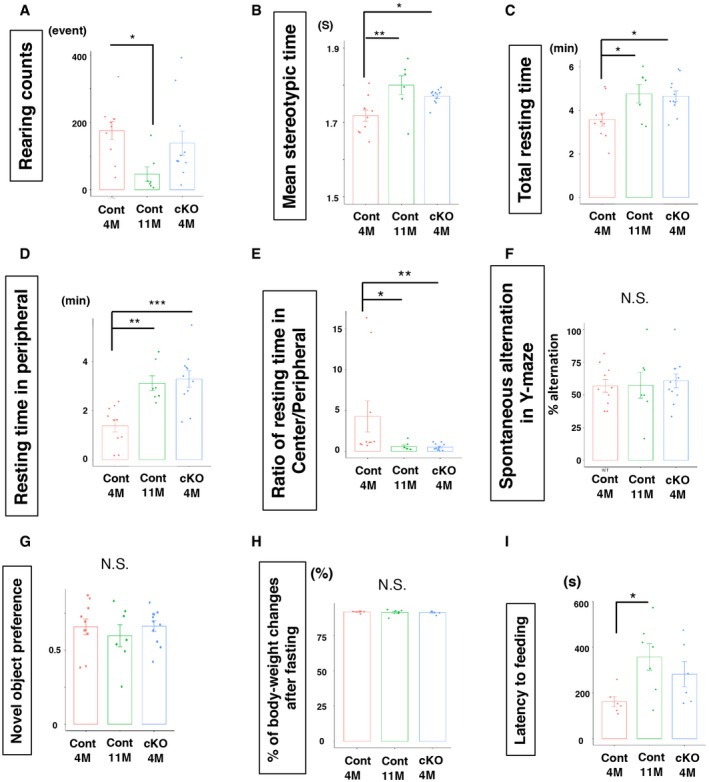
- Rearing counts during the OF test. F 2,25 = 3.95, *P = 0.032, ANOVA followed by Tukey–Kramer (n: WT = 10, WT‐old = 7, Lmnb1‐cKO = 11 for the OF test).
- Average time spent on stereotypic behavior. F 2, 25) = 7.15, P = 0.0035, ANOVA followed by Tukey–Kramer, *P < 0.05, **P < 0.01 (n: WT = 10, WT‐old = 7, Lmnb1‐cKO = 11 for the OF test).
- Total resting time in the OF. F( 2, 25) = 4.65, P = 0.018, ANOVA followed by Tukey–Kramer, *P < 0.05 (n: WT = 10, WT‐old = 7, Lmnb1‐cKO = 11 for the OF test).
- Total resting time in the peripheral area. F 2,25 = 12.34, P = 0.00019, ANOVA followed by Tukey–Kramer, **P < 0.01, ***P < 0.001 (n: WT = 10, WT‐old = 7, Lmnb1‐cKO = 11 for the OF test).
- Ratio of resting time between center and peripheral area. Kruskal–Wallis test followed by Dunn test, *P < 0.015, **P < 0.01 (n: WT = 10, WT‐old = 7, Lmnb1‐cKO = 11 for the OF test).
- No significant changes in spontaneous alternation in Y‐maze test. F 2,25 = 0.12, P = 0.89, ANOVA (n: WT = 10, WT‐old = 7, Lmnb1‐cKO = 11).
- Preference to novel object was not different among three groups F 2,25 = 3.39, P = 0.45, ANOVA) (n: WT = 10, WT‐old = 7, Lmnb1‐cKO = 11 for the OF test).
- Proportional body weight loss after 24‐h food deprivation for the NSF test F 2,25 = 6.11, P = 0.94, ANOVA) (n: WT = 6, WT‐old = 7, Lmnb1‐cKO = 6).
- Latency to feed in NSF test. Kruskal–Wallis test followed by Steel test, *P = 0.038, (n: WT = 6, WT‐old = 7, Lmnb1‐cKO = 6).
Data information: Data are presented as mean ± SEM.
To verify our observations in the OF, we performed the novelty‐suppressed feeding test (NSF) as an additional measure of anxiety‐like behavior. A food pellet was placed in the center of a brightly lit arena, thus requiring mice to venture into an aversive environment to feed. Less time spent feeding and less food consumption are considered indicators of higher anxiety in this model (Samuels & Hen, 2011). Mice were fasted for 24 h prior to testing to provide increased incentive to eat, and this deprivation period similarly reduced the body weight of mice in all groups (% body weight, Cont‐4M 91.6 ± 0.68%, Cont‐11M 91.4 ± 2.0%, cKO‐4M 91.3 ± 1.1%, P = 0.93, ANOVA; Fig EV2H). Old Cont‐11M mice showed longer latency to feed, suggesting age‐related anxiety, whereas cKO‐4M mice showed a trend of increased latency compared to Cont‐4M mice but not significantly different (Fig EV2I, latency to feeding, Cont‐4M 161.8 ± 22.2 s, Cont‐11M 322.3 ± 57.7 s, cKO‐4M 281.7 ± 55.0 s, P = 0.036, Kruskal–Wallis test). However, Cont‐11M and cKO‐4M mice spent less total time feeding than Cont‐4M mice (Fig 3H, Total feeding time, Cont‐4M 129.7 ± 4.2 s, Cont‐11M 63.6 ± 14.4 s, cKO‐4M 55.2 ± 15.7 s, P = 0.0068, Kruskal–Wallis test). In addition, cKO‐4M mice ate significantly less than Cont‐4M mice during the test (Fig 3I, Food consumption, Cont‐4M 0.16 ± 0.030 g, Cont‐11M 0.11 ± 0.007 g, cKO‐4M 0.03 ± 0.019 g, P = 0.014, Kruskal–Wallis test). Total instances of feeding were not significantly different (Fig 3J, total instance of feeding, Cont‐4M 5.5 ± 0.43, Cont‐11M 3.6 ± 0.90, cKO‐4M 4.7 ± 1.2, P = 0.32, ANOVA). Combined the reduction in time spent feeding and food consumption in cKO‐4M compared to Cont‐4M mice supports the idea that cKO‐4M mice exhibited heightened anxiety and that a reduction in lamin B1 in ANSPCs induced anxiety‐like behavior as in old mice.
Precocious lamin B1 reduction induces neuronal differentiation in the short term
We hypothesized that the precocious depletion of lamin B1 promotes age‐dependent reductions in adult hippocampal neurogenesis and results in the induction of the age‐related anxiety‐like behavior we observed in young mice (Fig 3). To further address this idea, we investigated how knockout of lamin B1 in ANSPCs affects the process of adult hippocampal neurogenesis in vivo.
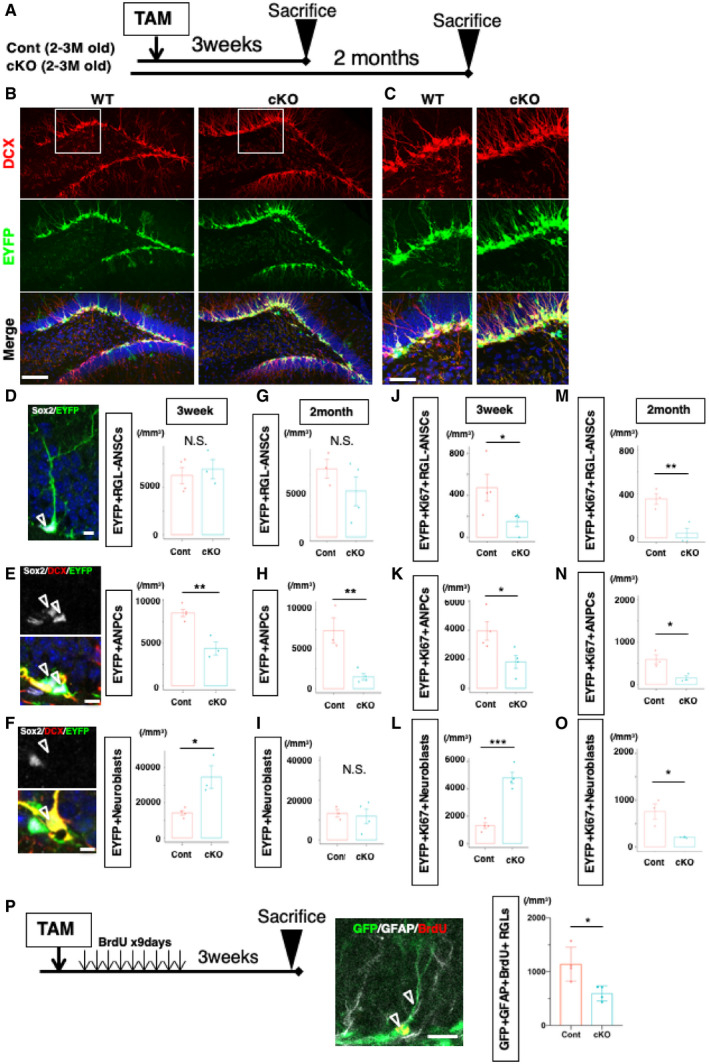
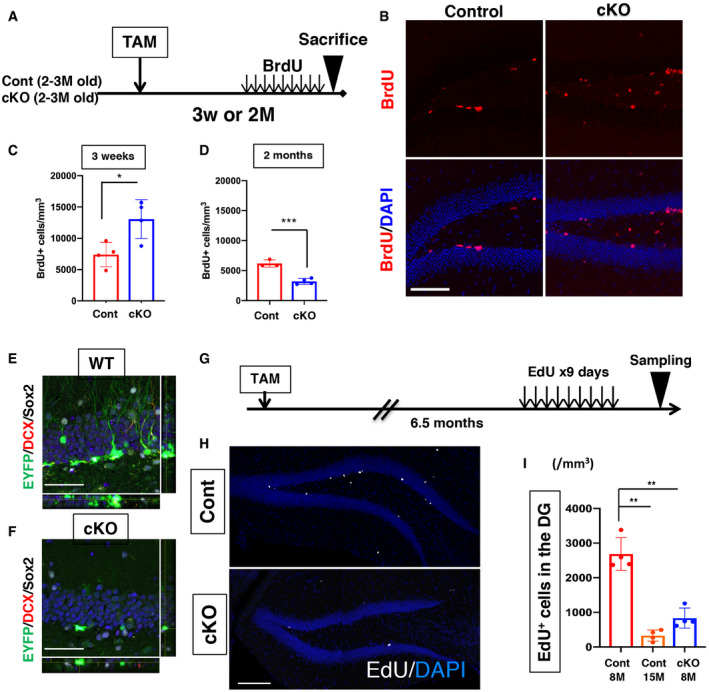
We examined the process of adult hippocampal neurogenesis using immunohistochemical approaches 3 weeks or 2 months after the infusion of TAM, time points corresponding to when lamin B1 proteins were depleted or immediately prior to the time point where we started to perform behavioral assessments (Fig 4A). We investigated the density of different cellular populations in the process of adult hippocampal neurogenesis among EYFP+ cells with morphological features and cell type marker (Fig 4B and C). We found that the density of RGL‐ANSCs (Sox2‐positive, doublecortin (DCX)‐negative, with a radial fiber) was not altered 3 weeks after TAM infusion (Cont 6244.8 ± 867.1 cells/mm3, cKO 6919.5 ± 1,026.2 cells/mm3, P = 0.65, t‐test; Fig 4D). Two months after TAM infusion, there was still no significant reduction in the density of RGL‐ANSCs (Cont 8171.5 ± 1,126.1 cells/mm3, cKO 5484 ± 1,732.5 cells/mm3, P = 0.29, t‐test; Fig 4G). However, the densities of ANPCs/proliferating neural progenitors (Sox2‐positive, DCX‐negative cells without a radial fiber) were significantly decreased in cKO mice after 3 weeks (Cont 8524.4 ± 423.3 cells/mm3, cKO 4376.9 ± 761.7 cells/mm3,, P = 0.0037, t‐test; Fig 4E) and were further reduced after 2 months (Cont 7364.2 ± 1,611.8 cells/mm3, cKO 1,478.1 ± 397.9 cells/mm3, P = 0.0092, t‐test; Fig 4H). We then analyzed the density of neuroblasts/adult‐born immature neurons (Sox2‐negative, DCX‐positive cells) and found that neuroblasts/immature neurons were markedly increased in cKO mice 3 weeks after TAM infusion (Cont 14,255.0 ± 1242.3 cells/mm3, cKO 34636.7 ± 6297.5 cells/mm3, P = 0.014, t‐test; Fig 4F). However, this increase in immature neurons was already attenuated 2 months after TAM infusion and some samples showed reduced numbers of immature neurons (Cont 13,322.3 ± 1,586.1 cells/mm3, cKO 11,891.2 ± 3,633.9 cells/mm3, P = 0.76, t‐test; Fig 4I), suggesting that the production of newborn neurons was relatively reduced from 3 weeks after TAM treatment and came back to control levels at that time. To confirm our observation, after TAM infusion, bromodeoxyuridine (BrdU) was injected once a day for 9 days to label proliferating cells in the DG, and mice were sacrificed 1 day after the final BrdU injection. Three weeks after TAM infusion, BrdU+ cells were increased in cKO mice (Cont 7392.8 ± 1,690.2 cells/mm3, cKO 1,3078.92 ± 2,701.4 cells/mm3, P = 0.021, t‐test; Fig EV3A–C). However, BrdU+ cells were significantly reduced 2 months after TAM infusion (Cont 6183.7 ± 348.6 cells/mm3, cKO 3194.1 ± 238.9 cells/mm3, P = 0.0007, t‐test; Fig EV3D), suggesting that knockout of lamin B1 transiently increased the production of new cells but eventually reduced it. We further characterized Ki67+ proliferating cells for each cell type. Three weeks after TAM treatment, the densities of Ki67+ RGL‐ANSCs and Ki67+ ANPCs were reduced (RGL‐ANSCs, Cont 477.3 ± 127.3 cells/mm3, cKO 150.5 ± 50.4 cells/mm3, P = 0.029; ANPCs, Cont 3947.5 ± 635.6 cells/mm3, cKO 1,822.6 ± 448.9 cells/mm3, P = 0.034, respectively; Fig 4J and K), but the density of Ki67+ neuroblasts was increased as the total number of neuroblasts increased (Cont 1,312.3 ± 208.1 cells/mm3, cKO 4,709.4 ± 413.1 cells/mm3, P = 0.0003, t‐test; Fig 4L). Two months after the infusion of TAM, the density of Ki67 was reduced in all three populations in cKO mice (RGL‐ANSCs, Cont 352.9 ± 48.6 cells/mm3, cKO 42.5 ± 42.5 cells/mm3; P = 0.0086; ANPCs, Cont 590.6 ± 110.1 cells/mm3, cKO 153.5 ± 51.0 cells/mm3, P = 0.023; Neuroblast, Cont 755.6 ± 110.1 cells/mm3, cKO 153.5 ± 51.0 cells/mm3, P = 0.025, t‐test; Fig 4M–O). These results support the idea that the precocious reduction in lamin B1 temporarily promoted the differentiation of ANSPCs into neuroblasts/newborn cells, which transiently increased the number of progeny. However, as a consequence, the size of the ANSPC pool shrank and the rate of adult neurogenesis started to relatively decline after this time point.
Figure 4. Lamin B1‐knockout promotes differentiation of ANPCs in the short term.
-
ASchematic of TAM treatment and collection of brain tissue.
-
B, CRepresentative images of Control and cKO with EYFP and DCX staining 3 weeks after TAM treatment. Note that the numbers of DCX‐positive cells are increased. Boxes indicate magnified regions in (C).
-
D–FQuantification 3 weeks after TAM treatment. Among EYFP‐positive cells, the density of RGL‐ANSCs is not different (P = 0.65, t‐test) (D). The density of ANPCs is significantly decreased (P = 0.0037, t‐test) (E) whereas the density of DCX‐positive cells is markedly increased (P = 0.014, t‐test) (F). (n = 4 for Control, n = 3 for cKO). Open arrowheads indicate respective cells.
-
G–IQuantification two months after the induction of KO (n = 3 for Control, n = 4 for cKO). The density of RGL‐ANSCs is not significantly different (P = 0.29, t‐test) (G). The density of ANPCs is significantly decreased. (P = 0.0092, t‐test) (H). The density of neuroblasts is not significantly different (P = 0.76, t‐test) (I).
-
J–LQuantification of proliferating cells 3 weeks after TAM treatment. The density of Ki67+ RGL‐ANSCs is significantly decreased (P = 0.027, Mann–Whitney test) (J) and that of Ki67+ ANPCs is also significantly decreased. (P = 0.034, t‐test) (K). The density of Ki67+ neuroblasts is significantly increased (P = 0.0011, t‐test) (N) (n = 4 for Control, n = 4 for cKO) (L).
-
M–OQuantification of proliferating cells two months after TAM treatment. The density of Ki67+ RGL‐ANSCs is significantly decreased (P = 0.0086, t‐test) (M), and densities of Ki67+ ANPCs and Ki67+ neuroblasts are also significantly decreased. (P = 0.023, P = 0.025, t‐test) (n = 3 for Control, n = 3 for cKO) (N, O).
-
PDeclined return to RGL‐ANSCs. Left, experimental scheme. Analysis was performed 3 weeks after BrdU injections. Middle, a representative image of BrdU+ GFAP+ RGL‐ANSCs. Right, Quantification of BrdU+ GFAP+RGL‐ANSCs (P = 0.019, n = 4 for Control, n = 4 for cKO).
Data information: Data presented as mean ± SEM. Scale bars, 100 µm in (B), 25 µm in (C, P) and 10 µm in (D, F, H). *P < 0.05, **P < 0.01, ***P < 0.001, t‐test.
Source data are available online for this figure.
Figure EV3. Effects of lamin B1 loss on adult hippocampal neurogenesis.
-
ASchematic of BrdU treatment and collection of brain tissue.
-
BRepresentative images of BrdU staining in the DG 3 weeks after TAM administration. BrdU‐positive cells were markedly increased in cKO mice.
-
CQuantification of BrdU + cells 3 weeks after TAM administration (*P = 0.021, t‐test, n = 4).
-
DQuantification of BrdU + cells 2 months after TAM administration (***P = 0.0007, t‐test, n = 3 for Control, 4 for cKO).
-
E, FOrthogonal views of confocal images to identify cell type of EFYP + cells.
-
GSchematic of EdU treatment and collection of brain tissue.
-
HRepresentative images of EdU‐click staining in the DG. EdU‐positive cells were markedly reduced in cKO mice.
-
IQuantification of EdU‐positive cells in the DG indicates that lamin B1 loss induces the prominent reduction of new cell generation in the DG similar to Cont‐15M mice. **P < 0.01, ANOVA (P = 0.0009) followed by Tukey–Kramer test (n = 4 for each genotype).
Data information: Data are presented as mean ± SD. Scale bars, 100 µm in (B), 50 µm in (E, F), and 200 µm in (H).
Since a loss of lamin B1 promotes differentiation from ANSPCs to neuroblasts, we also tested whether lamin B1 was required for proliferating ANSCs to return to the quiescent state to maintain the stem cell pool. To this end, we labeled cells exiting the cell cycle by BrdU injection after the infusion of TAM and then performed a BrdU label‐retention assay (Fig 4P). There were fewer BrdU‐retaining RGL‐ANSCs (EYFP+ BrdU+ with a GFAP‐positive radial fiber) in cKO mice than in control mice (Fig 4P; Cont 1,140.1 ± 157.9 cells/mm3, cKO 595.6 ± 69.7 cells/mm3, P = 0.019, t‐test), indicating that lamin B1 is essential for the maintenance of RGL‐ANSCs and the reduction of lamin B1 could affect ANSCs’ return to a quiescent state.
Lamin B1 knockout depletes adult hippocampal neurogenesis in the long term
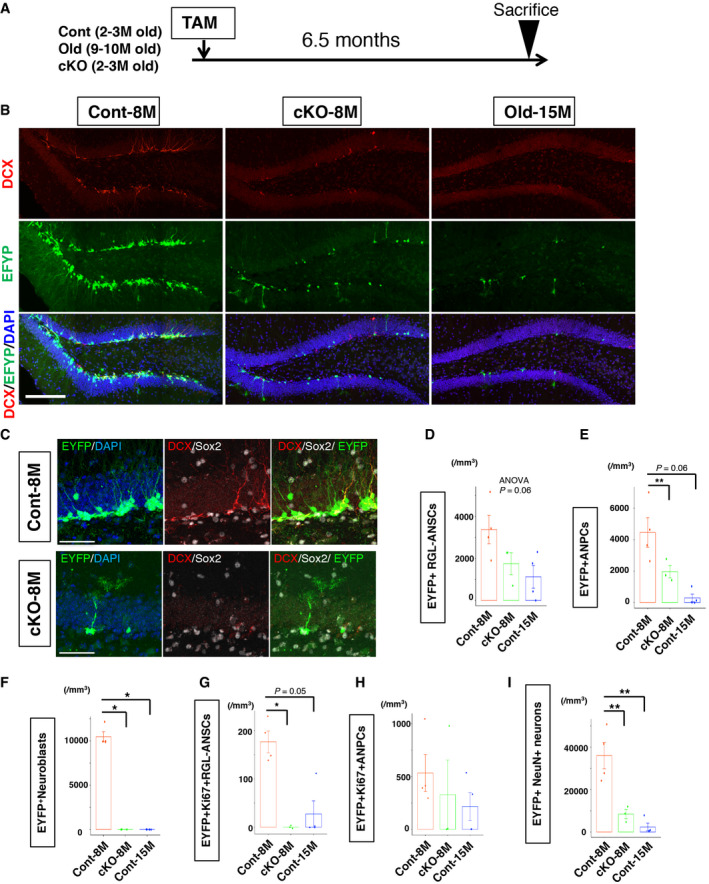
Subsequently, we investigated the long‐term consequence of precocious lamin B1 depletion in ANSPCs. At 6.5 months after the infusion of TAM (Fig 5A), control mice (Cont‐8M, 8.5‐ to 9.5‐month‐old) showed DCX‐positive cells and a large number of EYFP‐positive cells in the DG, suggesting that Cont‐8M mice still maintained neurogenic properties in their DG (Fig 5B). However, in cKO mice (cKO‐8M, 8.5‐ to 9.5‐month‐old), the number of DCX‐positive cells was substantially reduced to the same levels as old control mice (Cont‐15M, 15.5‐ to 16.5‐month‐old; Fig 5B), supporting our hypothesis that the precocious depletion of lamin B1 impaired the maintenance of adult hippocampal neurogenesis. We quantified the density of EYFP‐positive RGL‐ANSCs and found that RGL‐ANSCs tended to decrease in cKO‐8M mice to levels similar to Cont‐15M (Cont‐8M 3372.4 ± 678.3 cells/mm3, cKO‐8M 1,746.9 ± 453.1 cells/mm3, Cont‐15M 1,124.3 ± 544.1 cells/mm3, P = 0.06, ANOVA; Figs 5C and D, and EV3E and F) presumably due to the reduced return of ANSCs to a quiescent state (Fig 4P), supporting the idea that lamin B1 is essential for the long‐term maintenance of RGL‐ANSCs. The densities of EYFP‐positive ANPCs (Cont‐8M 4458.2 ± 938.3 cells/mm3, cKO‐8M 1,964.2 ± 343.1 cells/mm3, Cont‐15M 292.9 ± 241.1 cells/mm3, P = 0.0044, ANOVA) and that of EYFP+ neuroblasts (Cont‐8M 10,473.7 ± 558.4 cells/mm3, cKO‐8M, Cont‐15M no EYFP+ neuroblasts were observed, P = 0.0091, Kruskal–Wallis test) were also markedly decreased in cKO‐8M mice to levels similar to Cont‐15M mice (Fig 5E and F), indicating that ANPCs and immature neurons were depleted in cKO‐8M mice and hippocampal neurogenesis was significantly reduced. 5‐Ethynyl‐2’‐deoxyuridine (EdU)‐positive‐ cells in the DG were significantly reduced in cKO‐8M mice to levels similar to Cont‐15M mice after 9 days of consecutive administration of EdU before sacrifice, supporting the idea that cumulative generation of new cells was compromised (Cont‐8M 2,685.6 ± 474.3 cells/mm3, cKO‐8M 835.0 ± 288.8 cells/mm3, Cont‐15M 330.5 ± 162.2 cells/mm3, P = 8.9e‐6, ANOVA; Fig EV3G–I). Consistently, Ki67+ RGL‐ANSCs were also reduced (Cont‐8M 176.8 ± 22.6 cells/mm3, cKO‐8M no Ki67+ RGL‐ANSCs were observed, Cont‐15M 27.3 ± 27.3 cells/mm3, P = 0.006, Kruskal–Wallis test) (Fig 5G), but not Ki67+ ANPCs (Cont‐8M 534.0 ± 175.0 cells/mm3, cKO‐8M, 216.3 ± 131.9 cells/mm3, Cont‐15M 328.0 ± 328 cells/mm3, P = 0.43, Kruskal–Wallis test) (Fig 5H). Of note, in addition to DCX‐positive cells, the density of EYFP+ NeuN+ neurons in the DG, which reflects the accumulation of surviving neurons after the administration of TAM, was substantially reduced in cKO‐8M mice (Cont‐8M 36011.8 ± 6198.4 cells/mm3, cKO‐8M 8439.0 ± 2,146.9 cells/mm3, Cont‐15M 2,366.5 ± 1836.1 cells/mm3, P = 8.9e‐6, ANOVA; Fig 5I), despite the fact that many adult‐born neurons were generated in the earlier phases (Fig 4F). These results demonstrate that, although lamin B1 levels are downregulated during neuronal maturation (Fig 1), lamin B1 is likely essential for cellular survival after neuronal maturation. We therefore examined whether the knockout of laminB1 altered the survival or maturation of adult‐born neurons. First, we examined the density of EYFP+ NeuN+ cells 2 months after TAM infusion, which is around the time point that adult‐born neurons generated 2 months previously become fully matured. We found a significant reduction in EYFP+ NeuN+ cells (Fig EV4A, (Cont 7954.8 ± 960.4 cells/mm3, cKO‐8M 5298.3 ± 375.8 cells/mm3, P = 0.042, t‐test), indicating that the numbers of surviving adult‐born neurons were decreased 2 months after the TAM infusion even though more newborn neurons were generated (Fig 4F). To address when adult‐born cells were lost, we conducted survival assays using BrdU injections. After TAM infusion, BrdU was injected for 9 days to label newborn cells, and the surviving BrdU+ cells were quantified at different time points (Fig EV4B). Consistent with our observation which indicated increased neuroblasts (Fig 3), 10 days or 3 weeks after the TAM infusion, the densities of BrdU+ cells were significantly higher in cKO mice (10 days, Cont 17,401.5 ± 3201.6 cells/mm3, cKO 26,703.5 ± 113,51.6 cells/mm3, P = 0.049; 3 weeks, Cont 9829.4 ± 420.2 cells/mm3, cKO 20,267.3 ± 4792.8 cells/mm3 , P = 0.020, t‐test; Fig EV4C and D), suggesting an increase in newly generated cells in cKO mice right after the induction of lamin B1 knockout. In contrast, 2 months after the infusion of TAM, cKO mice showed a reduced trend in BrdU+ cells compared to control mice (Cont 6803.7 ± 1,421.1 cells/mm3, cKO 5100.9 ± 541.6 cells/mm3, P = 0.12, t‐test). To calculate the ratio of surviving cells, we divided the density of BrdU+ cells at 2 months after the TAM administration by the density at 10 days after the TAM infusion. We found a significant decrease in the survival ratio in cKO mice (Fig EV4E, Cont 39.1 ± 8.2%, cKO 19.1 ± 2.0%; P = 0.015, t‐test). Thus, although the introduction of lamin B1 knockout increased neurogenesis transiently, the neurons that were generated survived less frequently. We examined active caspase3, an apoptotic cell marker, and observed an increase in active caspase+ cells at 2 months after TAM infusion (Figs EV4F and 4G–I; 3 weeks, Cont 370.1 ± 148.2 cells/mm3, cKO 388.5 ± 63.1 cells/mm3, P = 0.86, t‐test; 2 months, Cont 804.1 ± 235.5 cells/mm3, cKO 1,218 ± 2,92.9 cells/mm3, P = 0.028, t‐test; 6.5 month, Cont‐8M 377.6 ± 70.6 cells/mm3, cKO‐8M 487.7 ± 87.2 cells/mm3, Cont‐15M, 505.9 ± 75.0 cells/mm3 P = 0.09, ANOVA). This observation indicates that lamin B1 deficiency increases apoptosis around this period.
Figure 5. Lamin B1‐knockout depletes adult neurogenesis in the long term.
-
ASchematic of TAM treatment and collection of brain tissue.
-
B, CRepresentative confocal images of the SGZ 6.5 months after the treatment with TAM.
-
D–IQuantification of cell numbers 6.5 months after the induction of KO (n = 4 for Cont‐8M, n = 3 for cKO‐8M, n = 4 for Cont‐15M,). (D) The density of RGL‐ANSCs tends to be reduced in cKO. F 2,8 = 3.98, P = 0.063, one‐way ANOVA. (E) The density of ANPCs was reduced in cKO‐8M and Cont‐15M mice. F 2,8 = 11.49, P = 0.0044, one‐way ANOVA followed by Tukey’s HSD test (**P < 0.01). (F) The density of DCX‐positive cells was reduced in WT‐old and cKO mice. P = 0.0091, Kruskal–Wallis test followed by Dunn’s test (*P < 0.05). (G) The density of Ki67+ RGL‐ANSCs was reduced in cKO‐8M mice (*P = 0.029, Kruskal‐Wallis test followed by Dunn’s test). (H) The density of Ki67+ ANPC was not significantly different among three groups (P = 0.49, Kruskal–Wallis test). (I) The density of NeuN+ EYFP+ neurons was reduced in cKO‐8M mice. F 2,8 = 34.85, P = 0.00011, one‐way ANOVA followed by Tukey’s HSD test (**P < 0.001). (n = 4 for Cont‐8M, n = 3 for cKO‐8M, n = 4 for Cont‐15M).
Data information: Data represent mean ± SEM. Scale bars, 100 µm in (B), 50 µm in (C).
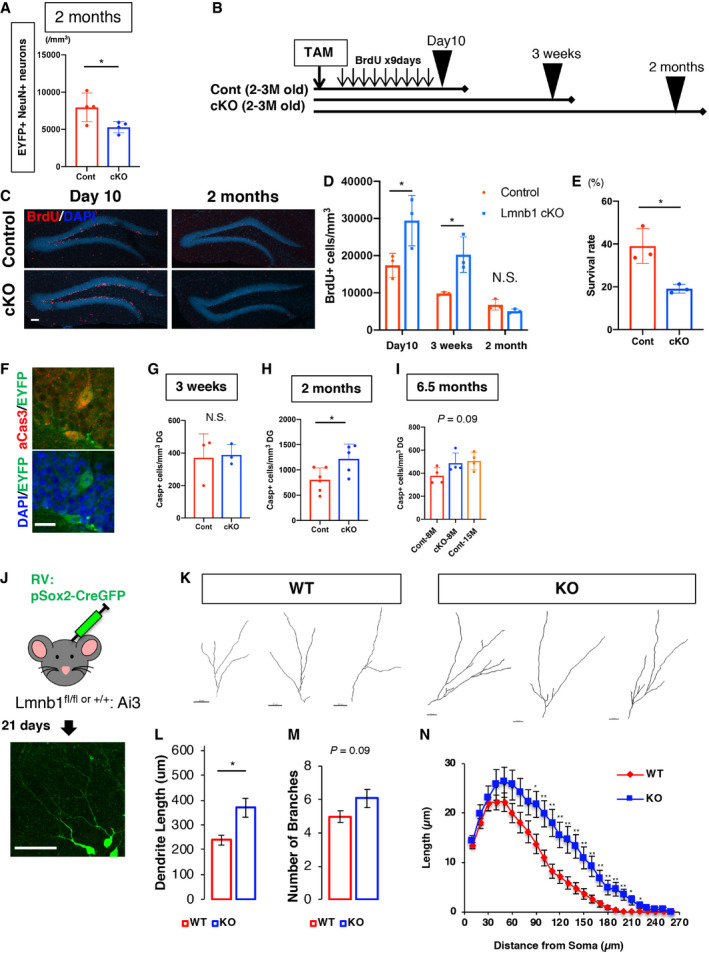
Figure EV4. Lamin B1 is essential for the survival of adult‐born cells.
-
AQuantification of EYFP+ NeuN+ neurons 2 months after TAM administration. *P = 0.042, t‐test, n = 4).
-
BSchematic of BrdU treatment and collection of brain tissue.
-
CRepresentative images of BrdU staining 10 days or 2 months after TAM treatment. Scale bar = 250 µm.
-
DQuantification of BrdU‐positive cells in each time point. Number of BrdU‐positive cells was significantly higher at day 10 (*P = 0.049, t‐test) or 3 weeks (*P = 0.019, t‐test) after TAM in cKO mice, but not at 2 months (P = 0.12, t‐test, n = 3 animals). Data represent mean ± SD.
-
EThe survival ratio of BrdU + cells from 10 days to 2 months after TAM treatment (*P = 0.015, t‐test, n = 3). Data represent mean ± SD.
-
FRepresentative images of active caspase3 2 months after TAM treatment. Scale bar = 20 µm.
-
G–ISignificant difference in the density of active caspase3 was observed 2 months after TAM treatment, but not 3 weeks or 6.5 months after TAM treatment (3 weeks, P = 0.86, n = 3, t‐test; 2 months, *P = 0.028, n = 5‐6, t‐test; 6.5 months, P = 0.09, n = 4, ANOVA). Data are presented as mean ± SD.
-
JExperimental schema. RV:pSox2‐Cre‐GFP was injected into the DG of Lmnb1fl/fl:Ai3 or Lmnb1+/+:Ai3 mice and the morphology of EYFP+ newborn neurons was assessed at 21dpi. Scale bar = 20 µm.
-
KDendritic reconstruction of RV‐labeled neurons derived from WT and cKO mice. Scale bars = 20 µm.
-
L, MTotal dendrite length (L) and total numbers of branches (M) were quantified (65 cells for control, 35 cells for cKO from 3 animals per genotype; total length, *P = 0.0147; number of branches, P = 0.099, Mann–Whitney test). Data are presented as mean ± SEM.
-
NSholl analysis of neurite length. **P < 0.01, *P < 0.05 (t‐test) (65 cells for control, 35 cells for cKO from 3 animals per genotype). Data are presented as mean ± SEM.
We next examined whether precocious reduction of lamin B1 affects the morphological development of adult‐born neurons. To measure the morphological changes, we conducted retroviral morphological tracing by injecting retrovirus harboring pSox2‐Cre into LmnB1fl/fl:Ai3 or Lamin B1+/+:Ai3 mice, and we analyzed the morphological development of adult‐born neurons 21 days post‐injection (dpi) based on the expression of EYFP (Fig EV4J) in the DG (Tashiro, Zhao et al, 2006). We observed aberrant overgrowth in dendritic maturation with genetic deletion of lamin B1 (Cont 238.9 ± 19.7 µm, cKO 369.4 ± 37.5 µm, P = 0.019, t‐test) and a trend toward increased dendritic branching (Cont 4.9 ± 0.35, cKO 6.1 ± 0.54, P = 0.09, t‐test; Fig EV4K–M). A Sholl analysis exhibited increased dendritic arborization (Fig EV4N), indicating that lamin B1 might regulate the timing of dendritic maturation. Altogether, our data suggest that the precocious reduction of lamin B1 transiently promotes neurogenesis and alters morphological development, but it depletes the progenitor pool as well as numbers of newborn neurons, which in turn may precipitate an earlier onset of anxiety‐like behavior. These findings support the hypothesis that a reduction in adult hippocampal neurogenesis may in part underlie aging‐related mood dysregulation.
Lamin B1‐regulated genetic program in ANPCs
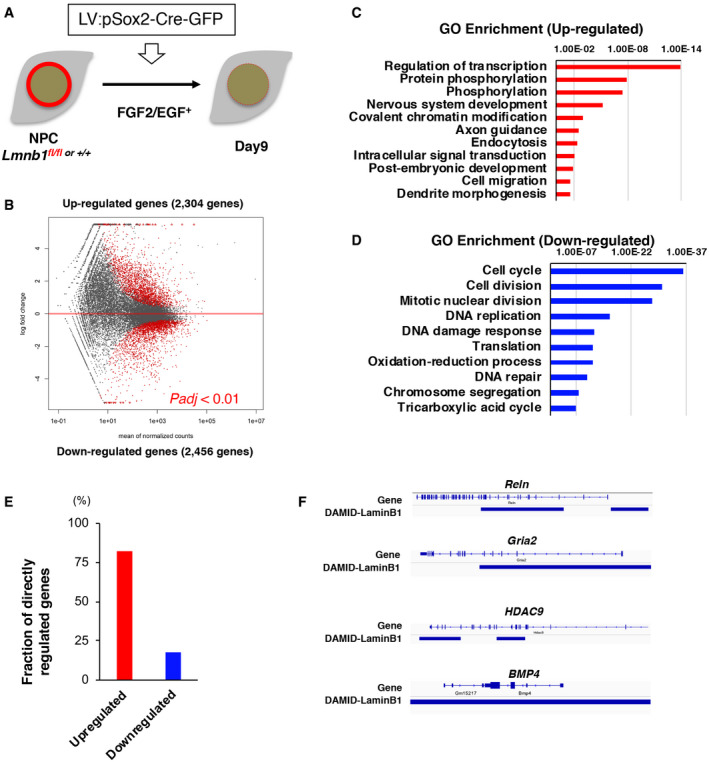
Given our results indicating that the depletion of lamin B1 primarily affects ANPCs (Figs 4 and 5), we next sought to determine the role of lamin B1 in transcriptional regulation of NPCs. To this end, we isolated NPCs from cKO and control mice and maintained the cells in proliferating condition in vitro, which allowed us to manipulate lamin B1 in a relatively homogeneous population. To induce knockout of Lmnb1 in NPCs, a lentiviral vector harboring Cre‐GFP under the Sox2 promoter (LV:pSox2‐Cre‐GFP) was introduced (Fig 6A). At 5.5 days after infection, lamin B1 protein levels were significantly reduced in the majority of infected cells (Figs 6A and EV5A). RNA sequencing (RNA‐seq) analysis at this time point revealed that Lmnb1 was the only protein‐encoding gene that was differentially expressed, indicating that the manipulation of gene expression was specific (Table EV2). To gain insights into downstream effects after Lmnb1 knockout, we performed RNA‐seq analysis 9 days after the infection of LV:pSox2‐Cre‐GFP into NPCs. Knockout of Lmnb1 upregulated 2,304 genes and downregulated 2,456 genes (referred to as LaminB1‐regulated genes; Padj < 0.01; Fig 6B and Table EV3). Among differentially expressed genes, neuronal differentiation markers such as Neurod1, Neurog2, Prox1, Tubb3, and Dcx as well as glial differential markers such as S100β, GFAP, and Plp1 were upregulated whereas NPC markers such as Nes, Fabp7, and Hes1 were downregulated. Gene ontology (GO) analysis and KEGG pathway analysis revealed that upregulated genes were significantly enriched in “nervous system development” and “axonal/dendritic morphogenesis” (Figs 6C and EV5B), suggesting that neural differentiation and maturation were promoted by lamin B1 reduction. Importantly, “transcriptional regulation” and “chromatin modifications” were also enriched, suggesting that reduction of lamin B1 would drastically reorganize gene regulation in NPCs. GO analysis further revealed that downregulated genes were enriched in cell cycle, cell division, and DNA replication. These findings correlated well with our observations in vivo, which indicated facilitated differentiation from NPCs to neuroblast/immature neurons (Figs 4 and EV4). Among the downregulated genes, in addition to cell cycle‐related genes, oxidative phosphorylation (OXPHOS)‐related genes were significantly enriched (Figs 6D and EV5C). A metabolic switch from glycolysis to oxidative phosphorylation is a critical step for the differentiation from NPCs to neurons both in mice and humans, and the reduction of OXPHOS function has been observed in aged ANSPCs as well as induced neurons from aged human donors (Zheng, Boyer et al, 2016; Beckervordersandforth, Ebert et al, 2017; Kim, Zheng et al, 2018). Our observation suggests that a reduction of lamin B1 may impair a metabolic switch during neural differentiation.
Figure 6. Lamin B1‐dependent gene regulation in NPCs.
-
ASchematic of Lmnb1‐KO in NPCs. After the introduction of LV, NPCs were kept in proliferative conditions with FGF2 and EGF.
-
BMA plot of differentially expressed genes between control and Lmnb1‐KO NPCs.
-
C, DGene ontology analyses in LaminB1‐regulated genes.
-
EFraction of direction of gene regulation by LaminB1. Genes were allocated dependent on where LaminB1 interacts with genes. Red bars indicated upregulated genes, and blue bars indicate downregulated genes after lamin B1 knockout.
-
FExamples of lamin B1‐directed genes in NPCs. Blue bars indicate laminB1‐LAD.
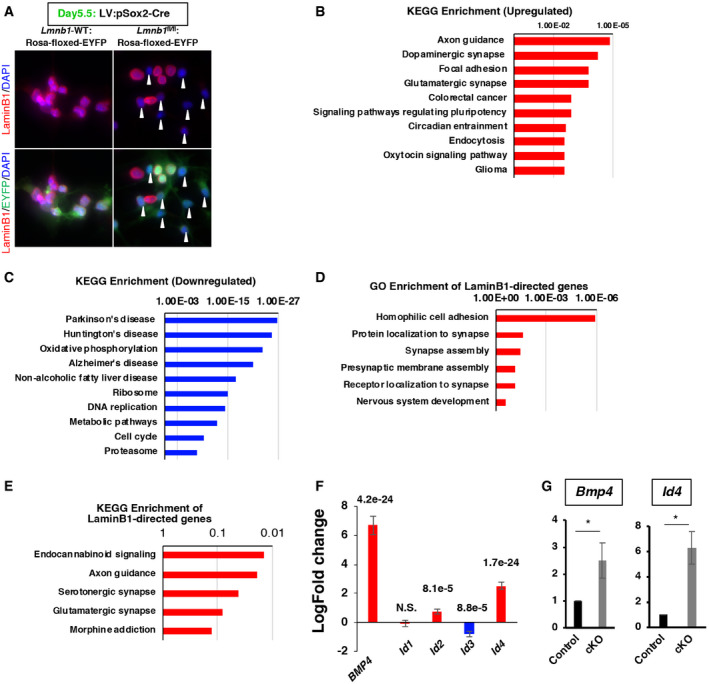
Figure EV5. Gene pathways regulated by lamin B1 in NPCs.
-
AConfirmation of lamin B1 depletion after the delivery of LV; pSox2‐Cre. Closed white arrowheads indicate the depletion of lamin B1 immunoreactivity in right panels. Scale bar = 25 µm.
-
B, CGO and KEGG pathway enrichment analyses of differentially expressed genes.
-
D, EGO and KEGG enrichment analyses for lamin B1‐directed upregulated genes.
-
FFold change expression of Bmp4 and Id1‐4 from the transcriptomic analysis in cKO‐NPCs, n = 3, DEseq2 for statistical test. Data are presented as mean ± SEM.
-
GqRT–PCR validation of Bmp4 and Id4 upregulation in cKO‐NPCs (Bmp4, *P = 0.022; Id4, *P = 0.015, one‐sample t‐test, n = 3). Data are presented as mean ± SD.
Direct gene regulation in NPCs by lamin B1
Accumulating evidence indicates that the nuclear lamins anchor chromatin and are mainly involved in direct gene repression in a cell‐type‐specific manner (Peric‐Hupkes, Meuleman et al, 2010; Gomez‐Cavazos & Hetzer, 2012). To investigate plausible direct gene regulation by lamin B1 in NPCs, we combined our transcriptomic data with a published lamin B1‐chromatin interaction genome‐wide map constructed using DNA adenine methyltransferase (Dam)‐lamin B1 from mouse NPCs (Peric‐Hupkes et al, 2010). We analyzed the spatial correlation between lamin‐associated domains (LADs) in NPCs and lamin B1‐regulated genes. Of the lamin B1‐regulated genes (4,760 genes), we identified 451 genes directly overlapping with LADs, suggesting that those genes are possibly regulated by lamin B1 through direct interaction (those genes are defined as lamin directly regulated genes, LDR genes). Of the 451 LDR genes, 82.2% were enriched in upregulated genes (371 genes; Fig 6E), indicating that the interaction of lamin B1 with chromatin likely repressed LAD‐associated genes. Among LDR genes, many were related to neural development and cell adhesion (Fig EV5D and E). For instance, Reln, Robo1, and HDAC9, which are essential factors for neural development and cell adhesion molecules, were bound by lamin B1 (Fig 6F). In addition, several components related to synaptic functions, such as Gria2, Nlgn1, and Nrxn1, were bound by lamin B1 (Fig 6F). Our data support the idea that those genes might be directly repressed by lamin B1 and, upon the reduction in lamin B1, the levels of their expression were dysregulated. The levels of Bmp4 were upregulated in Lmnb1 KO NPCs in our RNA‐seq data (Bmp4, 6.68 log2‐fold increase, P = 4.21e‐24; Fig EV5F), suggesting that Bmp4 was also interacted and repressed by lamin B1 (Fig 6F). In addition, a recently identified downstream mediator of BMP signaling in NSCs, Id4, was also significantly upregulated (Id4, 2.52 log2‐fold increase, P = 1.7e‐23) (Blomfield, Rocamonde et al, 2019). We validated this observation using quantitative RT–PCR and found that the levels of Bmp4 and Id4 were upregulated in lamin B1‐cKO‐NPCs (Bmp4, P = 0.022; Id4, P = 0.014; one‐sample t‐test; Fig EV5G). Expression levels of bone morphogenetic protein 4 (BMP4) are markedly increased with age in the mouse and human DG and exogenous BMP4 represses adult neurogenesis (Meyers, Gobeske et al, 2016). Taken together with our in vivo observation of reduced proliferation of ANSPCs, this correlation implies that the age‐dependent reduction of lamin B1 in ANSPCs may mediate the age‐dependent reduction of adult hippocampal neurogenesis through the dysregulation of genetic programs.
Functional assessment of lamin B1 in NPCs
Using transcriptome analyses, we observed that the depletion of lamin B1 promotes neural differentiation and cell cycle exit. To confirm this observation, we tested whether high levels of lamin B1 in NPCs are essential for the maintenance of NPCs in vitro. To acutely knockdown lamin B1, we performed short hairpin RNA (shRNA)‐mediated knockdown of lamin B1 in NPCs in proliferative culture conditions (Appendix Fig S1). A shRNA vector against Lmnb1 was expressed using retrovirus (RV), and efficient knockdown of lamin B1 was confirmed by Western blotting and qRT–PCR 3 days after infection (Appendix Fig S1A and B). qRT–PCR analyses showed marked increases in Tuj1, Prox1, and GFAP after knocking down lamin B1 (Appendix Fig S1B), suggesting that the downregulation of lamin B1 increased the expression of both neuronal and glial genes in vitro. Immunocytochemical analyses revealed that downregulation of lamin B1 significantly increased the proportion of Tuj1+, DCX+ cells, and S100β+ cells even in the proliferative condition (Tuj1+ shCont 3.4 ± 1.1%, shLmnb1 14.5 ± 4.5%, P = 0.028; DCX+ shCont 3.5 ± 2.4%, shLmnb1 19.1 ± 8.8%, P = 0.021; S100β+ shCont 3.7 ± 2.6%, shLmnb1 14.3 ± 4.3%, P = 0.04; *P < 0.05, t‐test; Appendix Fig S1C–G), whereas the proportion of Ki67+ cells, a proliferation marker, was decreased (Appendix Fig S1H; Ki67+ shCont 94.5 ± 1.2%, shLmnb1 82.9 ± 4.2%, P = 0.01; *P < 0.05, t‐test), suggesting that the reduction in lamin B1 inhibits the maintenance of NPCs.
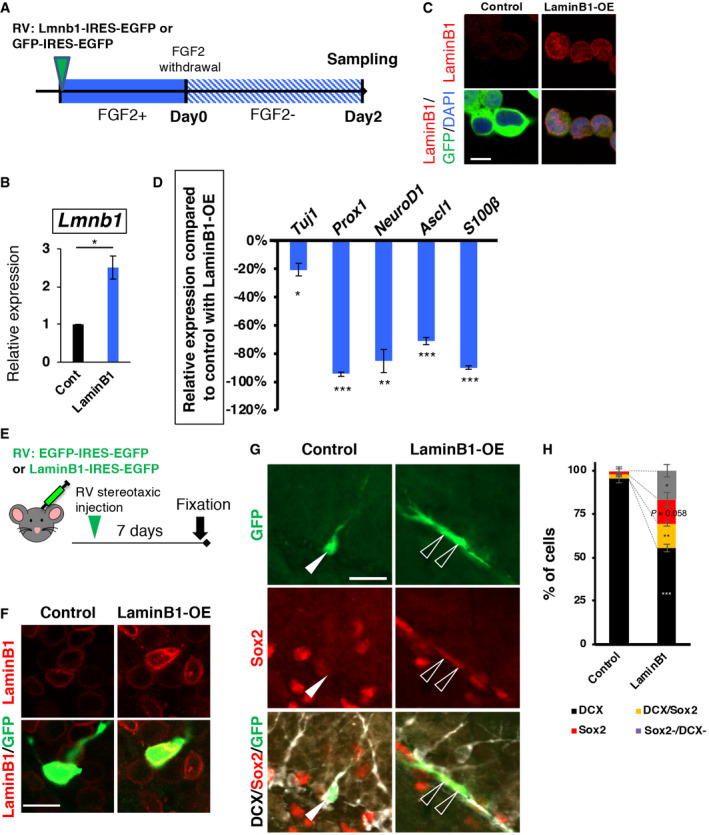
Subsequently, we tested whether an exogenous expression of lamin B1 prevents NPC differentiation. LaminB1‐IRES‐GFP‐expressing RV was applied to NPCs in vitro and the expression of differentiation markers was examined after the withdrawal of growth factors (Fig 7A). Exogenous expression of lamin B1 repressed the induction of differentiation marker genes upregulated in lamin B1 cKO‐NPCs (Table EV3; Tubb3, Prox1, NeuroD1, and S100β Fig 7B–D), indicating that higher levels of lamin B1 inhibit differentiation. To test whether an exogenous expression of lamin B1 also inhibits differentiation of ANPCs in vivo, we injected these RVs into the SGZ (Fig 7E and F). Seven days post‐injection, most of the GFP+ cells in controls became DCX+ cells, whereas lamin B1 overexpression significantly reduced the fraction of DCX+ cells (Control, GFP+ DCX+, 95.7 ± 2.2%, LaminB1‐OE GFP+ DCX+, 54.2 ± 2.2%, P = 0.0002 t‐test). In contrast, the fraction of GFP+ DCX+ Sox2+ cells was significantly increased (Control, GFP+ DCX+ Sox2+, 2.2 ± 1.1%, LaminB1‐OE, GFP+ DCX+ Sox2+, 13.6 ± 1.3%, P = 0.0024, t‐test) and the fraction of GFP+ Sox2+ cells showed a tendency to increase (Control, GFP+ DCX+ Sox2+, 2.2 ± 2.2%, LaminB1‐OE, GFP+ Sox2+, 14.7 ± 4.2%, P = 0.058, t‐test; Fig 7G and H). These data are consistent with observations in vitro and support the idea that the higher levels of lamin B1 in ANPCs inhibit differentiation and that a reduction in lamin B1 induces neural differentiation.
Figure 7. Exogenous expression of laminB1 represses neural differentiation.
-
AExperimental schema. After the introduction of RV into NPCs in a proliferative condition, FGF2 was withdrawn for 2 days, and samples were collected.
-
B, CConfirmation of Lamin B1 overexpression by qRT–PCR (*P = 0.020, n = 3, one‐sample t‐test), and immunocytochemistry in NPCs. Scale bar = 10 µm.
-
DRelative induced expression of differentiation markers upon the withdrawal of FGF2. 0 % indicates the same expression levels with control. Exogenous expression of lamin B1 inhibits the induction of genes related to neural differentiation (Tuj1, *P = 0.023; Prox1, ***P = 0.00012; NeuroD1, **P = 0.0046; Ascl1, ***P = 0.00064; S100β, ***P = 0.000097; n = 3, one‐sample t‐test).
-
EExperimental schema. RV:EGFP‐IRES‐EGFP or LaminB1‐IRES‐EGFP was injected into the DG of wild‐type mice, and the brains were collected 7 days later.
-
FConfocal images after exogenous expression of lamin B1 in EGFP+ cells with RV; LaminB1‐IRES‐GFP (laminB1‐OE.) Scale bar = 20 µm.
-
G, HExogenous expression of laminB1 repressed neuronal differentiation in vivo. An arrowhead indicate DCX+ GFP+ cell in control (G, left) and open arrowheads indicate Sox2+ GFP+ cells in lamin B1‐OE cells. The fraction of EGFP+ DCX+ cells was significantly reduced by lamin B1 overexpression (***P < 0.0002, n = 3), whereas the fractions of EGFP+ DCX+ Sox2+ cells and the EGFP+ Sox2+ were increased (EGFP + DCX+ Sox2+, **P = 0.0024; EGFP+ Sox2+, P = 0.058; others, *P = 0.02). Scale bar = 20 µm.
Data information: Data represent mean ± SD.
Discussion
Here we provide in vivo evidence, supported by histological and behavioral profiling, that lamin B1 plays critical roles in the maintenance of adult hippocampal neurogenesis and in age‐related anxiety‐like behavior. Our correlative genomic data analyses also support the emerging notion that cell type‐specific nuclear architecture directed by nuclear structural proteins (e.g., nucleoporins or lamins) controls cell type‐specific gene regulation and long‐term maintenance of cell type‐specific functions (Peric‐Hupkes & van Steensel, 2010; Jacinto, Benner et al, 2015; Ibarra, Benner et al, 2016; Toda et al, 2017), such as continuous generation of new neurons from ANSPCs.
Previous reports indicated that changes in factors extrinsic to ANSPCs, such as the systemic milieu or secreted factors (hormone, inflammatory factors) in the neurogenic niche, drive age‐dependent reductions in neurogenesis (Cameron & McKay, 1999; Villeda et al, 2011; Meyers et al, 2016). Recent studies indicated that inhibition of activation of ANSCs could be key for the reduction of adult neurogenesis in aged brains and, further, that infiltration of T cells into neurogenic niches or proteostasis dysregulation might be underlying mechanisms (Leeman, Hebestreit et al, 2018; Dulken, Buckley et al, 2019; Kalamakis, Brune et al, 2019). However, most of these studies have focused on changes after the reduction of adult neurogenesis, leaving unresolved the question of what drives the onset of reduced adult neurogenesis and stem cell aging under normal physiological conditions. Our data indicate that changes intrinsic to ANSPCs occur as early as 5.5 months of age, and losing lamin B1 around that time could be one of the drivers of stem cell aging, which is temporally well correlated with the reduction of neurogenesis as shown previously (Ben Abdallah et al, 2010; Encinas et al, 2011). It has been proposed that RGL‐ANSCs undergo a division‐coupled conversion into astrocytes, leading to an age‐related exhaustion of the NSC pool (Encinas et al, 2011), while other evidence supports the hypothesis that activated RGL‐NSCs can go back to being quiescent RGL‐NSCs (Bonaguidi, Wheeler et al, 2011; Urban, van den Berg et al, 2016). Our results show that the reduction in lamin B1 promotes the differentiation of ANPCs, reduces the return of ANSCs into a quiescent state, and eventually depletes adult neurogenesis; therefore, levels of lamin B1 in ANSPCs influence these transitions. Gontier and colleagues reported that Tet2, a catalytic enzyme of 5‐hydroxymethylcytosine, is also reduced around 6 months of age and the reduction of Tet2 impairs adult neurogenesis (Gontier, Iyer et al, 2018). Thus, epigenetic dysregulation through lamin‐mediated nuclear architecture or DNA methylation may start in middle age. Further investigation of epigenetic mechanisms at this stage may uncover the origin of cell‐intrinsic stem cell aging. Since lamin B1 levels decrease in both RGL‐ANSCs and ANPCs with age, it would be interesting to test whether lamin B1 deletion has a more pronounced effect in young mice versus aged mice that already have some natural degree of lamin B1 loss. Altogether, our data identify a novel cell‐intrinsic mechanism underlying stem cell aging. It would also be intriguing to investigate what triggers lamin B1 levels in ANSPCs to become downregulated during physiological aging.
Previous studies found that adult hippocampal neurogenesis regulates anxiety‐related behaviors and stress responses (David et al, 2009; Revest, Dupret et al, 2009; Surget, Tanti et al, 2011). However, it was not clear how age‐related anxiety was regulated by adult neurogenesis. The present data show that the reduction in lamin B1 in ANSPCs induces anxiety‐like behavior. The enhanced anxiety was not due to decreased activity or decreased curiosity, as lamin B1 depletion did not modify total distance of exploration or novelty exploration in the novel object recognition test. Intriguingly, a PCA analysis of behavioral data indicated that behavioral traits of lamin B1 cKO mice overlap better with old control mice than with young control mice. Thus, our data suggest lamin B1 is a possible link between brain aging and mood regulation, and lamin B1 cKO mice could be used as a model of cell‐intrinsic neural stem cell aging and age‐related mood dysregulation. One question that arises is how does lamin B1 depletion induce age‐related anxiety‐like behavior? One possibility is the lower survival of adult‐born neurons. Our data indicated lamin B1 deficiency leads to lower survival rate, which is consistent with the survival rate of adult‐born neurons in old mice (Kuipers et al, 2015). However, the number of surviving neurons was only slightly lower 2 months after the induction of knockout (Fig EV4A). These observations raise several other possibilities to explain how lamin B1 deficiency contributes to age‐related behavior. First, in addition to total numbers of adult‐born neurons, the balance between immature adult‐born neurons and mature adult‐born neurons may be key. Lamin B1 cKO transiently increased neurogenesis but relatively reduced it from 3 weeks to 2 months after the induction of knockout. Therefore, the reduction of the rate of neurogenesis may underlie behavioral changes. The other possibility is change in functionality of adult‐born neurons in laminB1 cKO neurons. In fact, we observed aberrant dendritic development in laminB1 cKO adult‐born neurons. Mis‐integration of adult‐born neurons has been shown to cause anxiety‐like behavior (Bergami, Rimondini et al, 2008). While a depletion in adult hippocampal neurogenesis could impair memory (Saxe et al, 2006; Deng et al, 2009; Nakashiba et al, 2012), lamin B1 cKO mice did not have deficits in short‐term memory. Therefore, the effects of lamin B1 depletion may not be simply due to the depletion of adult‐born neurons. Future investigation in this area is warranted.
Knockout of lamin B1 in ANPCs drastically alters the transcriptome, which explains why ANPCs start to differentiate upon loss of lamin B1. Transcription factors directing neuronal differentiation such as Neurog2 and NeuroD1 were upregulated whereas cell cycle regulators such as Ccna1 and Ccna2 were downregulated. These findings are in contrast to findings in embryonic stem cells and keratinocytes, in which type‐B lamins are dispensable for their maintenance and proliferation (Kim et al, 2011; Yang et al, 2011). Our data support the idea that lamin B1 has cell type‐specific roles in gene regulation and controls the balance between the maintenance and differentiation of ANPCs. It is still unclear why the roles of lamin B1 are dependent on cell type. One possibility could be their expression levels. Even though lamin B1 is broadly expressed across tissues, its expression level varies depending on cell type, as shown in Fig 1, which might contribute to the degree of dependency on lamin B1. Furthermore, the levels of other lamins are also dependent on cell type. Importantly, lamin A is not expressed in neural cells due to the expression of mir‐9 (Coffinier et al, 2011). Therefore, the dependency on lamin B1 may be higher in neural cells. In contrast to the transiently enhanced adult hippocampal neurogenesis observed in lamin B1 cKO, lamin B1 knockdown promotes astrogenesis in the developing cortex (Mahajani et al, 2017). This inconsistency suggests that lamin B1 may play distinct roles in a context‐dependent manner. During corticogenesis, neurogenesis precedes astrogenesis and lamin B1 may regulate this transition from neurogenesis to astrogenesis (Namihira & Nakashima, 2013). Another factor that could contribute to this inconsistency is environmental cues. The niche environment in the SZG provides strong neurogenic cues such as Wnt signaling (Goncalves et al, 2016). Therefore, even though knockdown of lamin B1 in proliferating ANPCs in vitro induced the increased expression of both neuronal and glial markers, neurogenic cues in the SGZ may preferentially promote neurogenesis in vivo. Our analysis, in combination with the genome‐wide interaction map between lamin B1 and chromatin, also revealed that lamin B1 could directly regulate the expression of a key factor related to neural differentiation in adult neurogenesis. Further investigation in vivo will be required to understand how age‐related signaling could be dysregulated by lamin B1 decline.
Genetic ablation of lamin B1 in ANSPCs resulted in a transient increase in neurogenesis and a profound loss of ANPCs in the early phase and of mature neurons in the later phase. The survival rate of newborn cells was significantly lower in cKO mice, and increased number of active caspase3‐positive cells was observed, suggesting that the cells presumably died after their maturation. The levels of lamin B1 are markedly downregulated upon neural maturation, so depletion of adult‐born mature neurons was unexpected, as the contribution of lamin B1 in mature neurons was predicted to be low. However, this observation is consistent with a report showing that the survival rate of newborn neurons is lower in aged brains compared to young brains (Kuipers et al, 2015). Thus, adult‐born neurons generated from aged ANPCs showed a lower probability of survival. One possible reason could be DNA damage because a deficiency of lamin B1 in migrating embryonic cortical neurons causes DNA damage and cell death (Chen, Yang et al, 2019). Although adult‐born hippocampal adult neurons do not migrate far away from the SGZ compared to newborn neurons in the embryonic cortex, and knockout of Lmnb1 from ANPCs appears to enhance neurogenesis in the earlier phase, a deficiency in lamin B1 in adult‐born DGCs may increase the vulnerability of their nuclei after their maturation.
In conclusion, we identified lamin B1 as a potential cell‐intrinsic regulator of ANSPC aging. Nuclear structural proteins such as nuclear lamins are long‐lived proteins (Toyama, Savas et al, 2013); therefore, it has been postulated that they could be a primary target of aging due to their low turnover rate, but this notion has not been directly tested in mammalian brains. Our data support the original idea that nuclear lamins represent a robust structural substrate for cell type‐specific gene regulation, and deterioration of lamin‐directed nuclear architecture could be one source of brain aging. Interestingly, a recent study showed that an increase of only 100 newborn neurons could rejuvenate some hippocampus‐dependent function in old mice (Berdugo‐Vega, Arias‐Gil et al, 2020). Since lamin B1 overexpression represses differentiation of ANPCs, it would be intriguing to test whether an exogenous expression of lamin B1 could retain more ANSPCs until older ages or even rejuvenate ANSPCs and hippocampal function by generating new neurons at older ages. A more detailed understanding of lamin‐directed nuclear architecture in adult neurogenesis and the impact of aging on cell type‐specific gene regulation in neurogenic pools could support the development of novel means to ameliorate age‐related mental health deficits in aging.
Materials and Methods
Cell culture
The hippocampal NPC line from adult rat hippocampus was cultured as described previously (Palmer, Takahashi et al, 1997; Schafer, Han et al, 2015). Proliferating NPCs were cultured in serum‐free medium DMEM‐F12 (glutamine) containing N2 supplement and 20 ng/ml FGF2 (PeproTech). For neuronal differentiation, NPCs were transferred into medium containing 1 µM retinoic acid (Sigma‐Aldrich) and 5 µM forskolin (Sigma‐Aldrich) for the indicated number of days. The mouse NPC line from adult mouse hippocampus or embryonic cortex was cultured as described previously, with brief modifications (Ray & Gage, 2006). NPCs were cultured in DMEM/F‐12 supplemented with N2 and B27 (Invitrogen) in the presence of FGF2 (20 ng/ml), EGF (20 ng/ml), and heparin (5 µg/ml).
Experimental model
All procedures relating to mouse care and treatment were approved by the Institutional Animal Care and Use Committees of the Salk Institute for Biological Studies or the Government of Saxony and performed in accordance with their guidelines.
For all experiments, mice were group housed in standard cages under a 12 hr light/dark cycle with ad libitum access to water and food. Both males and females were used in the experiments. Lmnb1‐floxed mice containing Lmnb1 exon 2 flanked by lox sites were backcrossed to C57BL/6 for at least five generations and then crossed to pNes‐ERT2‐Cre:R26Ai3 (Jax #016261 and #007903, respectively) maintained on the C57BL/6 background (Madisen et al, 2010; Yang et al, 2011). For behavioral and histological experiments, LaminB1 WT mice carrying pNes‐ERT2‐Cre:R26Ai were used as control mice. To induce Cre‐dependent recombination, TAM was dissolved in corn oil with 10% EtOH, and then, EtOH was evaporated. TAM was administered orally (360 mg/kg/day) for 5 consecutive days.
Behavioral testing
Each test was performed on a separate day, and all mice were acclimated to the testing room for at least 30 min before beginning each behavioral assay. All testing was performed between 0800 and 1400 h 2.5 months after treatment with TAM. For the OF test, each mouse was placed individually into a chamber (43.38 × 43.38 × 30.28 cm) and behavior was recorded by photobeam breaks for 10 min (Med Associates). The novel object recognition test was done in the same arena used for the OF test. On the first training day, two identical objects were placed in the arena and mice were allowed to explore for 10 min. Mice spent approximately equal time exploring each object. On the following day, one object was replaced with a novel object and the total exploratory time around the two objects was measured. The ratio of exploratory time around the novel object versus the familiar object was calculated as the novel object preference index. Mice typically show a preference to investigate novel objects in this test, which can be attenuated by lack of recognition memory. If the mouse does not remember its previous exposure to the objects, then it will not show a preference for the novel object. For the Y‐maze test, each mouse was tested individually and activity was tracked with video‐tracking software for 5 min (BehaviorCloud) and analyzed for distance travelled and spontaneous alternation. The OF and Y‐maze tests were conducted in the same week. For novelty‐suppressed feeding, mice were food restricted for a period of 24 h. Before and after food restriction, their body weights were measured. On the day of testing, each mouse was placed into an OF chamber containing a food pellet with modified landscape (with plastic inserts) and activity was tracked by video for 10 min.
Immunohistochemistry
Animals were either deeply anesthetized with a ketamine/xylazine/acepromazine cocktail or euthanized by lethal dose of pentobarbital and then transcardially perfused with phosphate‐buffered saline (PBS) followed by 4% paraformaldehyde (PFA) in PBS, pH 7.4. Brains were removed, postfixed overnight at 4°C, and then transferred into 30% sucrose solution for cryoprotection. Forty‐µm thick coronal sections were obtained using a sliding microtome (Leica) and subjected to immunohistochemistry and analyses as previously described (Suh, Consiglio et al, 2007; Ehm, Goritz et al, 2010). Primary antibodies used were chicken α‐GFP (1:2,000; Aves), goat α‐DCX (1:500; Santa Cruz Biotechnology), goat α‐Sox2 (1:500; Santa Cruz Biotechnology), rabbit α‐S100β (1:2,500; Swant), chicken α‐GFAP (1:1,000; EMD‐Millipore), Goat α‐LaminB1 (1:500; Santa Cruz Biotechnology), rabbit α‐LaminB1 (1:1,000; Abcam), mouse α‐PSA‐NCAM (1:500; EMD‐Millipore), and rabbit α‐Sox2 (1:250; Cell Signaling Technology), mouse α‐NeuN (1:1,000, EMD‐Millipore), mouse α‐Ki67 (1:500; BD), rat α‐BrdU (1:5,000, BU1/75, Abcam), goat α‐GFAP antibody (1:1,000, Abcam), rabbit α‐active caspase3 (1:300, Cell Signaling), and Rabbit α‐S100β antibody (1:5,000, DAKO). Secondary antibodies were all obtained from Jackson ImmunoResearch. Cell counting was performed on every 12th (for BrdU/EdU+ cells and BrdU+ GFP+ GFAP+ cells) or 24th (for active caspase3+) coronal sections containing DG at the same anatomical levels. DAPI staining was used to measure the area of DG by ImageJ. The number of Sox2+, DCX+, and other double/triple‐positive cells in EYFP‐positive cells was determined in every twelve section of the dorsal hippocampus. For normalization, cell numbers were related to the analyzed granule cell layer volume. Fluorescence was detected using a Zeiss LSM 780 or Zeiss LSM980. Images were acquired with 20× objectives, and colocalization was confirmed by 3‐D reconstructions of z‐series.
To analyze the fluorescence intensity of lamin B1 immunostaining from each nucleus in vitro cultured cells and in vivo brain sections, images were taken using three‐dimensional confocal microscopy and signal intensities were measured using ImageJ. Since lamin B1 proteins locate at the nuclear periphery, the fluorescence signal from the center of each nucleus was used to normalize the background signals. For in vitro cultured cells, cell types were identified by the expression of cell type markers: Sox2 for NPCs, Tuj1 for differentiation neurons, S100β for astrocytes, and myelin basic protein (MBP) for oligodendrocytes. For in vivo brain sections, ANSPCs were chosen as Sox2‐positive and PSA‐NCAM‐negative cells in the SGZ, immature neurons as Sox2‐negative and PSA‐NCAM‐positive cells in the SGZ, and DGCs in the outer dentate granule layer.
BrdU or EdU administration
BrdU (5‐bromo‐2′‐deoxyuridine) or EdU (5‐ethynyl‐2′‐deoxyuridine) was dissolved in 0.9% NaCl and sterile filtered. Animals were intraperitoneally injected with a single dose of BrdU/EdU (BrdU 50 mg/kg, Sigma‐Aldrich; EdU, 50 mg/kg, Thermo Fisher) once per day for 9 consecutive days. One (BrdU) or 2 days (EdU) after the last injection, animals were sacrificed and the numbers of BrdU‐ or EdU‐positive cells in the DG were counted.
Plasmids
For the retroviral experiments, shRNA targeting mouse and rat Lmnb1 (TRCN0000091906) was cloned into a retroviral construct containing a chicken β‐actin (CAG)‐driven green fluorescent protein (GFP) and a hU6 promoter driving expression of shRNAs, as described previously (Schafer et al, 2015; Han, Kim et al, 2016). As a control, we used a target sequence not matching to any rodent mRNA sequence. Knockdown efficiencies were confirmed by transfection into mouse NPCs and rat hippocampal NPCs using qRT–PCR and Western blot. Lmnb1 was subcloned into pCAG‐GFP‐IRES‐GFP retroviral vector and resulted in pCAG‐Lmnb1‐IRES‐GFP. Retroviruses and lentivirus were produced as previously described (Zhao, Teng et al, 2006; Mertens, Paquola et al, 2015).
qRT–PCR
Total RNA was extracted using RNABee (Tel‐Test) or TRIzol (Invitrogen) reagent and reverse transcribed into cDNA using the Superscript III Kit (Invitrogen). Quantitative RT–PCR was performed using the C1000 Touch cycler (Bio‐Rad). See Table EV1 for primer information. Gene expression was normalized to β‐actin, and the relative gene expression was calculated using the ∆∆Ct method.
Immunocytochemistry
Immunocytochemistry was performed as described previously (Toda et al, 2017). Briefly, cultured cells were fixed with 4% PFA for 10 min at room temperature followed by 3 washes by PBS, then permeabilized with 0.1% Triton X‐100 in TBS, blocked with 3% horse serum, and incubated with primary antibody overnight.
Stereotactic injections and 3D morphological analysis
For retroviral injections, 8‐ to 10‐week‐old Lmnb1+/+:Ai3 or Lmnb1fl/fl:Ai3 mice were used for RV:pSox2‐Cre injection. 6‐ to 8‐week‐old female C57BL/6 mice were used for lamin B1 overexpression. Stereotactic injections of 1 µl of retroviral suspension were placed into the DG (coordinates from bregma: −2 anteroposterior, ±1.5 mediolateral, −2.3 dorsoventral). Group sizes for all experimental groups were n = 3. EYFP+ cells were 3D reconstructed using the Imaris software (Bitlane) at 3 weeks post‐injection. For analyzing length, branches, and Sholl intersections, the Filament function in Imaris was used.
Western blotting
Total protein was extracted and separated by 3–8% PAGE, transferred to a PVDF membrane, blocked and incubated with primary antibodies overnight at 4°C. The following antibodies were used: goat α‐Lmnb1 (1:500; Santa Cruz) and mouse α‐GAPDH (1:10,000; Fitzgerald).
Statistics
Statistical analyses were performed using R software, Statcel2 software (OMS Publishing), GraphPad Prism 8, and Excel (Microsoft). Normality was tested by Shapiro–Wilk test, and variance was tested by F‐test or Bartlett’s test. P‐values were determined by an unpaired Student’s t‐test, Welch’s t‐test, a one‐sample t‐test, a Mann–Whitney U‐test, Kruskal–Wallis test, or one‐way ANOVA as indicated.
RNA‐seq
Five and 9 days after the infection of LV:pSox2‐Cre‐GFP into NPCs isolated from Lmnb1fl/fl:Ai3 or WT:Ai3 mice (3 animals for each genotype), cells were detached using accutase and GFP‐positive cells were sorted directly into TRIzol‐LS (Invitrogen). RNA was isolated according to the manufacturer’s instructions and digested with TURBO DNase (Life Technologies). RNA integrity numbers (RIN) were assessed using the Agilent Tape Station before library preparation. Poly(A)+ RNA was selected and fragmented to prepare sequencing libraries using the Illumina TruSeq Stranded RNA sample preparation kit. Libraries were sequenced as single‐end 50 bp (SE50) using an Illumina HiSeq 2500 sequencer at the Next Generation Sequencing (NGS) core at the Salk Institute according to manufacturer’s instructions (Illumina).
RNA‐seq differential expression analyses and association with LAD
Expression estimates for Lmnb1 knockout experiments were derived from RNA‐seq data. Both common and tagwise dispersion estimates were calculated, and differential expression tests were run using DEseq2. P‐values for both differential expression analyses were corrected for multiple testing with the R base package, Padjust. DAVID was used for GO and KEGG enrichment analyses. GenomicRanges function (R) was used to identify genes bound by LaminB1 and regulated by LaminB1. To identify genes directly bound and regulated by LaminB1, LaminB1‐LAD in NPCs were used from a previous publication (Peric‐Hupkes et al, 2010). Among differentially expressed genes after Lmnb1 knockout, LAD overlapping with the genomic sequences of differentially expressed genes, their corresponding promoters (1kb upstream from transcription start sites), and 3’UTR (1kb downstream from the end of gene) were identified as LDR genes.
Author contributions
TT conceived the projects and designed experiments. TAB, JH, SLP, and TT wrote the manuscript. TT supervised the project and FHG supported it. TAB lead behavioral experiments and TT, NN, and SLP supported experiments and analyses. JH, SJE, NR, SG, LH, and TT conducted molecular experiments and histological analyses. AD, TN and LRM supported the experiments.
Conflict of interest
The authors declare that they have no conflict of interest.
Supporting information
Appendix
Expanded View Figures PDF
Table EV1
Table EV2
Table EV3
Source Data for Expanded View/Appendix
Review Process File
Source Data for Figure 4
Acknowledgements
We thank Dr. Stephen G. Young for providing a mouse line and his helpful advice, Dr. Uri Manor and the Waitt Advanced Biophotonics Core for imaging, Caz O’Connor and Conor Fitzpatrick for FACS, Dr. Nasun Hah for high‐throughput sequencing, and Dr. Gerd Kempermann providing experimental materials. We also thank Barbara Miller for technical assistance, Mary Lynn Gage for editorial comments, and current and previous members of the Toda and Gage laboratories for helpful discussions. We are grateful to the DZNE LMF facility, DZNE animal experimental platform and CRTD animal house, the Waitt Advanced Biophotonics Core Facility for support. This work was supported by the Japan Society for the Promotion of Science (T.T), Paul F. Glenn Center for Biology of Aging Research postdoctoral fellowship (T.T), the ERC Starting grant: 804468 (T.T), the Helmholtz Association’s Future Topic “Aging and Metabolic Programming” (AMPro, ZT‐0026) (T.T.), German Center for Neurodegenerative Diseases (T.T), the Paul G. Allen Family Trust, an AHA‐Allen Initiative in Brain Health and Cognitive Impairment award made jointly through the American Heart Association and The Paul G. Allen Frontiers Group: 19PABH134610000 (F.H.G), The JPB Foundation (F.H.G), The Dolby Foundation (F.H.G), The Helmsley Trust (F.H.G), the NGS Core Facility and the Flow Cytometry Core Facility of the Salk Institute with funding from NIH‐NCI CCSG: P30 014195, the Waitt Foundation and NINDS Neuroscience Center (NS072031). Open access funding enabled and organized by Projekt DEAL.
The EMBO Journal (2021) 40: e105819.
Data availability
RNA‐Seq data: Gene Expression Omnibus: GSE156156 (https://www.ncbi.nlm.nih.gov/geo/query/acc.cgi?acc=GSE156156).
References
- Akers KG, Martinez‐Canabal A, Restivo L, Yiu AP, De Cristofaro A, Hsiang HL, Wheeler AL, Guskjolen A, Niibori Y, Shoji H et al (2014) Hippocampal neurogenesis regulates forgetting during adulthood and infancy. Science 344: 598–602 [DOI] [PubMed] [Google Scholar]
- Anacker C, Hen R (2017) Adult hippocampal neurogenesis and cognitive flexibility ‐ linking memory and mood. Nat Rev Neurosci 18: 335–346 [DOI] [PMC free article] [PubMed] [Google Scholar]
- Baek JH, Schmidt E, Viceconte N, Strandgren C, Pernold K, Richard TJ, Van Leeuwen FW, Dantuma NP, Damberg P, Hultenby K et al (2015) Expression of progerin in aging mouse brains reveals structural nuclear abnormalities without detectible significant alterations in gene expression, hippocampal stem cells or behavior. Hum Mol Genet 24: 1305–1321 [DOI] [PMC free article] [PubMed] [Google Scholar]
- Beckervordersandforth R, Ebert B, Schaffner I, Moss J, Fiebig C, Shin J, Moore DL, Ghosh L, Trinchero MF, Stockburger C et al (2017) Role of mitochondrial metabolism in the control of early lineage progression and aging phenotypes in adult hippocampal neurogenesis. Neuron 93: 560–573 [DOI] [PMC free article] [PubMed] [Google Scholar]
- Ben Abdallah NM, Slomianka L, Vyssotski AL, Lipp HP (2010) Early age‐related changes in adult hippocampal neurogenesis in C57 mice. Neurobiol Aging 31: 151–161 [DOI] [PubMed] [Google Scholar]
- Berdugo‐Vega G, Arias‐Gil G, Lopez‐Fernandez A, Artegiani B, Wasielewska JM, Lee CC, Lippert MT, Kempermann G, Takagaki K, Calegari F (2020) Increasing neurogenesis refines hippocampal activity rejuvenating navigational learning strategies and contextual memory throughout life. Nat Commun 11: 135 [DOI] [PMC free article] [PubMed] [Google Scholar]
- Bergami M, Rimondini R, Santi S, Blum R, Gotz M, Canossa M (2008) Deletion of TrkB in adult progenitors alters newborn neuron integration into hippocampal circuits and increases anxiety‐like behavior. Proc Natl Acad Sci USA 105: 15570–15575 [DOI] [PMC free article] [PubMed] [Google Scholar]
- Blomfield IM, Rocamonde B, Masdeu MDM, Mulugeta E, Vaga S, van den Berg DL, Huillard E, Guillemot F, Urban N (2019) Id4 promotes the elimination of the pro‐activation factor Ascl1 to maintain quiescence of adult hippocampal stem cells. Elife 8: e48561 [DOI] [PMC free article] [PubMed] [Google Scholar]
- Bonaguidi MA, Wheeler MA, Shapiro JS, Stadel RP, Sun GJ, Ming GL, Song H (2011) In vivo clonal analysis reveals self‐renewing and multipotent adult neural stem cell characteristics. Cell 145: 1142–1155 [DOI] [PMC free article] [PubMed] [Google Scholar]
- Bracko O, Singer T, Aigner S, Knobloch M, Winner B, Ray J, Clemenson GD Jr, Suh H, Couillard‐Despres S, Aigner L et al (2012) Gene expression profiling of neural stem cells and their neuronal progeny reveals IGF2 as a regulator of adult hippocampal neurogenesis. J Neurosci 32: 3376–3387 [DOI] [PMC free article] [PubMed] [Google Scholar]
- Butin‐Israeli V, Adam SA, Goldman AE, Goldman RD (2012) Nuclear lamin functions and disease. Trends Genet 28: 464–471 [DOI] [PMC free article] [PubMed] [Google Scholar]
- Cameron HA, McKay R (1998) Stem cells and neurogenesis in the adult brain. Curr Opin Neurobiol 8: 677–680 [DOI] [PubMed] [Google Scholar]
- Cameron HA, McKay RD (1999) Restoring production of hippocampal neurons in old age. Nat Neurosci 2: 894–897 [DOI] [PubMed] [Google Scholar]
- Campbell S, Marriott M, Nahmias C, MacQueen GM (2004) Lower hippocampal volume in patients suffering from depression: a meta‐analysis. Am J Psychiatry 161: 598–607 [DOI] [PubMed] [Google Scholar]
- Chen H, Zheng X, Zheng Y (2014) Age‐associated loss of lamin‐B leads to systemic inflammation and gut hyperplasia. Cell 159: 829–843 [DOI] [PMC free article] [PubMed] [Google Scholar]
- Chen NY, Yang Y, Weston TA, Belling JN, Heizer P, Tu Y, Kim P, Edillo L, Jonas SJ, Weiss PS et al (2019) An absence of lamin B1 in migrating neurons causes nuclear membrane ruptures and cell death. Proc Natl Acad Sci USA 116: 25870–25879 [DOI] [PMC free article] [PubMed] [Google Scholar]
- Clelland CD, Choi M, Romberg C, Clemenson GD Jr, Fragniere A, Tyers P, Jessberger S, Saksida LM, Barker RA, Gage FH et al (2009) A functional role for adult hippocampal neurogenesis in spatial pattern separation. Science 325: 210–213 [DOI] [PMC free article] [PubMed] [Google Scholar]
- Coffinier C, Jung HJ, Nobumori C, Chang S, Tu Y, Barnes RH 2nd, Yoshinaga Y, de Jong PJ, Vergnes L, Reue K et al (2011) Deficiencies in lamin B1 and lamin B2 cause neurodevelopmental defects and distinct nuclear shape abnormalities in neurons. Mol Biol Cell 22: 4683–4693 [DOI] [PMC free article] [PubMed] [Google Scholar]
- David DJ, Samuels BA, Rainer Q, Wang JW, Marsteller D, Mendez I, Drew M, Craig DA, Guiard BP, Guilloux JP et al (2009) Neurogenesis‐dependent and ‐independent effects of fluoxetine in an animal model of anxiety/depression. Neuron 62: 479–493 [DOI] [PMC free article] [PubMed] [Google Scholar]
- Deng W, Aimone JB, Gage FH (2010) New neurons and new memories: how does adult hippocampal neurogenesis affect learning and memory? Nat Rev Neurosci 11: 339–350 [DOI] [PMC free article] [PubMed] [Google Scholar]
- Deng W, Saxe MD, Gallina IS, Gage FH (2009) Adult‐born hippocampal dentate granule cells undergoing maturation modulate learning and memory in the brain. J Neurosci 29: 13532–13542 [DOI] [PMC free article] [PubMed] [Google Scholar]
- Dulken BW, Buckley MT, Navarro Negredo P, Saligrama N, Cayrol R, Leeman DS, George BM, Boutet SC, Hebestreit K, Pluvinage JV et al (2019) Single‐cell analysis reveals T cell infiltration in old neurogenic niches. Nature 571: 205–210 [DOI] [PMC free article] [PubMed] [Google Scholar]
- Ehm O, Goritz C, Covic M, Schaffner I, Schwarz TJ, Karaca E, Kempkes B, Kremmer E, Pfrieger FW, Espinosa L et al (2010) RBPJkappa‐dependent signaling is essential for long‐term maintenance of neural stem cells in the adult hippocampus. J Neurosci 30: 13794–13807 [DOI] [PMC free article] [PubMed] [Google Scholar]
- Encinas JM, Michurina TV, Peunova N, Park JH, Tordo J, Peterson DA, Fishell G, Koulakov A, Enikolopov G (2011) Division‐coupled astrocytic differentiation and age‐related depletion of neural stem cells in the adult hippocampus. Cell Stem Cell 8: 566–579 [DOI] [PMC free article] [PubMed] [Google Scholar]
- Gomez‐Cavazos JS, Hetzer MW (2012) Outfits for different occasions: tissue‐specific roles of Nuclear Envelope proteins. Curr Opin Cell Biol 24: 775–783 [DOI] [PMC free article] [PubMed] [Google Scholar]
- Goncalves JT, Schafer ST, Gage FH (2016) Adult neurogenesis in the hippocampus: from stem cells to behavior. Cell 167: 897–914 [DOI] [PubMed] [Google Scholar]
- Gontier G, Iyer M, Shea JM, Bieri G, Wheatley EG, Ramalho‐Santos M, Villeda SA (2018) Tet2 rescues age‐related regenerative decline and enhances cognitive function in the adult mouse brain. Cell Rep 22: 1974–1981 [DOI] [PMC free article] [PubMed] [Google Scholar]
- Han J, Kim HJ, Schafer ST, Paquola A, Clemenson GD, Toda T, Oh J, Pankonin AR, Lee BS, Johnston ST et al (2016) Functional Implications of miR‐19 in the Migration of Newborn Neurons in the Adult Brain. Neuron 91: 79–89 [DOI] [PubMed] [Google Scholar]
- Ibarra A, Benner C, Tyagi S, Cool J, Hetzer MW (2016) Nucleoporin‐mediated regulation of cell identity genes. Genes Dev 30: 2253–2258 [DOI] [PMC free article] [PubMed] [Google Scholar]
- Jacinto FV, Benner C, Hetzer MW (2015) The nucleoporin Nup153 regulates embryonic stem cell pluripotency through gene silencing. Genes Dev 29: 1224–1238 [DOI] [PMC free article] [PubMed] [Google Scholar]
- Jung HJ, Coffinier C, Choe Y, Beigneux AP, Davies BS, Yang SH, Barnes RH 2nd, Hong J, Sun T, Pleasure SJ et al (2012) Regulation of prelamin A but not lamin C by miR‐9, a brain‐specific microRNA. Proc Natl Acad Sci USA 109: E423–431 [DOI] [PMC free article] [PubMed] [Google Scholar]
- Kalamakis G, Brune D, Ravichandran S, Bolz J, Fan W, Ziebell F, Stiehl T, Catala‐Martinez F, Kupke J, Zhao S et al (2019) Quiescence modulates stem cell maintenance and regenerative capacity in the aging brain. Cell 176: 1407–1419 [DOI] [PubMed] [Google Scholar]
- Kim Y, Sharov AA, McDole K, Cheng M, Hao H, Fan CM, Gaiano N, Ko MS, Zheng Y (2011) Mouse B‐type lamins are required for proper organogenesis but not by embryonic stem cells. Science 334: 1706–1710 [DOI] [PMC free article] [PubMed] [Google Scholar]
- Kim Y, Zheng X, Ansari Z, Bunnell MC, Herdy JR, Traxler L, Lee H, Paquola ACM, Blithikioti C, Ku M et al (2018) Mitochondrial aging defects emerge in directly reprogrammed human neurons due to their metabolic profile. Cell Rep 23: 2550–2558 [DOI] [PMC free article] [PubMed] [Google Scholar]
- Kubben N, Misteli T (2017) Shared molecular and cellular mechanisms of premature ageing and ageing‐associated diseases. Nat Rev Mol Cell Biol 18: 595–609 [DOI] [PMC free article] [PubMed] [Google Scholar]
- Kuhn HG, Dickinson‐Anson H, Gage FH (1996) Neurogenesis in the dentate gyrus of the adult rat: age‐related decrease of neuronal progenitor proliferation. J Neurosci 16: 2027–2033 [DOI] [PMC free article] [PubMed] [Google Scholar]
- Kuipers SD, Schroeder JE, Trentani A (2015) Changes in hippocampal neurogenesis throughout early development. Neurobiol Aging 36: 365–379 [DOI] [PubMed] [Google Scholar]
- Leeman DS, Hebestreit K, Ruetz T, Webb AE, McKay A, Pollina EA, Dulken BW, Zhao X, Yeo RW, Ho TT et al (2018) Lysosome activation clears aggregates and enhances quiescent neural stem cell activation during aging. Science 359: 1277–1283 [DOI] [PMC free article] [PubMed] [Google Scholar]
- Lehmann ML, Brachman RA, Martinowich K, Schloesser RJ, Herkenham M (2013) Glucocorticoids orchestrate divergent effects on mood through adult neurogenesis. J Neurosci 33: 2961–2972 [DOI] [PMC free article] [PubMed] [Google Scholar]
- Lugert S, Basak O, Knuckles P, Haussler U, Fabel K, Gotz M, Haas CA, Kempermann G, Taylor V, Giachino C (2010) Quiescent and active hippocampal neural stem cells with distinct morphologies respond selectively to physiological and pathological stimuli and aging. Cell Stem Cell 6: 445–456 [DOI] [PubMed] [Google Scholar]
- Madisen L, Zwingman TA, Sunkin SM, Oh SW, Zariwala HA, Gu H, Ng LL, Palmiter RD, Hawrylycz MJ, Jones AR et al (2010) A robust and high‐throughput Cre reporting and characterization system for the whole mouse brain. Nat Neurosci 13: 133–140 [DOI] [PMC free article] [PubMed] [Google Scholar]
- Mahajani S, Giacomini C, Marinaro F, De Pietri TD, Contestabile A, Gasparini L (2017) Lamin B1 levels modulate differentiation into neurons during embryonic corticogenesis. Sci Rep 7: 4897 [DOI] [PMC free article] [PubMed] [Google Scholar]
- McAvoy KM, Scobie KN, Berger S, Russo C, Guo N, Decharatanachart P, Vega‐Ramirez H, Miake‐Lye S, Whalen M, Nelson M et al (2016) Modulating neuronal competition dynamics in the dentate gyrus to rejuvenate aging memory circuits. Neuron 91: 1356–1373 [DOI] [PMC free article] [PubMed] [Google Scholar]
- Mertens J, Paquola AC, Ku M, Hatch E, Bohnke L, Ladjevardi S, McGrath S, Campbell B, Lee H, Herdy JR et al (2015) Directly reprogrammed human neurons retain aging‐associated transcriptomic signatures and reveal age‐related nucleocytoplasmic defects. Cell Stem Cell 17: 705–718 [DOI] [PMC free article] [PubMed] [Google Scholar]
- Meyers EA, Gobeske KT, Bond AM, Jarrett JC, Peng CY, Kessler JA (2016) Increased bone morphogenetic protein signaling contributes to age‐related declines in neurogenesis and cognition. Neurobiol Aging 38: 164–175 [DOI] [PMC free article] [PubMed] [Google Scholar]
- Ming GL, Song H (2005) Adult neurogenesis in the mammalian central nervous system. Annu Rev Neurosci 28: 223–250 [DOI] [PubMed] [Google Scholar]
- Moore DL, Pilz GA, Arauzo‐Bravo MJ, Barral Y, Jessberger S (2015) A mechanism for the segregation of age in mammalian neural stem cells. Science 349: 1334–1338 [DOI] [PubMed] [Google Scholar]
- Nakashiba T, Cushman JD, Pelkey KA, Renaudineau S, Buhl DL, McHugh TJ, Rodriguez Barrera V, Chittajallu R, Iwamoto KS, McBain CJ et al (2012) Young dentate granule cells mediate pattern separation, whereas old granule cells facilitate pattern completion. Cell 149: 188–201 [DOI] [PMC free article] [PubMed] [Google Scholar]
- Namihira M, Nakashima K (2013) Mechanisms of astrocytogenesis in the mammalian brain. Curr Opin Neurobiol 23: 921–927 [DOI] [PubMed] [Google Scholar]
- Palmer TD, Takahashi J, Gage FH (1997) The adult rat hippocampus contains primordial neural stem cells. Mol Cell Neurosci 8: 389–404 [DOI] [PubMed] [Google Scholar]
- Peric‐Hupkes D, Meuleman W, Pagie L, Bruggeman SW, Solovei I, Brugman W, Graf S, Flicek P, Kerkhoven RM, van Lohuizen M et al (2010) Molecular maps of the reorganization of genome‐nuclear lamina interactions during differentiation. Mol Cell 38: 603–613 [DOI] [PMC free article] [PubMed] [Google Scholar]
- Peric‐Hupkes D, van Steensel B (2010) Role of the nuclear lamina in genome organization and gene expression. Cold Spring Harb Symp Quant Biol 75: 517–524 [DOI] [PubMed] [Google Scholar]
- Ray J, Gage FH (2006) Differential properties of adult rat and mouse brain‐derived neural stem/progenitor cells. Mol Cell Neurosci 31: 560–573 [DOI] [PubMed] [Google Scholar]
- Revest JM, Dupret D, Koehl M, Funk‐Reiter C, Grosjean N, Piazza PV, Abrous DN (2009) Adult hippocampal neurogenesis is involved in anxiety‐related behaviors. Mol Psychiatry 14: 959–967 [DOI] [PubMed] [Google Scholar]
- Sadaie M, Salama R, Carroll T, Tomimatsu K, Chandra T, Young AR, Narita M, Perez‐Mancera PA, Bennett DC, Chong H et al (2013) Redistribution of the Lamin B1 genomic binding profile affects rearrangement of heterochromatic domains and SAHF formation during senescence. Genes Dev 27: 1800–1808 [DOI] [PMC free article] [PubMed] [Google Scholar]
- Sahay A, Scobie KN, Hill AS, O'Carroll CM, Kheirbek MA, Burghardt NS, Fenton AA, Dranovsky A, Hen R (2011) Increasing adult hippocampal neurogenesis is sufficient to improve pattern separation. Nature 472: 466–470 [DOI] [PMC free article] [PubMed] [Google Scholar]
- Samuels B, Hen R (2011) Novelty‐suppressed feeding in the mouse. In Mood and anxiety related phenotypes in mice: characterization using behavioral tests.Gould T (ed.), pp 107–121. Humana Press; [Google Scholar]
- Saxe MD, Battaglia F, Wang JW, Malleret G, David DJ, Monckton JE, Garcia AD, Sofroniew MV, Kandel ER, Santarelli L et al (2006) Ablation of hippocampal neurogenesis impairs contextual fear conditioning and synaptic plasticity in the dentate gyrus. Proc Natl Acad Sci USA 103: 17501–17506 [DOI] [PMC free article] [PubMed] [Google Scholar]
- Scaffidi P, Misteli T (2006) Lamin A‐dependent nuclear defects in human aging. Science 312: 1059–1063 [DOI] [PMC free article] [PubMed] [Google Scholar]
- Scaffidi P, Misteli T (2008) Lamin A‐dependent misregulation of adult stem cells associated with accelerated ageing. Nat Cell Biol 10: 452–459 [DOI] [PMC free article] [PubMed] [Google Scholar]
- Schafer ST, Han J, Pena M, Von Bohlen und Halbach O, Peters J, Gage FH (2015) The Wnt adaptor protein ATP6AP2 regulates multiple stages of adult hippocampal neurogenesis. J Neurosci 35: 4983–4998 [DOI] [PMC free article] [PubMed] [Google Scholar]
- Seibenhener ML, Wooten MC (2015) Use of the Open Field Maze to measure locomotor and anxiety‐like behavior in mice. J Vis Exp e52434 [DOI] [PMC free article] [PubMed] [Google Scholar]
- Seki T, Arai Y (1995) Age‐related production of new granule cells in the adult dentate gyrus. Neuroreport 6: 2479–2482 [DOI] [PubMed] [Google Scholar]
- Shoji H, Takao K, Hattori S, Miyakawa T (2016) Age‐related changes in behavior in C57BL/6J mice from young adulthood to middle age. Mol Brain 9: 11 [DOI] [PMC free article] [PubMed] [Google Scholar]
- Simon P, Dupuis R, Costentin J (1994) Thigmotaxis as an index of anxiety in mice. Influence of dopaminergic transmissions. Behav Brain Res 61: 59–64 [DOI] [PubMed] [Google Scholar]
- Smith LK, He Y, Park JS, Bieri G, Snethlage CE, Lin K, Gontier G, Wabl R, Plambeck KE, Udeochu J et al (2015) beta2‐microglobulin is a systemic pro‐aging factor that impairs cognitive function and neurogenesis. Nat Med 21: 932–937 [DOI] [PMC free article] [PubMed] [Google Scholar]
- Suh H, Consiglio A, Ray J, Sawai T, D'Amour KA, Gage FH (2007) In vivo fate analysis reveals the multipotent and self‐renewal capacities of Sox2+ neural stem cells in the adult hippocampus. Cell Stem Cell 1: 515–528 [DOI] [PMC free article] [PubMed] [Google Scholar]
- Surget A, Saxe M, Leman S, Ibarguen‐Vargas Y, Chalon S, Griebel G, Hen R, Belzung C (2008) Drug‐dependent requirement of hippocampal neurogenesis in a model of depression and of antidepressant reversal. Biol Psychiatry 64: 293–301 [DOI] [PubMed] [Google Scholar]
- Surget A, Tanti A, Leonardo ED, Laugeray A, Rainer Q, Touma C, Palme R, Griebel G, Ibarguen‐Vargas Y, Hen R et al (2011) Antidepressants recruit new neurons to improve stress response regulation. Mol Psychiatry 16: 1177–1188 [DOI] [PMC free article] [PubMed] [Google Scholar]
- Tashiro A, Zhao C, Gage FH (2006) Retrovirus‐mediated single‐cell gene knockout technique in adult newborn neurons in vivo. Nat Protoc 1: 3049–3055 [DOI] [PubMed] [Google Scholar]
- Toda T, Hsu JY, Linker SB, Hu L, Schafer ST, Mertens J, Jacinto FV, Hetzer MW, Gage FH (2017) Nup153 interacts with Sox2 to enable bimodal gene regulation and maintenance of neural progenitor cells. Cell Stem Cell 21: 618–634 [DOI] [PubMed] [Google Scholar]
- Toda T, Parylak SL, Linker SB, Gage FH (2018) The role of adult hippocampal neurogenesis in brain health and disease. Mol Psychiatry 24: 67–87 [DOI] [PMC free article] [PubMed] [Google Scholar]
- Toyama BH, Savas JN, Park SK, Harris MS, Ingolia NT, Yates JR 3rd, Hetzer MW (2013) Identification of long‐lived proteins reveals exceptional stability of essential cellular structures. Cell 154: 971–982 [DOI] [PMC free article] [PubMed] [Google Scholar]
- Ullrich NJ, Gordon LB (2015) Hutchinson‐Gilford progeria syndrome. Handb Clin Neurol 132: 249–264 [DOI] [PubMed] [Google Scholar]
- Urban N, van den Berg DL, Forget A, Andersen J, Demmers JA, Hunt C, Ayrault O, Guillemot F (2016) Return to quiescence of mouse neural stem cells by degradation of a proactivation protein. Science 353: 292–295 [DOI] [PMC free article] [PubMed] [Google Scholar]
- van Praag H, Shubert T, Zhao C, Gage FH (2005) Exercise enhances learning and hippocampal neurogenesis in aged mice. J Neurosci 25: 8680–8685 [DOI] [PMC free article] [PubMed] [Google Scholar]
- Villeda SA, Luo J, Mosher KI, Zou B, Britschgi M, Bieri G, Stan TM, Fainberg N, Ding Z, Eggel A et al (2011) The ageing systemic milieu negatively regulates neurogenesis and cognitive function. Nature 477: 90–94 [DOI] [PMC free article] [PubMed] [Google Scholar]
- Yamaguchi M, Saito H, Suzuki M, Mori K (2000) Visualization of neurogenesis in the central nervous system using nestin promoter‐GFP transgenic mice. NeuroReport 11: 1991–1996 [DOI] [PubMed] [Google Scholar]
- Yang SH, Chang SY, Yin L, Tu Y, Hu Y, Yoshinaga Y, de Jong PJ, Fong LG, Young SG (2011) An absence of both lamin B1 and lamin B2 in keratinocytes has no effect on cell proliferation or the development of skin and hair. Hum Mol Genet 20: 3537–3544 [DOI] [PMC free article] [PubMed] [Google Scholar]
- Zhao C, Teng EM, Summers RG Jr, Ming GL, Gage FH (2006) Distinct morphological stages of dentate granule neuron maturation in the adult mouse hippocampus. J Neurosci 26: 3–11 [DOI] [PMC free article] [PubMed] [Google Scholar]
- Zheng X, Boyer L, Jin M, Mertens J, Kim Y, Ma L, Ma L, Hamm M, Gage FH, Hunter T (2016) Metabolic reprogramming during neuronal differentiation from aerobic glycolysis to neuronal oxidative phosphorylation. Elife 5: e13374 [DOI] [PMC free article] [PubMed] [Google Scholar]
- Zuela N, Bar DZ, Gruenbaum Y (2012) Lamins in development, tissue maintenance and stress. EMBO Rep 13: 1070–1078 [DOI] [PMC free article] [PubMed] [Google Scholar]
Associated Data
This section collects any data citations, data availability statements, or supplementary materials included in this article.
Supplementary Materials
Appendix
Expanded View Figures PDF
Table EV1
Table EV2
Table EV3
Source Data for Expanded View/Appendix
Review Process File
Source Data for Figure 4
Data Availability Statement
RNA‐Seq data: Gene Expression Omnibus: GSE156156 (https://www.ncbi.nlm.nih.gov/geo/query/acc.cgi?acc=GSE156156).