Down syndrome-related transient abnormal myelopoiesis (TAM) is a temporal preleukemic state presenting the marked elevation of blast cells at birth.1 Although somatic GATA1 mutations are known to be a cause of TAM, it is still unclear in which immature hematopoietic progenitor cell (HPC) subpopulation they most strongly evoke abnormal proliferation.2 Considering the different properties of hematopoietic cells from different species, it is necessary to establish an appropriate human model applicable for studying TAM and its embryonic definitive hematopoietic origin. Recent pluripotent stem cell (PSC)-based models have reported the recapitulation of TAM phenotypes and suggested the implication of a specific gene locus on chromosome 21 in GATA1 mutation-driven perturbated hematopoiesis.3-5 However, little is known about which progenitor cells the subpopulation with abnormal myelopoiesis are primarily associated with the abnormal myelopoiesis due to the lack of chronological analysis following hematopoietic differentiation. In order to overcome this point, we previously used our step-wise hematopoietic differentiation system to trace the progenitors from mesoderm to lineage-committed HPC via very immature multipotent progenitors.6,7
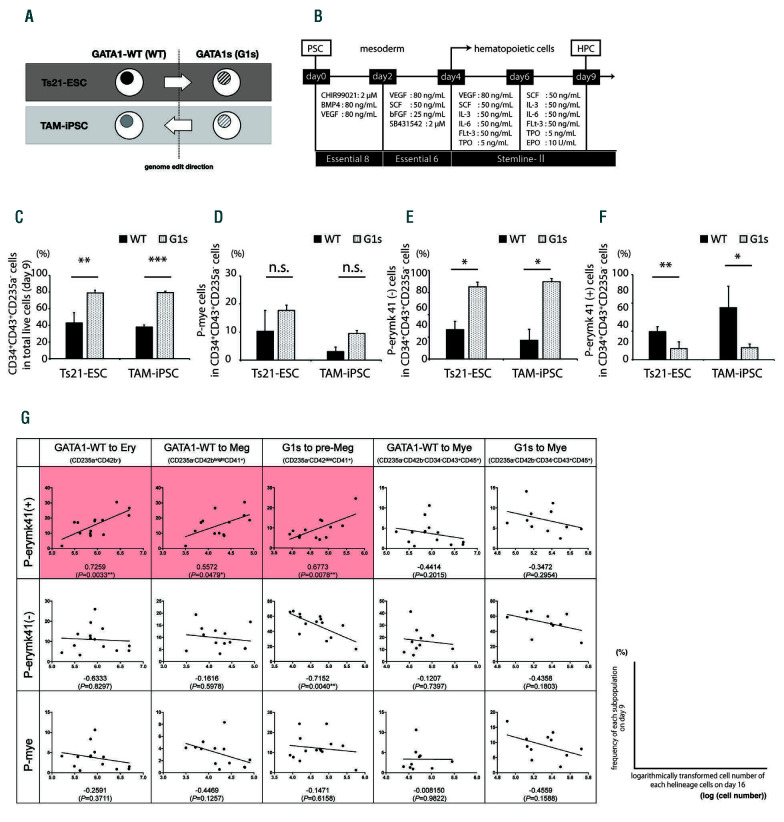
In this study, we first examined the GATA1-dependent hematopoietic property using two independent isogenic trisomy 21 (Ts21) PSC pairs (Figure 1A): one is a TAM patient-blast-derived induced PSC (iPSC) pair (Online Supplementary Figure S1)8 and the other is a human embryonic stem cells (ESC) pair with or without GATA1 mutation.9 We confirmed that the obtained genome-edited clones have no additional karyotype abnormality other than Ts21. No off-target mutations in the entire exonic sequence of GATA1 gene were observed by Sanger sequencing. GATA1-wild-type clones (WT-clones) expressed both full-length and short GATA1, while GATA1-mutated clones (G1s-clones) expressed only short GATA1. These G1s-clones showed abnormal hematopoiesis such as a decrease in CD71bright+CD42b- CD235a+ erythroid and CD41+CD42b+CD235amegakaryocytic cells in step-wise hematopoietic differentiation (Online Supplementary Figure S2). On the other hand, CD34-CD235a-CD41-CD43+CD45+ myeloid-lineage cells from G1s-clones showed an increase not only in multi-lineage culture (Online Supplementary Figure 2AB) but also in myeloid-specific culture (data not shown).
In order to identify the relevant HPC subpopulation inducing these differences, we traced the differentiation efficacy and expression profiles using an hematopoiesisfocused PCR array during step-wise hematopoiesis (Figure 1B; Online Supplementary Figure 3; Online Supplementary Table S1).10 In mesodermal and early hematopoietic differentiation, WT- and G1s-clones showed similar efficiencies in the patterns of phenotype transition. KDR+CD34+ hemoangiogenic progenitors were similarly observed in both clones on day 4, followed by CD34+CD43+ HPC on day 6 (Online Supplementary Figure S4). On the other hand, later phase progenitors on day 9 were significantly different between WT- and G1s-clones. The frequency of CD34+CD43+CD235a- HPC was significantly higher in G1s-clones (Figure 1C). The day 9 HPC were further categorized into three subpopulations based on the expressions of CD11b (a representative marker of myeloid cells), CD71 (erythroid and megakaryocytic progenitors), and CD41 (megakaryocytic progenitors) as CD34+CD43+CD235a- CD11b+CD41- (designated here as P-mye) (Figure 1D), CD34+CD43+CD235a-CD11b- CD71+CD41- (P-erymk41(-)) (Figure 1E), and CD3 4 +CD4 3 +CD2 3 5 a -CD1 1 b -CD7 1 +CD4 1 + (P-erymk41(+)) (Figure 1F), respectively. Regarding the P-mye frequency, no significant difference was observed between WT- and G1s-clones at this stage. On the other hand, the P-erymk41(-) and P-erymk41(+) frequencies showed a significant difference between WT- and G1sclones, but in opposite directions: P-erymk41(-) was increased in G1s-clones and P-erymk41(+) in WT-clones. These data suggested the presence of some pivotal pathways in these two immature subpopulations that caused significant differences in later development, that is, increased myeloid lineages and impaired megakaryocytic maturation in G1s-clones on day 16. Thus, our observations indicated that GATA1 mutation distinctly affected the properties of late-stage CD34+ P-erymk progenitors rather than earlier-stage CD34+ progenitors.
In order to narrow down the responsible factors and their target subpopulations in day 9 CD34+CD43+CD235a- HPC, we performed correlation analysis using the first approximation to compare each subpopulation frequency on day 9 and the resultant lineage- committed cell number on day 16. As a result, only the P-erymk41(+) subpopulation on day 9 showed a significantly positive correlation with the number of both mature megakaryocytic cells on day 16 in WT-clones and immature megakaryoblastic cells in G1s-clones (Figure 1G, second and third panels from the left), and also showed a positive correlation with erythroid cells, which were observed only in WT-clones (Figure 1G, leftmost panel). These results suggested that P-erymk41(+) is most closely related to the normal erythroid and megakaryocytic differentiation of WT-clones and the impaired maturation of megakaryocytic lineage in G1s-clones. On the other hand, regarding myeloid lineages, no subpopulations showed a significant correlation in either WT- or G1s-clones (Figure 1G, fourth and fifth panels from the left), indicating that myeloid lineage cells on day 16 could not be attributed to a single HPC subpopulation on day 9 under erythroid-megakaryocytic differentiation condition.
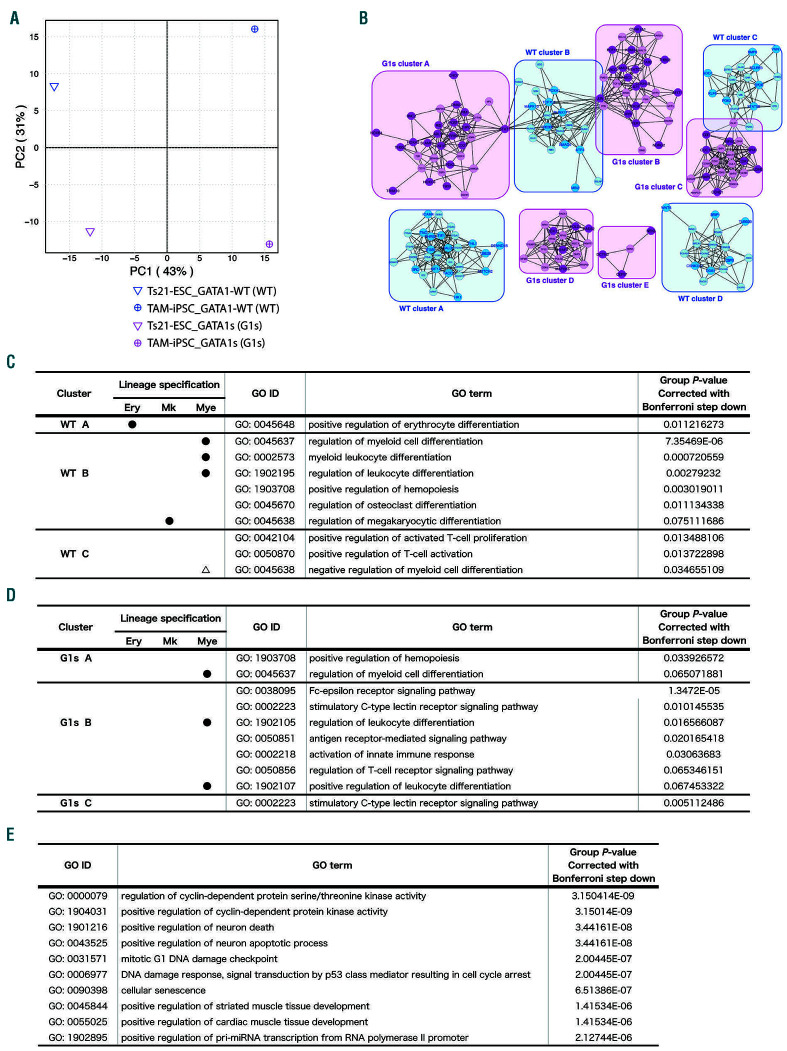
Post hoc analyses on targeted transcription profiles strongly indicated that the in vitro TAM phenotype in the G1s-clones reflected some perturbation of the gene expression profiles resulting from a GATA1 mutation in P-erymk41(+) (Online Supplementary Figure S5; Online Supplementary Table S2). We therefore explored differences between WT- and G1s-clones in the core pathway signatures of this subpopulation. Indeed, gene network analysis based on 103 genes extracted by the clustering algorithm (correlation index >0.8 in a factorial space given by principle component analysis)11,12 unveiled striking differences in the cellular pathways (Figure 2A-D; Online Supplementary Figure S6; Online Supplementary Table S3). We found that gene sets related to multi-lineage differentiation, including erythroid-, megakaryocytic-, and myeloid-lineages were significantly enriched in the WT-clones, whereas only myeloid-related gene sets were enriched in the G1s-clones (Figure 2C-D; Online Supplementary Table S3; P-values corrected with Bonferroni step down <0.1). Moreover, we found that pathways related to the cell cycle and DNA damage were highly and significantly enriched only in G1s-clones (Figure 2E; Online Supplementary Table S3; top ten P-values corrected with Bonferroni step down <0.001). These findings characterize deviations in the cellular pathway profiles of this subpopulation that are dependent on GATA1 mutation. Taken together, these data suggest that the mutation brings about a decay of intracellular signal coordination in these cells at this stage, including an imbalance of signals that determine cell proliferation and death, as well as in cells involved in cell fate decision. Those perturbations should contribute to the progenitor distribution shown in Figure 1, although more detailed analyses are required.
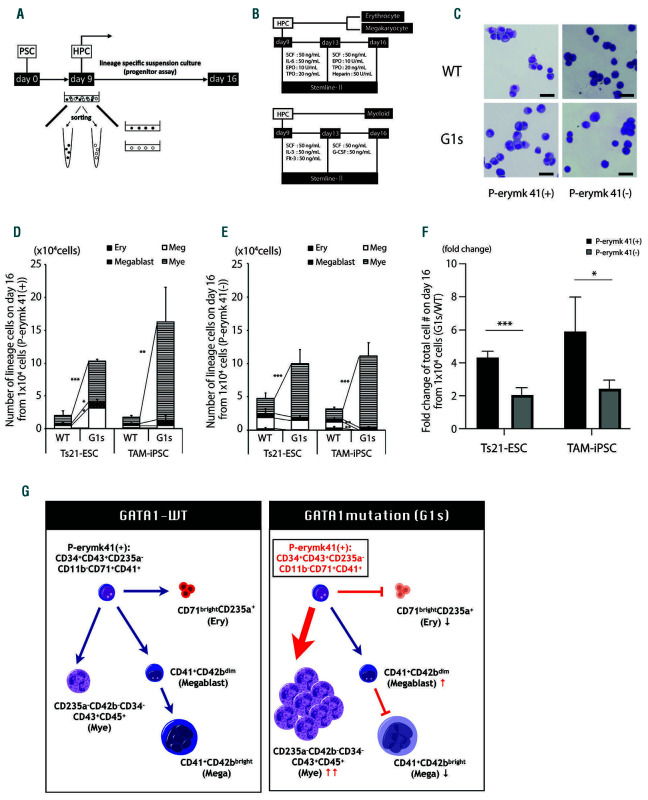
In order to corroborate our findings, we performed progenitor assays by culturing sorted cells from both WT- and G1s-clones (Figure 3A-B). As depicted in Figure 3C, cells harvested from WT- and G1s-clones showed similar morphology in P-erymk41(+) and P-erymk41(-). However, when each subpopulation was separately cultured, both fractions from the G1s-clones presented significantly higher levels in cell number expansion under the myeloid-specific differentiation condition (Figure 3D, E). This change suggested we could use this assay to delineate the impact of the GATA1 mutation in abnormal cell proliferation. Moreover, the difference in cell number expansion revealed that P-erymk41(+) was significantly affected more by the GATA1 mutation only under myeloid-specific differentiation condition (Figure 3F; Online Supplementary Figure S7C) verifying the network analysis described above. On the other hand, under erythroid- megakaryocytic condition, P-erymk41(+) and P-erymk41(-) G1s-clones did not show any significant increase in total cell numbers compared with WT-clones (Online Supplementary Figure S7D). These data together demonstrated P-erymk41(+) is a progenitor intermediate that contributes strongly to abnormal myeloid cell proliferation (Figure 3G).
Figure 1.
GATA1-dependent differences in the CD34+CD43+CD235- progenitor stage. (A) Schema of the GATA1-wild-type (WT) and GATA1-mutated (G1s) Ts21- pluripotent stem cell (PSC) line panels used in this study. (B) Protocol for sequential hematopoietic progenitor cell differentiation. (C) Percentages of CD34+CD43+CD235- cells on day 9. P-values between WT and G1s Ts21-embryonic stem cells (ESC): P=0.0079; and between transient abnormal myelopoiesis (TAM)-induced pluripotent stem cells (iPSC)(TAM-iPSC) WT and G1s: P<0.0001. (D) Percentages of P-mye (CD34+CD43+CD235-CD11b+CD41-) in CD34+CD43+CD235- cells on day 9. (E) Percentages of P-erymk41(-) (CD34+CD43+CD235-CD11b-CD71+CD41-) in CD34+CD43+CD235- cells on day 9. P-values between WT and G1s Ts21-ESC: P=0.0303; and between WT and G1s TAM-iPSC: P=0.0134. (F) Percentages of P-erymk41(+) (CD34+CD43+CD235-CD11b- CD71+CD41+) in CD34+CD43+CD235- cells on day 9. P-values between WT and G1s Ts21-ESC: P=0.016; and between WT and G1s TAM-iPSC: P=0.0199. Student’s t-test. Data are shown as the mean + standard deviation. *P<0.05, **P<0.01, ***P<0.001; n.s: not significant; n = 3-4. (G) Table of the correlation between the percentage of each subpopulation on day 9 (column headings, y-axis) and logarithmically-transformed cell number of the resultant lineage-committed cells on day 16 (row headings, x-axis) of the culture. Correlation coefficients and P-values (Pearson correlation in GraphPad Prism) for each square are described under each regression line. *P<0.05, **P<0.01; n=10-14.
Figure 2.
P-erymk41(+) with GATA1 mutation display activation of pathways that cause abnormal myelopoiesis. (A) Principal component analysis (PCA) mapping P-erymk41(+) (CD34+CD43+CD235-CD11b-CD71+CD41+)of GATA1-wild-type clones (WT-clones) and GATA1-mutated clones (G1s-clones) from Ts21-embryonic stem cells (Ts21-ESC) and transient abnormal myelopoiesis (TAM)-induced pluripotent stem cell (TAM-iPSC) strains. (B-F) The results of a clustering algorithm for automated functional annotations. (B) An expanded map showing the clusters of genes extracted by the positive correlation (correlation index >0.8 in the PCA shown in (A)) with WT (blue) and G1s (-) (magenta). The closed circles depict genes originally included in the PCR array. Open circles depict genes replenished by GENEMANIA. Each gene is listed in the Online Supplementary Table S4. (C-E) The intracellular pathways specifically enriched in (C) WT and (D) G1s cell populations. GO terms with P<0.08 in Bonferroni step down analysis are listed. No significant GO terms for gene sets categorized to WT cluster D or G1s clusters D or E were enriched. The closed circles in (C) and (D) show the lineage specifications indicated by GO terms. The open triangle in (C) depicts the indicated negative relationship to myeloid differentiation. (E) The intracellular pathways specifically enriched in the G1s-clones P-erymk41(+) filtered by “biological process”. The top 10 GO terms based on P-values corrected with Bonferroni step down <0.001 are listed.
Figure 3.
P-erymk41(+) are an origin of predominant myelopoiesis. (A-B) Schematic process of the progenitor assay. (C) Morphology (May-Grunwald Giemsa staining) of sorted progenitor cells. Representative cells from GATA1-wild-type clones (WT-clones) and GATA1-mutated clones (G1s-clones) from transient abnormal myelopoiesis (TAM)-induced pluripotent stem cell (TAM-iPSC) lines are shown. Scale bars, 25 mm. (D-E) Number of lineage cells derived from 1x10⁴ sorted (D) P-erymk41(+) (CD34+CD43+CD235-CD11b-CD71+CD41+) and (E) P-erymk41(-) of each clone under myeloid lineage-specific differentiation condition. (D) P-values compare Ery (erythrocytes), Meg (megakaryocytes), Megablast (magakaryoblasts), and Mye (myeloids) between WT and G1s Ts21-embryonic stem cells (Ts21-ESC): P=0.6777, P=0.0153, P=0.0121 and P<0.0001; and between WT and G1s TAM-iPSC: P=0.0603, P=0.8109, P=0.1407 and P=0.0018, respectively. (E) P-values compare Ery, Meg, Megablast, and Mye between WT and G1s Ts21-ESC: P=0.0806, P=0.6408, P=0.6860 and P=<0.0001; and between WT and G1s TAM-iPSC: P=0.0071, P=0.0087, P=0.5668 and P<0.0001, respectively. Student’s t-test. Data are presented as the mean + standard devaition. *P<0.05, **P<0.01, ***P<0.001; no mark: not significant; n = 3-7. (F) Fold changes of the total cell number calculated from the ratio of each G1s-clone per WT-clone on day 16. P-values compare Ts21-ESC, TAM-iPSC between P-erymk 41(+) and P-erymk 41(-): P<0.001 and TAM-iPSC (-): P=0.021279, respectively. Multiple comparisons using the Holm-Sidak method. Data are presented as the mean + standard devaition. *P<0.05, **P<0.01 and ***P<0.001; n = 3-7. (G) Graphical schematic showing the impact of GATA1 mutation on P-erymk41(+) in our hematopoietic system.
In summary, the current study identified the diseaseresponsible progenitors and the impact of GATA1 mutation on these cells by dissecting the differentiation steps of PSC-based hematopoiesis. The abnormal cells observed in patients with TAM have long been thought as being derived from definitive hematopoiesis,13 and recent studies have shown that PSC-derived definitive hematopoiesis predominantly arises from KDR+ mesodermal progenitors via CD235a-CD34+ subpopulations.14 Given that our data are provided from those specified subpopulations, our Ts21-PSC-based model likely describes definitive hematopoiesis in vitro. Thus, our hematopoietic induction model adequately reflects the pathogenesis of TAM.
P-erymk41(+) is an inflection stage for both impaired erythro-megakaryocyte maturation and abnormal cell proliferation in TAM specifically in response to erythromegakaryocytic and myeloid-directed stimulation, respectively. Together, we speculate that P-erymk41(+) can be a target of pre-emptive treatment for TAM. Our data also suggest that DNA damage responses may accumulate in P-erymk41(+) in the presence of GATA1 mutation. As TAM is a condition preceding Down syndrome acute megakaryoblastic leukemia (DS-AMKL) and as DS-AMKL is considered the consequence of acquired gene mutations,2 it is important to identify the most appropriate cell population from which the functional and molecular consequences of GATA1 mutation begins. From that viewpoint, our model should provide novel insights into the pathogenesis, prediction, and treatment of not only TAM, but also acute megakaryocytic leukemia in Down syndrome, though further analysis is needed.
Supplementary Material
Funding Statement
Funding: this work was supported by grants from the Ministry of Health, Labour and Welfare of Japan, Ministry of Education, Culture, Sports, Science and Technology of Japan, Japan Society for the Promotion of Science (JSPS) Research Fellowships for Young Scientists [YNA], KAKENHI Grant Number 19K17358 [YNA], KAKENHI Grant Number 25221308 [MO] and KAKENHI Grant Number 16K10026 [AN], Regional Innovation Support Program from the Ministry of Education, Culture, Sports, Science and Technology of Japan [MO and YK], the Leading Project of the Ministry of Education, Culture, Sports, Science and Technology [TN], the Funding Program for World-Leading Innovative Research and Development on Science and Technology of the Japan Society for the Promotion of Science [TN and MKS], CREST [TN], the Core Center for iPS Cell Research of Research Center Network for Realization of Regenerative Medicine from the Japan Agency for Medical Research and Development (AMED) [TN and MKS], the Program for Intractable Diseases Research utilizing Disease-specific iPS cells of AMED (17935423) [YNA, TN and MKS], and Practical Research Project for Rare/Intractable Diseases of AMED (17930095) [MKS].
References
- 1.Gamis AS, Alonzo TA, Gerbing RB. Natural history of transient myeloproliferative disorder clinically diagnosed in Down syndrome neonates: A report from the Children’s Oncology Group Study A2971. Blood. 2011;118(26):6752-6759. [DOI] [PMC free article] [PubMed] [Google Scholar]
- 2.Yoshida K, Toki T, Okuno Y, et al. The landscape of somatic mutations in Down syndrome-related myeloid disorders. Nat Genet. 2013;45(11):1293-1299. [DOI] [PubMed] [Google Scholar]
- 3.Chou ST, Byrska-Bishop M, Tober JM, et al. Trisomy 21-associated defects in human primitive hematopoiesis revealed through induced pluripotent stem cells. Proc Nat Acad Sci U S A. 2012;109(43):17573-17578. [DOI] [PMC free article] [PubMed] [Google Scholar]
- 4.Byrska-Bishop M, VanDorn D, Campbell AE, et al. Pluripotent stem cells reveal erythroid-specific activities of the GATA1 N-terminus. J Clin Invest. 2015;125(3):993-1005. [DOI] [PMC free article] [PubMed] [Google Scholar]
- 5.Banno K, Omori S, Hirata K, et al. Systematic cellular disease models reveal synergistic interaction of trisomy 21 and GATA1 mutations in hematopoietic abnormalities. Cell Rep. 2016;15(6):1228-1241. [DOI] [PubMed] [Google Scholar]
- 6.Niwa A, Heike T, Umeda K, et al. A novel serum-free monolayer culture for orderly hematopoietic differentiation of human pluripotent cells via mesodermal progenitors. PLoS One. 2011;6(7):e22261. [DOI] [PMC free article] [PubMed] [Google Scholar]
- 7.Yanagimachi MD, Niwa A, Tanaka T, et al. Robust and highlyefficient differentiation of functional monocytic cells from human pluripotent stem cells under serum- and feeder cell-free conditions. PLoS One. 2013;8(4):e59243. [DOI] [PMC free article] [PubMed] [Google Scholar]
- 8.Sakuma T, Ochiai H, Kaneko T, et al. Repeating pattern of non- RVD variations in DNA-binding modules enhances TALEN activity. Sci Rep. 2013;3:3379. [DOI] [PMC free article] [PubMed] [Google Scholar]
- 9.Kazuki Y, Hoshiya H, Kai Y, et al. Correction of a genetic defect in multipotent germline stem cells using a human artificial chromosome. Gene Ther. 2008;15(8):617-624. [DOI] [PubMed] [Google Scholar]
- 10.Psaila B, Barkas N, Iskander D, et al. Single-cell profiling of human megakaryocyte-erythroid progenitors identifies distinct megakaryocyte and erythroid differentiation pathways. Genome Biol. 2016;17:83. [DOI] [PMC free article] [PubMed] [Google Scholar]
- 11.Warde-Farley D, Donaldson SL, Comes O, et al. The GeneMANIA prediction server: biological network integration for gene prioritization and predicting gene function. Nucleic Acids Res. 2010;38(Web Server issue):W214-220. [DOI] [PMC free article] [PubMed] [Google Scholar]
- 12.Wu G, Dawson E, Duong A, et al. ReactomeFIViz: a cytoscape app for pathway and network-based data analysis. F1000Res. 2014;3:146. [DOI] [PMC free article] [PubMed] [Google Scholar]
- 13.Bhatnagar N, Nizery L, Tunstall O, et al. Transient abnormal myelopoiesis and AML in Down syndrome: an update. Curr Hematol Malig Rep. 2016;11(5):333-341. [DOI] [PMC free article] [PubMed] [Google Scholar]
- 14.Sturgeon CM, Ditadi A, Awong G, et al. Wnt signaling controls the specification of definitive and primitive hematopoiesis from human pluripotent stem cells. Nat Biotechnol. 2014;32(6):554-561 [DOI] [PMC free article] [PubMed] [Google Scholar]
Associated Data
This section collects any data citations, data availability statements, or supplementary materials included in this article.


