Abstract
Multiomic studies are increasingly performed to gain a deeper understanding of molecular processes occurring in a biological system, such as the complex microbial communities (i.e., microbiota) that reside the distal gut. While a combination of metabolomics and proteomics is more commonly used, multiomics studies including peptidomcis characterization are less frequently undertaken. Here, we investigated three different extraction methods, chosen for their previous use in extracting metabolites, peptides, and proteins, and compared their ability to perform metabolomic, peptidomic, and proteomic analysis of mouse cecum content. The methanol/chloroform/water extraction performed the best for metabolomic and peptidomic analysis as it detected the largest number of small molecules and identified the largest number of peptides, but the acidified methanol extraction performed best for proteomics analysis as it had the highest number of protein identifications. The methanol/chloroform/water extraction was further analyzed by identifying metabolites with MS/MS analysis and by gene ontology analysis for the peptide and protein results to provide a multiomics analysis of the gut microbiota.
Keywords: Microbiome, Multiomics, Metabolomics, Peptidomics, Proteomics
1. Introduction
The gastrointestinal tract is host to large and dynamic communities of microbes, containing ~108 to 1010 organisms per gram in the illium and stool,1 and encompassing the 3 domains of life: bacterial, archaea and eukaryotes.2,3 The gut microbiota has various roles in human health, including nutrition and immune function modulation.4,5 Furthermore, the disruption of the gut microbiota has been connected to various inflammatory chronic conditions such as inflammatory bowel disease,6 obesity,7,8 and cardiovascular disease.9,10 Due to the importance that the microbiota plays in human health, there is an abundance of studies on various aspects of the microbiota. Research includes various aspects of the microbiome such as the metagenomic11 and proteomic content,12 but also looks at how the microbiome influences other systems, including blood and cerebrospinal fluid metabolites.13,14
While studying individual “omics” results in a depth of information about the genomic, proteomic or metabolomic content of the desired biological specimen, the combination of multiple of these analyses can determine different connections between molecular classes in a biological system. Consequently, multiomic approaches are used to study the microbiota, as well as in other fields.15–18 A combination of metagenomic and metabolomic approaches has been used, for example, to study the microbiota’s response to infection,19 the effect of arsenic on the gut microbiome,20 and the effect of trichloroacetamide exposure on the gut microbiome and urinary metabolites.21 Other combinations of metagenomics, metatranscriptomics, metabolomics, and (meta)proteomics can also be employed.22 Although large amounts of data created in multiomic techniques can be challenging and time consuming to analyze, advances in software are arising to simplify the task.23,24
While the field of peptidomics is more recent than the fields of metabolomics and proteomics, it has nevertheless risen to importance.25,26 Well-studied signaling peptides in the brain, i.e. neuropeptides, are an important class of molecules regulating a wide variety of processes.27,28 Similarly, peptide hormones in the endocrine system are also important endogenous peptides that have been studied due to their role in regulating metabolism.29,30 In the gut, bioactive peptides, derived from digestion of proteins in the intestines, has resulted in a number of peptides with roles in health.31 For example, bioactive peptides present in the gut that inhibit the angiotensin I-converting enzyme (ACE) can reduce hypertension and improve cardiovascular health.32,33
Although multiomic studies with a combination of genomics, metabolomics, and proteomics is common, peptidomics is much less frequently combined with other “omic” techniques. Therefore, we set out to identify an optimal extraction method ideal for combining peptidomics with metabolomics and proteomics for a multiomics approach to analyze the gut microbiota. Here, we tested three different extraction methods for combined metabolomics, peptidomics, and proteomics. Mouse cecum content was selected for its high microbial load, in order to allow for robust detection of microbiota-associated metabolites, peptides, and proteins.19 Only one region of the gastrointestinal tract was selected for this study as the focus was to compare the different extraction methods. Other regions of the gastrointestinal tract do contain important microbiota and would also be interesting to investigate in a follow-up study to compare changes in the metabolite, peptide, and protein content across different regions of the gastrointestinal tract. The three extractions chosen have been previously used in various biological systems to achieve good results in one or more of the metabolomics, peptidomics, and proteomics fields and comprise of a variety of solvent systems. The chloroform/methanol/water extraction is a common small molecule extraction that can be used for metabolomics and proteomics multiomics studies,34 and has previously been used to study cecal metabolomics.19 An acidified methanol extraction is commonly used in neuropeptide extractions29,35 but has also been applied for metabolomics.36 Finally, the 40/40/20 acetonitrile/methanol/water extraction adds acetonitrile to the extraction solvent, which has been shown to be beneficial for certain metabolites37 and has been shown to work well in metabolomics studies.38 The small molecules, peptides, and proteins detected for each extraction were compared and used to determine an optimal extraction for metabolomic, peptidomic, and proteomic analysis. While the acidified methanol extraction performed best for the proteomics experiments, the methanol/chloroform/water extraction yielded better results in terms of the number of small molecules and peptides detected and was further evaluated with gene ontology analysis.
2. Materials and Methods
2.1. Cecum Collection
All animal procedures were approved by the Institutional Animal Care and Use Committee at the University of Wisconsin-Madison. Germ-free (n=1) and conventionally-raised (n=1) male C57BL/6 mice were used and fed LabDiet #5021 (Purina Mills, Inc. Richmond, IN). At 21 weeks of age, mice were euthanized via CO2 inhalation and exsanguination. Cecal content was collected, snap frozen in liquid nitrogen immediately, and stored in the −80°C until analysis.
2.2. Sample Preparation
The two cecum samples were combined and separated into three approximately equal aliquots. On one aliquot, a methanol/chloroform/water extraction was performed in a PTFE tube by adding in order, 3 parts methanol, 1 part chloroform, and 4 parts Milli-Q ultrapure water (total volute 4.0 mL). The tube was vortexed and centrifuged at 3200 × g and 4°C for 15 minutes. The upper aqueous layer was removed, and 4 parts methanol were added to the tube and vortexed. The tube was centrifuged again at 1500 × g and 4°C for 5 minutes. The supernatant was removed (organic fraction). The aqueous fraction, organic fraction, and pellet were dried down and saved in the −80°C until further processing. The second aliquot was extracted with acidified methanol (methanol/water/acetic acid 90/9/1 v/v/v) and the third aliquot with 40% methanol 40% acetonitrile 20% water. Both of these two extractions were probe sonicated for 3 cycles (8s on 15 s off) at 4°C and centrifuged at 15,000 × g and 4°C for 15 minutes. The supernatant and pellet were separated and then dried down in a speed vac and saved in the −80°C until further processing.
A 3 kDa molecular weight cut-off (MWCO) filtration was performed on the aqueous and organic fraction of the methanol/chloroform/water extraction, the acidified methanol (AcMeOH) extraction, and the methanol/acetonitrile/water extraction. The Amicon Ultra (Millipore) MWCO device was first rinsed with 0.2 mL 0.1 M NaOH, and 0.5 mL 50% methanol. Both rinses were centrifuged at 14,000 × g until the rinse was through the membrane. The sample was then loaded into the device and centrifuged through the device at 14,000 × g. A final rinse of 0.1 mL 50% methanol was added to the device and the MWCO was centrifuged at 14,000 × g. The content below 3 kDa was split into two aliquots (one metabolomics and one peptidomics) for each of the four samples and dried down in a speed vac. The MWCO was rinsed with 0.4 mL 50% methanol and equilibrated for 5 mins, and then flipped over and centrifuged at 14,000 × g for 2 mins to collect content above 3 kDa from the device. A 30 kDa MWCO was performed on the above three kDa fraction to separate the extract into peptidomics (3 kDa to 30 kDa) and proteomics (above 30 kDa) fractions.
The below 3 kDa and 3–30 kDa peptidomics fractions were combined. Sep-Pak C18 was used for peptide desalting, and then peptide samples were dried down in a speed vac and saved at −80°C until LC-MS/MS analysis. The proteomics fractions from the supernatant contents above 30 kDa and from the pellets were combined. The aqueous and organic fraction above 30 kDa from the methanol/chloroform/water extraction method were combined together with the pellet. The protein mixture samples were dissolved in 1 mL ice-cold PBS, and debris from the pellet was removed with a low centrifuge speed (300 × g, 4°C for 5 mins).39 The supernatant was carefully collected, and the pellets were washed another two times with PBS and all the supernatant obtained from each time was combined. The supernatant was then centrifuged at 20,000 × g for 10 min to pellet the bacterial cells and host cells. The pellet was then lysed with 8 M urea Lysis buffer with sonication (On 8 sec, Off 15 sec, 3 cycles). The total protein concentration of each pellet was determined by BCA assay and then digested with Trypsin/Lys-C mixture overnight. Then, the digested proteins were desalted, dried down in a speed vac, and saved in the −80°C until LC-MS/MS analysis.
2.3. Metabolomics Data Acquisition and Analysis
The aqueous fraction was resuspended at 10 mg/mL in optima grade water with 0.1% formic acid while the other three metabolomic samples (organic fraction, AcMeOH sample, MeOH/AcN/water sample) were resuspended at 10 mg/mL in optima grade methanol with 0.1% formic acid. Any samples that were cloudy were centrifuged briefly and the supernatant used for the analysis. LC-MS/MS analysis was performed with a Dionex Ultimate 3000 UHPLC system connected to a Q Exactive mass spectrometer (Thermo Scientific). Separation occurred on a Cortecs C18 column (2.1 mm internal diameter × 100 mm length, 1.6 μm particle size; Waters), equipped with a corresponding guard column with a column temperature of 35°C, and mobile phases of optima grade water with 0.1% formic acid (A) and acetonitrile with 0.1% formic acid (B). A 35 minute gradient at a flow rate of 0.3 mL/minutes with the following conditions was used for separation: 0–5 min, 1% B; 5–10 min, linear gradient from 1–3% B; 10–18 min, linear gradient from 3–40% B; 18–22 min, linear gradient from 40–80% B; 22–27 min, column cleaning at 95% B; and 27–35 min, re-equilibration at 1% B. A top 5 data dependent acquisition method was used for MS/MS of small molecules in the extractions. The full MS settings were 70,000 resolution, 1e6 AGC, 100 ms max inject time, 100–1500 m/z. The MS/MS settings were 35,000 resolution, 1e5 AGC, 100 ms max inject time, 1.0 m/z isolation window, and 30 dynamic exclusion. Three technical replicates were run for each extraction, and each technical replicate used a different HCD collision energy (25, 30, 40 respectively). Samples were run in both positive and negative mode.
Compound Discoverer software was used to analyze the LC-MS/MS data for each extraction in both positive and negative ion mode (the aqueous and organic fractions were analyzed together). Individual runs were aligned with an adaptive curve model with a maximum shift of 1 minute and 5 ppm tolerance. Unknown compounds were detected with a 5 ppm mass tolerance, 30% intensity tolerance, 3 S/N ratio, and 1,000,000 minimum peak intensity. Unknown compounds were grouped with a 5 ppm mass tolerance and 0.1-minute retention time tolerance. A fill gaps step was used with 5 ppm mass error and 0.1-min retention time error. Constant sum normalization and marking of background compounds were used. The MS/MS spectra were searched in the mzCloud library against all activation types and activation energies and matches were manually validated by ensuring that all the major fragment ions in the database spectra matched the experimental spectra. MS/MS spectra were also searched against the MassBank of North America MS/MS database for additional identifications.
2.4. Peptidomics Acquisition and Analysis
Peptide samples were resuspended in optima grade water with 3% acetonitrile and 0.1% formic acid. LC-MS/MS was performed on an Ultimate 3000 UPLC system coupled with the Orbitrap Fusion™ Tribrid™ Mass Spectrometer. A 75 μm × 16 cm homemade column packed with 1.7 μm, 150 Å, BEH C18 material obtained from a Waters (Milford, MA) UPLC column (part no. 186004661) was used for label-free peptide separation at a flow rate of 0.3 μl/min. Mobile phase A was 0.1% formic acid in optima water and mobile phase B was 0.1% formic acid in optima acetonitrile. The 145 min optimized gradient used was as follows: 0–18.33 min, 3% solvent B; 18.33–30 min, 3–10% B; 30–50 min, 10–20% B; 50–108 min, 20–75% B; 108–118 min, 75% B; 118–118.5 min 75%−95% B; 118.5–128 min, 95% B; 128–128.5 min, 95%−3% B; 128.5–145 min, 3% B. Full MS scans were acquired from m/z 300 to 1500 at a resolution of 60 K, automatic gain control (AGC) at 2 × 10⁵, and maximum injection time (IT) of 100 ms. The top 20 precursors were then selected for higher-energy C-trap dissociation tandem mass spectrometry (HCD MS2) analysis with an isolation window of 1 m/z, a HCD collision energy (NCE) of 30, a resolving power of 15 k, an AGC target of 5 × 10⁴, a maximum injection time of 100 ms, and a lower mass limit of 120 m/z.
The .raw data files from the Orbitrap MS analysis were searched against a combined database which included food, 93 strains of bacteria, and mouse proteome from Uniport with PEAKS STUDIO 8.5 software. A precursor tolerance of 10 ppm and a fragment mass tolerance of 0.02 Da were allowed. Acetylation (N-term), amidation, oxidation (M), pyro-Glu from E, pyro-Glu from Q, sulfation (STY), were set as rare dynamic modifications and allowing three maximum variable PTM per peptide. Parameters for confident peptide identification were Ascore (PTM site confidence) higher than 20, FDR lower than 1%, and the presence of at least one unique peptide.
2.5. Proteomics Acquisition and Analysis
A Dionex UltiMate 3000 nanoLC system coupled with a Q Exactive HF Orbitrap MS was used for Ultra-performance LC-MS analysis. Homemade column and mobile phases were the same as mentioned above for the peptidomic analysis. The optimized gradient used was as follows: 0–16 min, 3% solvent B; 16–20 min, 3–25% B; 20–30 min, 25–45% B; 30–50 min, 45–70% B; 50–56 min, 70–95% B; 56–60 min 95% B; 60–60.5 min, 95–3% B; 60.5–70 min, 3% B. Full MS scans were acquired from m/z 300 to 1500 at a resolution of 60 K, AGC at 1 × 10⁶, and maximum injection time (IT) of 100 ms. The top 15 precursors were then selected for higher-energy C-trap dissociation tandem mass spectrometry (HCD MS2) analysis with an isolation window of 1.4 m/z, a normalized collision energy (NCE) of 30, a resolving power of 15 K, an AGC target of 1 × 10⁵, a maximum injection time of 100 ms, and a lower mass limit of 120 m/z. PEAKS software was used for protein identification. The parameters were the same as used above for peptidomics analysis, except trypsin with D&P enzyme was selected for this bottom-up proteomics study. Non-specific cleavage at both ends of the peptide was allowed and the maximum missed cleavages per peptide was set at two.
3. Results
Two cecal content samples were combined and split into three approximately equal aliquots to test three different extraction protocols. The sample preparation workflow is provided in Figure 1 for the three extractions. The three extractions tested were a methanol/chloroform/water (MeOH/CHCl3/H2O) extraction, an acidified methanol (AcMeOH) extraction, and a methanol, acetonitrile, water (MeOH/AcN/H2O) extraction. The methanol/chloroform/water extraction resulted in two liquid fractions, an aqueous fraction and an organic fraction, as well as a pellet. The other two extractions resulted in a supernatant and a pellet. The four liquid portions were processed with a 3 kDa molecular weight cut-off followed by a 30 kDa molecular weight cut-off. The <3 kDa portion was split for LC-MS metabolomics analysis and nano-LC-MS peptidomics analysis. The 3<x<30 kDa portion was saved for nano-LC-MS peptidomics analysis as well. The >30 kDa fraction was combined with the pellet for bottom up nano-LC-MS proteomics analysis.
Figure 1.
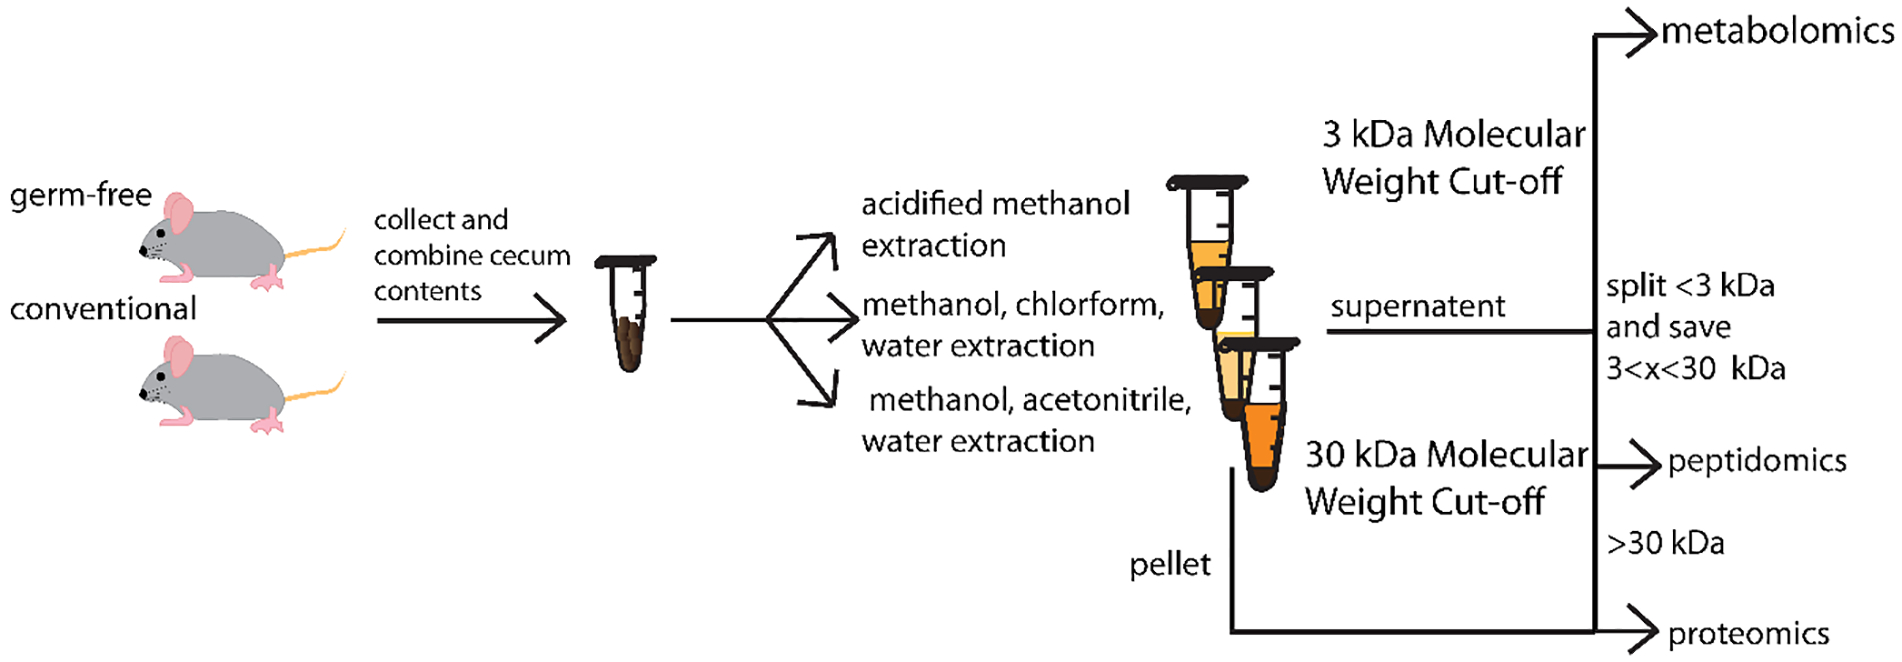
Schematic diagram showing experimental workflow.
3.1. Metabolomics
Metabolomics data was analyzed in Compound Discoverer 2.0 to detect unknown compounds and perform tandem MS (MS/MS) matching of experimental MS/MS spectra to the mzCloud high resolution/accurate mass spectral database. Each of the three extractions were analyzed separately in the software with the same parameters to test how many compounds were detected in each extraction. The aqueous and organic fractions for the methanol/chloroform/water extraction were combined in the software. Figure 2 shows the results for the metabolomics analysis. In both positive and negative mode, the methanol/chloroform/water extraction detected about 2-fold more compounds than the other extractions in Compound Discoverer. Compound monoisotopic molecular weights were processed in METLIN with a 5 ppm error to approximate how many of the m/z potentially matched to known small molecules. The methanol/chloroform/water extraction still out-performed the other two extractions in both positive and negative mode in the METLIN analysis. In order to compare the detected m/z across the three extractions, the METLIN search results were used to create Venn diagrams. To be consistent, the lowest METLIN identification number was used for the m/z that had multiple accurate mass matches to the METLIN database. In the Venn diagrams (Figure 2B, positive data, Figure 2D, negative data), a majority of the compounds are detected with the methanol, chloroform water extraction, with only a small percentage unique to one of the other two extractions. Thus, the methanol/chloroform/water extraction performs the best for metabolomics analysis.
Figure 2.
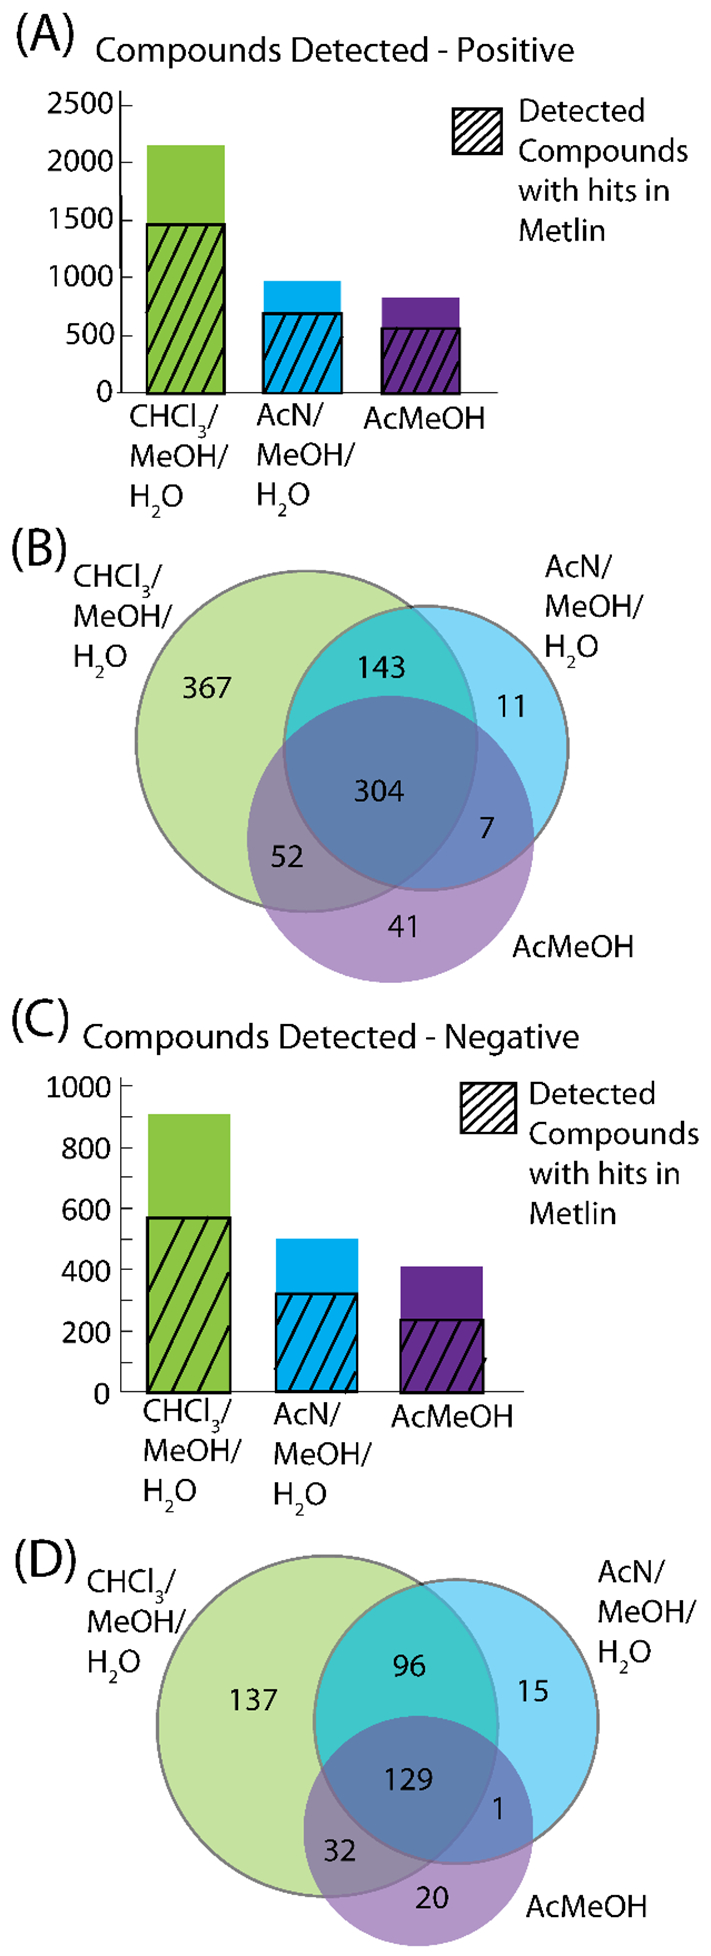
Metabolomics results for the three extractions. The number of compounds detected is shown for positive (A) and negative (C) mode. The m/z with hits in METLIN were compared between the three extractions in Venn Diagrams (B), positive and (D), negative mode.
3.2. Peptidomics
Peptidomic analysis was performed on a nano-LC QE-HF system and the data analyzed in PEAKS 8.5 software. Figure 3 shows the results of the peptidomics experiments by showing the peptide sequences detected and by comparing the protein accession numbers detected. In Figure 3A, the number of peptide sequences is shown with the number of peptide sequences shared in both technical replicates represented with the diagonal lines. The organic fraction of the methanol/chloroform/water extraction had the most peptides identified, with the aqueous fraction in second. The other two extractions showed low numbers of peptide identifications. When comparing the proteins detected from the peptide sequences that were shared between both technical replicates for the organic and aqueous fractions, most of the aqueous proteins were also in the organic fraction, but there were proteins only in the aqueous fraction. To compare the three extractions, the combination of unique proteins from the aqueous and organic fraction were taken, along with the proteins in both technical replicates for the other two extractions. The Venn diagram shows only 2 proteins that were not detected by the methanol/chloroform/water extraction and over 100 proteins that were only detected in the methanol/chloroform/water extraction. Thus, the methanol/chloroform/water extraction performed best for the peptidomics analysis as it identified the most proteins and covered almost all of the proteins identified in the other two extractions.
Figure 3.
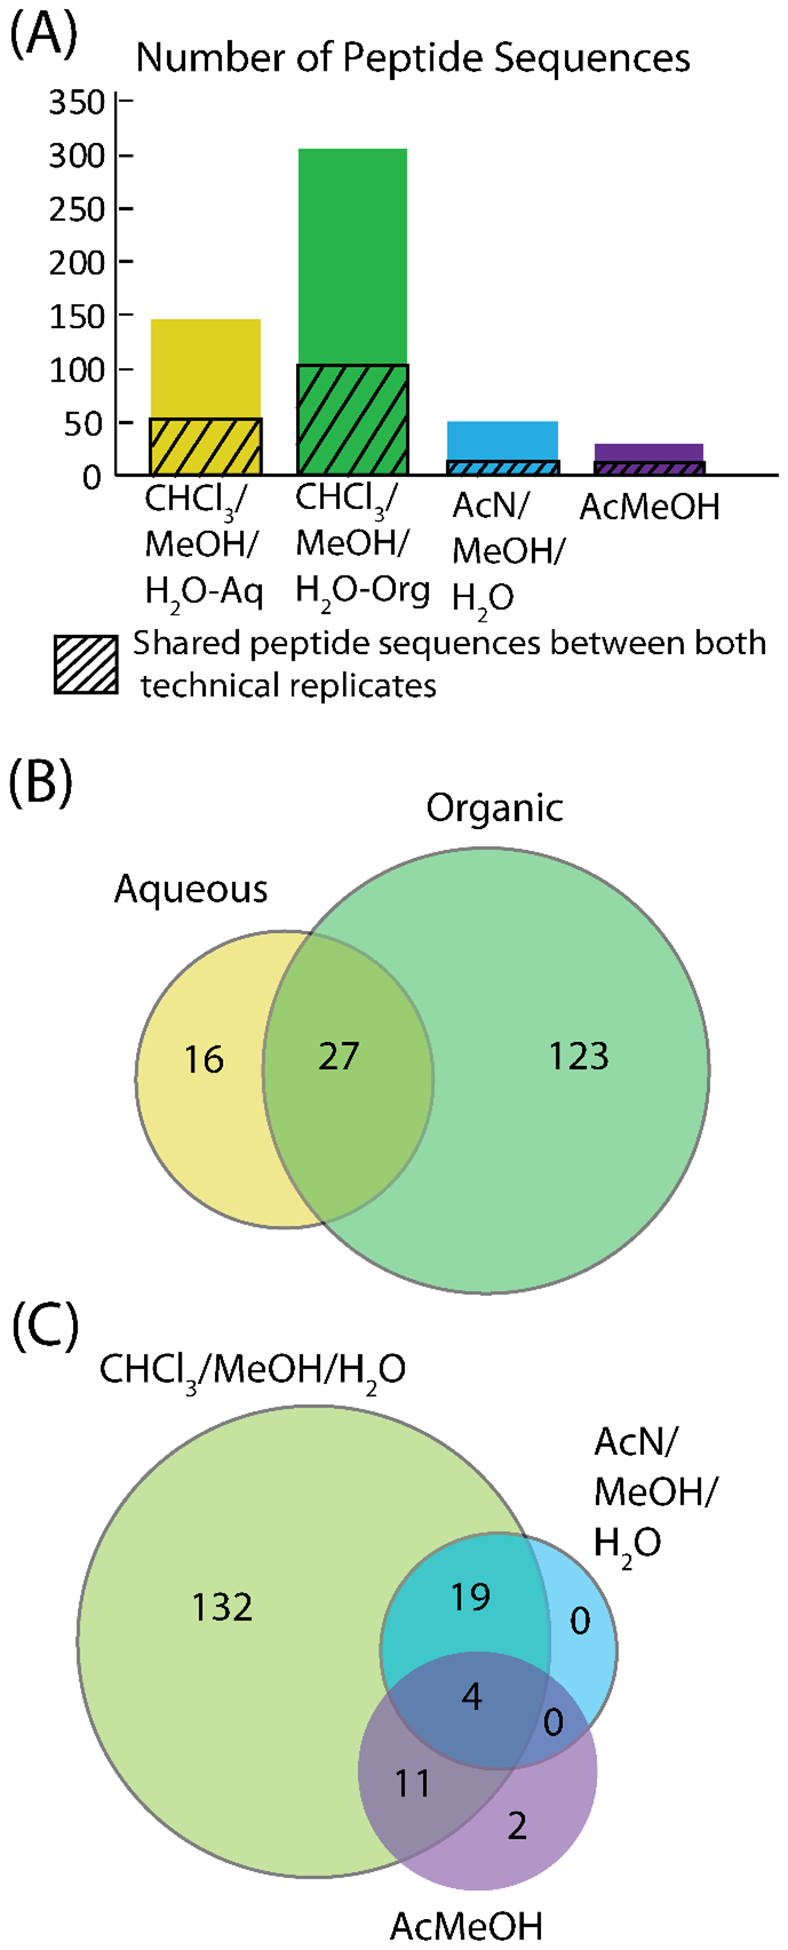
Peptidomics results from the extraction test. In (A) the number of peptide sequences are shown. (B) compares the protein accession numbers in the aqueous and organic fractions of the methanol/chloroform/water extraction. (C) compares the protein accession numbers for the three extractions.
To look further at the differences between the peptides detected in the aqueous and organic fractions, peptide sequences found in each fraction from the proteins present in both technical replicates were compared with respect to their length and isoelectric point. The isoelectric point was calculated using the Peptide Property calculator (GeneScript, online tool) as it allowed the inclusion of certain posttranslational modifications (PTMs), for example acetylation. PTMs that were not present in this online tool were excluded from the isoelectric point analysis, but this was a minority for each fraction (11/198 for organic fraction 2/89 for aqueous fraction). Figure 4 shows the results of the length and isoelectric point comparison. The length distribution in the aqueous and organic fractions seemed to be similar as the organic fraction had approximately 2-fold more peptides sequences at each length, and overall the organic fraction had about 2 times more sequences. The isoelectric point distribution, however, did appear to be different between the two fractions. While the number of peptides with very low pI’s was approximately the same for both fractions, the organic fraction had more peptide sequences with pI’s above 4. The organic fraction potentially extracted a larger number of peptides than the aqueous fraction due to the preference of the peptides for the methanol/chloroform solvent.
Figure 4.
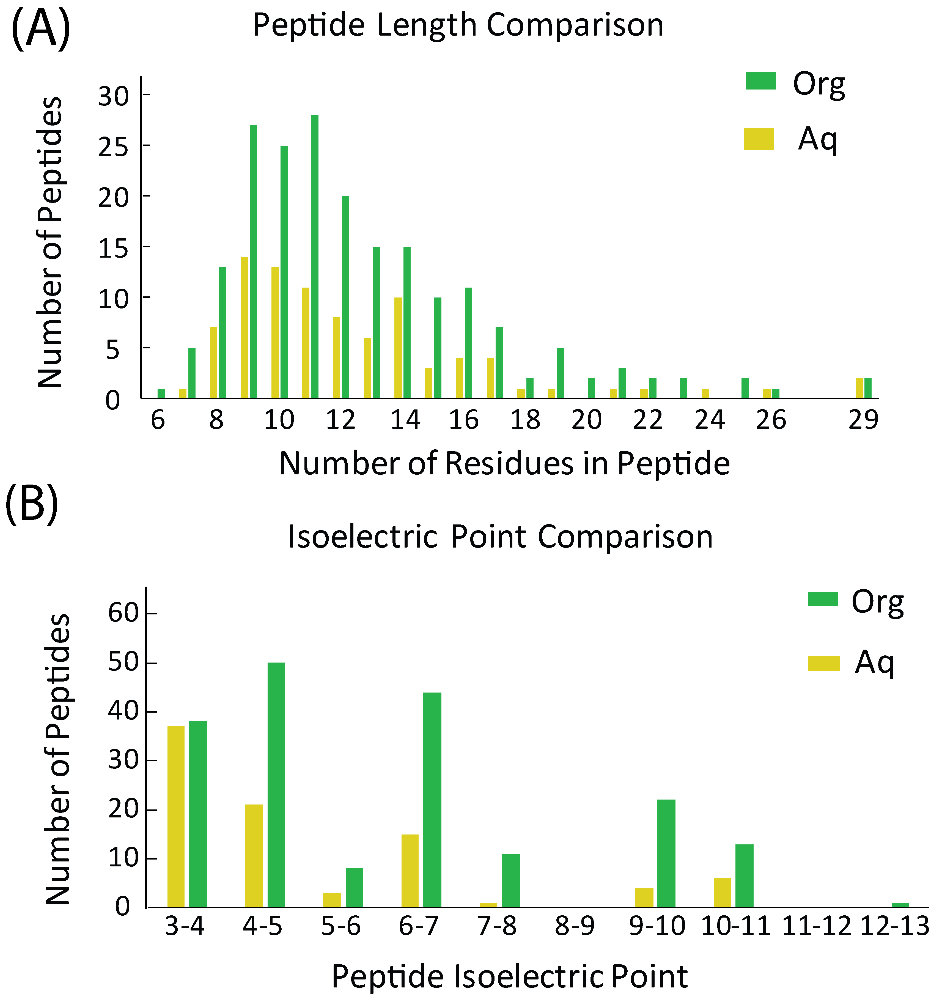
Comparison of peptide length (A) and isoelectric point (B) between peptide sequences detected in organic and aqueous fractions.
3.3. Proteomics
Bottom-up proteomics was performed on the pellets and the >30 kDa content from the molecular weight cut-off step. The results of this analysis are shown in Figure 5. The acidified methanol extraction had noticeably more proteins than the other two extractions. The comparison of the three extractions shows that each extraction has hundreds of identifications unique to that extraction, with the acidified methanol extraction having over a thousand unique identifications. For searching, a combined multi-organism database was used containing the mouse genome, the genomes of approximately 90 bacterial strains for a model microbiota,19 and potential proteins from the food the mice were fed. While conventionally raised mice very likely have a more diverse microbial community,40 here a more focused database was used because increasing the database size to a more comprehensive one would make processing the MS/MS data significantly more challenging. For studies highly interested in the microbial species present, a targeted microbiome database without the mouse and food components could be used instead. Figure 5C shows the number of proteins that match to each of the different potential sources of the protein, namely the mouse, the microbiome, and the food. The methanol/acetonitrile/water extraction has the most proteins matching to both the mouse database and the food proteins. In contrast, the acidified methanol extraction yielded a vast majority of its protein identifications from microbiome proteins, as this extraction method produced a much higher number of microbiome identifications compared to the other two extractions.
Figure 5.
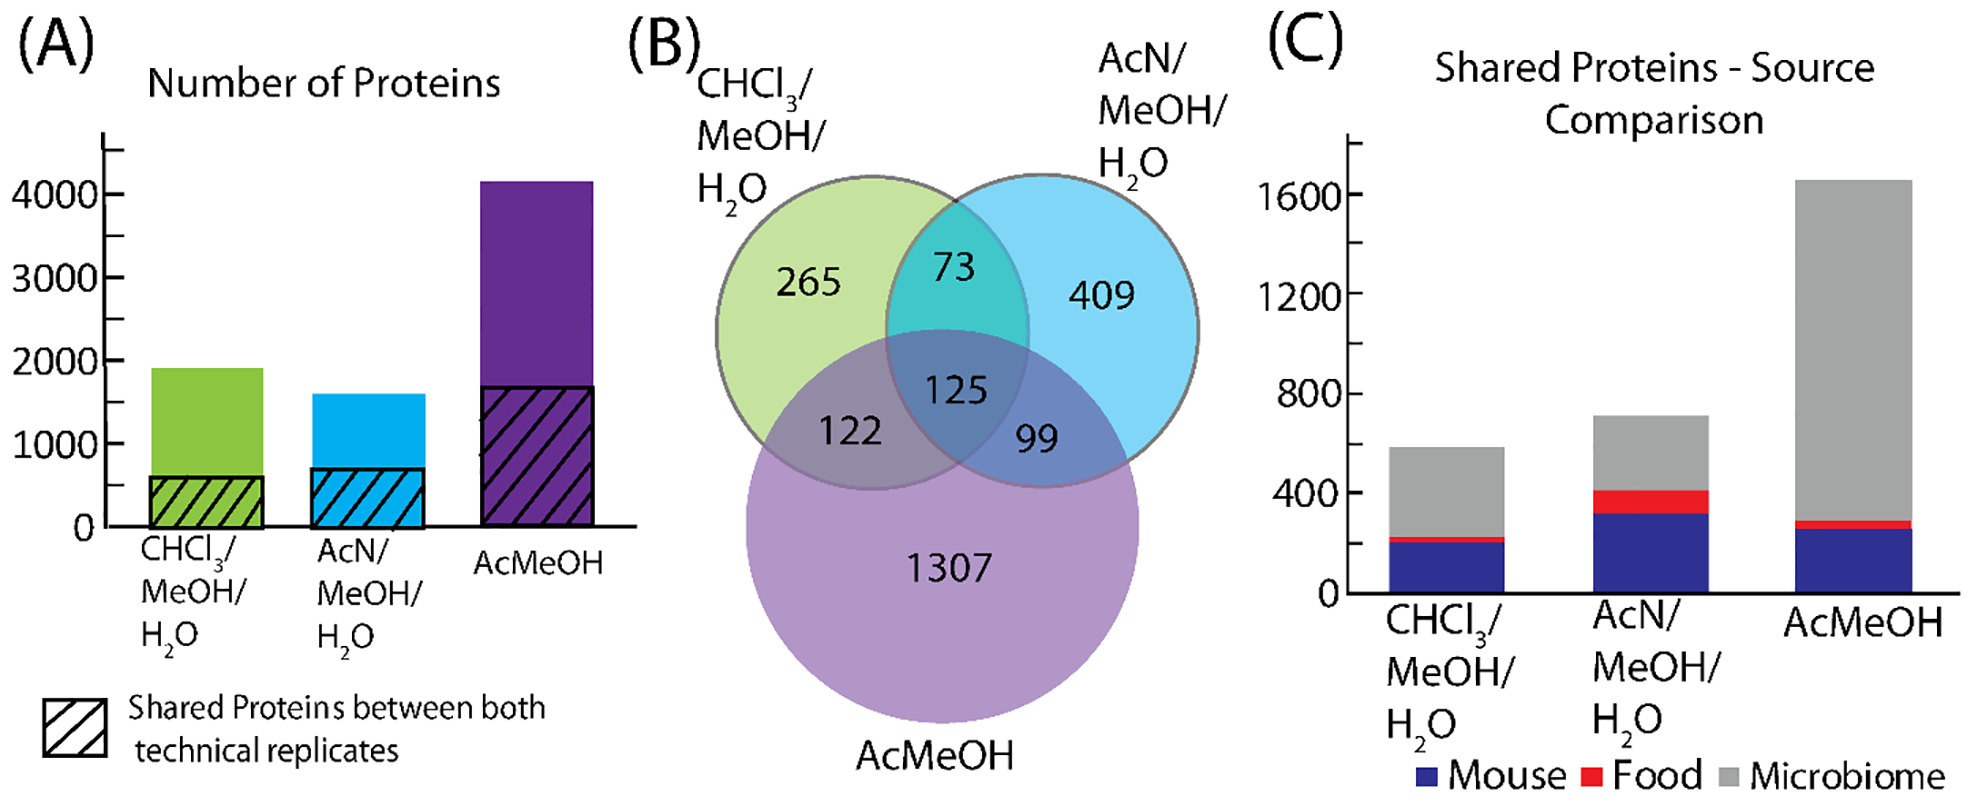
Proteomics results from extraction optimization. (A) shows the detected proteins with the diagonal lines representing the number of shared proteins in both technical replicates. (B) compares the shared proteins in both technical replicates for the three extractions. (C) shows the breakdown of the shared proteins to the source of the protein ID for each extraction.
3.4. Combined Metabolomics, Peptidomics, Proteomics
Figure 6 combines the results of the three different omics by total identifications and by a source comparison for the combined peptide and protein results. The total identifications were calculated with the total number of hits to the METLIN database from the positive mode LC-MS data for the metabolomics analysis, the identified proteins from the peptidomics study shared between both technical replicates and, the protein number from the proteomics study shared between both technical replicates. When all three omics are combined, the methanol/chloroform/water and the acidified methanol extractions have similar number of total identifications. When the peptide and protein results are combined, and the source of the protein identification investigated, the methanol/chloroform/water, and methanol/acetonitrile/water extractions have similar numbers of mouse proteins. However, the acidified methanol extraction still has the most identifications due to the large number of microbial protein identifications. For microbiome studies focusing on the host response, the methanol/chloroform/water performs well for metabolomics, peptidomics, and proteomics, but if microbial proteins are desired, the acidified methanol extraction preforms best.
Figure 6.
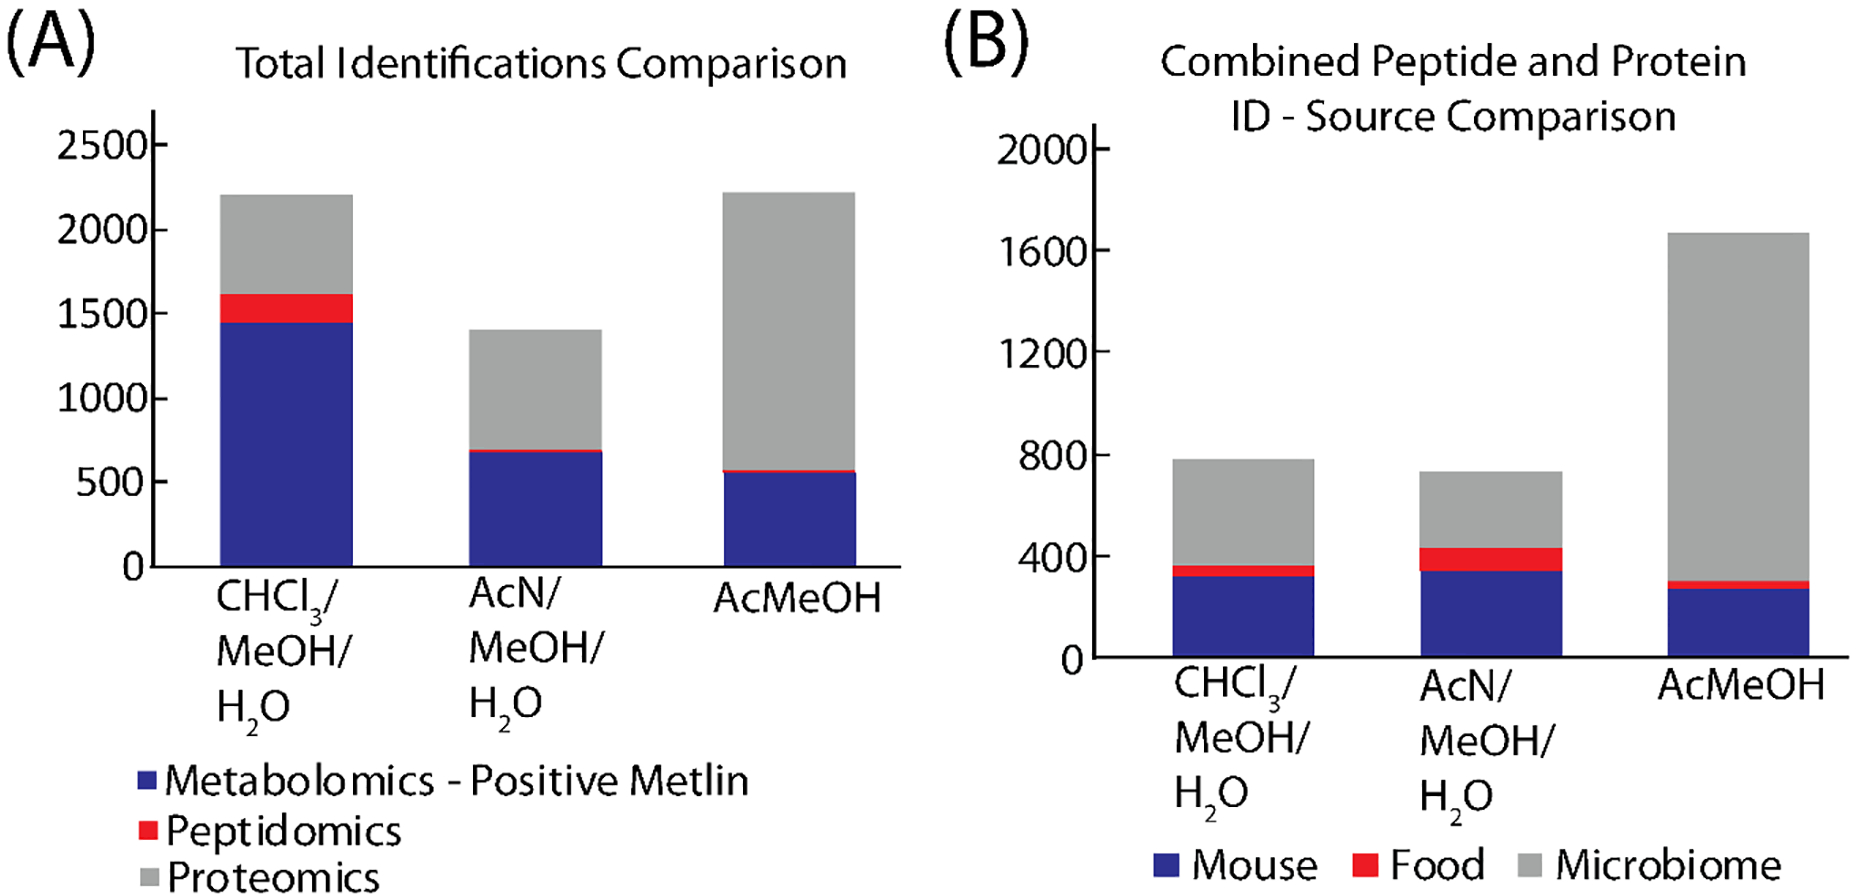
Combined results of the three omics analysis. (A) shows the combined identifications of metabolomics, peptidomics, and proteomics results. (B) compares the protein source for the combined peptide and protein results.
4. Discussion and Conclusions
In order to get a good representation of metabolites, peptides, and proteins, the methanol/chloroform/water extraction was chosen for further investigation into the compounds detected. For metabolomics identification, the mzCloud and MassBank small molecule MS/MS databases were used for spectral matching of fragment ions. Potential matches to either database were manually inspected for verification. Figure S1 compares the total small molecule putative identifications in the methanol/chloroform/water extraction with the two MS/MS databases with both databases in positive and negative modes, as well as comparing the overlap between the positive and negative putative identifications. Supplemental Table S1 provides all the small molecule identifications for the methanol/chloroform/water extraction with their molecular weight, retention time, and from which database and polarity they were identified. In positive mode, both databases provided a similar number of identifications and resulted in complementary coverage for a total of 57 identifications. In negative mode, almost all the results came from the MSDial database. Overall, the positive and negative mode identification results showed complementary coverage as many identifications were made only in one of the polarities. To verify putatively identified compounds, standards could be obtained, and retention times and fragmentation patterns compared to the experimental data. More identifications are potentially possible using other databases (i.e., METLIN) or using in silico fragmentation software. However, these were not utilized here due to the time involved in metabolomics identification and the lack of a biological experiment that would show upregulation or downregulation of certain m/z in a biological condition.
The identifications for the peptidomics results for the methanol/chloroform/water extraction are in Supplemental Table S2 (aqueous fraction) and Supplemental Table S3 (organic fraction), and the proteomics results for the methanol/chloroform/water extraction are provided in Supplemental Table S4. Gene Ontology analysis was conducted on the protein and peptide results from the methanol/chloroform/water extraction using DAVID Bioinformatics Resources 6.8.41,42 The gene ontology results of the biological processes for the detected peptides and proteins are shown in Figure 7. The top biological process for both the protein and peptide results was proteolysis. Other shared biological process include digestion, chromatin silencing, regulation of systemic arterial blood pressure by renin-angiotensin, and metabolic process. Overall, the many shared biological processes in the protein and peptide gene ontology results indicate that the protein and peptide results agree well with each other. By integrating the peptide results with the protein results, a more comprehensive understanding of the biological processes can be achieved for a biological question of interest.
Figure 7.
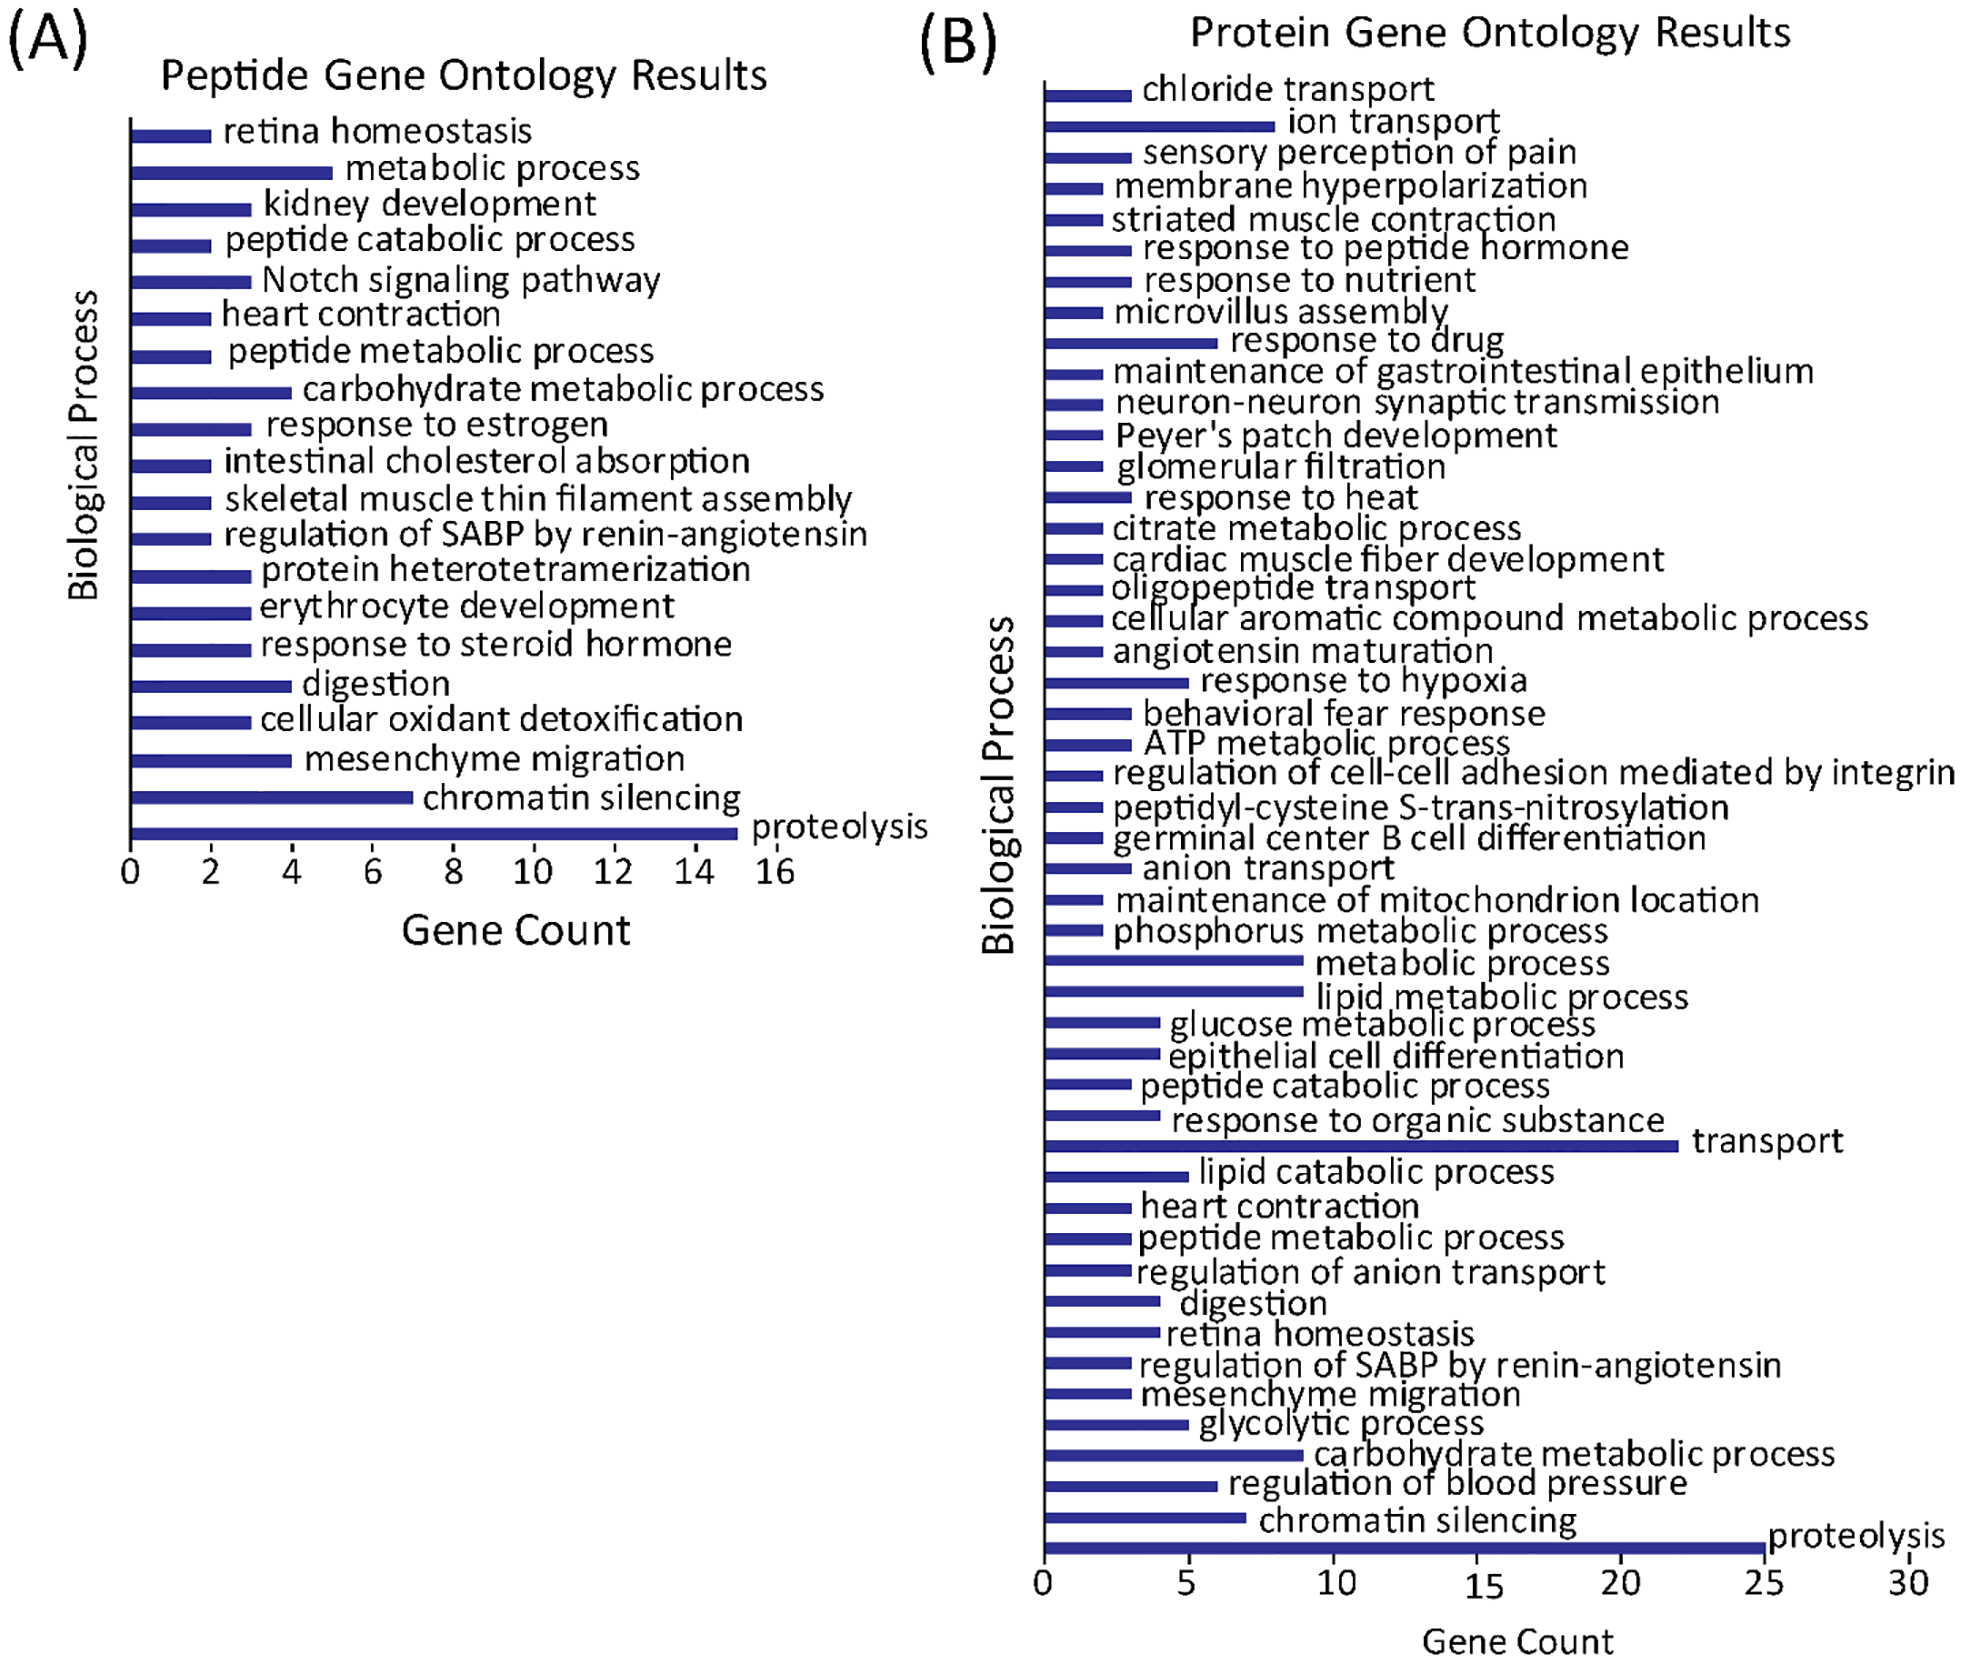
DAVID gene ontology results showing the biological processes associated with detected peptide (A) and protein (B). SABP stands for systemic arterial blood pressure.
To look further at the peptidomics results, the peptides belonging to the biological process of digestion, a key function of the digestive track that the cecum is a part of, were investigated. Table 1 shows the peptides that fell under the biological process of digestion. Peptide sequences from the enzymes chymotrypsinogen B1(Ctrb1), serine protease, and trypsin were detected. Further analysis would be necessary to discover the potential role that these peptides play. Furthermore, an in silico study reported the potential for endogenous proteins in the gut to be digested into bioactive peptides.43 Experimentally, peptides were observed from three proteins, Mucin-13, Chymotrypsinogen B, and pancreatic triacylglycerol lipase, that have predicted potential for bioactive peptide release after intestinal digestion of the gut endogenous protein. The predicted activity for peptides from these three proteins is ACE inhibition, which can prevent hypertension.33
Table 1.
Peptide sequences from the digestion biological process in the peptide gene ontology results.
| Identification Name | Uniptrot ID | Sequence | Mass (Da) |
|---|---|---|---|
| chymotrypsinogen B1(Ctrb1) | Q9CR35 | A.GEFDQGSDEENVQVLK.I | 1792.8115 |
| chymotrypsinogen B1(Ctrb1) | Q9CR35 | K.IAQVFKNPK.F | 1043.6127 |
| protease, serine 2(Prss2) | P07146 | I.NVLEGNEQFVDSAK.I | 1548.7419 |
| trypsin 4(Try4)/trypsin 5(Try5) | Q9R0T7/Q9QUK9 | R.TLNNDIM(+15.99)LIK.L | 1189.6377 |
Multiomic analysis can provide a greater understanding by studying not just the one subclass of molecules, protein changes, for example, but also changes in the metagenomic, or metabolome in order to better understand the relationships between various biological systems. Here, the ability of three extractions for combined metabolomics, peptidomics, and proteomics analysis was compared. The methanol/chloroform/water extraction method enabled a more comprehensive view of all three omics in the mouse host system and performed particularly strong in metabolomics and peptidomics analysis. By including peptidomics in the multiomics experiments, a deeper understanding of the role of peptides could be obtained, for example, by characterization and discovery of bioactive peptides and their role in various pathways. In the future, studies investigating the metabolomics, peptidomics, and proteomics content of the colon, ilium, and rectum would provide further information about the proteins expressed by the gut microbiota and would lead to interesting comparisons of the metabolites, peptides, and proteins expressed in different areas of the gastrointestinal tract.
Supplementary Material
Acknowledgements
This study was supported in part by grant funding from the NIH (R01DK071801, RF1AG052324, to LL) and a grant from a Transatlantic Networks of Excellence Award from the Leducq Foundation (to FER). The Orbitrap instruments were purchased through the support of an NIH shared instrument grant (NIH-NCRR S10RR029531 to LL) and Office of the Vice Chancellor for Research and Graduate Education at the University of Wisconsin-Madison. T.-W. L. C. is supported by the National Institutes of Health, under Ruth L. Kirschstein National Research Service Award T32 HL 007936 from the National Heart Lung and Blood Institute to the University of Wisconsin-Madison Cardiovascular Research Center. LL acknowledges a Vilas Distinguished Achievement Professorship and Charles Melbourne Johnson Distinguished Chair Professorship with funding provided by the Wisconsin Alumni Research Foundation and University of Wisconsin-Madison School of Pharmacy.
Footnotes
Conflict of Interest
The authors have no conflict of interests to declare.
References
- [1].Sender R, Fuchs S, Milo R. Revised Estimates for the Number of Human and Bacteria Cells in the Body. PLoS Biol 2016, 14 (8), e1002533. [DOI] [PMC free article] [PubMed] [Google Scholar]
- [2].Scanlan PD, Marchesi JR. Micro-eukaryotic diversity of the human distal gut microbiota: qualitative assessment using culture-dependent and -independent analysis of faeces. Isme j 2008, 2 (12), 1183–93. [DOI] [PubMed] [Google Scholar]
- [3].Hoffmann C, Dollive S, Grunberg S, Chen J, Li H, Wu GD, Lewis JD, Bushman FD. Archaea and fungi of the human gut microbiome: correlations with diet and bacterial residents. PLoS One 2013, 8 (6), e66019. [DOI] [PMC free article] [PubMed] [Google Scholar]
- [4].Sharon G, Garg N, Debelius J, Knight R, Dorrestein PC, Mazmanian SK. Specialized metabolites from the microbiome in health and disease. Cell Metab 2014, 20 (5), 719–730. [DOI] [PMC free article] [PubMed] [Google Scholar]
- [5].Kau AL, Ahern PP, Griffin NW, Goodman AL, Gordon JI. Human nutrition, the gut microbiome and the immune system. Nature 2011, 474 (7351), 327–336. [DOI] [PMC free article] [PubMed] [Google Scholar]
- [6].Kostic AD, Xavier RJ, Gevers D. The microbiome in inflammatory bowel disease: current status and the future ahead. Gastroenterology 2014, 146 (6), 1489–1499. [DOI] [PMC free article] [PubMed] [Google Scholar]
- [7].Turnbaugh PJ, Backhed F, Fulton L, Gordon JI. Diet-induced obesity is linked to marked but reversible alterations in the mouse distal gut microbiome. Cell Host Microbe 2008, 3 (4), 213–23. [DOI] [PMC free article] [PubMed] [Google Scholar]
- [8].Rosenbaum M, Knight R, Leibel RL. The gut microbiota in human energy homeostasis and obesity. Trends Endocrinol Metab 2015, 26 (9), 493–501. [DOI] [PMC free article] [PubMed] [Google Scholar]
- [9].Jie Z, Xia H, Zhong SL, Feng Q, Li S, Liang S, Zhong H, Liu Z, Gao Y, Zhao H, Zhang D, Su Z, Fang Z, Lan Z, Li J, Xiao L, Li R, Li X, Li F, Ren H, et al. The gut microbiome in atherosclerotic cardiovascular disease. Nat Commun 2017, 8 (1), 845. [DOI] [PMC free article] [PubMed] [Google Scholar]
- [10].Tang WH, Kitai T, Hazen SL. Gut Microbiota in Cardiovascular Health and Disease. Circ Res 2017, 120 (7), 1183–1196. [DOI] [PMC free article] [PubMed] [Google Scholar]
- [11].Turnbaugh PJ, Hamady M, Yatsunenko T, Cantarel BL, Duncan A, Ley RE, Sogin ML, Jones WJ, Roe BA, Affourtit JP, Egholm M, Henrissat B, Heath AC, Knight R, Gordon JI. A core gut microbiome in obese and lean twins. Nature 2009, 457 (7228), 480–U7. [DOI] [PMC free article] [PubMed] [Google Scholar]
- [12].Verberkmoes NC, Russell AL, Shah M, Godzik A, Rosenquist M, Halfvarson J, Lefsrud MG, Apajalahti J, Tysk C, Hettich RL, K Jansson J. Shotgun metaproteomics of the human distal gut microbiota. Isme Journal 2009, 3 (2), 179–189. [DOI] [PubMed] [Google Scholar]
- [13].Wikoff WR, Anfora AT, Liu J, Schultz PG, Lesley SA, Peters EC, Siuzdak G. Metabolomics analysis reveals large effects of gut microflora on mammalian blood metabolites. Proceedings of the National Academy of Sciences of the United States of America 2009, 106 (10), 3698–3703. [DOI] [PMC free article] [PubMed] [Google Scholar]
- [14].Vogt NM, Romano KA, Darst BF, Engelman CD, C Johnson S, Carlsson CM, Asthana S, Blennow K, Zetterberg H, Bendlin BB, E Rey F. The gut microbiota-derived metabolite trimethylamine N-oxide is elevated in Alzheimer’s disease. Alzheimer’s Research & Therapy 2018, 10 (1), 124. [DOI] [PMC free article] [PubMed] [Google Scholar]
- [15].Roume H, Muller EE, Cordes T, Renaut J, Hiller K, Wilmes P. A biomolecular isolation framework for eco-systems biology. Isme j 2013, 7 (1), 110–21. [DOI] [PMC free article] [PubMed] [Google Scholar]
- [16].Wettersten HI, Hakimi AA, Morin D, Bianchi C, Johnstone M, Donohoe DR, Trott JF, Abu Aboud O, Stirdivant S, Neri B, Wolfert R, Stewart B, Perego R, Hsieh JJ, Weiss RH. Grade-Dependent Metabolic Reprogramming in Kidney Cancer Revealed by Combined Proteomics and Metabolomics Analysis. Cancer Research 2015, 75 (12), 2541–2552. [DOI] [PMC free article] [PubMed] [Google Scholar]
- [17].Weckwerth W, Wenzel K, Fiehn O. Process for the integrated extraction, identification and quantification of metabolites, proteins and RNA to reveal their co-regulation in biochemical networks. Proteomics 2004, 4 (1), 78–83. [DOI] [PubMed] [Google Scholar]
- [18].Mostafa I, Zhu N, Yoo MJ, Balmant KM, Misra BB, Dufresne C, Abou-Hashem M, Chen S, El-Domiaty M. New nodes and edges in the glucosinolate molecular network revealed by proteomics and metabolomics of Arabidopsis myb28/29 and cyp79B2/B3 glucosinolate mutants. J Proteomics 2016, 138, 1–19. [DOI] [PubMed] [Google Scholar]
- [19].Bratburd JR, Keller C, Vivas E, Gemperline E, Li L, Rey FE, Currie CR. Gut Microbial and Metabolic Responses to Salmonella enterica Serovar Typhimurium and Candida albicans. MBio 2018, 9 (6). [DOI] [PMC free article] [PubMed] [Google Scholar]
- [20].Lu K, Abo RP, Schlieper KA, Graffam ME, Levine S, Wishnok JS, Swenberg JA, Tannenbaum SR, Fox JG. Arsenic exposure perturbs the gut microbiome and its metabolic profile in mice: an integrated metagenomics and metabolomics analysis. Environ Health Perspect 2014, 122 (3), 284–91. [DOI] [PMC free article] [PubMed] [Google Scholar]
- [21].Zhang Y, Zhao F, Deng Y, Zhao Y, Ren H. Metagenomic and metabolomic analysis of the toxic effects of trichloroacetamide-induced gut microbiome and urine metabolome perturbations in mice. J Proteome Res 2015, 14 (4), 1752–61. [DOI] [PubMed] [Google Scholar]
- [22].Kaiser BLD, Li J, Sanford JA, Kim YM, Kronewitter SR, Jones MB, Peterson CT, Peterson SN, Frank BC, Purvine SO, Brown JN, Metz TO, Smith RD, Heffron F, Adkins JN. A Multi-Omic View of Host-Pathogen-Commensal Interplay in Salmonella-Mediated Intestinal Infection. Plos One 2013, 8 (6), 13. [DOI] [PMC free article] [PubMed] [Google Scholar]
- [23].Fan J, Saha S, Barker G, Heesom KJ, Ghali F, Jones AR, Matthews DA, Bessant C. Galaxy Integrated Omics: Web-based Standards-Compliant Workflows for Proteomics Informed by Transcriptomics. Mol Cell Proteomics 2015, 14 (11), 3087–93. [DOI] [PMC free article] [PubMed] [Google Scholar]
- [24].Caspi R, Billington R, Fulcher CA, Keseler IM, Kothari A, Krummenacker M, Latendresse M, Midford PE, Ong Q, Ong WK, Paley S, Subhraveti P, Karp PD. The MetaCyc database of metabolic pathways and enzymes. Nucleic Acids Res 2018, 46 (D1), D633–d639. [DOI] [PMC free article] [PubMed] [Google Scholar]
- [25].Clynen E, Baggerman G, Veelaert D, Cerstiaens A, Van der Horst D, Harthoorn L, Derua R, Waelkens E, De Loof A, Schoofs L. Peptidomics of the pars intercerebralis-corpus cardiacum complex of the migratory locust, Locusta migratoria. Eur J Biochem 2001, 268 (7), 1929–39. [DOI] [PubMed] [Google Scholar]
- [26].Verhaert P, Uttenweiler-Joseph S, de Vries M, Loboda A, Ens W, Standing KG. Matrix-assisted laser desorption/ionization quadrupole time-of-flight mass spectrometry: an elegant tool for peptidomics. Proteomics 2001, 1 (1), 118–31. [DOI] [PubMed] [Google Scholar]
- [27].An S, Harang R, Meeker K, Granados-Fuentes D, Tsai CA, Mazuski C, Kim J, Doyle FJ 3rd, Petzold LR, Herzog ED. A neuropeptide speeds circadian entrainment by reducing intercellular synchrony. Proc Natl Acad Sci U S A 2013, 110 (46), E4355–61. [DOI] [PMC free article] [PubMed] [Google Scholar]
- [28].Schank JR, Ryabinin AE, Giardino WJ, Ciccocioppo R, Heilig M. Stress-related neuropeptides and addictive behaviors: beyond the usual suspects. Neuron 2012, 76 (1), 192–208. [DOI] [PMC free article] [PubMed] [Google Scholar]
- [29].Yu Q, Canales A, Glover MS, Das R, Shi X, Liu Y, Keller MP, Attie AD, Li L. Targeted Mass Spectrometry Approach Enabled Discovery of O-Glycosylated Insulin and Related Signaling Peptides in Mouse and Human Pancreatic Islets. Anal Chem 2017, 89 (17), 9184–9191. [DOI] [PMC free article] [PubMed] [Google Scholar]
- [30].Barreto SG, Carati CJ, Toouli J, Saccone GT. The islet-acinar axis of the pancreas: more than just insulin. Am J Physiol Gastrointest Liver Physiol 2010, 299 (1), G10–22. [DOI] [PubMed] [Google Scholar]
- [31].Moller NP, Scholz-Ahrens KE, Roos N, Schrezenmeir J. Bioactive peptides and proteins from foods: indication for health effects. Eur J Nutr 2008, 47 (4), 171–82. [DOI] [PubMed] [Google Scholar]
- [32].Yamamoto N, Akino A, Takano T. Antihypertensive effect of the peptides derived from casein by an extracellular proteinase from Lactobacillus helveticus CP790. J Dairy Sci 1994, 77 (4), 917–22. [DOI] [PubMed] [Google Scholar]
- [33].Dave LA, Hayes M, Montoya CA, Rutherfurd SM, Moughan PJ. Human gut endogenous proteins as a potential source of angiotensin-I-converting enzyme (ACE-I)-, renin inhibitory and antioxidant peptides. Peptides 2016, 76, 30–44. [DOI] [PubMed] [Google Scholar]
- [34].Sapcariu SC, Kanashova T, Weindl D, Ghelfi J, Dittmar G, Hiller K. Simultaneous extraction of proteins and metabolites from cells in culture. MethodsX 2014, 1, 74–80. [DOI] [PMC free article] [PubMed] [Google Scholar]
- [35].Ye H, Wang J, Tian Z, Ma F, Dowell J, Bremer Q, Lu G, Baldo B, Li L. Quantitative Mass Spectrometry Reveals Food Intake-Induced Neuropeptide Level Changes in Rat Brain: Functional Assessment of Selected Neuropeptides as Feeding Regulators. Mol Cell Proteomics 2017, 16 (11), 1922–1937. [DOI] [PMC free article] [PubMed] [Google Scholar]
- [36].Cao QJW, Ouyang CZ, Zhong XF, Li L.. Profiling of small molecule metabolites and neurotransmitters in crustacean hemolymph and neuronal tissues using reversed-phase LC-MS/MS. Electrophoresis 2018, 39 (9–10), 1241–1248. [DOI] [PMC free article] [PubMed] [Google Scholar]
- [37].Rabinowitz JD, Kimball E. Acidic acetonitrile for cellular metabolome extraction from Escherichia coli. Anal Chem 2007, 79 (16), 6167–73. [DOI] [PubMed] [Google Scholar]
- [38].Bazurto JV, Dearth SP, Tague ED, Campagna SR, Downs DM. Untargeted metabolomics confirms and extends the understanding of the impact of aminoimidazole carboxamide ribotide (AICAR) in the metabolic network of Salmonella enterica. Microb Cell 2017, 5 (2), 74–87. [DOI] [PMC free article] [PubMed] [Google Scholar]
- [39].Zhang X, Ning Z, Mayne J, Moore JI, Li J, Butcher J, Deeke SA, Chen R, Chiang CK, Wen M, Mack D, Stintzi A, Figeys D. MetaPro-IQ: a universal metaproteomic approach to studying human and mouse gut microbiota. Microbiome 2016, 4 (1), 31. [DOI] [PMC free article] [PubMed] [Google Scholar]
- [40].Xiao L, Feng Q, Liang S, Sonne SB, Xia Z, Qiu X, Li X, Long H, Zhang J, Zhang D, Liu C, Fang Z, Chou J, Glanville J, Hao Q, Kotowska D, Colding C, Licht TR, Wu D, Yu J, et al. A catalog of the mouse gut metagenome. Nat Biotechnol 2015, 33 (10), 1103–8. [DOI] [PubMed] [Google Scholar]
- [41].Huang da W, Sherman BT, Lempicki RA. Bioinformatics enrichment tools: paths toward the comprehensive functional analysis of large gene lists. Nucleic Acids Res 2009, 37 (1), 1–13. [DOI] [PMC free article] [PubMed] [Google Scholar]
- [42].Huang da W, Sherman BT, Lempicki RA. Systematic and integrative analysis of large gene lists using DAVID bioinformatics resources. Nat Protoc 2009, 4 (1), 44–57. [DOI] [PubMed] [Google Scholar]
- [43].Dave LA, Montoya CA, Rutherfurd SM, Moughan PJ. Gastrointestinal endogenous proteins as a source of bioactive peptides--an in silico study. PLoS One 2014, 9 (6), e98922. [DOI] [PMC free article] [PubMed] [Google Scholar]
Associated Data
This section collects any data citations, data availability statements, or supplementary materials included in this article.


