

Abstract
Objectives:
To develop and validate clinical risk prediction tools for neonatal abstinence syndrome (NAS).
Study design:
We developed prediction models for NAS based on a set of 30 demographic and antenatal exposure covariates collected during pregnancy. Data (outpatient prescription, vital, and administrative records), were obtained from enrollees in the Tennessee Medicaid Program from 2009 to 2014. Models were created using logistic regression and backwards selection based on improvement in the Akaike information criterion, and internally validated using bootstrap cross-validation.
Results:
A total of 218,020 maternal and infant dyads met inclusion criteria, of whom 3,208 infants were diagnosed with NAS. The general population model included age, hepatitis C virus infection, days of opioid used by type, number of cigarettes used daily and the following medications used in the last 30 day of pregnancy: bupropion, anti-nausea medicines, benzodiazepines, anti-psychotics, and gabapentin. Infant characteristics included birthweight, small for gestational age and infant sex. A high-risk model used a smaller number of predictive variables. Both models discriminated well with a AUC of 0.89 and were well-calibrated for low-risk infants.
Conclusions:
We developed two predictive models for NAS based on demographics and antenatal exposure during the last 30 days of pregnancy that were able to risk stratify infants at risk of developing the syndrome.
As the opioid crisis spread through the United States, increasing numbers of pregnant women1 and infants2 were affected. Over the last two decades, the number of mothers diagnosed with opioid use disorder grew fourfold1 and the rate of newborns being diagnosed with opioid withdrawal, also known as neonatal abstinence syndrome (NAS), grew nearly sevenfold.2-4 By 2014, one infant was diagnosed with the syndrome every 15 minutes on average nationwide, eclipsing $500 million in hospital costs.2
Data suggest that the majority of opioid-exposed infants do not exhibit clinical signs severe enough to be diagnosed with NAS.5 In part, because of the limitations of current tools to estimate NAS risk, the American Academy of Pediatrics recommends standard observation periods for all opioid-exposed infants based upon the type of opioid exposure of 3 to 7 days after birth6, far longer than usual observation periods for uncomplicated term infants.4 For opioid-exposed infants that do not develop NAS, these recommended observation periods may lead to excessive hospital stays and cost with marginal benefit. In contrast, inability to identify infants at high risk of NAS at the time of birth may result in delays in treatment. Although previous studies have identified infant characteristics and maternal substance use patterns that may modify an infant’s risk of developing NAS,5,7,8 no tools have been created to apply this research to guide clinical practice. Our objective was to develop and validate parsimonious clinical risk prediction tools for NAS among a large population of infants exposed to medically prescribed opioids.
Methods
This retrospective study used data from maternal infant dyads enrolled in TennCare, the Tennessee Medicaid Program, using outpatient prescription claims linked to vital records and hospital and outpatient administrative data from 2009 to 2014. Because Medicaid is financially responsible for more than 80% of infants diagnosed with NAS,2,9 it is an ideal program to study the syndrome. This study was approved with a waiver of informed consent by the Vanderbilt University Institutional Review Board, the State of Tennessee Department of Health, and the Bureau of TennCare.
Similar to our previous work,5 maternal and infant dyads were included in the study if the mother was15 to 44 years old at the time of delivery, enrolled in TennCare at least 30 days prior to delivery, and infants were enrolled in TennCare within 30 days after delivery. Last menstrual period and date of delivery were obtained from vital records.10 Pregnancies were included if the birth occurred between January 1, 2009 and December 31, 2014.
Our outcome of interest was NAS, as defined by the International Classification of Diseases 9th Revision Clinical Modification (ICD-9-CM) code 779.5. We previously established the accuracy of the diagnostic code for NAS, through a review of 950 medical records of NAS with a standardized algorithm and determined the positive predictive value of the code to be >90%.11 Infants did not require pharmacotherapy for NAS to be included as having a diagnosis of NAS.
Model predictors were chosen a priori based upon the existing literature, clinical practice and common medications used in pregnancy. For clinical relevance and to facilitate ease of use, we focused on medication use within the last 30 days of pregnancy and characteristics that would be readily available to clinicians at the time of birth.
Prescription claims were obtained from TennCare outpatient pharmacy records of prescriptions filled within the last 30 days of pregnancy. These claims contain information for all outpatient prescriptions that are reimbursed by the program. Opioid drug types were categorized as immediate-release (e.g. hydrocodone-acetaminophen, oxycodone hydrochloride), sustained-release (eg, oxycodone hydrochloride controlled-release, oxymorphone hydrochloride extended-release) and medications for opioid use disorder (MOUD) (e.g. buprenorphine hydrochloride). Because TennCare did not reimburse for care at Opioid Treatment Programs during our study period, 99% of MOUD pregnant women using MOUD were prescribed buprenorphine-containing products. Naltrexone was not included as a MOUD. Opioid doses were converted to morphine milligram equivalents (MME) using established conversion guidelines to facilitate meaningful comparisons.12 Duration of opioid use was defined as the period between the prescription start date and the end of the days of supply (allowing up to a five-day carryover period from previous prescriptions). In addition, data were obtained for benzodiazepines, atypical antipsychotics, typical antipsychotics, antidepressants, acid reflux and nausea medications, zolpidem and gabapentin (Table IV; available at www.jpeds.com). To facilitate ease of clinical use, medications were grouped into classes for analyses.
Table 4 (online only).
Included Benzodiazepines, Atypical Antipsychotics and Typical Antipsychotics.
| Benzodiazepines | alprazolam, bromazepam, chlordiazepoxide hydrochloride, clonazepam, clorazepate dipotassium, diazepam, estazolam, flurazepam, halazepam, lorazepam, midazolam hydrochloride, oxazepam, prazepam, quazepam, temazepam, triazolam |
| Atypical antipsychotics | aripiprazole, asenapine, clozapine, fluoxetine-olanzapine, iloperidone, lurasidone, olanzapine, paliperidone, quetiapine, risperidone-inj, risperidone-oral, ziprasidone |
| Antipsychotics | carphenazine, chlorpromazine hydrochloride, chlorprothixene, droperidol, fluphenazine decanoate, fluphenazine enanthate, fluphenazine hydrochloride, haloperidol, haloperidol decanoate, loxapine succinate, mesoridazine besylate, molindone hydrochloride, perphenazine, pimozide, piperacetazine, thioridazine, thiothixene hydrochloride, trifluoperazine hydrochloride, triflupromazine hydrochloride |
| Antidepressants | fluoxetine, sertraline, citalopram, bupropion |
| Medications for acid reflux and nausea | metoclopramide, ranitidine, promethazine |
Additional maternal and infant characteristics were obtained from administrative and vital records data. Cigarette use was obtained from birth certificates and using the ICD-9-CM codes 305.1, V15.82, 989.84, 649.0x; number of cigarettes smoked per day was obtained from the birth certificate. Infant birth weight, gestational age and sex were obtained from the birth certificate. Maternal age and hepatitis C virus (HCV) status was used as a proxy for injection drug use and obtained from the birth certificate, augmented by ICD-9-CM codes 070.41, 070.44, 070.51, 070.54, 070.7x. Small for gestational age (SGA) was calculated using a previously published algorithm.13
Statistical Analyses
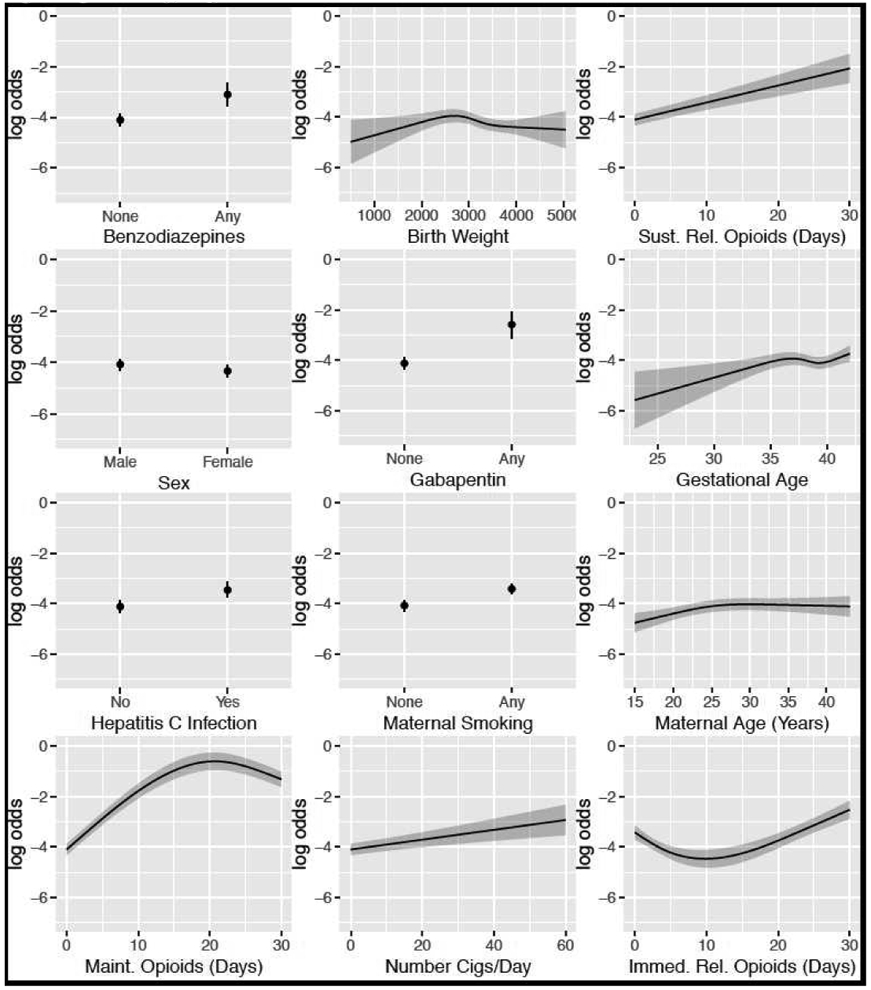
Multivariable logistic regression was used to develop a model for predicting NAS status using the approach outlined in the text by Harrell.14 We were concerned with creating a robust prediction model that could readily be applied to other populations while mitigating overfitting. To that end, continuous predictors were flexibly modeled using restricted cubic splines15 and categorical variables modeled using indicator functions. Partial effects plots were used to display the adjusted association of each predictor with the odds of NAS (Figure 4 and Figure 5; available at www.jpeds.com).
Figure 4 (online only).

General Population Model Partial Effects Plots.
Figure 5 (online only).
High-Risk Model Partial Effect Plots.
Two models were created: 1) using all subjects meeting cohort inclusion criteria (hereafter “general population model”) and 2) a subset of subjects with hepatitis C virus infection or opioid exposure in the last 30 days (hereafter “high-risk model”), based on prior work identifying these two factors as likely to be associated with greater risk for NAS.5,16 We pre-specified a full model that included main effects for all potential predictors as well as two-way interactions for maternal smoking by opioid exposure and gabapentin use by opioid exposure. We used backwards selection to remove covariates that resulted in an improvement in the Akaike information criterion (AIC) and arrived at a final, parsimonious model. Predictors requiring multiple degrees of freedom were removed as a group. Bootstrapping was used for both the model selection process and cross-validation (a double bootstrap) to obtain unbiased estimates of prediction fit statistics (e.g., AUC). Additionally, we considered different penalty functions to allow for shrinkage estimation of regression coefficients but saw no improvement in fit so report results with no penalty/no shrinkage. This process, selecting covariates a priori, double bootstrapping with different penalty functions to validate the predictive accuracy of the proposed model, reapplying the backwards selection process with the validation and calibration statistics estimated at multiple iterations, exploring different penalty functions to allow for shrinkage estimation of the regression coefficients, mitigates common problems with a traditional backwards selection approach. The final prediction models were evaluated for their ability to discriminate subjects with low- and high-risk for NAS. Calibration plots of the observed versus predicted probability plot were used to internally validate the accuracy of predictions. Because the incidence of NAS increased over time in Tennessee much like rest of the US, we evaluated the interaction of time*covariates but this did not change model performance and was not included. Lastly, we created predicted probabilities using the high-risk model to demonstrate how common clinical scenarios influence an infant’s risk of NAS. Caution should be taken when interpreting predicted probabilities that are high as this model is not well-calibrated at the high-end of risk. All analyses were conducted using the R statistical program utilizing the "rms" package for developing and validating multivariable prediction models.17
Results
Between 2009 and 2014, a total of 218,020 maternal and infant dyads met inclusion criteria, of whom 3,208 were diagnosed with NAS. Infants diagnosed with NAS had lower median birthweights (3,204g vs. 2,968g), were more likely to be small for gestational age (34% vs. 18%) and more likely to be female (44% vs. 49%). Mothers of infants with NAS were older (26 vs. 23 years), were more likely to have evidence of HCV infection (15% vs. 1%), had higher days use of MOUD compared with immediate release opioids, smoked more median numbers of daily cigarettes (8 vs. 0), and were more likely to use benzodiazepines (2% vs. 0%), antipsychotics (2% vs. 0%), SSRIs (7% vs. 2%) and bupropion (2% vs. 0%, all comparisons <0.01; Table 1). Relationships were similar among the high-risk cohort (i.e. restricted to opioid and HCV-exposed infants) (Table 2). Variable relationships were evaluated, including collinearity (Figure 3; available at www.jpeds.com).
Table 1.
General Population Model: Maternal and Infant Characteristics Associated with Neonatal Abstinence Syndrome.
| No Diagnosis of Neonatal Abstinence Syndrome |
Neonatal Abstinence Syndrome | p-value | |
|---|---|---|---|
| N=214812 | N=3208 | ||
| Infant Characteristics | |||
| Birthweight (g), Median (IQR) | 3204 (2870-3535) | 2968 (2620-3289) | <0.001 |
| Gestational Age (weeks), Median (IQR) | 39 (38-40) | 39 (38-40) | <0.001 |
| Small for Gestational Age, % (N) | 18 (38711) | 34 (1078) | <0.001 |
| Female, % (N) | 49 (104908) | 44 (1425) | <0.001 |
| Maternal Characteristics | |||
| Maternal Age, Median (IQR) | 23 (20-27) | 26 (23-29) | <0.001 |
| Hepatitis C Virus Positive, % (N) | 1 (1410) | 15 (480) | <0.001 |
| Medication Exposures in Last 30 Days of Pregnancy | |||
| Immediate-Release Opioid (days), Median (IQR) | 0 (0-0) | 0 (0-0) | <0.001 |
| Sustained-Release Opioid (days), Median (IQR) | 0 (0-0) | 0 (0-0) | <0.001 |
| MOUD (days), Median (IQR) | 0 (0-0) | 0 (0-18) | <0.001 |
| Benzodiazepine, % (N) | 0 (331) | 2 (67) | <0.001 |
| Antipsychotics, % (N) | 0 (739) | 2 (58) | <0.001 |
| SSRI, % (N) | 2 (4338) | 7 (226) | <0.001 |
| Zolpidem, % (N) | 1 (3111) | 2 (76) | <0.001 |
| Bupropion, % (N) | 0 (850) | 2 (57) | <0.001 |
| Reflux and Anti-Nausea, % (N) | 7 (15646) | 15 (481) | <0.001 |
| Number of Cigarettes per Day, Median (IQR) | 0 (0-0) | 8 (0-13) | <0.001 |
IQR = Interquartile range
Medication data are obtained from filled prescriptions
Table 2.
High-Risk Model: Maternal and Infant Characteristics Associated with Neonatal Abstinence Syndrome Among Infants Exposed to Opioids or Hepatitis C.
| No Diagnosis of Neonatal Abstinence Syndrome |
Neonatal Abstinence Syndrome | p-value | |
|---|---|---|---|
| N=14884 | N=1446 | ||
| Infant Characteristics | |||
| Birthweight (g), Median (IQR) | 3119 (2770-3430) | 3005 (2665-3306) | <0.001 |
| Gestational Age (weeks), Median (IQR) | 39 (38-39) | 39 (38-40) | 0.13 |
| Small for Gestational Age, % (N) | 22 (3214) | 32 (457) | <0.001 |
| Female, % (N) | 49 (7306) | 44 (637) | <0.001 |
| Maternal Characteristics | |||
| Maternal Age, Median (IQR) | 25 (21-28) | 26 (23-30) | <0.001 |
| Hepatitis C Virus Positive, % (N) | 2 (295) | 16 (237) | <0.001 |
| Medication Exposures in Last 30 Days of Pregnancy | |||
| Immediate-Release Opioid (days), Median (IQR) | 4 (2-10) | 0 (0-3) | <0.001 |
| Sustained-Release Opioid (days), Median (IQR) | 0 (0-0) | 0 (0-0) | <0.001 |
| MOUD (days), Median (IQR) | 0 (0-0) | 22 (0-30) | <0.001 |
| Benzodiazepine, % (N) | 1 (125) | 4 (55) | <0.001 |
| Antipsychotics, % (N) | 1 (122) | 2 (26) | <0.001 |
| SSRI, % (N) | 5 (705) | 8 (120) | <0.001 |
| Zolpidem, % (N) | 5 (764) | 3 (41) | <0.001 |
| Bupropion, % (N) | 1 (136) | 2 (24) | 0.006 |
| Reflux and Anti-Nausea, % (N) | 26 (3920) | 22 (324) | 0.001 |
| Number of Cigarettes per Day, Median (IQR) | 0 (0-8) | 10 (0-13) | <0.001 |
Figure 3 (online only).

Relationships of Model Predictors.
General Population Model
Model variables for the general population included maternal characteristics, age, HCV status, days of opioid used by type (immediate release, sustained release and MOUD) in the final 30 day of pregnancy, maternal smoking, number of cigarettes used daily, and use of the following medications in the last 30 day of pregnancy: bupropion, anti-nausea medicines, benzodiazepines, anti-psychotics, and gabapentin. Infant characteristics included birthweight, SGA and infant sex (Figure 1, A). The model performed well, with a AUC of 0.89 (Figure 2, A) and was well calibrated for infants with risk of below 40%. However, the full model was less well calibrated at higher risks, consistently underestimating infant risk for this subset of the cohort (Figure 2, B).
Figure 1.

Factors Associated with Neonatal Abstinence Syndrome Risk in the a) General and b) High-Risk Population Models.
Figure 2a.
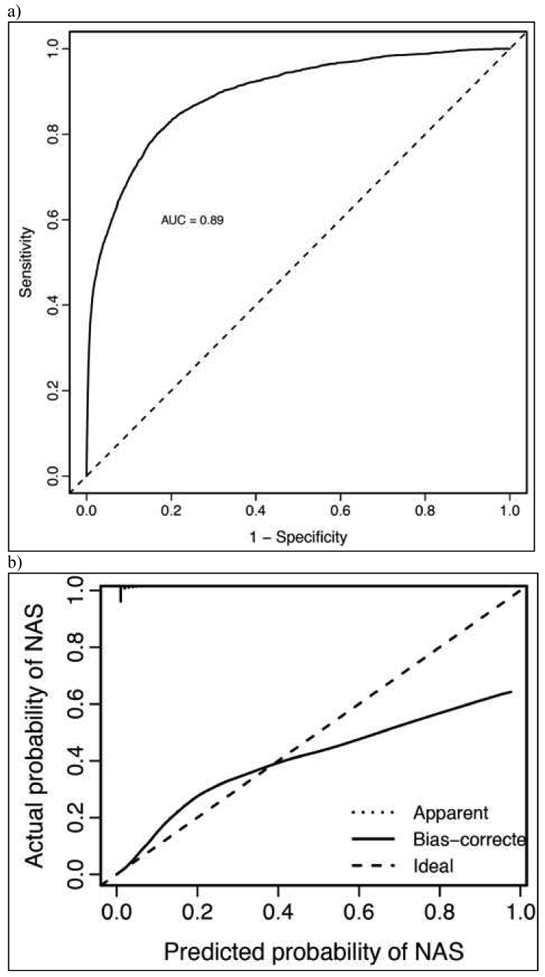
General Population Model Cohort (a) Discrimination and (b) Calibration Characteristics.
Figure 2b.

High-Risk Model (a) Discrimination and (b) Calibration Characteristics.
High-Risk Model
Model variables for the high-risk model included female sex, birthweight, gestational age, maternal age, maternal HCV infection, and the following variables related to maternal medication use in the 30 days prior to delivery: days of opioid use by type (immediate-release opioid, sustained-release opioid, or MOUD opioid), any benzodiazepine, and any gabapentin used (Figure 1, B). The model performed well, with a AUC of 0.89 (Figure 3, A) and, compared with the model in the full cohort, was better calibrated at the extremes of risk (Figure 3, B).
Model Application – High-Risk Model
To illustrate clinical model performance, we applied two distinct hypothetical clinical scenarios. Keeping other factors constant, for every hypothetical patient A was exposed to 14 days of an immediate release opioid (e.g. hydrocodone) in the last 30 days of pregnancy with an estimated NAS risk of 2.5% (95%CI 1.6%-3.5%). In contrast, for every hypothetical patient B is was exposed to 30 days of a MOUD opioid and also exposed to gabapentin, a benzodiazepine and a pack of cigarettes a day with an estimated NAS risk of 87.8% (95%CI 81.1%-94.6%). Additional predicted probabilities applying the high-risk model are in Table 3 (available at www.jpeds.com). Model data for the full and clinical models can be downloaded from (to be posted publicly to www.childpolicy.org for download when agreeable to editors).
Table 3 (online only).
Predicted Probabilities of High-Risk Model Using Different Clinical Scenarios Among Infant Exposed to 14 Days of an Immediate Release Opioid and a MOUD in the Last 30 Days of Pregnancy.
| 14 Days Immediate Release Opioid | 30 Days MOUD | |
|---|---|---|
| % (95% CI) |
% (95% CI) |
|
| No Additional Exposures | 2.5% (1.6%-3.5%) |
46.5% (40.0%-53.0%) |
|
Gabapentin No Cigarettes No Benzodiazepines |
11.4% (3.6%-19.1%) |
61.8% (50.0%-73.7%) |
|
Gabapentin 10 Cigarettes Per Day No Benzodiazepines |
33.8% (17.8%-49.8%) |
69.6% (59.3%-80.0%) |
|
Gabapentin used 10 Cigarettes Per Day Benzodiazepines |
54.4% (34.3%-74.5%) |
84.2% (75.9%-92.5%) |
|
Gabapentin 20 Cigarettes Per Day Benzodiazepines Used |
61.7% (42.5%-81.0%) |
87.8% (81.1%-94.6%) |
Predicted probabilities calculated used predicted marginal means.
Caution should be taken when interpreting predicted probabilities that are high as this model is not well-calibrated at the high-end of risk.
Discussion
Using data from more than 200,000 maternal-infant dyads, we developed and validated two models using data available at the time of delivery that could be used to risk stratify opioid-exposed infants at the time of birth. Currently, an estimated 30,000 infants are diagnosed with NAS each year;2 however, this does not include the opioid-exposed infants who do not develop clinical features of withdrawal severe enough to be diagnosed with the NAS. Similar to previous work,5,8 only a minority of opioid-exposed infants in this study were diagnosed with the syndrome. Taken together, this suggests that there potentially tens of thousands of low-risk opioid-exposed infants who spend extended periods of time being observed in hospitals, with marginal health benefit. Furthermore, excess observation may lead to separation of the maternal-infant dyad and cost to the healthcare system. Using clinically available details to tailor postnatal care based upon an individual infant’s risk of developing NAS has the potential to be both more efficient and result in less disruptive care for the maternal-infant dyad.
In both of our models and similar to previous research, we found lower birthweight and female sex protected against developing the syndrome.7,13,18 In addition, we found several maternal medications increased risk of a diagnosis of NAS. Even though medications for opioid use disorder, including buprenorphine, improve pregnancy outcomes by reducing risk of preterm birth and overdose death,19,20 they come with an increased risk of drug withdrawal which has been described in the literature.5 Additional exposures, including SSRIs,5,7,18 antipsychotics,7 benzodiazepines, 7,16 gabapentin7 and maternal cigarette 5,18 use have also been associated with development of NAS and with NAS severity. However, data suggesting an association with bupropion and anti-nausea medications (e.g., metoclopramide) with NAS risk are sparse. We speculate that metoclopramide’s mechanism of action, antagonizing central dopamine receptors, in combination may increase NAS risk, however, this association and the proposed mechanism merit additional research.
The American Academy of Pediatrics suggests that all opioid-exposed infants be observed for 3 to 7 days after birth to monitor for development of NAS.6 For infants at low-risk of developing the syndrome who are exposed to licit opioids, this observation period may be disruptive and undesirable, resulting in excess utilization of hospital resources and possible separation of the maternal-infant dyad if care is delivered in a neonatal intensive care unit.21 Our study suggests that by using clinically available data at the time of birth, opioid-exposed infants can be risk stratified, potentially improving care. However, applying these data to tailor observation periods should be done in the setting of close post-discharge monitoring or a clinical trial. There could be unintended consequences of premature discharge, including hospital readmission.22 Further, for families who received no or limited prenatal care prior to birth, the hospitalization period can serve as an ideal time to engage families in important post-discharge services, including potential addiction treatment for the mother.
Our study has a number of limitations. First, as with all clinical prediction tools, this NAS predictive tool may not perform as well among different populations when validated. Next, our data were obtained from Medicaid-enrolled maternal-infant dyads. Although Medicaid is financially responsible for more than 80% of NAS births nationwide,2 our findings may not be generalizable to privately insured dyads. Although we performed a robust internal validation of our model, the model should be validated in an external population and recalibrated before it is considered for use in additional settings. We note that our general population models are not well-calibrated for high-risk infants, therefore, in their present form they may serve best to discriminate low-risk infants. We used data from filled prescriptions to estimate infant risk, however, it is possible that despite prescriptions being filled pregnant women did not take medications. Although our study included data from filled prescriptions, clinicians may not have these data available, instead having to rely upon medical history taking to obtain these data, perhaps influencing the applicability of our model. This study focuses on infants exposed to medically prescribed opioids and may not be generalizable to infants exposed to illicit opioids. We could not assess differences in NAS risk between methadone and buprenorphine as methadone was not covered by TennCare for OUD during our study period. Importantly, a clinical trial found that although methadone increased NAS severity, there was no difference in NAS incidence which is the primary outcome in our study.23 Future studies should evaluate differences between NAS risk among different MOUD.
We developed two parsimonious clinical prediction rules for the development of NAS that effectively discriminate between infants at high- and low-risk of developing the syndrome. Although future work is required to validate the clinical utility of this prediction rule, application of such a tool has the potential to limit excess hospital utilization among low-risk opioid-exposed infants nationwide.
Figure 6 (online only).
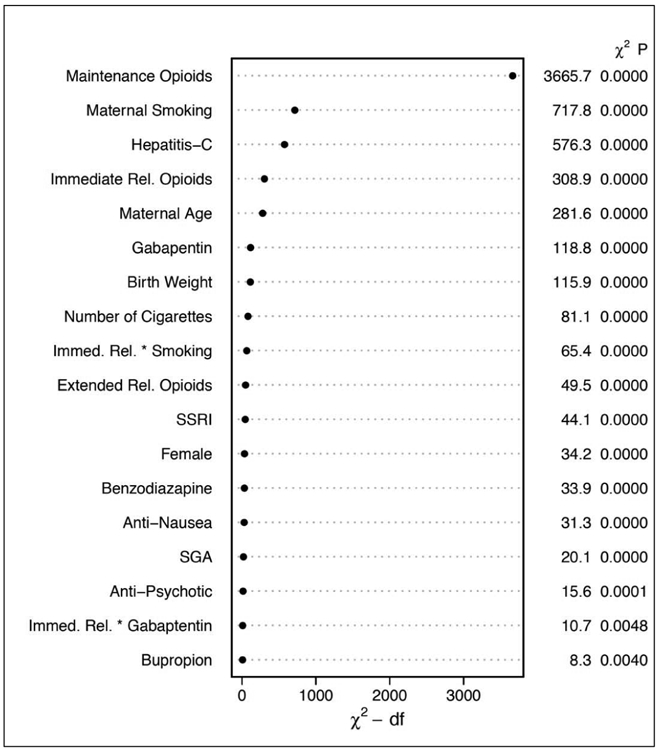
General Population Model Relative Contribution of Each Covariate to the Final Model Using the Relative Chi-square.
* Dot charts depicting the importance of variables in the prediction model based on clinical predictors, as measured by Wald chi-square and chi-square minus degrees of freedom. Statistics are provided for main effects and two-way interactions (represented as A * B) with p-values calculated using separate multiple degree of freedom chunk tests.
Figure 7 (online only).
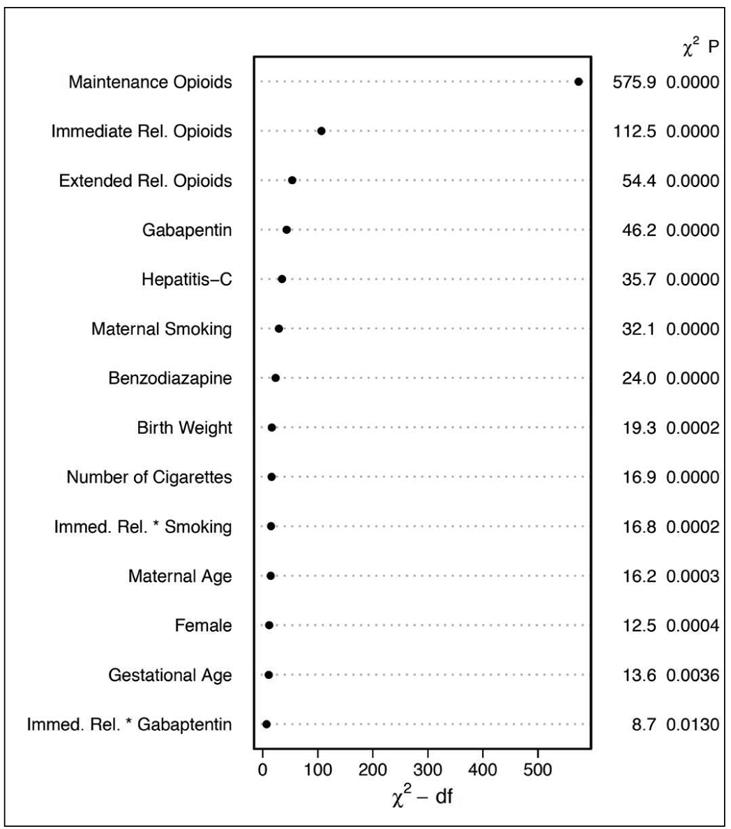
High Risk Model Relative Contribution of Each Covariate to the Final Model Using the Relative Chi-square.
* Dot charts depicting the importance of variables in the prediction model for high risk patients, as measured by Wald chi-square and chi-square minus degrees of freedom. Statistics are provided for main effects and two-way interactions (represented as A * B) with p-values calculated using separate multiple degree of freedom chunk tests.
Acknowledgements
We are indebted to the Tennessee Bureau of TennCare and the Department of Finance and Administration that provided the data. We are also indebted to the Tennessee Department of Health, Office of Health Statistics for providing vital records data.
Supported by the National Institute on Drug Abuse of the National Institutes of Health under award number K23DA038720 (to S.P.) and by the Tennessee Department of Health. F.H. was supported by CTSA award No. UL1 TR002243 from the National Center for Advancing Translational Sciences for his work on this paper. Its contents are solely the responsibility of the authors and do not necessarily represent official views of the National Institute on Drug Abuse, the National Center for Advancing Translational Sciences or the National Institutes of Health. The authors declare no conflicts of interest.
Abbreviations:
- AIC
Akaike information criterion
- HCV
hepatitis C virus
- ICD-9-CM
International Classification of Diseases 9th Revision Clinical Modification
- MME
morphine milligram equivalents
- NAS
neonatal abstinence syndrome
Footnotes
Publisher's Disclaimer: This is a PDF file of an unedited manuscript that has been accepted for publication. As a service to our customers we are providing this early version of the manuscript. The manuscript will undergo copyediting, typesetting, and review of the resulting proof before it is published in its final form. Please note that during the production process errors may be discovered which could affect the content, and all legal disclaimers that apply to the journal pertain.
References
- 1.Haight SC, Ko JY, Tong VT, Bohm MK, Callaghan WM. Opioid Use Disorder Documented at Delivery Hospitalization - United States, 1999-2014. MMWR Morb Mortal Wkly Rep. 2018;67:845–849. [DOI] [PMC free article] [PubMed] [Google Scholar]
- 2.Winkelman TNA, Villapiano N, Kozhimannil KB, Davis MM, Patrick SW. Incidence and Costs of Neonatal Abstinence Syndrome Among Infants With Medicaid: 2004-2014. Pediatrics. 2018;141. [DOI] [PMC free article] [PubMed] [Google Scholar]
- 3.Patrick SW, Schumacher RE, Benneyworth BD, Krans EE, McAllister JM, Davis MM. Neonatal abstinence syndrome and associated health care expenditures: United States, 2000-2009. Jama. 2012;307:1934–1940. [DOI] [PubMed] [Google Scholar]
- 4.Patrick SW, Davis MM, Lehmann CU, Cooper WO. Increasing incidence and geographic distribution of neonatal abstinence syndrome: United States 2009 to 2012. Journal of perinatology : official journal of the California Perinatal Association. 2015;35:650–655. [DOI] [PMC free article] [PubMed] [Google Scholar]
- 5.Patrick SW, Dudley J, Martin PR, Harrell FE, Warren MD, Hartmann KE, et al. Prescription opioid epidemic and infant outcomes. Pediatrics. 2015;135:842–850. [DOI] [PMC free article] [PubMed] [Google Scholar]
- 6.Hudak ML, Committee on Drugs, Committee on Fetus and Newborn, American Academy of Pediatrics. Neonatal drug withdrawal. Pediatrics. 2012;129(e540–560).22291123 [Google Scholar]
- 7.Huybrechts KF, Bateman BT, Desai RJ, Hernandez-Diaz S, Rough K, Mogun H, et al. Risk of neonatal drug withdrawal after intrauterine co-exposure to opioids and psychotropic medications: cohort study. BMJ (Clinical research ed). 2017;358:j3326. [DOI] [PMC free article] [PubMed] [Google Scholar]
- 8.Desai RJ, Huybrechts KF, Hernandez-Diaz S, Mogun H, Patorno E, Kaltenbach K, et al. Exposure to prescription opioid analgesics in utero and risk of neonatal abstinence syndrome: population based cohort study. BMJ (Clinical research ed). 2015;350:h2102. [DOI] [PMC free article] [PubMed] [Google Scholar]
- 9.Leech AA, Cooper WO, McNeer E, Scott TA, Patrick SW. Neonatal Abstinence Syndrome In The United States, 2004-16. Health affairs (Project Hope). 2020;39:764–767. [DOI] [PMC free article] [PubMed] [Google Scholar]
- 10.Cooper WO, Hernandez-Diaz S, Arbogast PG, Dudley JA, Dyer S, Gideon PS, et al. Major congenital malformations after first-trimester exposure to ACE inhibitors. The New England journal of medicine. 2006;354:2443–2451. [DOI] [PubMed] [Google Scholar]
- 11.Maalouf FI, Cooper WO, Stratton SM, Dudley JA, Ko J, Banerji A, et al. Positive Predictive Value of Administrative Data for Neonatal Abstinence Syndrome. Pediatrics. 2018. [DOI] [PMC free article] [PubMed] [Google Scholar]
- 12.Prescription Drug Monitoring Program Training and Technical Assistance Center. Conversion Reference Table. 2014; www.pdmpassist.org/pdf/Conversion%20Reference%20Table.xlsx. Accessed May 9, 2014.
- 13.Charles MK, Cooper WO, Jansson LM, Dudley J, Slaughter JC, Patrick SW. Male Sex Associated With Increased Risk of Neonatal Abstinence Syndrome. Hospital pediatrics. 2017;7:328–334. [DOI] [PMC free article] [PubMed] [Google Scholar]
- 14.Harrell FE. Regression modeling strategies : with applications to linear models, logistic regression, and survival analysis. New York: Springer; 2001. [Google Scholar]
- 15.Gauthier J, Wu QV, Gooley TA. Cubic splines to model relationships between continuous variables and outcomes: a guide for clinicians. Bone marrow transplantation. 2020;55(4):675–680. [DOI] [PubMed] [Google Scholar]
- 16.Sanlorenzo LA, Cooper WO, Dudley JA, Stratton S, Maalouf FI, Patrick SW. Increased Severity of Neonatal Abstinence Syndrome Associated With Concomitant Antenatal Opioid and Benzodiazepine Exposure. Hospital pediatrics. 2019;9:569–575. [DOI] [PMC free article] [PubMed] [Google Scholar]
- 17.Harrell FE. Hmisc: A package of miscellaneous R functions. 2019; http://biostat.mc.vanderbilt.edu/Hmisc. Accessed August 15, 2019.
- 18.Kaltenbach K, Holbrook AM, Coyle MG, Heil SH, Salisbury AL, Stine SM, et al. Predicting treatment for neonatal abstinence syndrome in infants born to women maintained on opioid agonist medication. Addiction. 2012;107 Suppl 1:45–52. [DOI] [PMC free article] [PubMed] [Google Scholar]
- 19.Fullerton CA, Kim M, Thomas CP, Lyman DR, Montejano LB, Dougherty RH, et al. Medication-assisted treatment with methadone: assessing the evidence. Psychiatr Serv. 2014;65:146–157. [DOI] [PubMed] [Google Scholar]
- 20.ACOG Committee Opinion No. 524: Opioid abuse, dependence, and addiction in pregnancy. Obstet Gynecol. 2012;119:1070–1076. [DOI] [PubMed] [Google Scholar]
- 21.Tolia VN, Patrick SW, Bennett MM, Murthy K, Sousa J, Smith PB, et al. Increasing Incidence of the Neonatal Abstinence Syndrome in U.S. Neonatal ICUs. The New England journal of medicine. 2015;372:2118–2126. [DOI] [PubMed] [Google Scholar]
- 22.Patrick SW, Burke JF, Biel TJ, Auger KA, Goyal NK, Cooper WO. Risk of Hospital Readmission Among Infants With Neonatal Abstinence Syndrome. Hospital pediatrics. 2015;5:513–519. [DOI] [PMC free article] [PubMed] [Google Scholar]
- 23.Jones HE, Kaltenbach K, Heil SH, Stine SM, Coyle MG, Arria AM, et al. Neonatal abstinence syndrome after methadone or buprenorphine exposure. The New England journal of medicine. 2010;363:2320–31. [DOI] [PMC free article] [PubMed] [Google Scholar]