Abstract
Although iron is required for cell proliferation, iron‐dependent programmed cell death serves as a critical barrier to tumor growth and metastasis. Emerging evidence suggests that iron‐mediated lipid oxidation also facilitates immune eradication of cancer. However, the regulatory mechanisms of iron metabolism in cancer remain unclear. Here we identify OTUD1 as the deubiquitinase of iron‐responsive element‐binding protein 2 (IREB2), selectively reduced in colorectal cancer. Clinically, downregulation of OTUD1 is highly correlated with poor outcome of cancer. Mechanistically, OTUD1 promotes transferrin receptor protein 1 (TFRC)‐mediated iron transportation through deubiquitinating and stabilizing IREB2, leading to increased ROS generation and ferroptosis. Moreover, the presence of OTUD1 promotes the release of damage‐associated molecular patterns (DAMPs), which in turn recruits the leukocytes and strengthens host immune response. Reciprocally, depletion of OTUD1 limits tumor‐reactive T‐cell accumulation and exacerbates colon cancer progression. Our data demonstrate that OTUD1 plays a stimulatory role in iron transportation and highlight the importance of OTUD1‐IREB2‐TFRC signaling axis in host antitumor immunity.
Keywords: colorectal cancer, ferroptosis, iron transportation, OTUD1
Subject Categories: Cancer; Immunology; Post-translational Modifications, Proteolysis & Proteomics
OTUD1 stabilizes IREB2 and enhances TFRC‐mediated iron uptake in intestinal epithelial cells. OTUD1 increases cell susceptibility to ferroptosis and is essential for T cell surveillance against cancer.

Introduction
Intact ion transport is essential for host immune response. Uncontrolled accumulation of extracellular potassium in tumor‐surrounding area leads to T‐cell dysfunction (Eil et al, 2016; Vodnala et al, 2019). Overabundance of sodium promotes pathogenic Th17 cell polarization and exacerbates colon inflammation (Kleinewietfeld et al, 2013; Wilck et al, 2017). Although iron deficiency and consequent anemia are frequent complications in patients with cancer (Ludwig et al, 2015), the role of iron metabolism within tumor microenvironment is largely unknown.
Iron is the essential element for DNA synthesis, metabolism, and cell proliferation (Raza et al, 2014). Cellular iron uptake is mainly dependent on iron transporters, such as transferrin receptor protein 1 (TFRC) and divalent metal transporter 1 (DMT1/SLC11A2) (Arosio et al, 2017; Gao et al, 2019). Because excessive cellular iron is toxic, iron concentration must be tightly orchestrated. As the iron sensor, iron‐responsive element‐binding protein 2 (IREB2) is involved in modulation of iron transporters (Zumbrennen et al, 2009). IREB2 directly binds to the RNA stem‐loop structures in the 3′‐untranslated region (UTR) of mRNA and stabilizes transcripts of TFRC or DMT1, thereby increasing intracellular iron concentration (Samaniego et al, 1994). When an iron excess occurs, ubiquitin E3 ligase F‐box/LRR‐repeat protein 5 (FBXL5) promotes ubiquitination and consequent degradation of IREB2, which in turn limits iron absorption and utilization (Salahudeen et al, 2009). On the other hand, a high‐level expression of IREB2 is required for regulating absorption of iron when cytosolic iron is not enough. However, the key factors and regulatory mechanism responsible for maintaining stability of IREB2 under iron‐deficient conditions remain elusive.
Iron is also a pro‐oxidant agent, which can react with the hydrogen peroxide to produce reactive oxygen species (ROS) (Sousa et al, 2020). When the antioxidant system is saturated, excess of lipid ROS causes cellular changes, eventually leading to ferroptosis, a non‐apoptotic cell death (Torti et al, 2018; Friedmann Angeli et al, 2019; Hassannia et al, 2019). Although the mechanism by which iron is related to ferroptosis is not yet well elucidated, the stimulatory effects of TFRC or DMT1 on ferroptosis have already been established (Stockwell et al, 2017; Lei et al, 2020). Unlike apoptosis that was considered as a physiological non‐immunogenic cell death, other types of cell death, such as necrosis and pyroptosis, have been related with immunogenic cell death (ICD) (Minagawa et al, 2020; Zhang et al, 2020). Depending on the emission of a specific panel of danger‐associated molecular patterns (DAMPs), ICD triggers host adaptive immunity in the context of cancers or infectious diseases (Galluzzi et al, 2017). Reciprocally, neoplastic cells have developed an arsenal of strategies to curb danger signaling and thereby escape from immune detection (Bidwell et al, 2012). Despite ferroptosis has been implicated in T cell‐mediated cytotoxicity (Wang et al, 2019), it is still elusive whether ferroptosis can cause ICD and strengthen host antitumor immunity.
In the present study, we identify that OTUD1 acts as a deubiquitinase of IREB2 and blocks its degradation, thereby promoting TFRC expression and augmenting cellular iron uptake. OTUD1 is mainly expressed in intestinal epithelial cells and selectively downregulated during tumorigenesis. Clinical analysis reveals that reduced OTUD1 is highly correlated with poor outcome of colorectal cancers. Activation of OTUD1‐IREB2‐TFRC pathway increases intracellular iron concentration and enhances cell sensitivity to ferroptosis, which in turn leads to immunogenic cell death and reinforces host antitumor immunity. Our data thus demonstrate that the tumor suppressor OTUD1 promotes iron absorption and potentiates host antitumor immunity.
Results
Cellular iron uptake is impaired during colon cancer development
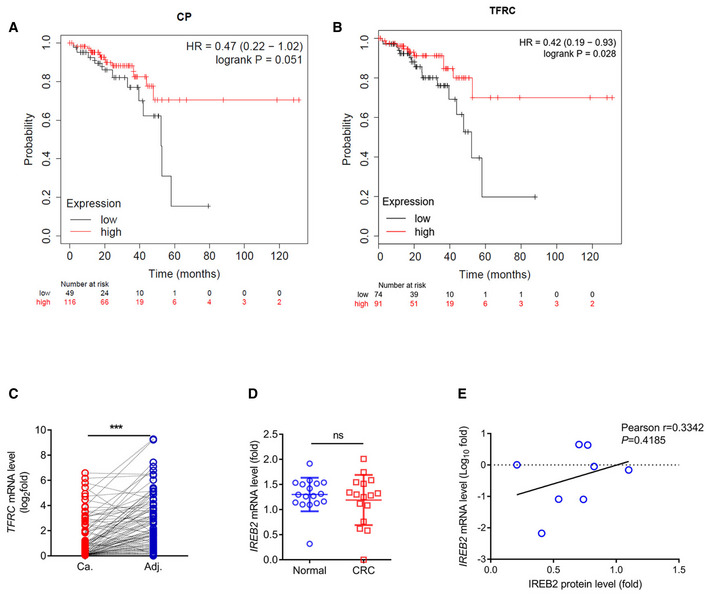
Although iron is an essential element for multiple biological processes, it is still elusive whether iron metabolism is involved in colorectal cancer development. To this end, we analyzed the dataset from patients with colorectal cancer (CRC) (GDS4382) and found that, along with dysregulation of ion homeostasis, genes related with iron transportation were reduced in tumor as relative to normal tissues, such as LTF, CP, FTH1, and TFRC (Fig 1A). We next interrogated gene expression data in colon cancer tissues from TCGA database and found that dysregulation of iron metabolism was highly correlated with poor prognosis of CRC patients (Figs 1B, and EV1A and B). To further confirm these results, we measured the status of transferrin receptor protein 1 (TFRC) in patients with colorectal cancer, which is essential for iron delivery from transferrin to cells. As shown in Fig EV1C, TFRC is remarkably downregulated in CRCs compared with their matched normal tissues. Moreover, the intracellular iron sensor IREB2, which can facilitate iron absorption via promoting of TFRC mRNA stability, was also downregulated during colon cancer development (Fig 1C). Notably, the protein level of IREB2 rather than its mRNA was reduced in colon cancers (Figs 1C, and EV1D and E). These results thus indicate that iron transportation is impaired during colon tumorigenesis.
Figure 1. OTUD1 stabilizes IREB2 and promotes TFRC expression.
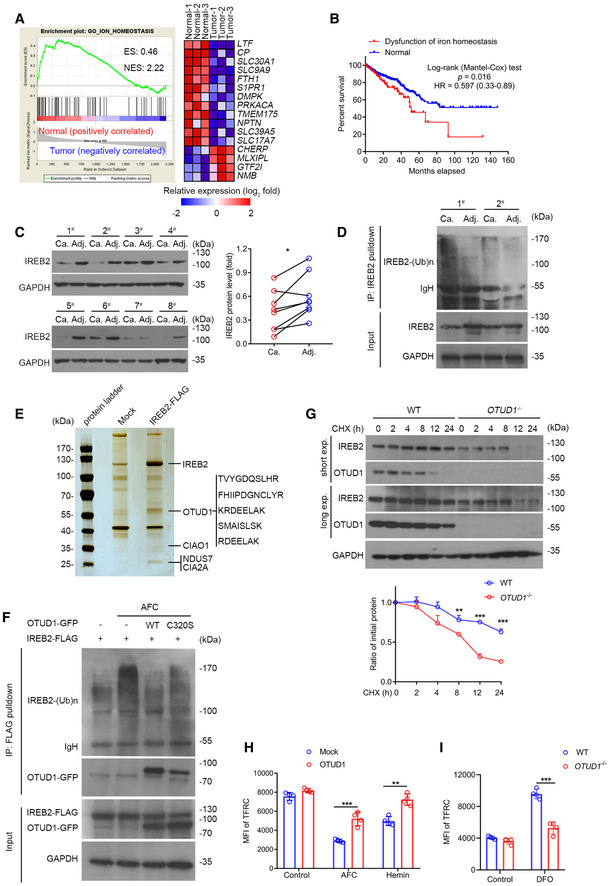
- Gene set enrichment analysis (GSEA) of differentially expressed genes in colorectal cancer from the GEO database (GDS4382). ES, enrichment score; NES, normalized enrichment score. n = 3 biological samples.
- Kaplan–Meier survival curves for colon cancer patients with or without dysfunction of iron homeostasis in the GSE dataset (n = 590 samples, P = 0.016, log‐rank (Mantel–Cox) test). “Normal” represents the patients with unaltered expression of iron homoeostasis‐related genes, including LTF, CP, FTH1, SLC30A1, and TFRC; “Dysfunctional iron homoeostasis” represents the patients with altered expression of iron homoeostasis‐related genes.
- Immunoblot analysis of protein levels of IREB2 in colorectal adenocarcinoma and its matched adjacent normal tissues (left), the relative protein level of IREB2 was assessed by ImageJ software (right) (n = 8 human samples, *P = 0.0114, two‐tailed paired Student’s t‐test).
- Endogenous IREB2 was immunoprecipitated from the lysates of primary colorectal adenocarcinoma and its matched adjacent normal tissue, and was subsequently analyzed by anti‐ubiquitin antibody for the assessment of ubiquitination.
- Mass spectrum analysis of IREB2‐associated proteins. Mock or IREB2‐FLAG was transfected into HEK293T cells, and FLAG‐tagged proteins were enriched by anti‐FLAG M2 beads and incubated with lysates from normal mice colon tissues. Five matched peptides corresponding to OTUD1 were shown on the right panel.
- In vivo ubiquitination assay of IREB2. HEK293T cells were transfected with indicated plasmids and subjected to immunoprecipitation with anti‐FLAG antibody followed by Western blot analysis.
- Half‐life analysis of IREB2 in wild‐type (WT) and OTUD1 −/− NCM460 cells. Cells were treated with 100 μg/ml cycloheximide (CHX) and collected at the indicated times for Western blot analysis (up), and the relative protein level of IREB2 was assessed by ImageJ software (down) (n = 3 biological replicates, mean ± s.e.m., **P = 0.0049, ***P < 0.0001, two‐tailed unpaired Student’s t‐test).
- Flow cytometric analysis of TFRC expression in mock‐ and OTUD1‐expressing CT26 cells with AFC (50 μM) and hemin (100 μM) treatment. MFI, mean fluorescence intensity. Control uses isotype‐matched control antibody (n = 4 biological replicates, mean ± s.e.m., **P = 0.0010, ***P = 0.0008, two‐tailed unpaired Student’s t‐test).
- Flow cytometric analysis of TFRC expression in wild‐type (WT) and OTUD1 −/− NCM460 cells with DFO (100 μM) treatment. MFI, mean fluorescence intensity (n = 4 biological replicates, mean ± s.e.m., ***P = 0.0001, two‐tailed unpaired Student’s t‐test).
Source data are available online for this figure.
Figure EV1. Iron transportation signaling is impaired in colorectal cancers.
-
A, BKaplan–Meier survival curves for patients with colon cancer containing low or high expression of CP (low expression of CP, n = 49 patients; high expression of CP, n = 116 patients) and TFRC (low expression of TFRC, n = 74 patients; high expression of TFRC, n = 91 patients) mRNA in the GSE dataset.
-
CRT–qPCR analysis of TFRC mRNA levels in colon tumors and matched adjacent normal tissues (n = 101 human samples, ***P < 0.001, two‐tailed paired Student’s t‐test).
-
DThe mRNA level of IREB2 in normal (n = 17) or colorectal cancer (n = 16) tissues from the GEO database (GDS4382) (mean ± s.e.m., ns, not significant (P > 0.05), two‐tailed unpaired Student’s t‐test).
-
EThe relationship of protein level and mRNA level of IREB2 in colon cancer (n = 8 samples, P = 0.4185, two‐tailed Pearson correlation analysis).
OTUD1 acts as a deubiquitinase of IREB2
The above results indicated that posttranslational modification might be involved in modulation of IREB2 expression in colon. To test whether ubiquitin–proteasome system is involved in this process, we used anti‐IREB2 antibody to pull down the endogenous IREB2 from primary colon cancer and normal tissues. As shown in Fig 1D, the ubiquitination of IREB2 was increased in colon cancer tissues as compared with their matched normal tissues. To investigate the mechanism by which IREB2 ubiquitination is modulated in colon, we thus performed immunoprecipitation followed by mass spectrometry (MS) to identify the interactome of IREB2 in colon. A list of IREB2 interacting proteins was identified. Among them, the deubiquitinase OTUD1 is of interest and might be involved in regulation of IREB2 ubiquitination and stability (Fig 1E). Through analysis of single‐cell transcriptomic data in human colon, we found that OTUD1 was exclusively expressed in intestinal epithelial cells and goblet cells rather than gut‐resident lymphocytes (Appendix Fig S1A). Ensued co‐immunoprecipitation and confocal assays further confirmed this result and revealed that N‐terminal of OTUD1 was required for its association with IREB2 (Fig EV2A and B). Notably, supplementation of the iron chelation deferoxamine (DFO) strengthened the association of IREB2 with OTUD1 compared with the treatment with hemin, an iron‐containing porphyrin (Fig EV2C).
Figure EV2. OTUD1 deubiquitinases and stabilizes IREB2.
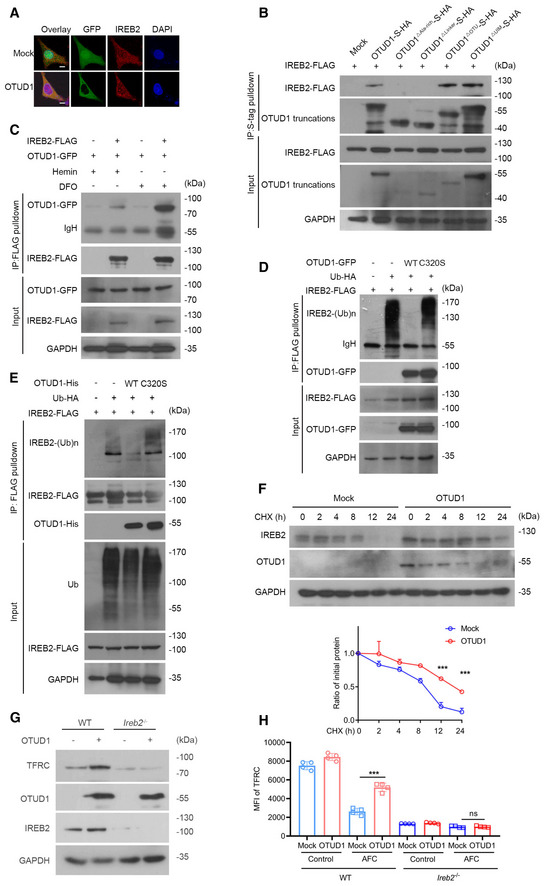
- Confocal examination of OTUD1 and IREB2 colocalization in HEK293T cells ectopically expressing GFP‐tagged OTUD1. The scale bars represent 10 μm.
- HEK293T cells were co‐transfected with IREB2‐FLAG and S‐tagged OTUD1 and its truncations. At 24 h later, cell lysates were immunoprecipitated with S‐protein agarose and analyzed by immunoblot with anti‐FLAG antibody.
- Co‐immunoprecipitation analysis of IREB2‐FLAG together with OTUD1‐GFP with treatment of hemin (100 μM) or DFO (100 μM).
- In vivo ubiquitination assay of IREB2. HEK293T cells were co‐transfected with indicated plasmids and subjected to immunoprecipitation with anti‐FLAG antibody followed by Western blot analysis.
- In vitro ubiquitination assay of IREB2. IREB2 was enriched by anti‐FLAG beads and incubated with purified OTUD1 and OTUD1C320S protein in deubiquitination buffer followed by Western blot analysis.
- Half‐life analysis of IREB2 in the presence or absence of OTUD1 in CT26 cells. Cells were treated with CHX for indicated times and analyzed by Western blot (up), and the relative protein level of IREB2 was assessed by ImageJ software (down) (n = 3 biological replicates, mean ± s.e.m., ***P < 0.001, two‐tailed unpaired Student’s t‐test).
- Analysis of endogenous IREB2 and TFRC level in wild‐type (WT) or Ireb2 −/− CT26 cells with or without OTUD1 overexpressing.
- Flow cytometric analysis of TFRC expression in wild‐type (WT) or Ireb2 −/− CT26 cells with or without OTUD1 overexpression treated with AFC (50 μM). MFI, mean fluorescence intensity. (n = 4 biological replicates, mean ± s.e.m., ns, not significant (P > 0.05), ***P = 0.0001, two‐tailed unpaired Student’s t‐test).
Source data are available online for this figure.
To determine whether OTUD1 can deubiquitinate IREB2, we co‐transfected wild‐type (WT) or enzyme‐dead mutant (C320S) OTUD1 with IREB2 into HEK293T cells. As shown in Fig EV2D, ectopic expression of wild‐type OTUD1 rather than C320S reduced IREB2 ubiquitination. Similar result was detected by in vitro ubiquitination assay (Fig EV2E), which further verified that OTUD1 directly deubiquitinated IREB2. As the treatment of ammonium iron citrate (AFC) stimulates IREB2 ubiquitination and degradation, we detected the ubiquitination level of IREB2 with or without AFC stimulation. As shown in Fig 1F and Appendix Fig S1B, OTUD1 dramatically restrained iron‐induced IREB2 ubiquitination. Additionally, we found that OTUD1 effectively removed both Lys 48‐ and Lys 63‐linked poly‐ubiquitination of IREB2 (Appendix Fig S1C). Since Lys 48‐linked poly‐ubiquitination is critical for protein stability, we thus treated cells with the protein synthesis inhibitor cycloheximide (CHX) to determine the effects of OTUD1 on IREB2 stability. As shown in Figs 1G and EV2F, the half‐life of IREB2 was shortened in cells depleted of OTUD1, but prolonged in cells overexpressing OTUD1. Furthermore, flow cytometry assay showed that treatment of hemin or AFC damped the expression of TFRC, however, significantly rescued by overexpression of OTUD1 (Fig 1H and Appendix Fig S2A). In line with this, loss of OTUD1 limited the DFO‐induced TFRC upregulation (Fig 1I and Appendix Fig S2B).
To ascertain that the stimulatory effects of OTUD1 on TFRC expression are in an IREB2‐dependent manner, we used CRISPR‐Cas9 to delete the Ireb2 in CT26 cells. As shown in Fig EV2G and H as well as Appendix Fig S2C, overexpression of OTUD1 selectively promoted TFRC expression in wild‐type rather than Ireb2 −/− CT26 cells, which further confirms that IREB2 is required for the modulation of TFRC by OTUD1. Our data thus demonstrate that OTUD1 functions as a bona fide deubiquitinase of IREB2 in colon.
OTUD1 is selectively reduced in colon cancer
We next assessed the status of OTUD1 during colon cancer development. As shown in Fig 2A, the mRNA level of OTUD1 was remarkably reduced in colon cancer tissues as relative to their matched adjacent normal tissues. In accordance to the above data that OTUD1 promotes IREB2‐TFRC signaling activation, the transcription of OTUD1 was highly correlated with TFRC expression in CRCs (Fig 2B). Subsequent Western blot assay further confirmed this result (Fig 2C). To determine whether loss of OTUD1 is associated with clinic pathological features, we examined OTUD1 protein expression in a total of 50 paired tissue sections by immunohistochemistry. Consistent to the bioinformatics data that late‐stage tumors expressed lower level of OTUD1 compared with early‐stage tumors did (Appendix Fig S3), decreased OTUD1 was highly correlated with cancer progression (Fig 2D and E). In addition, we noticed that age rather than gender or histological grade was related with OTUD1 reduction in CRCs (Table 1). To assess the status of OTUD1 in other colorectal diseases, we detected OTUD1 expression in colitis, adenomatoid polypus as well as benign adenoma. As shown in Fig 2F, OTUD1 was selectively downregulated in colorectal cancers.
Figure 2. OTUD1 is selectively downregulated in colon cancers.
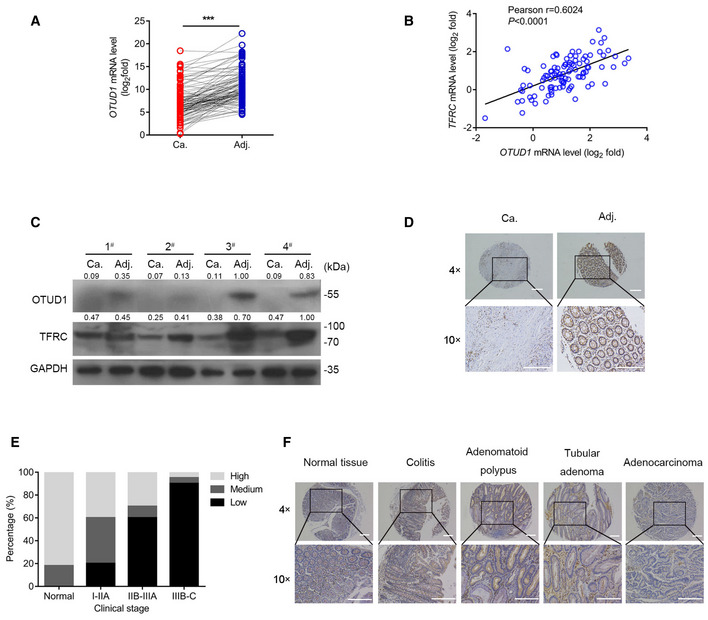
- RT–qPCR analysis of OTUD1 mRNA levels in colon tumors and matched adjacent normal tissues (n = 101 human samples, ***P < 0.001, two‐tailed paired Student’s t‐test).
- Correlation of mRNA expression of TFRC and OTUD1 in colorectal cancer (n = 101 human samples, two‐tailed Pearson correlation analysis, ****P < 0.0001).
- Immunoblot analysis of protein levels of OTUD1 and TFRC in colorectal adenocarcinoma and its matched adjacent normal tissues (n = 4 human samples), the protein levels relative to GAPDH are marked.
- Immunohistochemical staining of OTUD1 in colorectal adenocarcinoma and its matched adjacent normal tissue (the scale bars represent 1,000 μm).
- Analysis of OTUD1 protein levels in colorectal adenocarcinoma patients with different clinical stages from tissue microarray CoI05‐118e.
- Representative immunohistochemistry staining pictures of OTUD1 protein levels in normal tissue and different colon diseases from tissue microarray CO809a (the scale bars represent 1,000 μm).
Source data are available online for this figure.
Table 1.
Information on microarray of samples from patients with colon cancer.
| CoI05‐118e | Low | Medium | High | P value |
|---|---|---|---|---|
| Sex | ||||
| Male | 16 | 5 | 3 | 0.778801 |
| Female | 16 | 5 | 5 | |
| Age | ||||
| >50 | 20 | 8 | 6 | 0.022371 |
| <50 | 12 | 2 | 2 | |
| TNM | ||||
| T2NxM0 | 3 | 0 | 1 | 0.000341 |
| T3NxM0 | 16 | 8 | 4 | |
| T4NxM0 | 13 | 2 | 3 | |
| Stage | ||||
| I–IIA | 9 | 7 | 4 | 0.007255 |
| IIB–IIIA | 6 | 1 | 3 | |
| IIIB–C | 17 | 2 | 1 | |
| Grade | ||||
| G1 | 9 | 4 | 2 | 0.353049 |
| G2 | 13 | 5 | 4 | |
| G3 | 10 | 1 | 2 | |
Deletion of OTUD1 restricts iron transportation
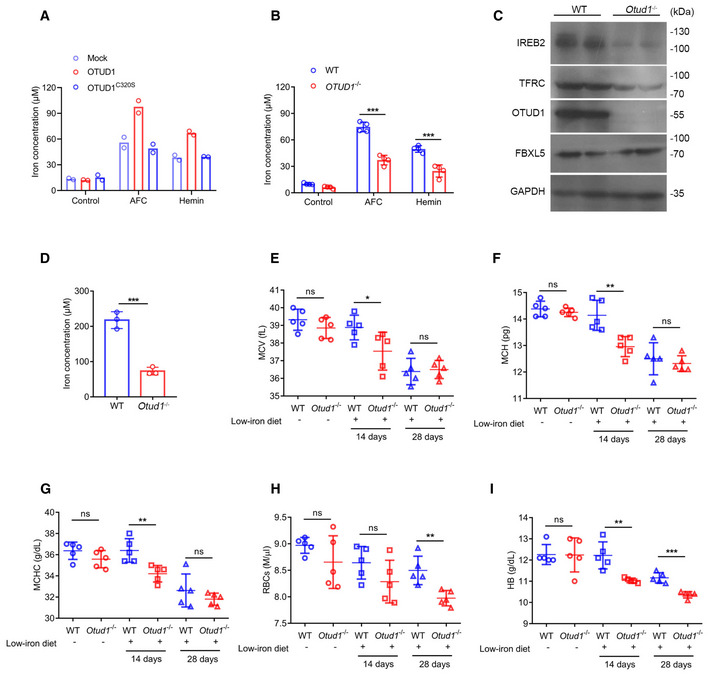
To further determine the role of OTUD1 in iron transportation, we treated cells with hemin or AFC and consequently assessed the intracellular iron concentration. As shown in Fig 3A, overexpression of OTUD1 rather than its catalytically inactive (C320S) mutant promoted cellular uptake of iron. In contrast to the stimulatory effects of OTUD1 on iron transportation in wild‐type cells, OTUD1 presence exerts little effects on iron absorption in Ireb2 −/− cells (Fig EV3A), which further confirms the essential role of IREB2 in regulation of TFRC by OTUD1. Reciprocally, loss of OTUD1 restricted intracellular iron concentration upon hemin or AFC stimulation (Fig 3B). To further confirm this result in vivo, we employed CRISPR‐Cas9 technique to generate Otud1 −/− mice (Fig EV3B and C). Consistent with the data that OTUD1 stabilized IREB2 protein, loss of OTUD1 weakened the expression of IREB2 and TFRC but not FBXL5 in colon (Fig 3C). We next compared the iron absorption between wild‐type and Otud1 −/− mice after oral administration of ferrous gluconate for 1 week. As shown in Fig 3D, loss of OTUD1 remarkably limited the intestinal iron concentration compared with their littermate controls did. Furthermore, we also challenged wild‐type and Otud1 −/− mice with iron‐deficient diets. As shown in Fig 3E–G, iron‐deficient diets for 2 weeks decreased mean corpuscular volume (MCV), mean corpuscular hemoglobin (MCH), and mean corpuscular hemoglobin concentration (MCHC) in Otud1 −/− mice compared with wild‐type mice. Moreover, compared with wild‐type mice, Otud1 −/− mice had lower amounts of the red blood cell (RBC) counts, the hemoglobin (HB) as well as hematocrits (HCTs) 4 weeks after treatment with iron‐deficient diets (Figs 3H and I, and EV3D). Our data thus indicate that loss of OTUD1 curbs iron transportation and enhances susceptibility to iron‐deficient anemia.
Figure 3. OTUD1 promotes iron transportation.
-
A, BIntracellular iron concentration was measured in CT26 cells stably expressing mock, OTUD1, or OTUD1C320S (n = 2 biological replicates) (A), wild‐type (WT) or OTUD1 −/− NCM460 cells (n = 4 biological replicates, mean ± s.e.m., ***P < 0.001, two‐tailed unpaired Student’s t‐test) (B).
-
CThe protein levels of IREB2, TFRC, and OTUD1 were assessed by Western blot in colon tissues from wild‐type (WT) or Otud1 −/− mice.
-
DIntracellular iron concentration was measured in colon tissues from wild‐type (WT) or Otud1 −/− mice with supplementation of ferrous gluconate (n = 3 biological replicates, mean ± s.e.m., ***P = 0.0007, two‐tailed unpaired Student’s t‐test).
-
E–IMean corpuscular volume (MCV) (n = 5 biological replicates, mean ± s.e.m., ns, not significant (P > 0.05), *P = 0.0472, two‐tailed unpaired Student’s t‐test) (E), mean corpuscular hemoglobin (MCH) (n = 5 biological replicates, mean ± s.e.m., ns, not significant (P > 0.05), **P = 0.0048, two‐tailed unpaired Student’s t‐test) (F), mean corpuscular hemoglobin concentration (MCHC) (n = 5 biological replicates, mean ± s.e.m., ns, not significant (P > 0.05), **P = 0.0068, two‐tailed unpaired Student’s t‐test) (G), red blood cells (RBCs) (n = 5 biological replicates, mean ± s.e.m., ns, not significant (P > 0.05), **P = 0.0049, two‐tailed unpaired Student’s t‐test) (H) and hemoglobin (HB) (n = 5 biological replicates, mean ± s.e.m., ns, not significant (P > 0.05), **P = 0.0036, ***P = 0.0002, two‐tailed unpaired Student’s t‐test) (I) in wild‐type (WT) and Otud1 −/− mice with or without low‐iron diets for indicated times.
Source data are available online for this figure.
Figure EV3. Strategy of generation of Otud1 −/− mice.
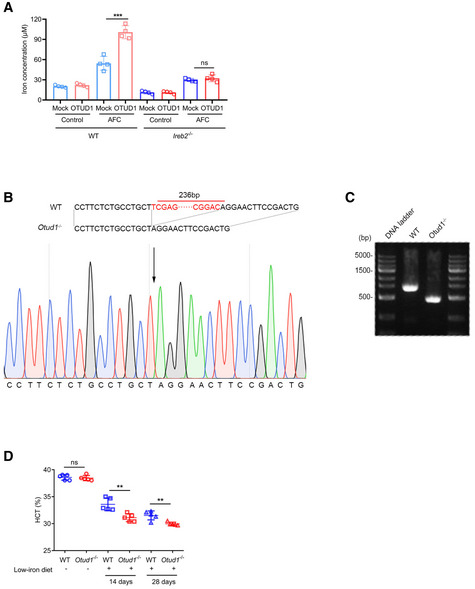
- Intracellular iron concentration was measured in wild‐type (WT) and Ireb2− / − CT26 cells with or without OTUD1 overexpression treated with AFC (50 µM) (n = 4 biological replicates, mean ± s.e.m., ns, not significant (P > 0.05), ***P = 0.0006, two‐tailed unpaired Student’s t‐test).
- Targeting strategy for generation of Otud1 −/− mice (up) and sequence for Otud1 −/− mice genomic DNA (down).
- Validation of Otud1 −/− mice by PCR.
- Hemoglobin and hematocrits (HCTs) in wild‐type (WT) and Otud1 −/− mice with or without low‐iron diets (n = 5 biological replicates, mean ± s.e.m., ns, not significant (P > 0.05), **P < 0.01, two‐tailed unpaired Student’s t‐test).
OTUD1 activates IREB2‐TFRC signaling in cancer and suppresses tumor growth
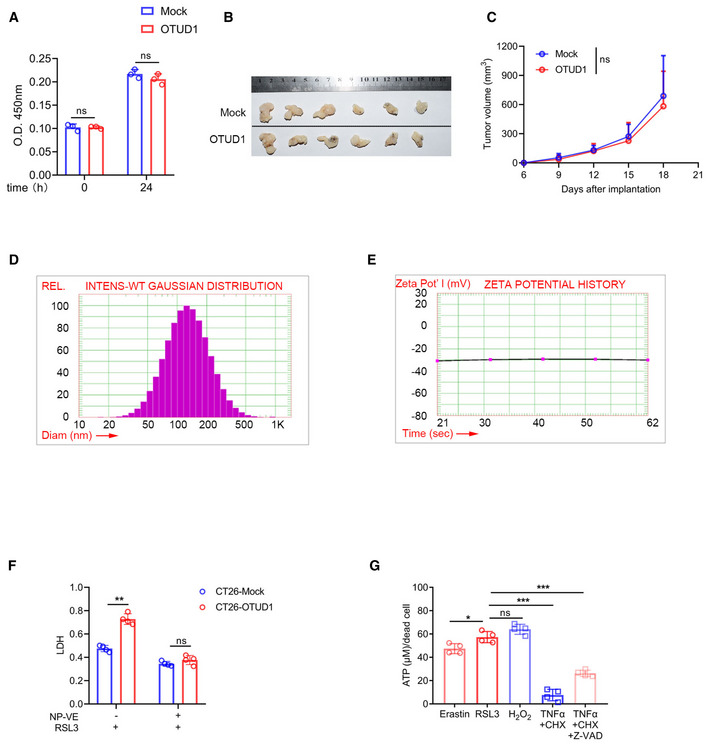
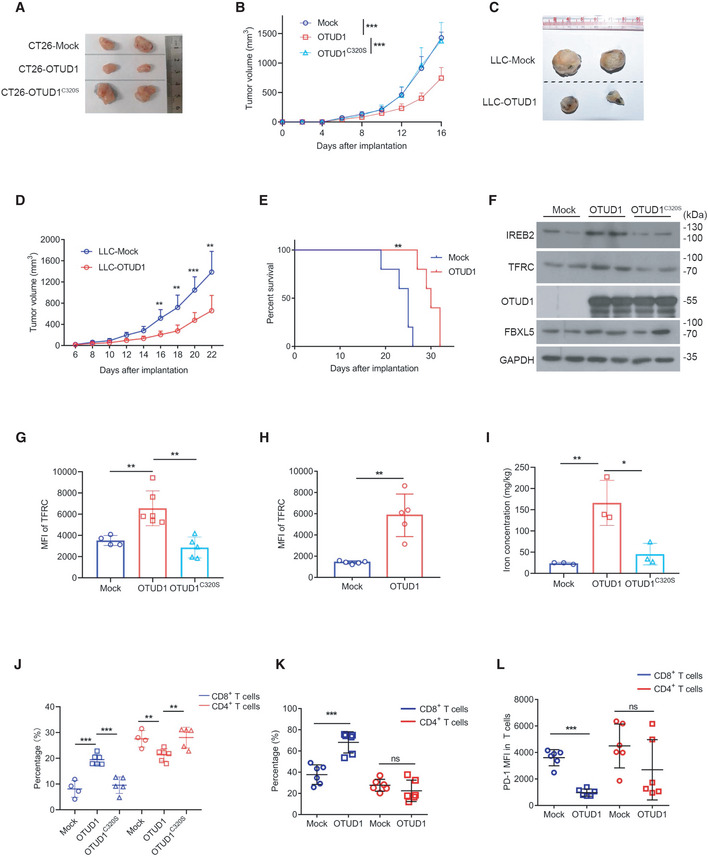
To study the biological function of OTUD1 in tumorigenesis, we reconstituted the expression of OTUD1 in colon cancer cells. Unexpectedly, enforced expression of OTUD1 exhibited little effects on tumor cell proliferation in vitro (Fig EV4A). Moreover, enforced expression of OTUD1 hardly affected tumor growth in NOD‐SCID immune‐deficient mice (Fig EV4B and C). To test whether OTUD1 influences host immune surveillance against cancer, we subcutaneously transplanted equal numbers of mock‐expressing, OTUD1‐expressing, or the catalytically inactive mutant OTUD1C320S‐expressing CT26 cells into the back flanks of BALB/c mice and monitored tumor growth. As shown in Fig 4A and B, enforced expression of OTUD1 rather than OTUD1C320S elicited suppressive effects on tumor growth in vivo. Similar results were also observed in C57BL/6J mice transplanted with mock‐ or OTUD1‐expressing LLC cells, which is murine lung carcinoma cell line (Fig 4C–E).
Figure EV4. OTUD1 promotes tumor cell ferroptosis.
-
AProliferation of mock‐ or OTUD1‐expressing CT26 cells was measured by CCK‐8 (n = 3 biological replicates, mean ± s.e.m., ns, not significant (P > 0.05), two‐tailed unpaired Student’s t‐test).
-
B, CMacroscopic evaluation (B) and tumor volume (n = 6 biological replicates, mean ± s.e.m., ns, not significant (P > 0.05), two‐tailed unpaired Student’s t‐test) (C) of mock‐ and OTUD1‐expressing CT26 tumors in NOD‐SCID mice.
-
D, EThe particle size (D) and zeta‐potential (E) of vitamin E nanoparticles (NP‐VE) were determined by PSS ZPW388‐NICOMP Particle Sizing System.
-
FMock‐ and OTUD1‐expressing CT26 cells treated with indicated regents (RSL3, 10 μM; NP‐VE, 20 mM) for 12 h and LDH releasing level was detected (n = 4 biological replicates, mean ± s.e.m., ns, not significant (P > 0.05), **P = 0.0029, two‐tailed unpaired Student’s t‐test).
-
GATP leaking in NCM460 cells treated with several cell death inducers including Erastin (10 μM), RSL3 (5 μM), TNFα (100 ng/ml), CHX (2 μg/ml), Z‐VAD (25 μM), and H2O2 (100 μM) was detected (n = 4 biological replicates, mean ± s.e.m., ns, not significant (P > 0.05), *P = 0.0214, ***P < 0.001, two‐tailed unpaired Student’s t‐test).
Figure 4. OTUD1 limits tumor growth and augments host antitumor immunity.
-
A, BMacroscopic evaluation (A) and tumor volume (mock, n = 7 biological replicates; OTUD1, n = 9 biological replicates; OTUD1C320S, n = 9 biological replicates; mean ± s.e.m., ***P < 0.001, two‐tailed unpaired Student’s t‐test) (B) of mock‐, OTUD1‐, and OTUD1C320S‐expressing CT26 tumors in BALB/c mice.
-
C–EMacroscopic evaluation (C), tumor volume (n = 6 biological replicates, mean ± s.e.m., **P < 0.01, ***P = 0.0007, two‐tailed unpaired Student’s t‐test) (D) and survival analysis (n = 5 biological replicates, **P = 0.0021, log‐rank (Mantel–Cox) test) (E) of mock‐ and OTUD1‐expressing LLC tumors in C57BL/6 mice.
-
FEndogenous IREB2 and TFRC protein levels in murine CT26 tumors were measured by anti‐IREB2 antibody and anti‐TFRC antibody.
-
GFlow cytometric analysis of TFRC expression in mock (n = 4 biological replicates)‐, OTUD1 (n = 6 biological replicates)‐, and OTUD1C320S (n = 5 biological replicates)‐expressing CT26 tumors. MFI, mean fluorescence intensity (mean ± s.e.m., **P < 0.01, two‐tailed unpaired Student’s t‐test).
-
HFlow cytometric analysis of TFRC expression in mock‐ or OTUD1‐expressing LLC tumors. MFI, mean fluorescence intensity (n = 5 biological replicates, mean ± s.e.m., **P = 0.0011, two‐tailed unpaired Student’s t‐test).
-
IIron concentration of mock, OTUD1, and OTUD1C320S tumors was assessed by inductively coupled plasma mass spectrometry (n = 3 biological replicates, mean ± s.e.m., *P = 0.0237, **P = 0.0098, two‐tailed unpaired Student’s t‐test).
-
JAnalysis of tumor‐infiltrating CD8+ T cells or CD4+ T cells in mock (n = 4 biological replicates)‐, OTUD1 (n = 6 biological replicates)‐, and OTUD1C320S (n = 5 biological replicates)‐expressing CT26 tumors in BALB/c mice (mean ± s.e.m., **P < 0.01, ***P < 0.001, two‐tailed unpaired Student’s t‐test).‡
-
K, LFlow cytometric analysis of CD8+ T cells, CD4+ T cells (n = 6 biological replicates, mean ± s.e.m., ns, not significant (P > 0.05), ***P = 0.0003, two‐tailed unpaired Student’s t‐test) (K) and PD‐1 expression in T cells (n = 6 biological replicates, mean ± s.e.m., ns, not significant (P > 0.05), ***P < 0.0001, two‐tailed unpaired Student’s t‐test) (L) isolated from mock‐ and OTUD1‐overexpressing LLC tumors. MFI, mean fluorescence intensity.
Source data are available online for this figure.
In accordance with the stimulatory effect of OTUD1 on IREB2 in vitro, OTUD1‐expressing tumors expressed higher level of IREB2 compared with mock‐ or OTUD1C320S‐expressing tumors (Fig 4F). In line with this, both Western blot and flow cytometry assay showed that TFRC expression was selectively upregulated by OTUD1 rather than mock or OTUD1C320S (Fig 4F–H, and Appendix Fig S4A and B). Furthermore, through analysis by inductively coupled plasma mass spectrometry (ICP‐MS) assay, we found that intracellular iron concentration was remarkably increased in OTUD1‐expressing tumors as compared with that in mock‐ or OTUD1C320S‐expressing tumors (Fig 4I).
Since the tumor‐suppressive effects of OTUD1 are selectively elicited in immune‐competent mice, we speculated that activation of OTUD1‐IREB2‐TFRC axis may enhance host immune response. We thus examined the status of tumor‐infiltrating lymphocytes during tumor development. As shown in Fig 4J and K as well as Appendix Fig S4C and D, the percentage of CD8+ T cells rather than CD4+ T cells was increased in OTUD1‐expressing tumors compared with mock‐ or OTUD1C320S‐expressing tumors. To study whether OTUD1 affects the effector function of T cell, we assessed the PD‐1 expression on tumor‐infiltrating lymphocytes. Although OTUD1 elicits little effects on PD‐1 expression on CD4+ T cells, CD8+ T cells isolated from OTUD1‐expressing tumors expressed lower level of PD‐1 as relative to those from mock tumors (Fig 4L and Appendix Fig S4E). Our data thus demonstrate that OTUD1 activates IREB2‐TFRC signaling in cancer and enhances host immune response against cancer.
Upregulation of OTUD1 increases cell susceptibility to ferroptosis
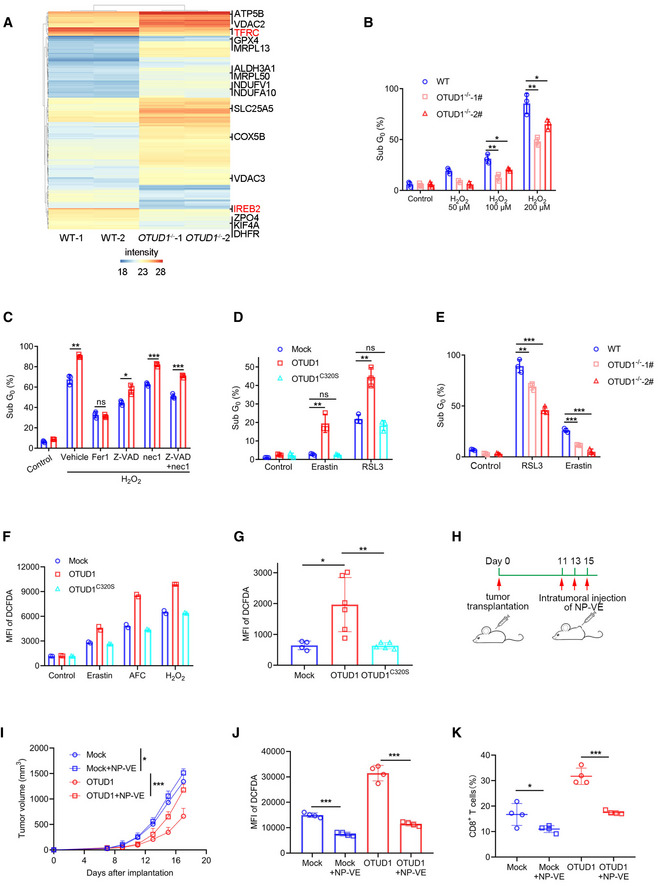
To investigate the mechanism by which OTUD1 suppresses tumor growth, we performed quantitative proteomic analysis between wild‐type and OTUD1 −/− cells. As shown in Fig 5A, in contrast to the reduction of IREB2 and TFRC, the expressions of oxygen reductases, such as GPX4 and ALDH3A1, were upregulated in OTUD1‐deficient cells. We next analyzed the OTUD1‐expressing or control cell response to oxidative stress. As shown in Fig 5B and C, and Appendix Fig S5A and B, overexpression of OTUD1 significantly enhanced hydrogen peroxide‐induced cell death, while loss of OTUD1 elicited opposite effects on cell death. Notably, the ferroptosis inhibitor ferrostatin‐1 (Fer‐1) rather than other cell death inhibitors can revert the enhanced cell death induced by OTUD1 (Fig 5C and Appendix Fig S5B). To further confirm this result, we treated OTUD1, OTUD1C320S or control cells with ferroptosis activators (RSL3, Erastin). As shown in Fig 5D and Appendix Fig S5C, overexpression of OTUD1 enhanced cell sensitivity to cell death, while the deubiquitinating enzyme inactive OTUD1 mutant elicited little effects on ferroptosis. As expected, loss of OTUD1 suppressed cell death induced by RSL3 or Erastin (Fig 5E and Appendix Fig S5D). Intracellular ROS accumulation is another indicator of ferroptosis. We thus used DCFDA to measure the state of ROS in OTUD1‐expressing, OTUD1C320S‐expressing, or control cells. As shown in Fig 5F and Appendix Fig S6A, in spite of identical level of ROS in steady state, overexpression of OTUD1 promoted ROS production in the treatment of ferroptosis activators.
Figure 5. OTUD1 enhances ferroptotic cell death.
-
AQuantitative proteomics study of wild‐type (WT) and OTUD1 −/− NCM460 cells. The expression of TFRC and IREB2 was highlighted with red color. Intensity indicates label‐free quantification (LFQ) intensity of proteins in mass spectrometry.
-
BWild‐type (WT) and OTUD1 −/− NCM460 cells were treated with indicated concentration of H2O2 for 24 h, and cell viability was measured by PI staining (n = 3 biological replicates, mean ± s.e.m., *P < 0.05, **P < 0.01, two‐tailed unpaired Student’s t‐test).
-
CCT26 cells stably expressing mock or OTUD1 were treated with 200 μM H2O2 together with various cell death inhibitors containing Fer‐1 (10 μM), Z‐VAD (25 μM), and nec‐1 (20 μM). Cell viability was measured by PI staining (n = 3 biological replicates, mean ± s.e.m., ns, not significant (P > 0.05), *P = 0.0119, **P = 0.0015, ***P < 0.001, two‐tailed unpaired Student’s t‐test).
-
DCT26 cells stably expressing mock, OTUD1, or OTUD1C320S were treated with Erastin (10 μM) and RSL3 (5 μM), and cell viability was measured by PI staining (n = 3 biological replicates, mean ± s.e.m., ns, not significant (P > 0.05), **P < 0.01, two‐tailed unpaired Student’s t‐test).
-
EWild‐type (WT) and OTUD1 −/− NCM460 cells were treated with Erastin (10 μM) and RSL3 (5 μM) for 24 h, and cell viability was measured by PI staining (n = 3 biological replicates, mean ± s.e.m., **P = 0.0082, ***P < 0.001, two‐tailed unpaired Student’s t‐test).
-
FIntracellular ROS levels in mock‐, OTUD1‐, and OTUD1C320S‐overexpressing CT26 cells treated with Erastin (10 μM), AFC (50 μM), or H2O2 (100 μM) were detected by DCFDA staining. MFI, mean fluorescence intensity (n = 2 biological replicates).
-
GIntracellular ROS levels in mock (n = 4 biological replicates)‐, OTUD1 (n = 6 biological replicates)‐, or OTUD1C320S (n = 5 biological replicates)‐expressing CT26 tumors (mean ± s.e.m., *P = 0.0189, **P = 0.0086, two‐tailed unpaired Student’s t‐test) were detected by DCFDA staining. MFI, mean fluorescence intensity.
-
HSchematic diagram of subcutaneous tumor treatment with nanoparticle‐loading vitamin E (NP‐VE). BALB/c mice were transplanted with 1 × 10⁶ mock‐ or OTUD1‐expressing CT26 cells. 50uL of 5M NP‐VE was intratumorally injected every other day as shown.
-
ITumor volume (mock, n = 4 biological replicates; mock + NP‐VE, n = 6 biological replicates; OTUD1, n = 4 biological replicates; OTUD1 + NP‐VE, n = 6 biological replicates; mean ± s.e.m., *P = 0.0325, ***P = 0.0003, two‐tailed unpaired Student’s t‐test)
-
J, KFlow cytometric analysis of DCFDA (n = 4 biological replicates, mean ± s.e.m., ***P < 0.001, two‐tailed unpaired Student’s t‐test) (J) and the percentage of tumor‐infiltrating CD8+ T cells (n = 4 biological replicates, mean ± s.e.m., *P = 0.0433, ***P = 0.0001, two‐tailed unpaired Student’s t‐test) (K) of mock‐ or OTUD1‐expressing CT26 tumors treated with or without NP‐VE. MFI, mean fluorescence intensity.
To test whether OTUD1 can increase the cell sensitivity to ferroptosis in vivo, we isolated tumor cells from mice bearing OTUD1‐, OTUD1C320S‐ or mock‐expressing tumors. As shown in Fig 5G and Appendix Fig S6B, greater amount of ROS was detected in OTUD1‐expressing tumors than OTUD1C320S‐expressing or control tumors. To ascertain that increased lipid oxidation mainly contributes to the OTUD1‐mediated tumor suppression, we employed vitamin E (VE) that is a radical scavenger, to suppress the commitment of ferroptotic cell death. Considering only a portion of VE dosage can reach the tumor by oral administration and its water insoluble characteristic, we exploited a molecular‐matched strategy to prepare VE‐loading TPGS nanoparticles (NP‐VE) with extremely high drug loading levels (up to 10 mg/ml) (Wang et al, 2015). The nanoparticles have particle sizes of 144.37 ± 0.39 nm and zeta potentials of −29.43 ± 0.6 mV determined by dynamic light scattering (DLS) methods (Fig EV4D and E). In vitro assay showed that NP‐VE treatment curtailed the RSL3‐induced ferroptosis in OTUD1‐expressing cells (Fig EV4F). We next intratumorally injected with NP‐VE into mice bearing mock‐expressing or OTUD1‐expressing tumors (Fig 5H). As shown in Fig 5I, in contrast to the little effects on tumor growth in mice bearing mock‐expressing tumor, NP‐VE treatment compromised the tumor‐suppressive effects of OTUD1. Moreover, flow cytometry analysis revealed that NP‐VE treatment remarkably reduced the intracellular level of ROS in both mock‐ and OTUD1‐expressing tumors (Fig 5J and Appendix Fig S6C). Notably, supplementation of NP‐VE also reduced the ratio of CD8+ tumor‐infiltrated T cell (Fig 5K and Appendix Fig S6D). Our data thus indicate that OTUD1 promotes ferroptosis under oxidative stress.
OTUD1 triggers the DAMP release and stimulates immune response
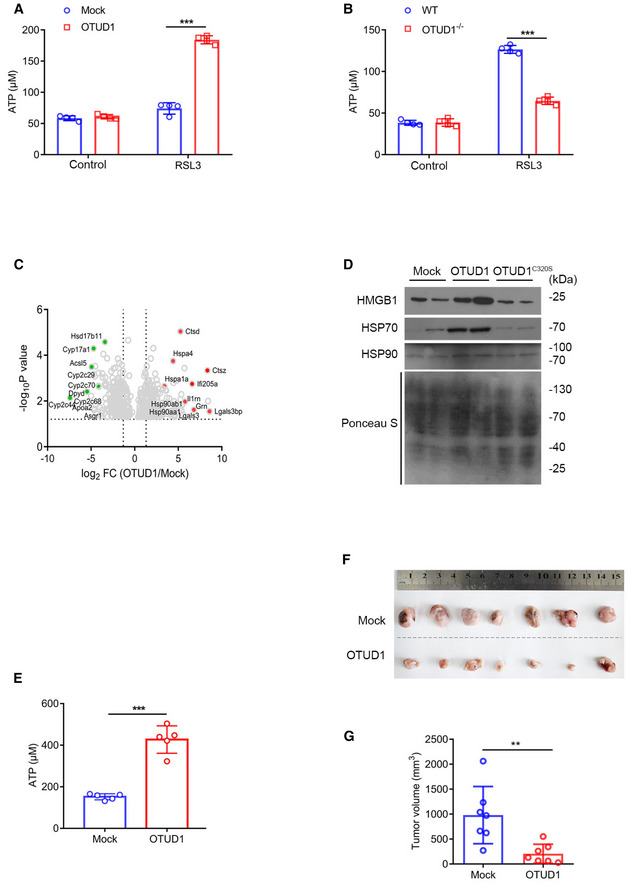
Several studies implicate that non‐apoptotic cell death including necroptosis and pyroptosis can trigger the release of danger‐associated molecular patterns (DAMPs), which in turn strengthens immune response (Galluzzi et al, 2017). To evaluate whether ferroptosis also contributes to this process, we assessed the ATP linkage from cancer cells treated with various cell death inducers. As shown in Fig EV4G, compared with other types of cell death, ferroptosis induced greater amount of ATP released from dead cells. Moreover, overexpression of OTUD1 aggravated RSL3 effects on ATP leakage, while deletion of OTUD1 not only limited cell death but also restricted ATP releasing (Fig 6A and B).
Figure 6. OTUD1 triggers immunogenic cell death.
-
A, BCT26 cells stably expressing mock or OTUD1 (A) and wild‐type (WT) or OTUD1 −/− NCM460 cells (B) were treated with 5 μM RSL3, and medium was collected to measure ATP level (n = 4 biological replicates, mean ± s.e.m., ***P < 0.0001, two‐tailed unpaired Student’s t‐test).
-
CVolcano plots of genes differentially expressed in tumor interstitial fluid (TIF) of mock‐ and OTUD1‐expressing CT26 tumors. Left, example of genes downregulated in OTUD1‐overexpressing tumor interstitial fluid; right, example of genes upregulated in OTUD1‐overexpressing tumor interstitial fluid.
-
DImmunoblot analysis of protein levels of HMGB1, HSP70, and HSP90 in tumor interstitial fluid of mock‐, OTUD1‐, and OTUD1C320S‐expressing CT26 tumors.
-
EATP level in tumor interstitial fluid (TIF) of mock‐ or OTUD1‐overexpressing CT26 cells (n = 5 mice, mean ± s.e.m., ***P < 0.001, two‐tailed unpaired Student’s t‐test).
-
F, GBALB/c mice were immunized with 1 × 10⁶ OTUD1‐expressing or mock CT26 cells in the left flank and challenged with 2 × 10⁶ wild‐type CT26 cells in the right flank 10 days later. Macroscopic evaluation (F) and tumor volume (n = 7 mice, mean ± s.e.m., **P = 0.0053, two‐tailed unpaired Student’s t‐test) (G) of tumors in the right flank were shown.
Source data are available online for this figure.
To further confirm this result in vivo, we employed mass spectrometry analysis of tumor interstitial fluid (TIF) and identified multiple DAMPs were accumulated in TIF in the presence of OTUD1 (Fig 6C). Ensued Western blot assay further confirmed that, compared with control tumors, overexpression of OTUD1 augmented the release of HSP70, HSP90, and HMGB1 in TIF (Fig 6D). Moreover, we also found that enforced expression of OTUD1 increased ATP leakage as relative to control tumors (Fig 6E). Furthermore, we vaccinated mice with empty vector or OTUD1‐expressing CT26 cells subcutaneously in the left flank, and re‐challenged the mice 10 days later with wild‐type CT26 cells in the right flank. As shown in Fig 6F and G, the growth of CT26 cells was restricted significantly in mice vaccinated with OTUD1‐expressing cells compared with mice immunized by control cells. Collectively, our data demonstrate that OTUD1 drives intracellular iron accumulation and promotes oxidative damage, which in turn augments ferroptosis, eventually potentiating host immune response.
OTUD1 deficiency increases susceptibility to colorectal cancer
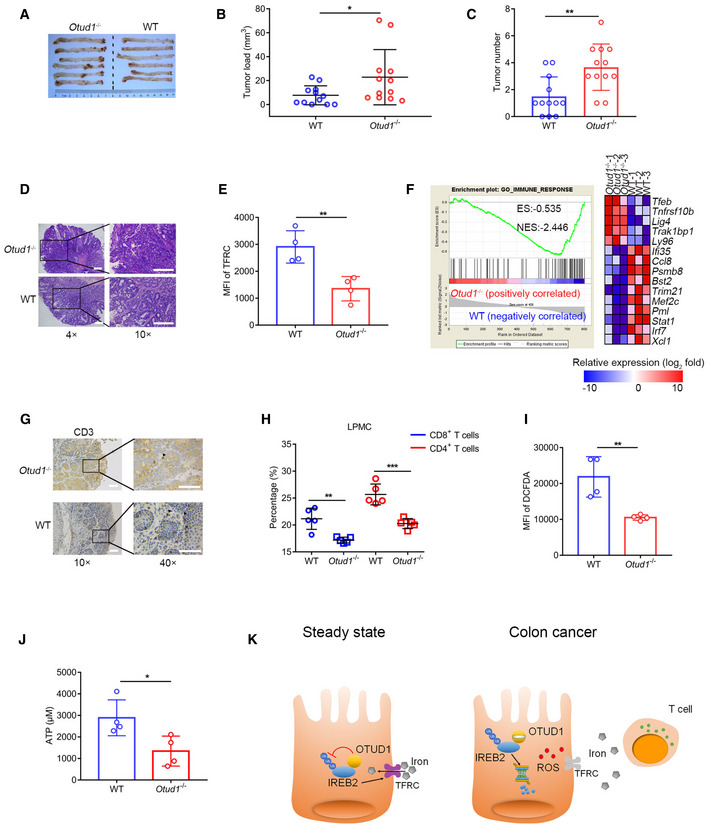
To study whether loss of OTUD1 enhances cancer susceptibility in vivo, we employed the azoxymethane (AOM)/dextran sulfate sodium (DSS) to induce colitis‐associated cancer. As expected, tumors that developed in the Otud1– / – background exhibited a considerably faster growth rate compared with control mice (Fig 7A and B). Although both wild‐type and Otud1– / – tumors were moderately differentiated, the number of tumors was increased in Otud1– / – mice as relative to their littermate controls (Fig 7C and D). In accordance with previous data, flow cytometry assay showed that TFRC expression was impaired in Otud1– / – tumors (Fig 7E and Appendix Fig S7A).
Figure 7. Loss of OTUD1 enhances susceptibility to colon carcinogenesis.
-
ARepresentative pictures of colon tumors in AOM/DSS‐induced colitis‐associated cancer (CAC) model (n = 6 biological replicates).
-
B, CThe tumor load (B) or tumor number (C) in the whole colon was measured (n = 12 biological replicates, mean ± s.e.m., *P = 0.0431, **P = 0.003, two‐tailed unpaired Student’s t‐test).
-
DRepresentative H&E (hematoxylin–eosin) staining pictures of colon tumors (the scale bars represent 1,000 μm).
-
EFlow cytometric analysis of TFRC expression in intestinal epithelial cells (IECs) from wild‐type (WT) and Otud1 −/− mice treated with AOM/DSS. MFI, mean fluorescence intensity. (n = 4 biological replicates, mean ± s.e.m., **P = 0.0062, two‐tailed unpaired Student’s t‐test).
-
FGSEA of genes expressed in colon tissues from wild‐type (WT) and Otud1 −/− mice treated with AOM/DSS (n = 3 biological replicates). ES, enrichment score; NES, normalized enrichment score.
-
GRepresentative immunohistochemistry staining pictures of CD3+ T cells in colon tumors (the scale bars represent 400 μm).
-
HFlow cytometric analysis of various T‐cell subsets in lamina propria mononuclear cells (LPMC) isolated from wild‐type (WT) and Otud1 −/− mice treated with AOM/DSS (n = 5 biological replicates, mean ± s.e.m., **P = 0.0025, ***P = 0.0005, two‐tailed unpaired Student’s t‐test).
-
IIntracellular ROS levels in colon tissues from wild‐type (WT) or Otud1 −/− mice treated with AOM/DSS (n = 4 biological replicates, mean ± s.e.m., **P = 0.0072, two‐tailed unpaired Student’s t‐test) were detected by DCFDA staining. MFI, mean fluorescence intensity.
-
JATP level in tumor interstitial fluid (TIF) of mice treated with AOM/DSS (n = 4 biological replicates, mean ± s.e.m., *P = 0.0292, two‐tailed unpaired Student’s t‐test).
-
KModel for the role of OTUD1 in iron absorption and tumor suppression. OTUD1 facilitates TFRC‐mediated iron absorption through stabilization of IREB2 under steady condition. However, during colorectal cancer development, downregulation of OTUD1 restricts iron absorption and promotes resistance to ferroptosis, thereby subverting host immune surveillance against cancer.
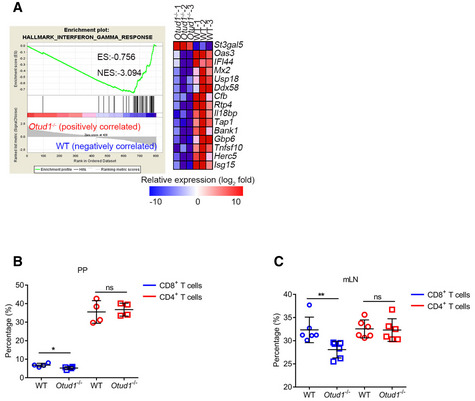
We next used whole‐genome RNA sequencing (RNA‐seq) to analyze the differentially expressed genes in wild‐type and Otud1– / – tumors. Using gene set enrichment analysis (GSEA), we found that loss of OTUD1 suppressed the expression of genes associated with IFNγ or immune response signaling (Figs 7F and EV5A). This result was further confirmed by staining with the pan‐T lymphocyte marker CD3, which revealed that fewer lymphocytic infiltration in colon cancers from Otud1– / – mice as relative to wild‐type mice (Fig 7G). We next employed flow cytometry assay to decipher T‐cell suppression induced by OTUD1 deficiency. As shown in Figs 7H, and EV5B and C, unlike the selective downregulation of CD4+ T cells in cancer, the frequencies of CD8+ T cells from Otud1– / – mice were comprehensively decreased in the lamina propria mononuclear cells (LPMCs), Peyer patch (PP), and mesenteric lymph nodes (mLNs) compared with wild‐type mice. Along with impaired immune response, both intracellular ROS production and extracellular ATP concentration were decreased in tumors from Otud1– / – mice as relative to wild‐type mice (Fig 7I and J, and Appendix Fig S7B). Collectively, our data demonstrate that OTUD1 deletion enhances resistance to immunogenic cell death and restricts host immune response, eventually increasing susceptibility to colon cancer.
Figure EV5. Loss of OTUD1 impedes host antitumor immunity.
-
AGSEA of genes expressed in colon tissues from wild‐type (WT) and Otud1 −/− mice treated with AOM/DSS (n = 3 mice). ES, enrichment score; NES, normalized enrichment score.
-
B, CFlow cytometric analysis of frequency of T‐cell subsets in Peyer's patches (PP) (n = 4 mice, mean ± s.e.m., ns, not significant (P > 0.05), *P = 0.0406, two‐tailed unpaired Student’s t‐test) (B) and mesenteric lymph node (mLN) (n = 6 mice, mean ± s.e.m., ns, not significant (P > 0.05), **P = 0.0098, two‐tailed unpaired Student’s t‐test) (C) isolated from wild‐type (WT) and Otud1 −/− mice treated with AOM/DSS.
Discussion
Delineating the mechanisms by which tumor microenvironment hijacks host antitumor immunity is critical for cancer treatment. Here we report iron transportation is impaired during colon cancer development. As the deubiquitinase of IREB2, OTUD1 is selectively downregulated in colon cancer, which in turn limits TFRC‐mediated iron transport, thereby attenuating tumor cell sensitivity to ferroptosis and facilitating tumor growth. Reciprocally, activation of OTUD1‐IREB2‐TFRC pathway increases intracellular iron concentration and enhances immunogenic cell death, eventually reinforcing T‐cell response against cancer (Fig 7K). We therefore suggest that OTUD1 is a potential immunotherapeutic target for increasing the strength of immune responses against cancer.
As a deubiquitinase, OTUD1 has been reported to promote p53‐mediated cell cycle arrest or restrict TGFβ‐induced cancer metastasis, which elicits tumor‐suppressive function in breast cancer and thyroid cancer (Carneiro et al, 2014; Zhang et al, 2017). However, our present study revealed that Otud1– / – mice developed apparently normally and no spontaneous tumor were detected within 1 year old. In light of the inducible expression of OTUD1 by pro‐inflammatory cytokine stimulation (Lu et al, 2018), we thus proposed that OTUD1 might be involved in tumor immunomodulation. As expected, enforced expression of OTUD1 in colon cancer triggers T‐cell accumulation in tumor‐surrounding area. Reciprocally, loss of OTUD1 enhanced susceptibility to colorectal cancer and impaired host antitumor immunity. Notably, both single‐cell sequencing data and immunohistochemistry result demonstrate that OTUD1 is exclusively expressed in intestinal epithelial cells and goblet cells rather than gut‐resident T cells. We thus hypothesize that OTUD1 may affect the crosstalk between cancer cells and lymphocytes. Through analyzing the tumor interstitial fluid, we found that greater amount of DAMPs releasing from OTUD1‐expressing tumors, which demonstrates that OTUD1 augments immune response through triggering immunogenic cell death. Collectively, our data illustrate that loss of OTUD1 in cancer cells curbs tumor immune surveillance.
Iron deficiency and consequent anemia are common in patients with cancer (Caro et al, 2001). However, the impact of anemia and anemia treatment on tumor response to cancer therapy is still controversial (Daniel & Crawford, 2006). Recent study reveals that cancer cells have evolutionarily developed the capacity to restrict ferroptosis by importing extracellular cysteine and reducing lipid oxidation (Badgley et al, 2020). Moreover, because of less free iron and ROS as well as higher level of oleic acid in lymph, metastasizing cancer cells undergo decreased oxidative stress and ferroptosis, which facilitates distant cancer metastases formation (Ubellacker et al, 2020). Although iron is required for ferroptosis commitment, the molecular mechanism of iron metabolism in cancer is still largely unknown. Here our data uncover that cellular iron uptake is impaired by OTUD1 downregulation in colon cancer, which enhances cancer cell resistance to ferroptosis, eventually limiting host immune response against cancer. As a non‐apoptotic regulated cell death, ferroptosis has been implicated in CD8+ T cell‐mediated tumor eradication (Wang et al, 2019). Our present study reveals that, in addition to increasing cancer cell sensitivity to immune attack, ferroptosis aggravates host immune response and causes immunogenic cell death. Our data thus highlight the importance of providing iron therapy during cancer immunotherapy in patients with colon cancer.
As an iron‐binding protein, IREB2 is critical for cellular iron metabolism (Rouault, 2006; Wallander et al, 2006). Previous work identified the E3 ligase FBXL5 acted as the negative regulator of IREB2, which triggered IREB2 ubiquitination and degradation (Salahudeen et al, 2009; Vashisht et al, 2009). In this study, however, we found that the expression of FBXL5 was not increased in tumors with low level of IREB2. In accordance with our data, meta‐analysis of TCGA database reveals that the mRNA level of FBXL5 is reduced in colon cancer. Moreover, depletion of OTUD1 hardly affected FBXL5 expression but decreased the protein level of IREB2 and TFRC, which indicates that OTUD1 regulates IREB2‐TFRC signaling in an FBXL5‐independent manner. Interestingly, unlike the stabilizing effects on FBXL5, high level of iron concentration elicited little effects on OTUD1 expression but influenced the interaction between OTUD1 and IREB2. It is possible that iron binding not only blocks the RNA‐binding activity of IREB2 but also impairs its association with OTUD1, eventually limiting OTUD1‐IREB2‐TFRC axis and restricting cellular iron uptake.
In conclusion, the current study defines the tumor‐suppressive role of OTUD1 in colon cancer development. Loss of OTUD1 in colon cancer leads to IREB2 ubiquitination and degradation, which in turn suppresses TFRC expression and limits iron transportation, eventually enhancing tumor cell resistance to ferroptosis and immune eradication. Therefore, the identification of OTUD1 as a modulator of iron metabolism offers a potential target of cancer immunotherapy.
Materials and Methods
Mice
Otud1 −/− mice were purchased from Nanjing Biomedical Research Institute of Nanjing University. All animals were maintained in SPF (special pathogen‐free) environment. All sex‐ and age‐matched animal experimental procedures are approved by the ethics committee of Peking University Health Science Center (approved number LA2016240).
Patients and specimens
Human colorectal adenocarcinoma and matched normal tissues were obtained from patients undergoing colon cancer surgery at Beijing Cancer Hospital. All procedures were conducted under the approval of the Ethics Committee of Peking University Health Science Center, and informed patient consent was obtained from all subjects in advance of sample collection (in accordance with the Helsinki Declaration).
Induction of CAC (Colitis‐associated Cancer)
For induction of CAC, 6‐ to 8‐week‐old Otud1 −/− and wild‐type (WT) mice were used. Seven days after a single intraperitoneal injection with 10 mg/kg of azoxymethane (AOM) (Sigma, A5486‐25MG), mice were treated with 1.5% (weight/volume) dextran sulfate sodium (DSS) (MP, 0216011090) for three cycles. 1 cycle includes 4 days DSS treatment and followed 14 days resting (drinking regular water). After three cycles, mice were sacrificed within 2 weeks (Thaker et al, 2012).
Tumor transplantation
6‐ to 8‐week‐old C57BL/6 and BALB/c mice were inoculated subcutaneously with murine LLC cells and CT26 cells (1 × 10⁶) overexpressing mock, OTUD1, or OTUD1C320S. Tumor volume was calculated as (length × width2)/2. Tumor‐bearing mice were euthanized when tumor size reached 2,000 mm3. C57BL/6 and BALB/c mice were purchased from Beijing Vital River Laboratory Animal Technology Co., Ltd.
For the vaccine/challenge experiment, BALB/c mice were immunized with 1 × 10⁶ OTUD1‐expressing or mock CT26 cells in the left flank and challenged with 2 × 10⁶ wild‐type CT26 cells in the right flank 10 days later.
Preparation of VE nanoparticles
To prepare VE nanoparticles, 2.15 mg of vitamin E (VE) (Aladdin) and 2.53 mg of D‐α‐tocopheryl polyethylene glycol succinate (TPGS) (Sigma‐Aldrich) were dissolved in 500 ml of tetrahydrofuran (THF). Then, 7 ml of distilled water was added drop by drop under ultrasonication for uniform dispersion. After that, the organic solvent of THF was removed through centrifugal ultra‐filtration (molecular weight cutoff: 10,000). Upon centrifugation for 3–4 times, the nanoparticle suspension was fixed to the volume of 1 ml.
Co‐immunoprecipitation and immunoblot analysis
HEK293T cells were transfected with indicated plasmids and lysed by co‐immunoprecipitation lysis buffer (10% glycerol, 0.5% NP‐40, 150 mM NaCl, 0.1 mM EDTA) with protease inhibitor cocktail (Roche). Cell lysates were incubated with anti‐FLAG antibody (Sigma, F3165) and protein A/G (Santa Cruz Biotechnology, sc‐2003) or S‐protein agarose (Novagen, 69704‐3). The beads were washed three times by PBSN (PBS containing 0.1% NP‐40) and subjected to SDS–PAGE. Antibodies against IREB2 (Proteintech, 23829‐1‐AP), OTUD1 (homemade) (Lu et al, 2018), TFRC (abcam, ab214039), FBXL5 (Abclonal, A5602), Ub (FK2) (LifeSensors, LSS‐AB120), HMGB1 (abcam, ab79823), HSP70 (abcam, ab181606), HSP90 (ZSGB‐BIO, TA‐12), FLAG (Sigma, F3165), GFP (RayAntibody, RM1008), HA (Sigma, H3663), and GAPDH (RayAntibody, RM2002) were used in this study.
In vitro and in vivo ubiquitination assay
For in vitro deubiquitination assay, purified IREB2‐Ub protein was incubated with purified His‐OTUD1 or His‐OTUD1C320S protein in 5 ×deubiquitination buffer (100 mM Tris–HCl, 250 mM NaCl, 25 mM MgCl2, 5 mM 2‐mercaptoethanol, 50% glycerol) for 2 h at 37°C. The reaction mixtures were subjected to Western blot analysis.
For in vivo deubiquitination assays, HEK293T cells were transfected with FLAG‐IREB2, GFP‐OTUD1 with or without His‐Ub. 24 h later, cells were lysed with co‐immunoprecipitation lysis buffer mentioned above and were subjected to affinity purification with anti‐FLAG M2 beads. After washing with PBSN three times, the binding components were analyzed by Western blot.
Protein half‐life assay
For the IREB2 half‐life assay, CT26 stably transfected cells and OTUD1 −/− NCM460 cells were treated with the protein synthesis inhibitor cycloheximide (Biorbyt, 100 μg/ml) for the indicated durations before collection. Endogenous IREB2 was measured by anti‐IREB2 antibody.
Flag pull‐down assay
HEK293T cells were transfected with plasmid expressing mock or FLAG‐tagged IREB2. After 24 h, cells were lysed with co‐immunoprecipitation lysis buffer. FLAG‐IREB2 protein was enriched with anti‐FLAG M2 beads (Sigma, F2426) and incubated with colon tissue lysates from wild‐type mice in RIPA buffer (50 mM Tris–HCl (pH = 7.5), 150 mM NaCl, 1% NP‐40, 0.1% SDS) at 4°C overnight. The binding components were eluted with 3×FLAG peptide (Sigma, F4799). The samples were subjected to NuPAGE 4–12% gel (Invitrogen) and sliver staining (Pierce, 24612). The excised gel segments were subjected to mass spectrum analysis.
Mass spectrum analysis
After sliver staining of a gel, excised gel segments were subjected to in‐gel trypsin digestion and dried. Peptides were dissolved in 10 μl 0.1% formic acid and auto‐sampled directly onto a 100 μm × 10 cm fused silica emitter made in our laboratory packed with reversed‐phase ReproSil‐Pur C18‐AQ resin (3 μm and 120 Å; Ammerbuch, Germany). Samples were then eluted for 50 min with linear gradients of 5–32% acetonitrile in 0.1% formic acid at a flow rate of 300 nl/min. Mass spectrometry data were acquired with an LTQ Orbitrap Elite mass spectrometer (Thermo Fisher Scientific) equipped with a nanoelectrospray ion source (Proxeon Biosystems). Fragmentation in the LTQ was performed by collision‐induced dissociation (normalized collision energy, 35%; activation Q, 0.250; activation time, 10 ms) with a target value of 3,000 ions. The raw files were searched with the SEQUEST engine against a database from the UniProt protein sequence database.
H&E (hematoxylin–eosin) staining and IHC (immunohistochemistry)
For H&E staining, the tissues were fixed with formaldehyde and then embedded with paraffin. Sections of 0.5 mm thickness were used for H&E staining with a standard protocol. Images were acquired using an Olympus IX51 microscope.
For detecting the expression of OTUD1 in colorectal cancer patients, colon disease‐associated tissue microarrays (CO809a and CoI05‐118e) were ordered from Alenabio. Sections were dehydrated with graded concentrations of ethanol, and endogenous peroxidase activity was blocked with 3% (v/v) hydrogen peroxide in methanol for 10 min. Antigen retrieval was carried out using 1 mM EDTA buffer (pH 9.0) in a microwave oven. Sections were then incubated with rabbit anti‐human polyclonal OTUD1 (abcam, ab122481). Sections were developed with the Envision Detection System (Dako) and counterstained with hematoxylin.
For detection of tumor‐infiltrating T cells, colon tumors were removed and prepared as described above. Antibody against CD3 (abcam, ab5690) was used.
Immunofluorescence and confocal microscopy
HEK293T cells were transfected with the indicated plasmids and seeded on cover glass. After 12 h, cells were fixed with 4% paraformaldehyde, permeabilized with 0.5% Triton X‐100, and blocked by 1% BSA, followed by staining with specific antibodies and DAPI. Images were acquired with a Nikon TCS A1 microscope.
Preparation of lymphocytes
For isolation of tumor‐infiltrating lymphocytes (Dan et al, 2020), tumor tissues were cut into small pieces and incubated with digestion solution containing 0.5 mg/ml collagenase D (Roche, 11088866001) and 0.1 mg/ml DNase I (Sigma, DN25) at 37°C. After passed through filters, mononuclear cells were enriched through 40/80% Percoll (GE Healthcare) gradient centrifugation.
For lamina propria mononuclear cells (LPMC), mice intestines were removed and cut into 1.5 cm pieces. The pieces were incubated in HBSS with 5 mM EDTA for 20 min at 37°C. After that, the intestinal epithelial cells (IECs) were removed by intensive vortexing and passing through a 100‐μm cell strainer. Small pieces of tissues were then placed in digestion solution containing Collagenase D and DNase I at 37°C for 40 min with slow rotation. After passed through filters, lamina propria lymphocytes were isolated by Percoll reagent.
Flow cytometry
For intracellular ROS detection, cells were incubated with 5 μM DCFDA in FBS‐free medium at 37°C for 30 min, followed by acquisition on a flow cytometry analyzer (BD Biosciences). For cell cycle analysis, cells were fixed with 70% ethanol overnight, followed by treatment with RNase A for 30 min and staining with propidium iodide. To analyze cell surface maker expression, cells were incubated with specific antibodies for 30 min at room temperature.
Following antibodies were used: anti‐CD4 (eBioscience, GK1.5), anti‐CD8 (eBioscience, 53‐6.7), anti‐CD45 (eBioscience, 30‐F11), anti‐mouse TFRC (BioLegend, RI7217), and anti‐human TFRC (BioLegend, CY1G4).
Quantitative real‐time PCR
Total RNA was extracted with TRIzol reagent (Invitrogen) and then reverse‐transcribed into cDNA according to the manufacturer's protocol (Vazyme, R223‐01). The cDNA quantification was done using ABI 7500 Detection System (all primers, Appendix Table S1).
Routine blood test
Wild‐type and Otud1 −/− mice were fed with iron deficiency diet (Moldiets, M11101C) for 4 weeks. The inner canthus blood was collected from mice and subjected to the routine blood test using a HEMAVET 950FS Veterinary Multi‐species Hematology System (Drew scientific), following the manufacturer’s instruction.
Intracellular iron detection
For intracellular iron detection, intestinal epithelial cells (IECs) from mice with supplementation of 1.5‰ (weight/volume) ferrous gluconate (State Drugs Administration License No.: GUOYAOZHUNZI H10880040), CT26 cells, and NCM460 cells with treatment of AFC (Aladdin, A100170) or hemin (Selleck, S5645) were collected. The intracellular iron was detected with Iron Colorimetric Assay Kit (Applygen, E1042) according to the manufacturer's protocol.
Intratumoral iron detection
CT26‐mock, OTUD1, and OTUD1C320S tumors were digested with nitric acid, and iron concentration was assessed by inductively coupled plasma mass spectrometry (ICP‐MS‐7800) (Agilent). The instrument settings were as follows: RF power, 1,550 W; Coolant Gas Flow, 15 l/min; Auxiliary Gas Flow, 0.9 l/min; carrier gas flow, 1.0 l/min; Compensation gas flow, 0.1 l/min; Resolution ratio, 0.8 ± 0.1 µ; Measuring Method, Jumping peak; Measuring point/peak, 3; Integral time, 0.1 s/point; Chamber temperature, 2°C; Vacuum chamber pressure, 6.6 × 10⁻⁵ Pa; Extract2, −190 V; Omega Bias‐ce, −90 V; and Omega Lens‐ce, 10 V.
LDH release assay
The CytoTox 96 Non‐Radioactive Cytotoxicity Assay (Promega) was used to detect lactate dehydrogenase (LDH) release and cell death according to the manufacturer’s instructions.
ATP (adenosine triphosphate) detection
NCM460 cells were treated with several cell death inducers including Erastin (Targetmol, T1765), RSL3 (Selleck, S8155), TNFα (PeproTech, 300‐01A), CHX (Biorbyt, orb153092), Z‐VAD‐FMK (Selleck, S8102), and H2O2 (Sigma, 88597‐100ML‐F) for 24 h. Bulk tumor tissue was placed on a 40‐μm cell strainer and centrifuged at 40 g for 5 min to remove surface liquid. Samples were then spun at 400 g for another 10 min, and fluid was collected as tumor interstitial fluid (TIF) (Wiig et al, 2010). The cell culture medium or TIF was collected, and ATP was detected using ATP assay kit (Nanjing Jiancheng Bioengineering Institute, A095) according to the manufacturer's protocol.
Quantitative proteomic analysis
Wild‐type and OTUD1 −/− NCM460 cells were homogenized in co‐immunoprecipitation lysis buffer for total protein sample preparation. Tumor interstitial fluid (TIF) from CT26‐mock or CT26‐OTUD1 tumors was prepared as mentioned above. In total, 100 µg of protein sample from each subject was subjected to mass spectrometry analysis. Parameters of MS and enrichment analysis methods are the same as described above.
Statistical analysis
Statistical analysis was performed using Prism GraphPad software v7.0. Differences between two groups were calculated using a two‐tailed Student’s t‐test. In tumor transplantation experiments, mice survival status was analyzed by log‐rank (Mantel–Cox) test. P < 0.05 was considered significant.
Author contributions
DL, JS, and FY conceived and designed the experiments. JS and TL performed most of the experiments and analyzed the data. YueY and ZL performed NP‐VE synthesis and cellular application. WZ provided human samples. FY supervised this research. DL, JS, YuxY, and FY wrote the paper.
Conflict of interest
The authors declare that they have no conflict of interest.
Supporting information
Appendix
Expanded View Figures PDF
Source Data for Expanded View and Appendix
Review Process File
Source Data for Figure 1
Source Data for Figure 2
Source Data for Figure 3
Source Data for Figure 4
Source Data for Figure 6
Acknowledgements
This work was supported by grants including the National Key Research and Development Program of China (2016YFA0500300 and 2020YFA0707800 to F.Y.), the National Natural Science Foundation of China (grants 31570891, 31872736, and 32022028 to F.Y., as well as grants 82022032 and 81991505 to D.L.), Clinical Medicine Plus X‐ Young Scholars Project, Peking University, the fundamental Research funds for the Central Universities (grant PKU2020LCXQ014 to D.L. and grant PKU2020LCXQ009 to F.Y.), and the Fund for Fostering Young Scholars of Peking University Health Science Center (grant BMU2018YJ003 to D.L.).
EMBO reports (2021) 22: e51162.
Footnotes
Correction added on 3 February 2021, after first online publication: The position of the CD8+ T cells and CD4+ T cells data in the graph was switched. The CD8+ T cells data is now correctly shown on the left and CD4+ T cells data is now correctly shown on the right.
Contributor Information
Yuxin Yin, Email: yinyuxin@bjmu.edu.cn.
Dan Lu, Email: taotao@bjmu.edu.cn.
Fuping You, Email: fupingyou@bjmu.edu.cn.
Data availability
The RNA‐seq data that support the findings in this study have been deposited in the GEO database with the accession code GSE140059 (https://www.ncbi.nlm.nih.gov/geo/query/acc.cgi?acc=GSE140059).
References
- Arosio P, Elia L, Poli M (2017) Ferritin, cellular iron storage and regulation. IUBMB Life 69: 414–422 [DOI] [PubMed] [Google Scholar]
- Badgley MA, Kremer DM, Maurer HC, DelGiorno KE, Lee HJ, Purohit V, Sagalovskiy IR, Ma A, Kapilian J, Firl CEM et al (2020) Cysteine depletion induces pancreatic tumor ferroptosis in mice. Science 368: 85–89 [DOI] [PMC free article] [PubMed] [Google Scholar]
- Bidwell BN, Slaney CY, Withana NP, Forster S, Cao Y, Loi S, Andrews D, Mikeska T, Mangan NE, Samarajiwa SA et al (2012) Silencing of Irf7 pathways in breast cancer cells promotes bone metastasis through immune escape. Nat Med 18: 1224–1231 [DOI] [PubMed] [Google Scholar]
- Carneiro AP, Reis CF, Morari EC, Maia YC, Nascimento R, Bonatto JM, de Souza MA, Goulart LR, Ward LS (2014) A putative OTU domain‐containing protein 1 deubiquitinating enzyme is differentially expressed in thyroid cancer and identifies less‐aggressive tumours. Br J Cancer 111: 551–558 [DOI] [PMC free article] [PubMed] [Google Scholar]
- Caro JJ, Salas M, Ward A, Goss G (2001) Anemia as an independent prognostic factor for survival in patients with cancer: a systemic, quantitative review. Cancer 91: 2214–2221 [PubMed] [Google Scholar]
- Dan L, Liu L, Sun Y, Song J, Yin Q, Zhang G, Qi F, Hu Z, Yang Z, Zhou Z et al (2020) The phosphatase PAC1 acts as a T cell suppressor and attenuates host antitumor immunity. Nat Immunol 21: 287–297 [DOI] [PubMed] [Google Scholar]
- Daniel D, Crawford J (2006) Myelotoxicity from chemotherapy. Semin Oncol 33: 74–85 [DOI] [PubMed] [Google Scholar]
- Eil R, Vodnala SK, Clever D, Klebanoff CA, Sukumar M, Pan JH, Palmer DC, Gros A, Yamamoto TN, Patel SJ et al (2016) Ionic immune suppression within the tumour microenvironment limits T cell effector function. Nature 537: 539–543 [DOI] [PMC free article] [PubMed] [Google Scholar]
- Friedmann Angeli JP, Krysko DV, Conrad M (2019) Ferroptosis at the crossroads of cancer‐acquired drug resistance and immune evasion. Nat Rev Cancer 19: 405–414 [DOI] [PubMed] [Google Scholar]
- Galluzzi L, Buque A, Kepp O, Zitvogel L, Kroemer G (2017) Immunogenic cell death in cancer and infectious disease. Nat Rev Immunol 17: 97–111 [DOI] [PubMed] [Google Scholar]
- Gao G, Li J, Zhang Y, Chang YZ (2019) Cellular iron metabolism and regulation. Adv Exp Med Biol 1173: 21–32 [DOI] [PubMed] [Google Scholar]
- Hassannia B, Vandenabeele P, Vanden Berghe T (2019) Targeting ferroptosis to iron out cancer. Cancer Cell 35: 830–849 [DOI] [PubMed] [Google Scholar]
- Kleinewietfeld M, Manzel A, Titze J, Kvakan H, Yosef N, Linker RA, Muller DN, Hafler DA (2013) Sodium chloride drives autoimmune disease by the induction of pathogenic TH17 cells. Nature 496: 518–522 [DOI] [PMC free article] [PubMed] [Google Scholar]
- Lei G, Zhang Y, Koppula P, Liu X, Zhang J, Lin SH, Ajani JA, Xiao Q, Liao Z, Wang H et al (2020) The role of ferroptosis in ionizing radiation‐induced cell death and tumor suppression. Cell Res 30: 146–162 [DOI] [PMC free article] [PubMed] [Google Scholar]
- Lu D, Song J, Sun Y, Qi F, Liu L, Jin Y, McNutt MA, Yin Y (2018) Mutations of deubiquitinase OTUD1 are associated with autoimmune disorders. J Autoimmun 94: 156–165 [DOI] [PubMed] [Google Scholar]
- Ludwig H, Evstatiev R, Kornek G, Aapro M, Bauernhofer T, Buxhofer‐Ausch V, Fridrik M, Geissler D, Geissler K, Gisslinger H et al (2015) Iron metabolism and iron supplementation in cancer patients. Wien Klin Wochenschr 127: 907–919 [DOI] [PMC free article] [PubMed] [Google Scholar]
- Minagawa S, Yoshida M, Araya J, Hara H, Imai H, Kuwano K (2020) Regulated necrosis in pulmonary disease: a focus on necroptosis and ferroptosis. Am J Respir Cell Mol Biol 62: 554–562 [DOI] [PubMed] [Google Scholar]
- Raza M, Chakraborty S, Choudhury M, Ghosh PC, Nag A (2014) Cellular iron homeostasis and therapeutic implications of iron chelators in cancer. Curr Pharm Biotechnol 15: 1125–1140 [DOI] [PubMed] [Google Scholar]
- Rouault TA (2006) The role of iron regulatory proteins in mammalian iron homeostasis and disease. Nat Chem Biol 2: 406–414 [DOI] [PubMed] [Google Scholar]
- Salahudeen AA, Thompson JW, Ruiz JC, Ma HW, Kinch LN, Li Q, Grishin NV, Bruick RK (2009) An E3 ligase possessing an iron‐responsive hemerythrin domain is a regulator of iron homeostasis. Science 326: 722–726 [DOI] [PMC free article] [PubMed] [Google Scholar]
- Samaniego F, Chin J, Iwai K, Rouault TA, Klausner RD (1994) Molecular characterization of a second iron‐responsive element binding protein, iron regulatory protein 2. Structure, function, and post‐translational regulation. J Biol Chem 269: 30904–30910 [PubMed] [Google Scholar]
- Sousa L, Oliveira MM, Pessoa MTC, Barbosa LA (2020) Iron overload: effects on cellular biochemistry. Clin Chim Acta 504: 180–189 [DOI] [PubMed] [Google Scholar]
- Stockwell BR, Friedmann Angeli JP, Bayir H, Bush AI, Conrad M, Dixon SJ, Fulda S, Gascon S, Hatzios SK, Kagan VE et al (2017) Ferroptosis: a regulated cell death nexus linking metabolism, redox biology, and disease. Cell 171: 273–285 [DOI] [PMC free article] [PubMed] [Google Scholar]
- Thaker AI, Shaker A, Rao MS, Ciorba MA (2012) Modeling colitis‐associated cancer with azoxymethane (AOM) and dextran sulfate sodium (DSS). J Vis Exp 67: 4100 [DOI] [PMC free article] [PubMed] [Google Scholar]
- Torti SV, Manz DH, Paul BT, Blanchette‐Farra N, Torti FM (2018) Iron and cancer. Annu Rev Nutr 38: 97–125 [DOI] [PMC free article] [PubMed] [Google Scholar]
- Ubellacker JM, Tasdogan A, Ramesh V, Shen B, Mitchell EC, Martin‐Sandoval MS, Gu Z, McCormick ML, Durham AB, Spitz DR et al (2020) Lymph protects metastasizing melanoma cells from ferroptosis. Nature 585: 113–118 [DOI] [PMC free article] [PubMed] [Google Scholar]
- Vashisht AA, Zumbrennen KB, Huang X, Powers DN, Durazo A, Sun D, Bhaskaran N, Persson A, Uhlen M, Sangfelt O et al (2009) Control of iron homeostasis by an iron‐regulated ubiquitin ligase. Science 326: 718–721 [DOI] [PMC free article] [PubMed] [Google Scholar]
- Vodnala SK, Eil R, Kishton RJ, Sukumar M, Yamamoto TN, Ha NH, Lee PH, Shin M, Patel SJ, Yu Z et al (2019) T cell stemness and dysfunction in tumors are triggered by a common mechanism. Science 363: eaau0135 [DOI] [PMC free article] [PubMed] [Google Scholar]
- Wallander ML, Leibold EA, Eisenstein RS (2006) Molecular control of vertebrate iron homeostasis by iron regulatory proteins. Biochim Biophys Acta 1763: 668–689 [DOI] [PMC free article] [PubMed] [Google Scholar]
- Wang D, Fu Q, Tang J, Hackett M, Wang Y, Liu F (2015) Molecular‐matched materials for anticancer drug delivery and imaging. Nanomedicine (Lond) 10: 3003–3013 [DOI] [PMC free article] [PubMed] [Google Scholar]
- Wang W, Green M, Choi JE, Gijon M, Kennedy PD, Johnson JK, Liao P, Lang X, Kryczek I, Sell A et al (2019) CD8(+) T cells regulate tumour ferroptosis during cancer immunotherapy. Nature 569: 270–274 [DOI] [PMC free article] [PubMed] [Google Scholar]
- Wiig H, Tenstad O, Iversen PO, Kalluri R, Bjerkvig R (2010) Interstitial fluid: the overlooked component of the tumor microenvironment? Fibrogenesis Tissue Repair 3: 12 [DOI] [PMC free article] [PubMed] [Google Scholar]
- Wilck N, Matus MG, Kearney SM, Olesen SW, Forslund K, Bartolomaeus H, Haase S, Mahler A, Balogh A, Marko L et al (2017) Salt‐responsive gut commensal modulates TH17 axis and disease. Nature 551: 585–589 [DOI] [PMC free article] [PubMed] [Google Scholar]
- Zhang Z, Fan Y, Xie F, Zhou H, Jin K, Shao L, Shi W, Fang P, Yang B, van Dam H et al (2017) Breast cancer metastasis suppressor OTUD1 deubiquitinates SMAD7. Nat Commun 8: 2116 [DOI] [PMC free article] [PubMed] [Google Scholar]
- Zhang Z, Zhang Y, Xia S, Kong Q, Li S, Liu X, Junqueira C, Meza‐Sosa KF, Mok TMY, Ansara J et al (2020) Gasdermin E suppresses tumour growth by activating anti‐tumour immunity. Nature 579: 415–420 [DOI] [PMC free article] [PubMed] [Google Scholar]
- Zumbrennen KB, Wallander ML, Romney SJ, Leibold EA (2009) Cysteine oxidation regulates the RNA‐binding activity of iron regulatory protein 2. Mol Cell Biol 29: 2219–2229 [DOI] [PMC free article] [PubMed] [Google Scholar]
Associated Data
This section collects any data citations, data availability statements, or supplementary materials included in this article.
Supplementary Materials
Appendix
Expanded View Figures PDF
Source Data for Expanded View and Appendix
Review Process File
Source Data for Figure 1
Source Data for Figure 2
Source Data for Figure 3
Source Data for Figure 4
Source Data for Figure 6
Data Availability Statement
The RNA‐seq data that support the findings in this study have been deposited in the GEO database with the accession code GSE140059 (https://www.ncbi.nlm.nih.gov/geo/query/acc.cgi?acc=GSE140059).


