

Abstract
Background.
Improvements in survival after burns have resulted in more patients being discharged home after severe injury. However, the postdischarge health care needs of burn survivors are not well understood. We aimed to determine the rate and causes of unplanned presentation to acute care facilities in the 5 years after major burn injury.
Methods.
Data derived from several population-based administrative databases were used to conduct a retrospective cohort study. All patients aged ≥16 years who survived to discharge after a major burn injury in 2003–2013 were followed for 1–5 years. All emergency department visits and unplanned readmissions were identified and classified by cause. Factors associated with emergency department visits were modeled using negative binomial generalized estimating equations. Factors associated with readmission were modeled using multivariable competing risk regression.
Results.
We identified 1,895 patients who survived to discharge; 68% of patients had at least one emergency department visit and 30% had at least one readmission. Five-year mortality was 10%. The most common reason for both emergency department visits and readmissions was traumatic injury. After risk adjustment, patients who received their index care in a burn center experienced significantly less need for subsequent unplanned acute care, fewer emergency department visits (relative risk 0.61, 95% confidence interval, 0.52–0.72), and fewer hospital readmissions (hazard ratio 0.77, 95% confidence interval, 0.65–0.92).
Conclusion.
Acute health care utilization is frequent after burn injury and is most commonly related to traumatic injuries. Burn-related events are uncommon beyond 30 days after discharge, suggesting low rates of burn recidivism. Patients treated at burn centers have significantly reduced unplanned health care utilization after their injury.
Despite an overall reduction in burn incidence, hundreds of thousands of patients continue to be admitted to hospital each year for the treatment of major burn injury.1 Improvements in burn-related mortality have occurred such that most patients survive to discharge.2–4 While the nature of burn injury suggests that some patients will have ongoing complex care needs after discharge, the post-acute health care needs of burn survivors are not well understood.
Burn care is largely provided in specialized burn centers,5,6 despite a lack of evidence to suggest that care in these centers results in lower mortality.7,8 However, burn centers might have resources that facilitate improved care transitions, resulting in reduced post-acute health care use. Given that readmissions and emergency department (ED) visits might represent gaps in the transition of care from the hospital setting, they are increasingly being utilized as quality indicators.9 Rates of these events might therefore be an indicator of the utility and quality of burn center care. Furthermore, an understanding of the rate and causes of acute health care use after discharge might inform the development of targeted interventions to improve long-term outcomes after burn injury.
The objective of this study was to determine the rate and principal causes of unplanned readmissions and emergency department visits in the 5 years after major burn injury. Furthermore, we sought to identify the patient and/or injury factors associated with each of these events. We hypothesized that treatment at a burn center would be associated with lower rates of post-acute unplanned health care utilization.
METHODS
Study design.
We conducted a population-based, retrospective cohort study in Ontario, Canada, using health administrative data. This study was approved by the Research Ethics Board at Sunnybrook Health Sciences Centre.
Data sources.
Data were derived from several administrative databases: (1) the Discharge Abstract Database (DAD), which contains demographic, diagnostic (including burn injury characteristics), procedural, hospital, and discharge information for all hospital admissions in the province of Ontario; (2) the National Ambulatory Care Reporting System (NACRS), which captures demographic, diagnostic, hospital, and discharge information for all emergency department visits in the province of Ontario; (3) the Registered Persons Database, which contains vital statistics data for all residents of the province of Ontario who are alive and eligible for health care coverage; (4) the Office of the Register General—Deaths database, which contains information on date and cause of death for all residents eligible for health care coverage in Ontario. These datasets were linked using unique encoded identifiers and analyzed at the Institute for Clinical Evaluative Sciences. Similar to other Canadian provinces, the government of Ontario administers a single payer health care system that universally funds all hospital, laboratory, and physician services for eligible residents. Therefore, these datasets include information for all eligible residents in the province. Diagnostic information in these datasets is recorded according to the Canadian version of the 10th revision of the International Classification of Diseases and Related Health Problems. We previously have validated diagnoses codes for the identification and characterization of major burn injury.10
Study population.
We used the DAD to identify all patients aged ≥16 years who were admitted to the hospital for the treatment of major burn injury between April 1, 2003, and March 31, 2013, and survived to discharge. Major burn injury was defined in accordance with the American Burn Association criteria for referral to a burn center11: any burn resulting in (1) 10% total body surface area (TBSA) burn, or (2) full-thickness burns to the face, feet, hands, and perineum, or (3) any burn with inhalation injury. Individuals lacking a valid Ontario health card or who sustained concurrent major trauma with their burn were excluded.
Exposure of interest.
We hypothesized that patients who received their initial burn care at a regional burn center might have reduced postdischarge acute health care utilization compared with those treated outside of burn centers. In Ontario, specialized burn care is provided at 2 adult regional burn centers, one of which is verified by the American Burn Association. We have previously demonstrated that in Ontario, ≈30% of patients with ≥20% TBSA burns receive care outside of burn centers.12
Outcomes.
The primary outcomes of interest were ED visits and unplanned readmissions during the 5 years after discharge from the index burn admission. Emergency department visits were identified in NACRS and categorized according to the main reason for the visit. All readmissions were identified in the DAD, where each readmission is categorized as urgent or elective. To focus on modifiable events, we included only unplanned readmissions, recognizing that elective readmissions are often an appropriate management strategy for burns in the course of burn reconstruction. Similarly, we hypothesized that ED visits and readmissions occurring within 72 hours of discharge might be distinct from those occurring later after discharge, in that they likely represent ongoing sequelae of the index admission, so these were excluded. To mitigate overlap between ED visits and readmissions, ED visits leading to readmission were considered only as a readmission and not counted as ED visits. All patients had a minimum follow-up of 1 year.
We considered deaths occurring during the 5 years after discharge as a secondary outcome. All deaths were captured through Office of the Register General—Deaths and classified as in-hospital if associated with a DAD record, as in ED if associated with a NACRS record alone, and as occurring out of hospital if there was no associated DAD or NACRS record.
Covariates.
We considered several patient characteristics as potential confounders. These included age, sex, preinjury comorbidity burden, socioeconomic status, and urban/rural residence. Comorbidity burden was estimated using the resource utilization band of the Johns Hopkins Adjusted Clinical Groups case mix system, which assigns patients to 1 of 6 morbidity categories based on the rate and severity of prior health care utilization.13 For the purposes of our analysis, we collapsed categories 0 and 1, representing non-healthy and healthy users, into a single category. Using each patient’s postal code, the median neighborhood income was determined; income quintiles then were used as a marker of socioeconomic status. Patient residence was classified as urban or rural based on the Rurality Index of Ontario, where a score ≥45 is considered rural; this considers population density as well as the distance each patient must travel to the nearest basic and advanced referral center.14
We also considered several injury-specific variables as potential confounders. These were derived from diagnoses codes in the DAD pertaining to the index admission, and included total body surface area (TBSA) burned, presence of inhalation injury, and mechanism of the burn (flame, electrical, or contact). We also considered the disposition of each patient’s index admission, classified as discharge to: home, home with homecare, another inpatient facility, rehabilitation or long-term care facility, or other. Patients discharged home with homecare receive in-home nursing visits for wound or other care (eg, intravenous antibiotics). We were unable to differentiate between discharge to a rehabilitation or long-term care facility in these datasets.
Statistical analysis.
Descriptive statistics were calculated for the entire study population. We compared patient and injury characteristics between patients with and without an ED visit, as well as with and without a readmission. The Wilcoxon rank-sum test was used to compare non-normally distributed continuous variables, while the χ2 test was used for categorical variables. Crude rates of ED visits and readmissions per 100 person years were estimated.
Separate modeling approaches were undertaken to determine the factors associated with the risk of ED visits and readmission. Given the greater frequency of ED visits relative to readmissions, and the rarity of death preceding ED visits, these were modeled as a count outcome, using negative binomial generalized estimating equations. A negative binomial distribution was utilized given the significant overdispersion in the ED visit count. To account for varying follow-up times, each patient’s total follow-up time was log-transformed and included in the model as an offset term. Follow-up time was calculated as the time from index discharge to the end of follow up; follow-up ended at March 31, 2014, or death, whichever came first. Generalized estimating equations were used to account for the clustering of patient outcomes at the hospital level. Variables were chosen a priori for inclusion in the model, based on clinical relevance, and differences identified on univariate analysis.
In choosing the best approach to model readmissions after discharge, we considered the presence of the competing risk of death, and the likelihood that readmissions and mortality are not independent events, which limits application of traditional survival analysis. A competing risk is an event whose occurrence precludes the occurrence of the event of interest.15 As such, readmission hazards were estimated using a time-to-event approach that explicitly accounted for the competing risk of death. The cumulative incidence of readmission by 5 years was estimated, and factors associated with the time to first readmission were identified using Fine and Gray multivariable risk regression.16 Patients were censored at the end of follow-up or 5 years, whichever came first. To determine the impact of accounting for the competing risk, the subdistribution hazards were compared with cause-specific hazards derived from a Cox Proportional hazards model. Variables were chosen a priori for inclusion in the model, based on clinical relevance and differences identified in the cumulative incidence of readmission among patient and injury subgroups. Proportionality of hazards was confirmed by visually examining the cumulative hazards versus time plot, and by using interaction terms. Where the proportionality assumption was violated, interaction terms were included in the model and re-examined. All analyses were conducted using SAS version 9.4 (Cary, NC).
RESULTS
We identified 1,895 patients who survived to discharge after a major burn injury. Patients were most commonly young, urban-dwelling males, of lower median income with moderate preinjury comorbidity (Table I). The median TBSA burned was 15% (interquartile range, 5–25). Most sustained flame burns, and 9% sustained an inhalation injury. Approximately half of all patients were treated at a burn center, and the majority were discharged home: 39% with homecare, and 39% without.
Table I.
Patient and injury characteristics by status at 5 years
| All | ED visit not leading to admission | P value | Readmission | P value | Death | |||
|---|---|---|---|---|---|---|---|---|
| ≥1 | None | ≥1 | None | |||||
| No. of patients (%) | 1,895 | 1,290 (68) | 605 (32) | 571 (30) | 1,324 (70) | 185 (10) | ||
| Median age, years (IQR) | 44 (30–56) | 44 (29–55) | 45 (34–57) | .006 | 52 (40–66) | 41 (28–51) | <.001 | 68 (54–76) |
| Male (%) | 1,408 (74) | 956 (74) | 452 (75) | .74 | 394 (69) | 1,014 (77) | <.001 | 113 (61) |
| Income quintile (%) | .07 | .003 | ||||||
| 1 (Lowest) | 464 (25) | 337 (26) | 127 (21) | 149 (27) | 315 (24) | 64 (35) | ||
| 2 | 413 (22) | 286 (22) | 127 (21) | 147 (26) | 266 (20) | 46 (25) | ||
| 3 | 346 (18) | 224 (18) | 122 (20) | 104 (19) | 242 (18) | 23 (13) | ||
| 4 | 379 (20) | 249 (20) | 130 (22) | 95 (17) | 284 (22) | 22 (12) | ||
| 5 (Highest) | 275 (15) | 179 (14) | 96 (16) | 67 (12) | 208 (16) | 26 (14) | ||
| Rural (%) | 346 (18) | 251 (19) | 95 (16) | .05 | 104 (18) | 242 (18) | .97 | 22 (12) |
| Comorbidity Band (%) | <.001 | <.001 | ||||||
| 1 (Lowest) | 130 (7) | 72 (6) | 58 (10) | 16 (3) | 114 (9) | <5% | ||
| 2 | 246 (13) | 145 (11) | 101 (17) | 46 (8) | 200 (15) | <5% | ||
| 3 | 836 (44) | 546 (42) | 290 (48) | 197 (34) | 639 (48) | 15–20% | ||
| 4 | 383 (20) | 290 (23) | 93 (15) | 128 (22) | 255 (19) | 20–25% | ||
| 5 (Highest) | 295 (16) | 234 (18) | 61 (10) | 184 (32) | 111 (8) | 50–55% | ||
| Median % TBSA (IQR) | 15 (5–25) | 15 (5–25) | 15 (5–25) | .26 | 15 (5–25) | 15 (5–25) | .10 | 15 (5–15) |
| Burn mechanism (%) | .71 | .19 | ||||||
| Flame | 1,002 (53) | 679 (53) | 323 (53) | 298 (52) | 704 (53) | 55–60% | ||
| Contact | 780 (41) | 537 (42) | 243 (40) | 246 (43) | 534 (40) | <5% | ||
| Electrical | 112 (6) | 73 (6) | 39 (6) | 26 (5) | 86 (7) | 40–45% | ||
| Inhalation injury (%) | 167 (9) | 117 (9) | 50 (8) | .56 | 49 (9) | 118 (9) | .82 | 15 (8) |
| Index burn center care (%) | 981 (52) | 638 (49) | 343 (57) | .003 | 247 (43) | 734 (55) | <.001 | 62 (34) |
| Discharge disposition (%) | .15 | <.001 | ||||||
| Home | 747 (39) | 505 (39) | 242 (40) | 185 (32) | 562 (42) | 25–30% | ||
| Homecare | 737 (39) | 516 (40) | 221 (37) | 195 (34) | 542 (41) | 35–40% | ||
| Rehab or LTC | 290 (15) | 183 (14) | 107 (18) | 143 (25) | 147 (11) | 25–30% | ||
| Other inpatient | 82 (4) | 56 (4) | 26 (4) | 29 (5) | 53 (4) | <5% | ||
| Other | 39 (2) | 30 (2) | 8 (1) | 19 (3) | 19 (1) | <5% | ||
Counts <6 suppressed for confidentiality.
IQR, Interquartile range; LTC, long-term care.
The cumulative incidence of readmission, ED visits, and mortality during follow-up are presented in Fig 1. After discharge, we identified 8,210 ED visits among 1,290 patients; overall, 68% of patients had at least one ED visit (interquartile range, 0–5). Eleven percent of patients had 5 or more ED visits per year. The overall rate of ED visits during follow-up was 104 per 100 patient years. Sixteen percent of all ED visits (n = 6,899) resulted in readmission. Compared with patients without an ED visit, those with a visit also had higher levels of preinjury health care use and fewer received burn center care (49 vs 57%) (Table I).
Fig 1.
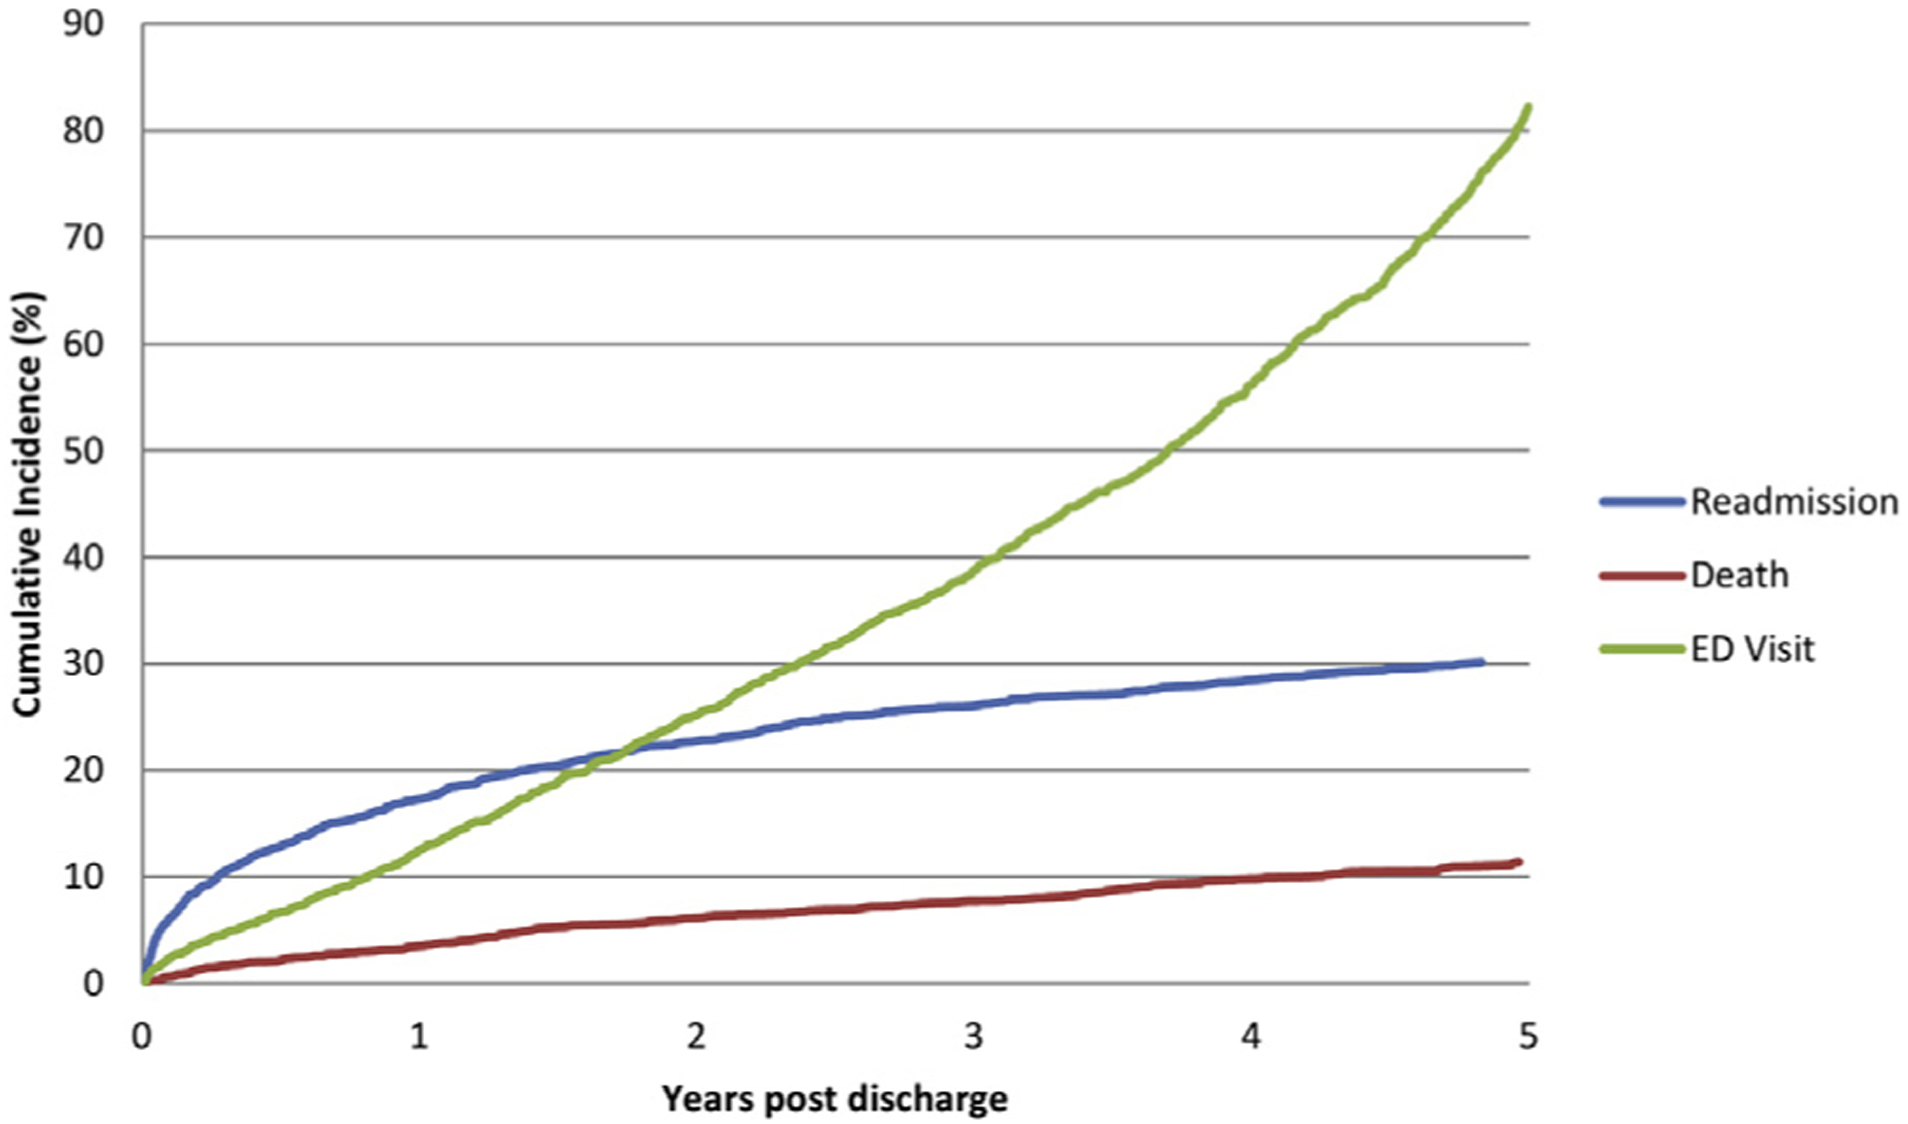
Cumulative incidence of readmission, ED visits, and death during follow-up. ED visits include visits leading to readmission.
Of all ED visits, 23% were related to traumatic injury, 11% were related to mental illness, and 11% were related to post-treatment complications (Table II). Among traumatic injury visits, only 4% were burn-related.
Table II.
Principal causes of ED visits and readmissions
| Principal causes * of ED visits | N (%) |
|---|---|
| ED visits not resulting in admission | 6,899 |
| External cause of injury | 1,604 (23) |
| Falls | 417 |
| Self-harm | 231 |
| Contact with sharp objects | 178 |
| Transport-related | 132 |
| Assault | 129 |
| Foreign body entering skin or natural orifice | 123 |
| Struck or crushed by object | 118 |
| Other unspecified cause of injury | 103 |
| Burns, frostbite, corrosions | 64 |
| Poisoning | 29 |
| Visit related to prior operative treatment | 790 (11) |
| Attention to sutures and dressings | 280 |
| Repeat prescription | 184 |
| Intravenous antibiotics | 133 |
| Examination for operative follow-up | 106 |
| Complication of operative procedure | 87 |
| Mental health | 734 (11) |
| Disorders related to psychoactive substance use | 431 |
| Neurotic and stress-related disorders | 139 |
| Mood disorders | 80 |
| Principal causes† of readmissions | |
| Unplanned readmissions | 1,473 |
| External cause of injury | 234 (16) |
| Burns, frostbite, corrosions | 68 |
| Falls | 46 |
| Self-harm | 20 |
| Assault | 14 |
| Poisoning | 14 |
| Transport-related | 11 |
| Respiratory disease | 185 (13) |
| Chronic lower respiratory diseases | 106 |
| Influenza and pneumonia | 40 |
| Cardiovascular disease | 162 (11) |
| Ischemic heart disease | 56 |
| Heart failure | 36 |
| Gastrointestinal disease | 149 (10) |
| Liver and biliary disease | 59 |
As defined by ICD-10CA diagnosis codes (NACRS).
As defined by ICD-10CA diagnosis codes (DAD).
We identified 1,473 readmissions among 571 patients; overall, 30% of patients had at least one unplanned readmission during the 5 years after discharge (range, 1–61). The rate of unplanned readmissions during follow-up was 19 per 100 patient years. Compared with patients without a readmission, those readmitted were significantly older, of lower socioeconomic status, and had higher levels of preinjury comorbidity (Table I). The cumulative incidence of readmission by age group is presented in Fig 2. Fewer readmitted patients received care at a burn center compared with those not readmitted (43 vs 55%) (Fig 3), and readmitted patients were less likely to have been discharged home after the index admission (66 vs 83%).
Fig 2.
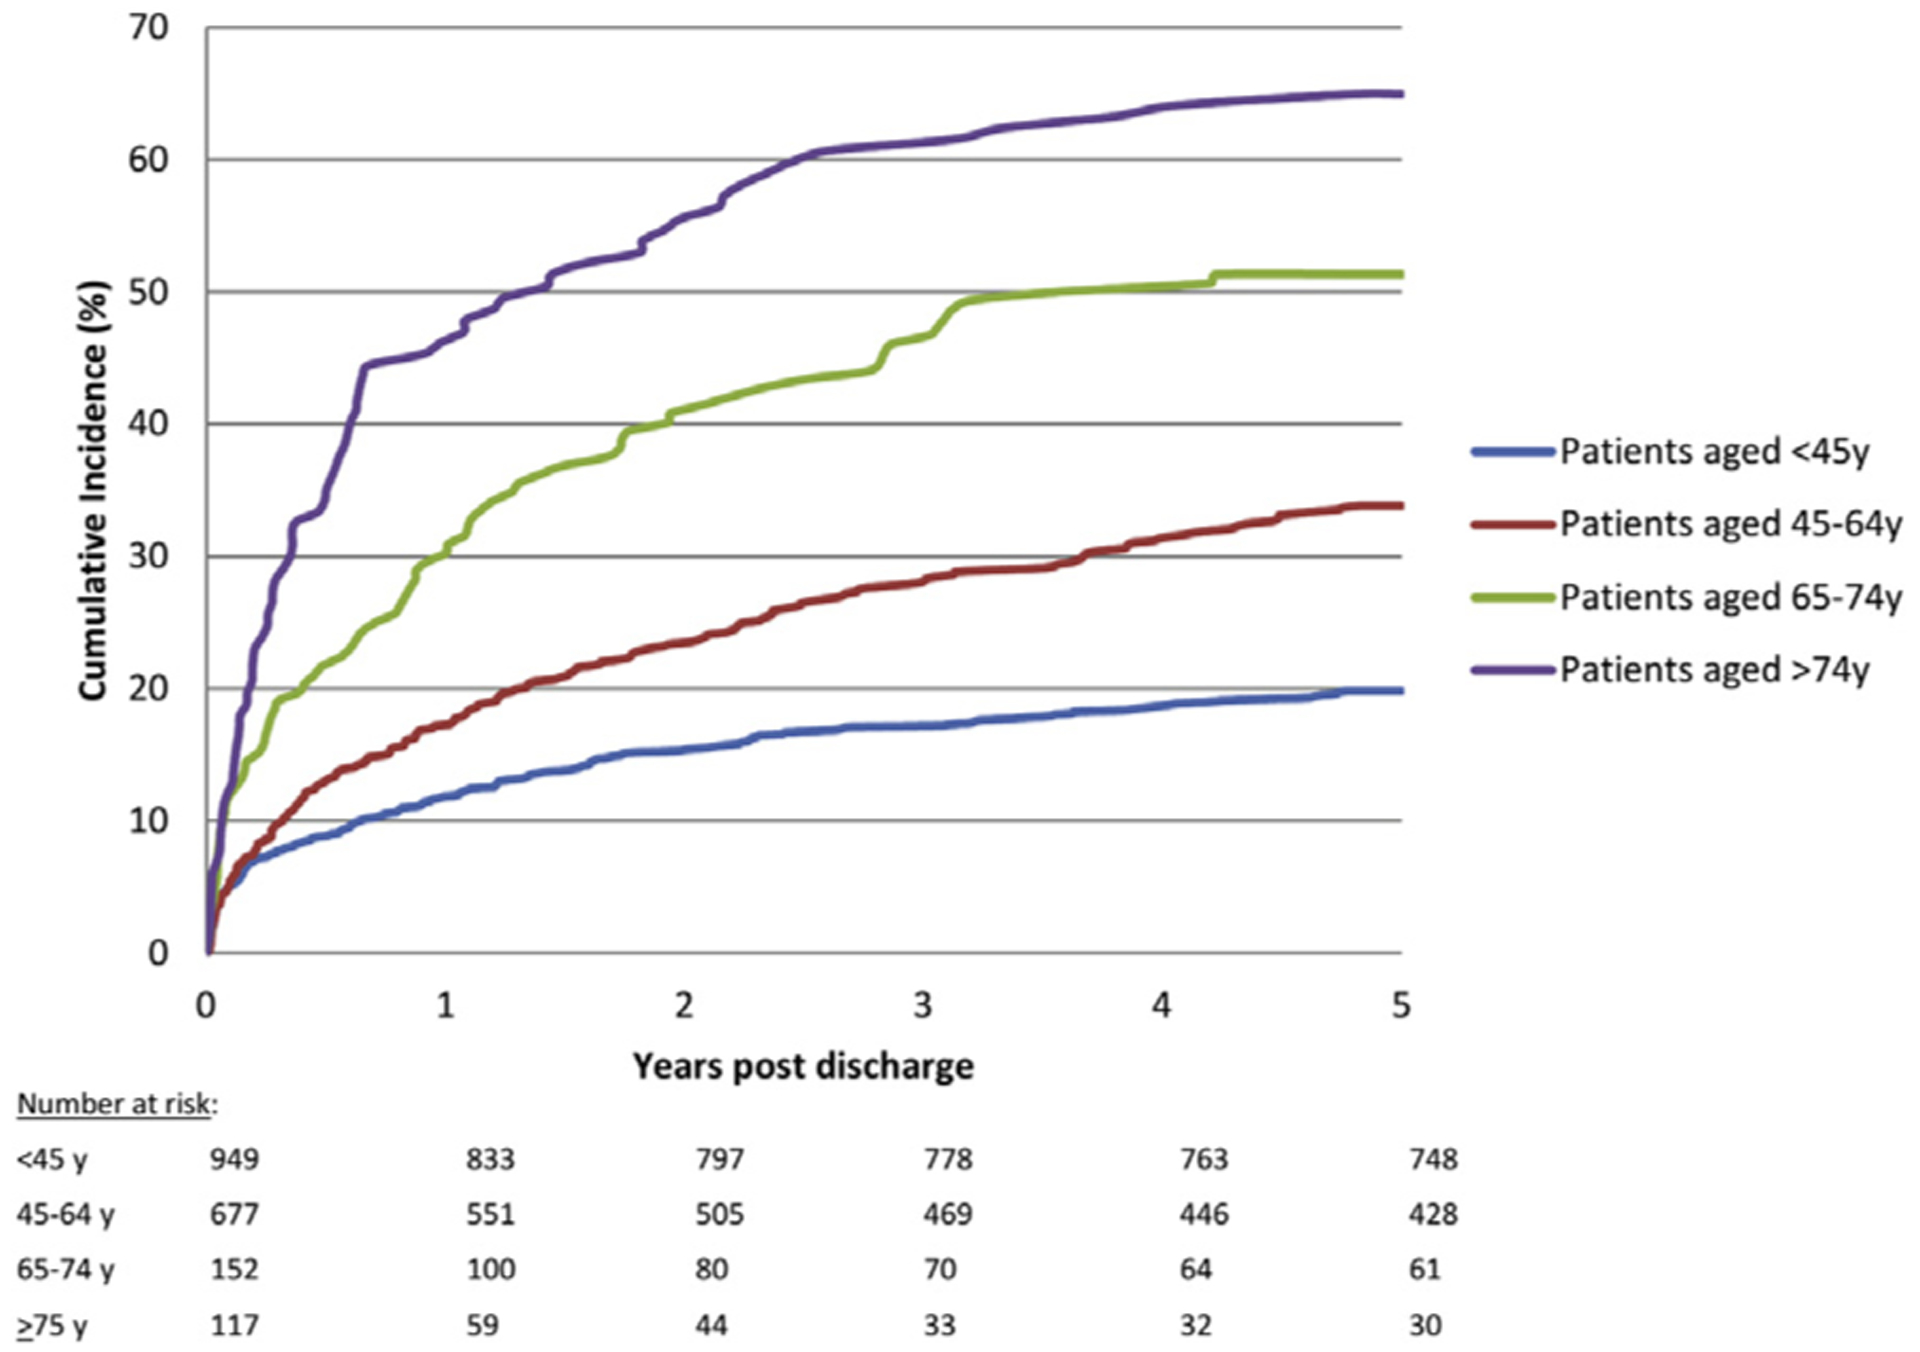
Cumulative incidence of readmission during follow-up by age group.
Fig 3.
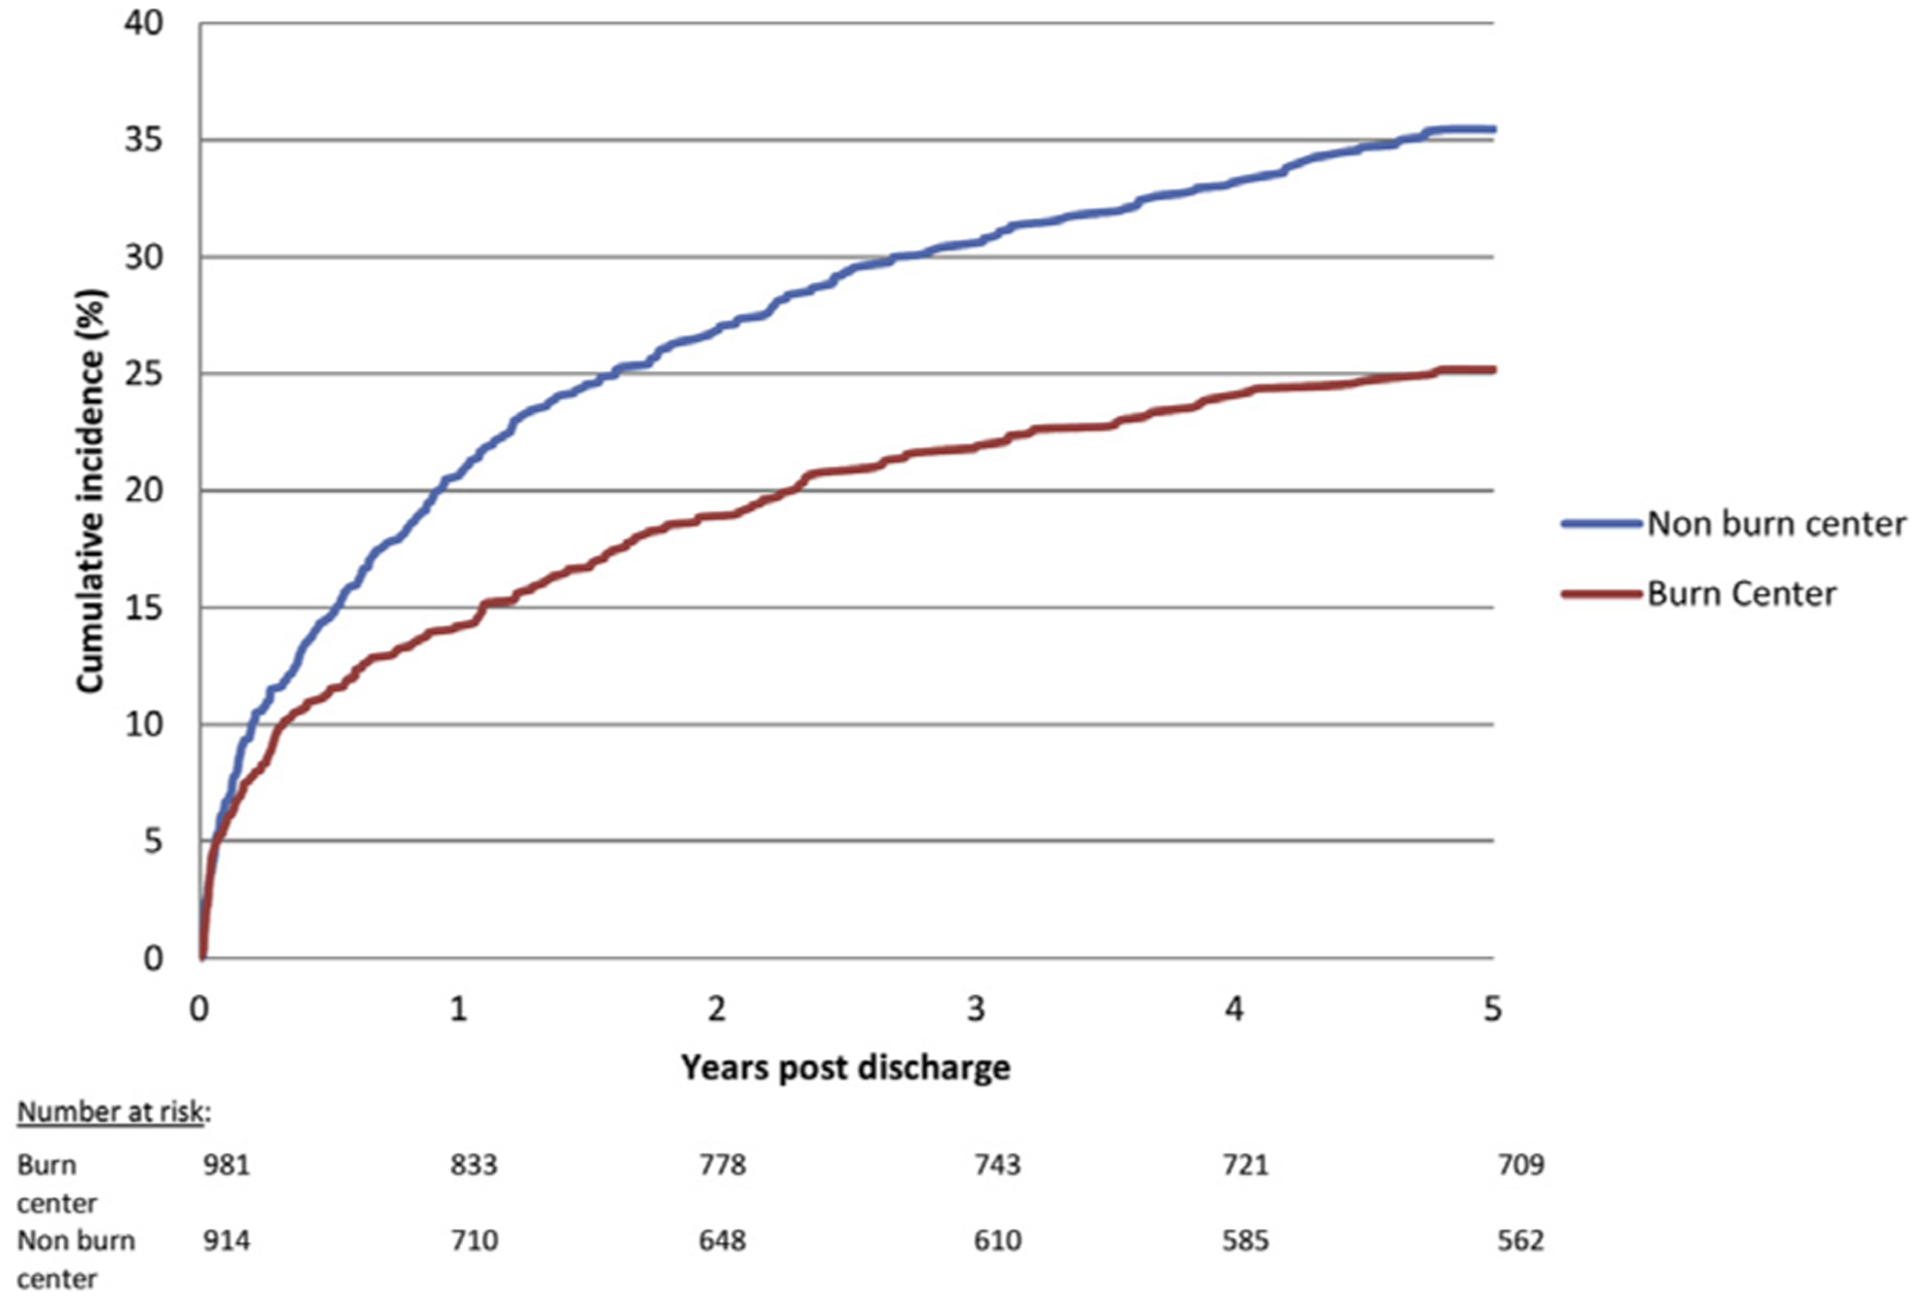
Cumulative incidence of readmission by location of index burn care.
Consistent with ED visits, traumatic injury was also the leading cause of unplanned readmissions (16%) (Table II). The other most common causes were cardiovascular, respiratory, and gastrointestinal disease (Table II). Among the readmissions attributed to injury, 29% were burn-related. Mortality at 5 years was 10%; most patients had both an ED visit (86%) and readmission (72%) prior to death.
After adjustment for patient and injury characteristics, patients treated at a burn center experienced significantly fewer ED visits (relative risk 0.61, 95% confidence interval [CI], 0.52–0.72) than patients treated at non-burn centers (Table III). Factors associated with a greater number of ED visits included discharge to a rehabilitation or long-term care facility after the index burn admission and younger age. Patients with the highest level of preinjury comorbidity had a 9-fold higher rate of ED visits than those with minimal comorbidity. No injury-specific factors were significantly associated with ED visits.
Table III.
Factors associated with emergency department visits
| Adjusted rate ratio (95% CI*) | |
|---|---|
| Index burn center care | 0.61 (0.52–0.72) |
| Age group | |
| 16–29 y | Ref |
| 30–44 y | 0.67 (0.58–0.76) |
| 45–59 y | 0.70 (0.58–0.83) |
| 60–75 y | 0.54 (0.43–0.68) |
| ≥75 y | 0.55 (0.38–0.81) |
| Female | 0.96 (0.81–1.13) |
| Comorbidity band† | |
| 1 (Lowest) | Ref |
| 2 | 1.55 (1.11–2.17) |
| 3 | 2.03 (1.51–2.72) |
| 4 | 4.08 (3.00–5.56) |
| 5 (Highest) | 9.17 (6.53–12.89) |
| % Total body surface area burn | |
| <20 | Ref |
| 20–39 | 0.86 (0.76–0.98) |
| 40–59 | 1.16 (0.79–1.70) |
| ≥60 | 0.89 (0.71–1.12) |
| Inhalation injury | 0.97 (0.83–1.14) |
| Burn mechanism | |
| Flame | Ref |
| Contact | 0.78 (0.70–0.88) |
| Electrical | 0.72 (0.52–1.00) |
| Index discharge disposition | |
| Home | Ref |
| Home with support | 0.96 (0.81–1.15) |
| Rehabilitation or long-term care | 1.28 (1.05–1.55) |
| Other inpatient | 1.21 (0.91–1.60) |
| Other | 1.32 (0.84–2.08) |
Confidence interval.
Measure of comorbidity burden based on healthcare utilization in 2 years prior to injury.
Similarly, burn center patients were 23% less likely to experience an unplanned readmission during follow-up (hazard ratio [HR] 0.77, 95% CI, 0.65–0.92) compared with those treated at non-burn centers (Table IV). Factors associated with an increased risk of readmission were increasing age, lower socioeconomic status, and discharge to a rehabilitation or long-term care facility after the index admission (Table IV). Patients with the highest level of preinjury comorbidity had a 4-fold greater risk of readmission during follow-up compared with patients with minimal comorbidity, as illustrated in Fig 4.
Table IV.
Factors associated with unplanned readmissions
| Subdistribution hazard ratio (95% CI) * | Hazard ratio (95% CI*)† | |
|---|---|---|
| Index burn center care | 0.77 (0.65–0.92) | 0.76 (0.64–0.90) |
| Female sex | 0.99 (0.82–1.19) | 0.98 (081–1.18) |
| Age group | ||
| 16–44y | Ref | Ref |
| 45–64 y | 1.39 (1.14–1.70) | 1.40 (1.14–1.71) |
| 65–74 y | 1.92 (1.43–2.59) | 2.07 (1.54–2.77) |
| ≥75 y | 2.67 (1.95–3.65) | 2.82 (2.06–3.85) |
| Income quintile | ||
| 1 (Lowest) | Ref | Ref |
| 2 | 1.20 (0.95–1.51) | 1.18 (0.94–1.48) |
| 3 | 0.98 (0.76–1.26) | 0.94 (0.74–1.21) |
| 4 | 0.83 (0.64–1.08) | 0.81 (0.62–1.05) |
| 5 (Highest) | 0.71 (0.53–0.96) | 0.72 (0.53–0.96) |
| Comorbidity band‡ | ||
| 1 (Lowest) | Ref | Ref |
| 2 | 1.60 (0.89–2.85) | 1.62 (0.91–2.90) |
| 3 | 1.84 (1.09–3.10) | 1.87 (1.11–3.15) |
| 4 | 2.50 (1.46–4.28) | 2.55 (1.49–4.36) |
| 5 (Highest) | 4.71 (2.75–8.08) | 5.10 (2.97–8.73) |
| % TBSA burn (per % increase) | 1.00 (0.99–1.01) | 1.00 (0.99–1.01) |
| Index discharge disposition | ||
| Home | Ref | Ref |
| Home with support | 0.95 (0.77–1.16) | 0.94 (0.77–1.15) |
| Rehabilitation or long-term care | 1.74 (1.37–2.22) | 1.77 (1.39–2.25) |
| Other inpatient | 1.23 (0.79–1.91) | 1.39 (0.91–2.12) |
| Other | 1.47 (0.96–2.24) | 1.43 (0.93–2.19) |
Derived from Fine and Gray competing risk regression model.
Derived from Cox Proportional Hazards model.
Measure of comorbidity burden based on health care utilization in 2 years prior to injury.
Fig 4.
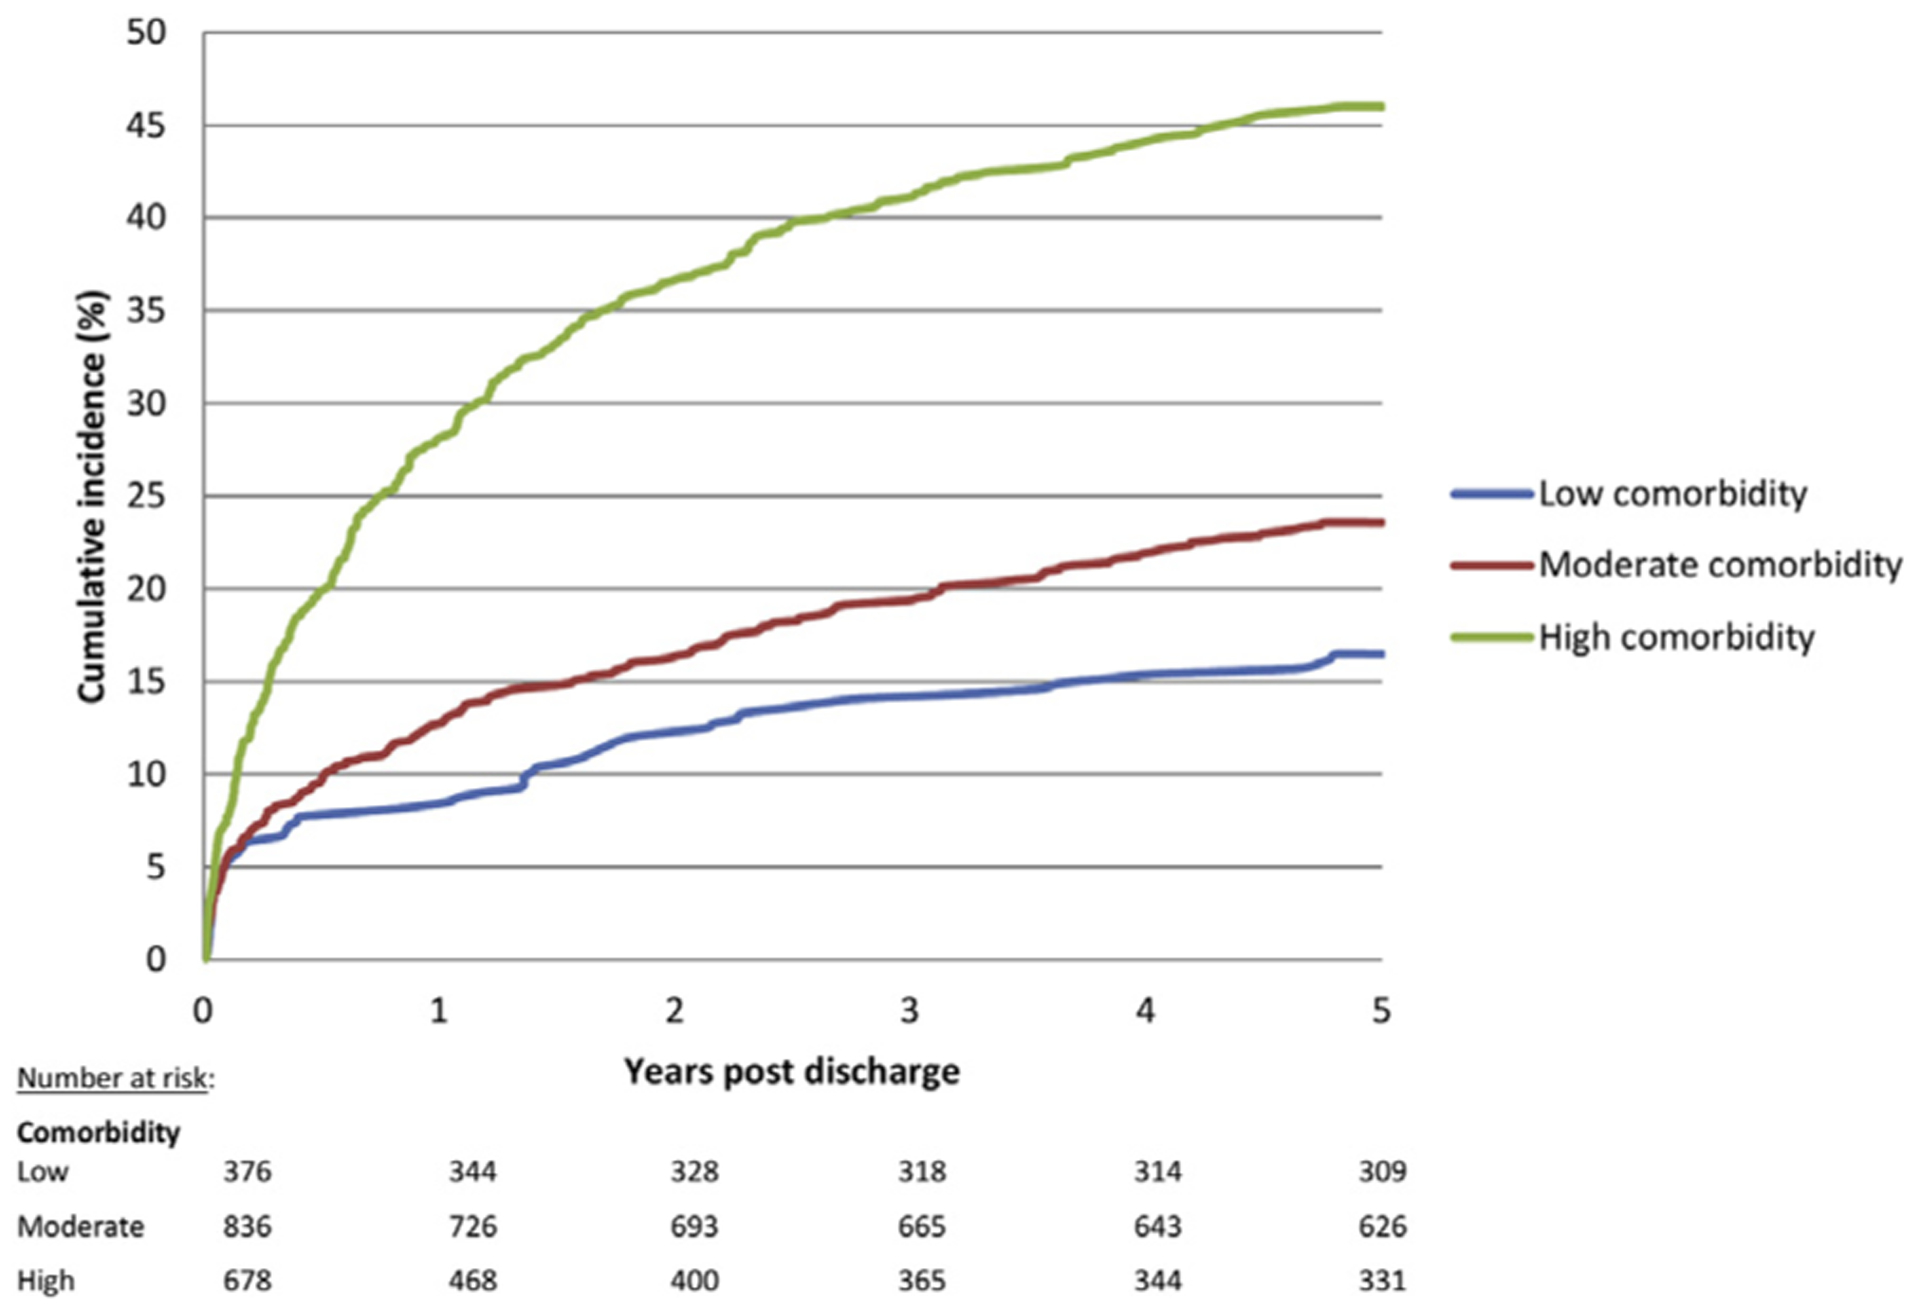
Cumulative incidence of readmission by preinjury comorbidity.
DISCUSSION
In this population-based, longitudinal cohort study of burn survivors, we found that 68% of patients had an ED visit and 30% experienced an unplanned readmission after their burn admission. Traumatic injuries, mental illness, and respiratory disease were common causes for both ED visits and readmissions, while burn-related ED visits and readmissions were uncommon beyond 30 days after discharge. The infrequency of burn-related visits beyond 30 days after discharge suggests a low rate of burn recidivism. Patients who received burn care in a burn center experienced 40% fewer ED visits and were almost 25% less likely to have an unplanned readmission compared to patients treated outside of burn centers.
Few studies have examined the health care utilization of burn survivors after discharge, reflecting the challenges associated with capturing these events and after patients long-term. As a result, most studies, in both burn and other cohorts, have focused on reporting 30-day readmission rates.9,17–19 Health administrative databases offer an opportunity for longitudinal examination of health care utilization and are increasingly used for this purpose.20–22 Using one such database, Mandell et al followed burn survivors for 2 years and found that principal causes of readmission were rehabilitation, sepsis, and mental illness and that burn-related readmissions were uncommon beyond 30 days.23 Forty-five percent of patients in their study experienced a readmission, compared with 30% of patients in our study. Two differences in study design likely explain this difference: (1) we included all adult patients, while Mandell et al included only those ≥45 years, representing an older cohort who might be expected to have higher hospitalization rates related to chronic illness24; and (2) we included only unplanned readmissions, while Mandell et al included all types of readmission, including planned reconstruction, likely accounting for the observed differences in admission reasons—chiefly, that rehabilitation was the principal reason for readmission in their study. Several population-based studies using administrative data in Australia, with ≥15 years follow-up, have demonstrated high rates of readmissions after burn injury, related to cardiovascular, infectious, and gastrointestinal diseases.21,22,25 This group identified significantly increased readmissions for each of these diseases compared to an age- and sex-matched uninjured cohort, consistent with our findings that medical readmissions are common over the longer term after discharge.
The key strength of our study is the utilization of administrative data, which offers the ability to follow patients longitudinally after discharge with minimal loss to follow-up. Patients are lost to follow-up only if they become ineligible for health coverage or move out of the province; census data estimates that <5% of Ontarians moved out of the province during a 5-year period.26 Furthermore, Canada’s single-payer health care system facilitates capture of all health care visits for all insured persons. As a result, our data represent near complete follow-up during the 5 years after burn injury. Furthermore, the availability of data regarding timing and causes of death allowed us to account for the competing risk of death in the readmission analyses; failure to account for this competing risk can result in overestimation of the hazard ratio.27
Our findings are limited by the lack of an uninjured comparator group; as a result, we are only able to report absolute, rather than relative rates of health care use. The use of administrative data limits our ability to understand the factors that contribute to a lower risk of emergency health services use among patients who received their care in a burn center. Furthermore, factors that might be important in risk of readmission or ED visits, such as functional status, home supports, and access to a family physician, are unavailable in administrative data. We have not captured whether or not patients had outpatient visits prior to their ED visit and/or readmission, which limits our ability to determine whether or not events may have been preventable. We are also unable to evaluate patients’ specific preinjury health care utilization, beyond accounting for their comorbidity. This limits our ability to understand how health care utilization changes after burn injury. For example, while injury-related health care utilization was common among burn survivors, we are unable to characterize their preburn rates of injury. Similarly, while we have accounted for preinjury comorbidity in our analyses, we have not specifically accounted for the type of comorbidity present; as a result, we are unable to determine whether visits related to medical illness represent the development of new disease after injury. Ultimately, we think these unmeasured factors are unlikely to be differentially distributed at burn versus non-burn centers, and as such, are unlikely to bias our observation that burn center care was associated with reduced rates of ED visits and readmissions.
Many quality improvement programs have identified the transition from inpatient to outpatient care as a target for improving outcomes, given the costs associated with avoidable ED visits and readmissions.28 However, evidence regarding the effectiveness of interventions aimed at reducing readmissions and ED visits is mixed, and no single intervention has consistently been demonstrated to be effective.29–31 In contrast, multifaceted interventions have been successful in reducing readmissions among medical patients.29,32,33 Our data suggest that perhaps these care transitions occur more successfully in burn centers, as evidenced by reduced rates of acute health care utilization after discharge. Though most postburn health care utilization in our study was not directly burn-related, our observation that patients treated in a burn center had lower rates of acute health care use after discharge suggests that at least some of these visits might be preventable. This might reflect a combination of early discharge planning, patient education, multidisciplinary input in disposition decisions (eg, social work, nursing, physiotherapy), and direct access to a burn nurse by telephone or to same or next-day clinic. However, we are unable to compare follow-up practices between burn and non-burn centers. The specific processes of care that contribute to successful care transitions for burn survivors remain to be characterized; this work would facilitate identification of the most cost-effective processes of care, and offer future targets for quality improvement programs.
Transitions to outpatient care should be focused on helping patients achieve the best possible level of health and functioning after burn. In our study, more than one-third of patients had a high comorbidity burden at the time of their injury, and readmissions for medical diseases were common. Future investigation should focus on identifying whether opportunities for primary or secondary health prevention measures might exist during the index hospitalization or transition to outpatient care that might ultimately improve long-term health. For example, the index burn admission might represent an extended opportunity for patients to be connected with primary care providers or specialists, or to have their home medications reassessed. The high rate of ED use in our study suggests that some patients might be using the ED for primary care; 11% of patients had 5 or more ED visits per year. Prior work has identified that 4 or more visits per year is the most common threshold to consider patients “high users.”34 Therefore, efforts to ensure patients have a primary care provider at the time of discharge are warranted. The high rate of injury-related ED visits and readmissions after burn injury suggests an opportunity for targeted injury prevention efforts. Given that mental illness is both a risk factor for unintentional injury and injury recidivism35 and a common cause of visits after burn injury, the role of mental health care in injury prevention efforts should not be overlooked.
Ultimately, our data expand our knowledge of the longer-term health care needs of burn survivors. These patients require longitudinal follow-up for potential burn sequelae, such as wound contractures, but also require ongoing management of chronic diseases, including mental illness and prevention of subsequent trauma-related injury. Our findings suggest that burn centers may be best positioned to help transition patients to this complex and multidisciplinary follow-up care. Ultimately, the role of burn centers in the delivery of care after the acute phase remains to be characterized; nonetheless, our data suggest that further efforts regionalize burn care might reduce postburn acute health care utilization.
In conclusion, burn survivors have high rates of post-acute care health utilization that persist up to 5 years after discharge. Patients treated in burn centers have a significantly reduced rate of unplanned health care utilization. These data demonstrate the potential benefits of burn center care, and can inform the delivery of post-acute health service delivery for burn survivors.
Acknowledgments
Dr Nathens is supported by the DeSouza Chair in Trauma Research. Dr Jeschke is supported by the Canadian Institutes of Health Research #123336 and Canada Foundation for Innovation Leader’s Opportunity Fund Project #25407, NIH RO1 GM087285-01. Dr Fowler was supported by a personnel award from the Heart and Stroke Foundation, Ontario Provincial Office. Dr Karanicolas is supported by a CIHR New Investigator Award.
The opinions, results, and conclusions reported in this article are those of the authors and are independent from the funding sources. No endorsement by Institute for Clinical and Evaluative Sciences or the Ontario Ministry of Health and Long-Term Care is intended or should be inferred. Parts of this material are based on data and information compiled and provided by the Canadian Institute for Health Information (CIHI). However, the analyses, conclusions, opinions, and statements expressed herein are those of the author, and not necessarily those of CIHI.
Footnotes
This work was presented in part at the 49th Annual Meeting of the American Burn Association, March 20–24, 2017, Boston, MA.
REFERENCES
- 1.American Burn Association. 2016 National Burn Repository: report of data from 2006–2015; 2016. Available at: http://ameriburn.org/education/publications/.
- 2.Hussain A, Dunn K. Burn related mortality in greater Manchester: 11-year review of Regional Coronial Department Data. Burns 2015;41:225–34. [DOI] [PubMed] [Google Scholar]
- 3.Roberts G, Lloyd M, Parker M, Martin R, Philp B, Shelley O, et al. The Baux score is dead. Long live the Baux score: a 27-year retrospective cohort study of mortality at a regional burns service. J Trauma Acute Care Surg 2012;72:251–6. [DOI] [PubMed] [Google Scholar]
- 4.McGwin G, Cross JM, Ford JW, Rue LW. Long-term trends in mortality according to age among adult burn patients. J Burn Care Rehabil 2003;24:21–5. [DOI] [PubMed] [Google Scholar]
- 5.Zonies D, Mack C, Kramer B, Rivara F, Klein M. Verified centers, nonverified centers, or other facilities: a national analysis of burn patient treatment location. J Am Coll Surg 2010;210:299–305. [DOI] [PMC free article] [PubMed] [Google Scholar]
- 6.Yurt RW, Bessey PQ. The development of a regional system for care of the burn-injured patients. Surg Infect (Larchmt) 2009;10:441–5. [DOI] [PubMed] [Google Scholar]
- 7.Hranjec T, Turrentine FE, Stukenborg G, Young JS, Sawyer RG, Calland JF. Burn-center quality improvement: are burn outcomes dependent on admitting facilities and is there a volume-outcome “sweet-spot”? Am Surg 2012;78: 559–66. [PMC free article] [PubMed] [Google Scholar]
- 8.Light TD, Latenser BA, Kealey GP, Wibbenmeyer LA, Rosenthal GE, Sarrazin MV. The effect of burn center and burn center volume on the mortality of burned adults—an analysis of the data in the National Burn Repository. J Burn Care Res 2009;30:776–82. [DOI] [PubMed] [Google Scholar]
- 9.Vashi AA, Fox JP, Carr BG, D’Onofrio G, Pines JM, Ross JS, et al. Use of hospital-based acute care among patients recently discharged from the hospital. JAMA 2013;309: 364–71. [DOI] [PMC free article] [PubMed] [Google Scholar]
- 10.Mason SA, Nathens AB, Byrne JP, Fowler R, Gonzalez A, Karanicolas PJ, et al. The accuracy of burn diagnosis codes in health administrative data: a validation study. Burns 2017; 43:258–64. [DOI] [PMC free article] [PubMed] [Google Scholar]
- 11.American College of Surgeons Committee on Trauma. Guidelines for trauma centers caring for burn patients In: Rotundo MF, Cribari C, Smith RS, editors. Resources for optimal care of the injured patient. Chicago, IL: American College of Surgeons; 2014. p. 100–6. [Google Scholar]
- 12.Mason S, Gonzalez A, Nathens A, Jeschke MG. Temporal trends in mortality and regionalization of burn care: a population-based analysis. J Burn Care Res 2016;37:S67–300. [Google Scholar]
- 13.Austin P, van Walraven C, Wodchis W, Newman A, Anderson G. Using the Johns Hopkins Aggregated Diagnosis Groups (ADGs) to predict mortality in a general adult population cohort in Ontario, Canada. Med Care 2011;49:932–9. [DOI] [PMC free article] [PubMed] [Google Scholar]
- 14.Kralj B. Measuring “rurality” for purposes of health-care planning: an empirical measure for Ontario. Ont Med Rev 2000;67:33–52. [Google Scholar]
- 15.Pintilie M An introduction to competing risks analysis. (English Ed). Rev Esp Cardiol 2011;64:599–605. [DOI] [PubMed] [Google Scholar]
- 16.Lau B Competing risk regression models for epidemiologic data. Am J Epidemiol 2009;170:244–56. [DOI] [PMC free article] [PubMed] [Google Scholar]
- 17.Saab D, Nisenbaum R, Dhalla I, Hwang SW. Hospital readmissions in a community-based sample of homeless adults: a matched-cohort study. J Gen Intern Med 2016;31:1011–8. [DOI] [PMC free article] [PubMed] [Google Scholar]
- 18.Silver SA, Harel Z, McArthur E, Nash DM, Acedillo R, Kitchlu A, et al. 30-Day readmissions after an acute kidney injury hospitalization. Am J Med 2017;130:163–172.e4. [DOI] [PubMed] [Google Scholar]
- 19.van Walraven C, Austin PC, Forster AJ. Urgent readmission rates can be used to infer differences in avoidable readmission rates between hospitals. J Clin Epidemiol 2012;65: 1124–30. [DOI] [PubMed] [Google Scholar]
- 20.Hill AD, Fowler RA, Pinto R, Herridge MS, Cuthbertson BH, Scales DC. Long-term outcomes and healthcare utilization following critical illness—a population-based study. Crit Care 2016;20:76. [DOI] [PMC free article] [PubMed] [Google Scholar]
- 21.Duke JM, Randall SM, Wood FM, Boyd JH, Fear MW. Burns and long-term infectious disease morbidity: a population-based study. Burns 2017;43:273–81. [DOI] [PubMed] [Google Scholar]
- 22.Duke JM, Randall SM, Fear MW, Boyd JH, Rea S, Wood FM. Understanding the long-term impacts of burn on the cardiovascular system. Burns 2016;42:366–74. [DOI] [PubMed] [Google Scholar]
- 23.Mandell SP, Pham T, Klein MB. Repeat hospitalization and mortality in older adult burn patients. J Burn Care Res 2013;34:e36–41. [DOI] [PubMed] [Google Scholar]
- 24.Jencks SF, Williams MV, Coleman EA. Rehospitalizations among patients in the Medicare fee-for-service program. N Engl J Med 2009;360:1418–28. [DOI] [PubMed] [Google Scholar]
- 25.Stevenson AW, Randall SM, Boyd JH, Wood FM, Fear MW, Duke JM. Burn leads to long-term elevated admissions to hospital for gastrointestinal disease in a West Australian population based study. Burns 2016;43:665–73. [DOI] [PubMed] [Google Scholar]
- 26.Population 5 years and over by mobility status, by province and territory (2006 Census) (Newfoundland and Labrador, Prince Edward Island, Nova Scotia). Statistics Canada; 2006. Available at: http://www.statcan.gc.ca/tables-tableaux/sum-som/l01/cst01/demo56a-eng.htm. [Google Scholar]
- 27.Austin PC, Lee DS, Fine JP. Introduction to the analysis of survival data in the presence of competing risks. Circulation 2016;133:601–9. [DOI] [PMC free article] [PubMed] [Google Scholar]
- 28.Li J, Williams MV. Care transitions: it’s the how, not just the what. J Gen Intern Med 2015;30:539–40. [DOI] [PMC free article] [PubMed] [Google Scholar]
- 29.Hansen LO, Young RS, Hinami K, Leung A, Williams MV. Interventions to reduce 30-day rehospitalization: a systematic review. Ann Intern Med 2011;155:520. [DOI] [PubMed] [Google Scholar]
- 30.Field TS, Ogarek J, Garber L, Reed G, Gurwitz JH. Association of early post-discharge follow-up by a primary care physician and 30-day rehospitalization among older adults. J Gen Intern Med 2015;30:565–71. [DOI] [PMC free article] [PubMed] [Google Scholar]
- 31.Shen E, Koyama SY, Huynh DN, Watson HL, Mittman B, Kanter MH, et al. Association of a dedicated post-hospital discharge follow-up visit and 30-day readmission risk in a medicare advantage population. JAMA Intern Med 2017;177:132. [DOI] [PubMed] [Google Scholar]
- 32.Rennke S, Nguyen OK, Shoeb MH, Magan Y, Wachter RM, Ranji SR. Hospital-initiated transitional care interventions as a patient safety strategy. Ann Intern Med 2013;158(5 Part 2):433. [DOI] [PubMed] [Google Scholar]
- 33.Leppin AL, Gionfriddo MR, Kessler M, Brito JP, Mair FS, Gallacher K, et al. Preventing 30-day hospital readmissions. JAMA Intern Med 2014;174:1095. [DOI] [PMC free article] [PubMed] [Google Scholar]
- 34.LaCalle E, Rabin E. Frequent users of emergency departments: the myths, the data, and the policy implications. Ann Emerg Med 2010;56:42–8. [DOI] [PubMed] [Google Scholar]
- 35.Wan JJ, Morabito DJ, Khaw L, Knudson MM, Dicker RA. Mental illness as an independent risk factor for unintentional injury and injury recidivism. J Trauma 2006;61:1299–304. [DOI] [PubMed] [Google Scholar]